Embed Size (px)
Citation preview

1
INVESTOR PRESENTATION – JUNE 2015
Disclaimer
No representation or warranty, express or implied is made as to, and no reliance should be placed on the fairness, accuracy,
completeness or correctness of such information or opinions contained herein. The information contained in this presentation
is only current as of its date. Certain statements made in this presentation may not be based on historical information or
facts and may be “forward looking statements”, including those relating to the bank’s general business plan’s and strategy, its
future financial condition and growth prospects and future developments in the industry and regulatory environment. Actual
results may differ materially from these forward-looking statements due to a number of factors, including future changes or
2
results may differ materially from these forward-looking statements due to a number of factors, including future changes or
developments in the bank’s business, its competitive environment and political, economic, legal and social conditions in India.
This communication is for general information purpose only, without regard to specific objectives, financial situations and
needs of any particular person. This presentation does not constitute an offer or invitation to purchase or subscribe for any
shares in the bank and neither any part of it shall form the basis of or be relied upon in connection with any contract or
commitment whatsoever. The bank may alter, modify or otherwise change in any manner the content of this presentation,
without obligation to notify any person of such revisions or changes. This presentation should not be copied and/or
disseminated in any manner.

Table of contents
1. Overview … 04 - 06
2. Performance Highlights … 07 - 08
3. Branch Network … 09 - 10
3
4. Ownership Pattern … 11 - 13
5. Management … 14 - 17
6. Financial Performance & Business Profile … 18 - 38

4
1. Overview

City Union Bank – A specilized banking model aligned to Target Segment – SME / MSME
SME/ MSME focus
Prudent Risk Management
� SME/MSME specialized business model focusing on large untapped
� Segment consistently delivering higher yields
� Superior client servicing leading to client retention and low business
acquisition costs
� SME exposures' result in granular asset profile
� Granular deposit base with high retention rates result in stable liability
profile
� SME/MSE Loans result in lower NPA as they are:
� Additionally collateralised by residential property, and personal
guarantee etc
5 year CAGR of 20%+
5
Management
Invested in Robust Infrastructure
guarantee etc
� Predominantly single banker relationships with minimal
exposure to consortium / multiple banking arrangements /
infrastructure lendings
� Comprehensive employee training and recruitment infrastructure
through staff training college
� All branches and 100% business under CBS from TCS
Consistent Return with SuperiorROA, ROE
Purely retail Liability Franchise
� No Certificate of Deposit
� No reliance on Corporate bulk deposits

Key milestones
2009
1965
Amalgamation of ‘The CityForward Bank Limited’ and‘The Union Bank Limited’ with
1998
Initial Public Offering (IPO);Listing Bank’s shares on theBSE, NSE & MSE
2007
Preferential allotment for equityshares strengthening bank’scapital funds
Rights Issue @ 1 : 4 – to rewardthe existing shareholders andemployees under “EmployeeReservation Scheme”
2012
2014
Raised INR Rs.3500 Mn in Equitycapital through QIP route
2014
Celebrated 110th YearFoundation Day in Dec ’14
6
Took over Common Wealth Bank Limited
1957
Rights issue @ 1 : 4 – to reward the existing shareholders
2009
1904
Incorporation of the Bank
‘The Union Bank Limited’ withour Bank
Obtained licenses to act as a agent forprocuring life insurance & generalinsurance business
2003
1945
Scheduled bank since 22.03.1945

7
3. Q1 FY 2016 – PEFORMANCE HIGHLIGHTS

Q1 FY 2016 Performance – A snapshot
� Deposits increased by 12% from Rs.224 Bn to Rs.251 Bn Y-o-Y
� Advances registered a growth of 11% from Rs.162 Bn to Rs.179 Bn Y-o-Y
� Gross Profit registered a growth of 14% from Rs.1727 Mn to Rs.1972 Mn Y-o-Y
� Net Profit increased by 12% from Rs.995 Mn to Rs.1116 Mn Y-o-Y
� Profitability and efficiency ratios – at par with the best in industry:
� Return on Assets - 1.57%
� Net Interest Margin - 3.59%
8
� Net Interest Margin - 3.59%
� Return on Equity - 16.43%
� Earnings per share - Rs.1.87
� Gross NPA – 2.01% and Net NPA – 1.32%
� Provision Coverage Ratio – 61%
� CRAR – 15.72% (Basel III) of which core CRAR – 15.30%

9
4. Branch Network

State No. of Branches
% of
Deposits
% of
Advances
% of Business
Tamilnadu 324 77 68 73
Seemandhra 36 3 8 5
Telengana 20 3 5 4
Karnataka 26 5 5 5
Maharashtra 17 4 4 4
Kerala 15 2 2 2
Gujarat 9 1 3 2
Strong presence in the South
As of Jun 2015 - 475 branches. 421 branches are located in South India out of which 324 in Tamil Nadu
4
6
3
3
3
10
Gujarat 9 1 3 2
Others 28 5 5 5
Total 475
3626
17
15
9
2
2
1
1
75
122
186
92
16% 26% 39% 19%0
20
40
60
80
100
120
140
160
180
Metro Urban Semiurban Rural
324
Telungana
20
11
5. Ownership Pattern
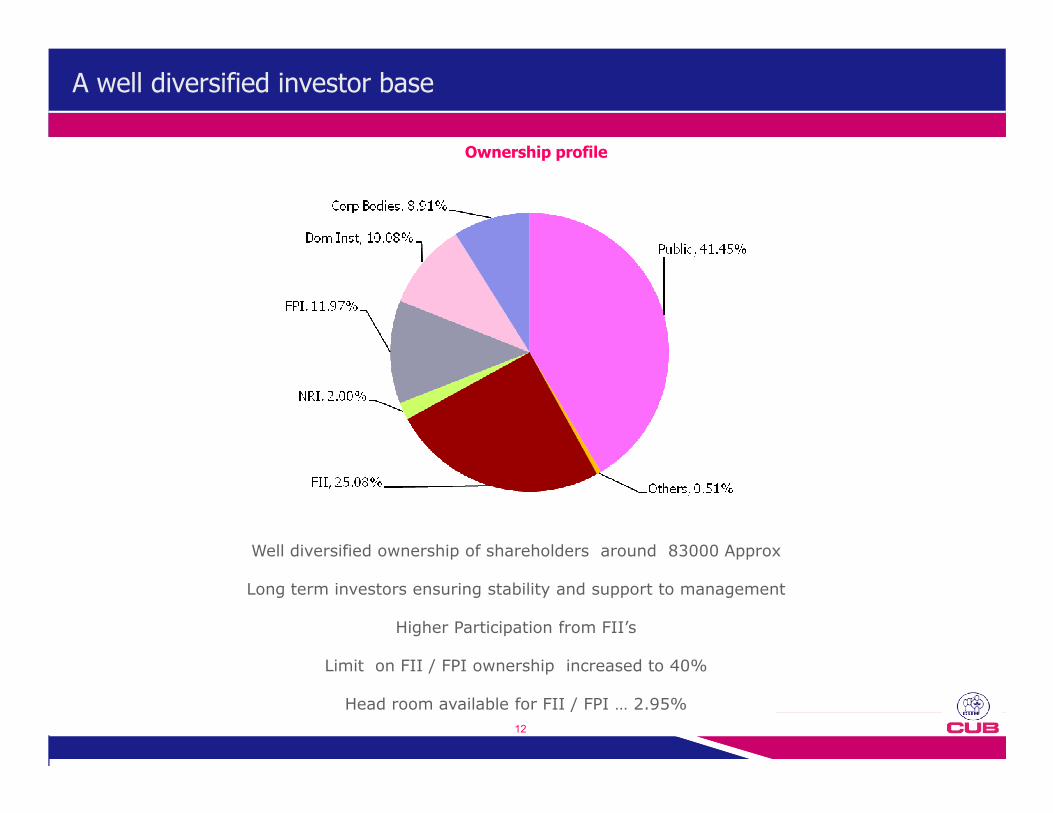
A well diversified investor base
Ownership profile
12
Well diversified ownership of shareholders around 83000 Approx
Long term investors ensuring stability and support to management
Higher Participation from FII’s
Limit on FII / FPI ownership increased to 40%
Head room available for FII / FPI … 2.95%

A well diversified investor base
Major Institutional Shareholders as on 30th June 2015
Shareholders % of holding
Lavender Investments Ltd (Chrys Capital) 3.96
GKFF Ventures (Argonaut Ventures) 3.94
Smallcap World Fund INC 3.32
NT Asian Discovery Master Fund 2.87
Equinox Partners L P 2.62
Life Insurance Corporation of India 2.45
13
Life Insurance Corporation of India 2.45
Emblem FII 1.59
Acacia Partners 1.47
Bank Muscat India Fund 1.25
Somerset Emerging Markets Small Cap Fund 1.23
Faering Capital India Evolving Fund 1.12
Wasatch Core Growth Fund 1.12

14
6. Management

Transparent ‘Corporate Governance’ practices
Board consists of 6 Independent Directors and 4 Non-Independent Directors
Code of conduct for directors and senior management put in place
Disclosure norms strictly adhered to
Various sub-committees of Board functions to oversee the operations of the Bank
15
KYC / AML norms strictly complied with.
We have eminent personalities on our Board;
� Chairman – Veteran Banker with 40 years of experience with City Union Bank
� 1 Chartered Accountant - Retd. CFO from Tata Consultancy Services
� 1 Former retired Chief of Banking Operations & Development department, RBI & IRDA member
� 1 Retired High Court Judge
� 1 Professor of IIT, Chennai
� 1 leading Industrialist of Dairy & allied products from South India
� 1 Advocate in Banking law & Environmental Activist
� 1 Career Banker with 4 decades of banking experience
� 1 Chartered Accountant & First woman director of the Bank

A well experienced and strong Board (1/2)
Name Profile
Mr. S.Balasubramanian,
Chairman
(Non-Executive)
Mr. S. Balasubramanian is serving as Non-Executive Chairman of the Bank from May 2011 and
has 40 year experience in the Banking industry. He holds a Masters degree in Mathematics,
CAIIB and PGDFM. He joined City Union Bank in 1971 as a probationary officer and was
associated with the Bank in various capacities. With his sound track record he rose to the
position of CEO of the Bank in 2005 he was appointed as the CEO of our Bank and thereafter, in
2009 he was appointed as the Managing Director and CEO.
Dr. N. Kamakodi,
MD & CEO
Dr. N. Kamakodi is serving as MD & CEO of the Bank from May 2011. He holds the Degrees -
Bachelor of Technology in Chemical Engineering, MBA from the Chinese University of Hong
Kong, Ph.D. and CAIIB. He joined the Bank as DGM in the year 2003 and was elevated as
GM in 2005 and later as Executive Director in 2006. He not only possesses an academic
background and but also has acquired hands on experience on the overall operations of the
Bank.
16
Bank.
Mr. R.G. Chandramogan,
Director
Mr. R.G. Chandramogan is the Chairman & Managing Director of Hatsun Agro Products Ltd, the
largest private dairy in the country. He is a well known industrialist in South India. He is a
former member in Screening Cum Implementation Group – Secondary Agriculture and a
member of Working Group on Animal Husbandary & Dairying, both committees constituted by
Planning Commission, Government of India.
Mr. T.K. Ramkumar,
Director
Mr. T.K. Ramkumar is one of the leading Lawyers in Chennai possessing special knowledge in
Banking law, Company law and Intellectual Property Rights. He is also an active
environmentalist.
Justice (Retd.)
S.R. Singaravelu,
Director
Mr. S.R. Singaravelu is a former Judge of High Court of Madras and High Court of Orissa. He
has a vast experience of 36 years in the Judiciary where he has held various positions.

A well experienced and strong Board (2/2)
Name Profile
Mr. C.R. Muralidharan,
Director
Mr. C.R. Muralidharan is having 40 years of vast experience in regulatory Banking who retired as
Chief General Manager, Dept of Banking Operations & Development, Reserve Bank of India. He
was also a whole time member of Insurance Regulatory and Development Authority (IRDA).
Dr.Veezhinathan Kamakoti,
Director
Dr. Veezhinathan Kamakoti is the youngest person to become a professor of one of the prestigious
Engineering Institutions of India namely I I T, Madras in the Department of Computer Science and
Engineering. He holds Bachelor of Engineering and Ph.D. in Computer Science. He is an expert in
Computer Science and Technology, his forte area being Information Technology related Secured
Systems Engineering and Security related software engineering.
Mr. S. Mahalingam is a well known person in Indian IT industry having 43 years of experience in
one of the leading IT company – Tata Consultancy Services Ltd (TCS). He retired as Chief Financial
17
Mr. S. Mahalingam,
Director
one of the leading IT company – Tata Consultancy Services Ltd (TCS). He retired as Chief Financial
Officer and Executive Director of TCS and was involved in many aspects of the company's
operation and growth and also played a key role in helping TCS become a $ 11.60 billion global
company with over 2,76,000 employees. He is a Hon’s graduate in Commerce and Fellow member
of Institute of Chartered Accountants of India. Besides our Bank, he is also on the Board of many
corporates of high repute in India.
Mr. R. Mohan,
Director
Mr. R. Mohan possesses 4 decades of vast experience in banking industry. He is a bachelor of
Science, Master of Business Administration and a CAIIB. Prior to joining the Board, he served as
Chief General Manager of our Bank. He is a member of our Board representing the majority sector
of Banking, Agriculture and Small Scale Industry.
Smt. Abarna Bhaskar,
Director
Smt. Abarna Bhaskar is a qualified Chartered Accountant by profession and the first woman
director of the Bank. She has served in senior positions with a Foreign Bank abroad and a large
private sector bank in India. She has practical experience in Banking, more particularly in the
finalization of bank accounts and is a practicing chartered accountant.

18
6. Financial Performance and Business Profile

Q1 FY 2016 Performance – A snapshot
HIGHLIGHTS FOR THE QUARTER ENDED 30th JUNE2015
� Deposits increased by 12% to Rs.251 Bn from Rs.224 Bn
� Advances increased by 11% from Rs.162 Bn to Rs.179 Bn
� Total Business grew by 12% from Rs.385 Bn to Rs.430 Bn
� CASA improved by 17% to Rs.47 Bn from Rs.41 Bn. % of CASA to
total deposits stood at 18.88%.
12%
Deposits
11%
Advances
17%
CASA
19
� Gross Profit increased by 14% to Rs.1972 Mn from Rs.1727 Mn
� Net Profit increased by 12% from Rs.995 Mn to Rs.1116 Mn
� Net NPA stood at 1.32%
� ROA stands at 1.57%
� ROE stands at 16.43%
� Net Interest Margin stands at 3.59%
� Cost to Income ratio 39.99% vs 41.94% in Q1 FY 2015
14%
Gross Profit
12%
Net Profit
Gross NPA Net NPA
2.01% 1.32%

FY 2014-15 Performance – A snapshot
HIGHLIGHTS FOR THE YEAR ENDED 31st MARCH 2015
� Deposits increased by 9% to Rs.241 Bn from Rs.220 Bn
� Advances increased by 11% from Rs.162 Bn to Rs.181 Bn
� Total Business grew by 10% from Rs.382 Bn to Rs.422 Bn
� CASA grew by 18% to Rs.46 Bn from Rs.39 Bn
� NII increased by 6% from Rs.7594 Mn to Rs.8074 Mn
9%
Deposits
11%
Advances
18%
CASA
20
� Gross Profit increased by 19% to Rs.6926 Mn from Rs.5810 Mn
� Net Profit increased by 14% from Rs.3471 Mn to Rs.3950 Mn
� Net NPA stood at 1.30%
� ROA stands at 1.49%
� ROE stands at 16.91%
� Net Interest Margin stands at 3.44%
� Cost to income ratio decreased to 42.83% Vs 44.10% previous year
19%
Gross Profit
14%
Net Profit
Gross NPA Net NPA
1.86% 1.30%
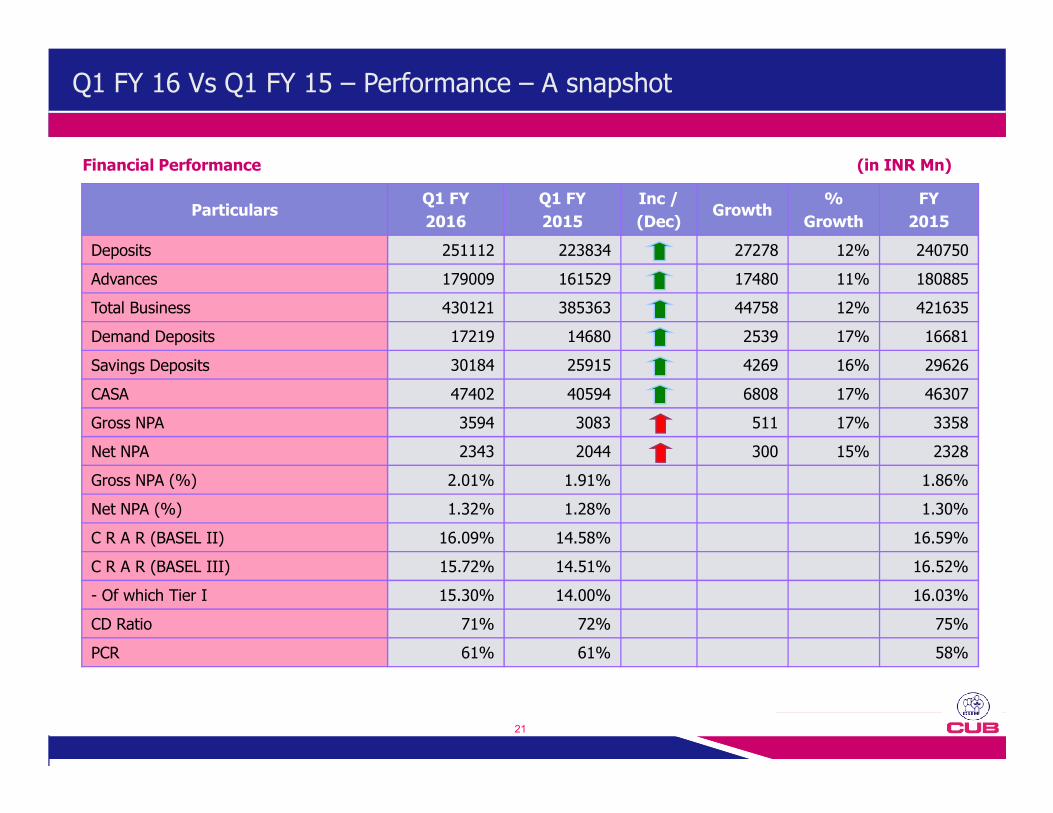
Q1 FY 16 Vs Q1 FY 15 – Performance – A snapshot
Particulars Q1 FY
2016
Q1 FY
2015
Inc /
(Dec)Growth
%
Growth
FY
2015
Deposits 251112 223834 27278 12% 240750
Advances 179009 161529 17480 11% 180885
Total Business 430121 385363 44758 12% 421635
Demand Deposits 17219 14680 2539 17% 16681
Savings Deposits 30184 25915 4269 16% 29626
CASA 47402 40594 6808 17% 46307
Financial Performance (in INR Mn)
21
Gross NPA 3594 3083 511 17% 3358
Net NPA 2343 2044 300 15% 2328
Gross NPA (%) 2.01% 1.91% 1.86%
Net NPA (%) 1.32% 1.28% 1.30%
C R A R (BASEL II) 16.09% 14.58% 16.59%
C R A R (BASEL III) 15.72% 14.51% 16.52%
- Of which Tier I 15.30% 14.00% 16.03%
CD Ratio 71% 72% 75%
PCR 61% 61% 58%

Q1 FY 16 Vs Q1 FY 15 – Performance – A snapshot
Particulars Q1 FY
2016
Q1 FY
2015
INC /
(DEC)
% GROWTH
FY
2014-15
Net Interest Income 2236 1867 369 20% 8074
Other Income 1049 1107 -58 -ve 4041
Operating Expenses 1314 1247 66 5% 5188
Gross Profit 1972 1727 245 14% 6926
Provisions & Contingencies 856 732 124 17% 3085
Exceptional Items 0 0 109
Financial Performance (in INR Mn)
22
Net Profit 1116 995 121 12% 3950
Return on Assets 1.57% 1.58% 1.49%
Return on Equity 16.43% 19.40% 16.91%
Net Interest Margin 3.59% 3.32% 3.44%

Q1 FY 16 Vs Q1 FY 15 – Income and Expenses – Breakup
Particulars Q1 FY
2016
Q1 FY
2015
Growth
(%)
Interest on Loans 5726 5211 10%
Interest on Investments 1237 1120 10%
Other Interest Income 98 103 -ve
Total Interest Income 7060 6433 10%
Interest Income Breakup
(in INR Mn)
Particulars Q1 FY
2016
Q1 FY
2015
Growth
(%)
Int Exp on Deposits 4736 4505 5%
Other Int Expenses 88 61 45%
Total Interest
Expenses4824 4566 6%
Interest Expenses Breakup
23
Particulars Q1 FY
2016
Q1 FY
2015
Growth
(%)
CEB & Charges 520 495 5%
Treasury Income 312 223 40%
Other Inc incl recoveries in written off a/cs
217 389 -ve
Total Other Income 1049 1107 -ve
Particulars Q1 FY
2016
Q1 FY
2015
Growth
(%)
Employee Cost 483 522 -ve
Other Operating
Expenses831 725 15%
Total Expenses 1314 1247 5%
Other Income Breakup Operating Expenses Breakup

FY 15 Vs FY 14 – Income and Expenses – Breakup
Particulars FY
2015
FY
2014
Growth
(%)
Interest on Loans 21662 20921 4%
Interest on Investments 4925 4075 21%
Other Interest Income 402 463 -ve
Total Interest Income 26989 25459 6%
Interest Income Breakup
(in INR Mn)
Particulars FY
2015
FY
2014
Growth
(%)
Int Exp on Deposits 18532 17340 7%
Other Int Expenses 383 525 -ve
Total Interest
Expenses18915 17865 6%
Interest Expenses Breakup
24
Particulars FY
2015
FY
2014
Growth
(%)
CEB & Charges 1967 1743 13%
Treasury Income 1292 555 133%
Other Inc incl recoveries in written off a/cs
782 501 56%
Total Other Income 4041 2799 44%
Particulars FY
2015
FY
2014
Growth
(%)
Employee Cost 2103 1856 13%
Other Operating
Expenses3086 2727 13%
Total Expenses 5188 4583 13%
Other Income Breakup Operating Expenses Breakup

Key Business Indicators
Particulars Q1 FY
2016
Q1 FY
2015
Q4 FY
2015
FY
2014-15
Cost of Deposits 7.85% 8.25% 8.14% 8.15%
Yield on Advances 12.95% 13.00% 13.06% 13.18%
Yield on Investments 7.39% 7.64% 7.65% 7.63%
Net Interest Margin 3.59% 3.32% 3.40% 3.44%
Cost to Income 39.99% 41.94% 42.34% 42.83%
Cost of Funds 6.81% 7.26% 7.08% 7.13%
Key indicators
25
Yield on Funds 9.96% 10.23% 10.08% 10.17%
Per Employee Business (in INR Mn) 96.58 91.32 96.53 96.53
Per Employee Profit (in INR Mn) (Ann) 1.00 0.96 0.91 0.91
EPS (in INR) – FV INR 1/- share (Not Ann) 1.87 1.83 1.66 6.82

Strong Deposits and Advances growth
Deposits Advances
163408
203048220169
240750251112
122217
153429162236
180885 179009
26
285625
356476382405
421635 430121
31-Mar-12 31-Mar-13 31-Mar-14 31-Mar-15 30-Jun-15
29716
34046
39173
46307 47402
31-Mar-12 31-Mar-13 31-Mar-14 31-Mar-15 30-Jun-15
CASABusiness
31-Mar-12 31-Mar-13 31-Mar-14 31-Mar-15 30-Jun-15 31-Mar-12 31-Mar-13 31-Mar-14 31-Mar-15 30-Jun-15

2071
2736 2799
4041
1049
4998
6240
75948074
2236
Income Growth over the years …
Net Interest Income Growth Other Income Growth
31-Mar-12 31-Mar-13 31-Mar-14 31-Mar-15 30-Jun-1531-Mar-12 31-Mar-13 31-Mar-14 31-Mar-15 30-Jun-15
27
1289
1727 1743
1967
520
31-Mar-12 31-Mar-13 31-Mar-14 31-Mar-15 30-Jun-15
CEB Growth
2803
32203471
3950
1116
31-Mar-12 31-Mar-13 31-Mar-14 31-Mar-15 30-Jun-15
Net Profit Growth

Cost of deposits & Yield on advances
Cost of Deposits and Yield on Advances
10.85
11.32
12.8213.46
13.04
12.47
13.56
13.49
13.43
13.18
12.95
28
5.75 5.95
7.237.98
7.73
6.94
8.11
8.44
8.37
8.15
7.85
2006 2007 2008 2009 2010 2011 2012 2013 2014 2015 Jun-15
Spread between cost of deposits and yield on advances of our bank maintained in the last 10 years

Key Business Ratios - Yearwise
3.64%
3.40%
3.35%
3.50%
3.44%
3.59%
Net Interest Margin
1.67%1.71%
1.58%
1.44%1.49%
1.57%
Return on Assets
29
31-Mar-11 31-Mar-12 31-Mar-13 31-Mar-14 31-Mar-15 30-Jun-1531-Mar-11 31-Mar-12 31-Mar-13 31-Mar-14 31-Mar-15 30-Jun-15
6.18%7.30%
7.66%
7.40%7.13%
6.81%
31-Mar-11 31-Mar-12 31-Mar-13 31-Mar-14 31-Mar-15 30-Jun-15
Cost of Funds
9.43%
10.34%
10.71%
10.55%
10.17%
9.96%
31-Mar-11 31-Mar-12 31-Mar-13 31-Mar-14 31-Mar-15 30-Jun-15
Yield on Funds

Efficiency
93.8
90.6
96.5 96.6
Business per Employee Profit per Employee
(Rs in Mn)
0.84 0.85 0.82
0.91
1.00
30
84.7
31-Mar-12 31-Mar-13 31-Mar-14 31-Mar-15 30-Jun-15 31-Mar-12 31-Mar-13 31-Mar-14 31-Mar-15 30-Jun-15

Loan Book – Products Composition
Loan Book Products CompositionAmount
(INR Mn)
% to Total
Advances
Cash Credit & Demand Loans 114847 64%
Term Loans 62221 35%
Bills Purchased & Bills Discounted 1941 1%
Gross Loans Total 179009 100%
� Working capital loans yielding higher interest
constitute 64% of advances
� Re-pricing possible at short intervals thus
reducing interest rate risk
� ~80% of our loan book is on floating rate basis
which reduces interest rate risk
BP & BD1,941
31
ODCC & Demand Loan114,84764%
Term Loans62,22135%
1,9411%

ParticularsAmount (INR Mn)
% to Total Advances
Agriculture (includes AJL – 18673 Mn) 28048 16%
M S M E 60906 34%
Large Industries 10900 6%
Retail Traders 9037 5%
Wholesale Traders 21150 12%
Commercial Real Estate 10154 5%
JL Non Agriculture 3689 2%
Sectoral Deployment as on 30th June 2015
Loan book – Composition
ParticularsAmount (INR Mn)
% to Total Advances
Secured Loans 177178 99%
Unsecured Loans 1831 1%
Total 179009 100%
Secured & Unsecured Advances
� Trading & MSME loans earning higher yields
constitute about 51%.
� Diversified credit portfolio reduces credit risk
32
JL Non Agriculture 3689 2%
Housing Loans 11889 7%
Other Personal Loan (includes Personal Loan, Clean loan, Clean OD, Consumer loan, etc.) 5070 3%
Loans collateralized by Deposits 3749 2%
Infrastructure 1196 1%
NBFC 1443 1%
Others (Educational Loan, Staff Loan, etc) 11778 6%
Gross Loans Total 179009 100%
� Diversified credit portfolio reduces credit risk
� Lower ticket size backed by adequate collaterals
� Unsecured Advances aggregate to 1% only
� Jewel Loan portfolio decreased by Rs.5385 Mn
when compared to Q1 FY 2015.
� Total Jewel Loan outstanding as on 30.06.2015 -
Rs.22,385 Mn
AJL – Agricultural Jewel Loan
JL – Jewel Loan

Sectoral Deployment chart
Loan Book – Sectoral Deployment
Agri , 28048
JL Non Agri, 3689
Housing Loans, 11889
Personal Loan , 5070
L A D, 3749
Infra, 1196 NBFC, 1637 Others, 9097
33
M S M E, 60906
Large Ind, 10900
Retail Trade, 9037
Whlsale Trade, 21150
C R E, 10154
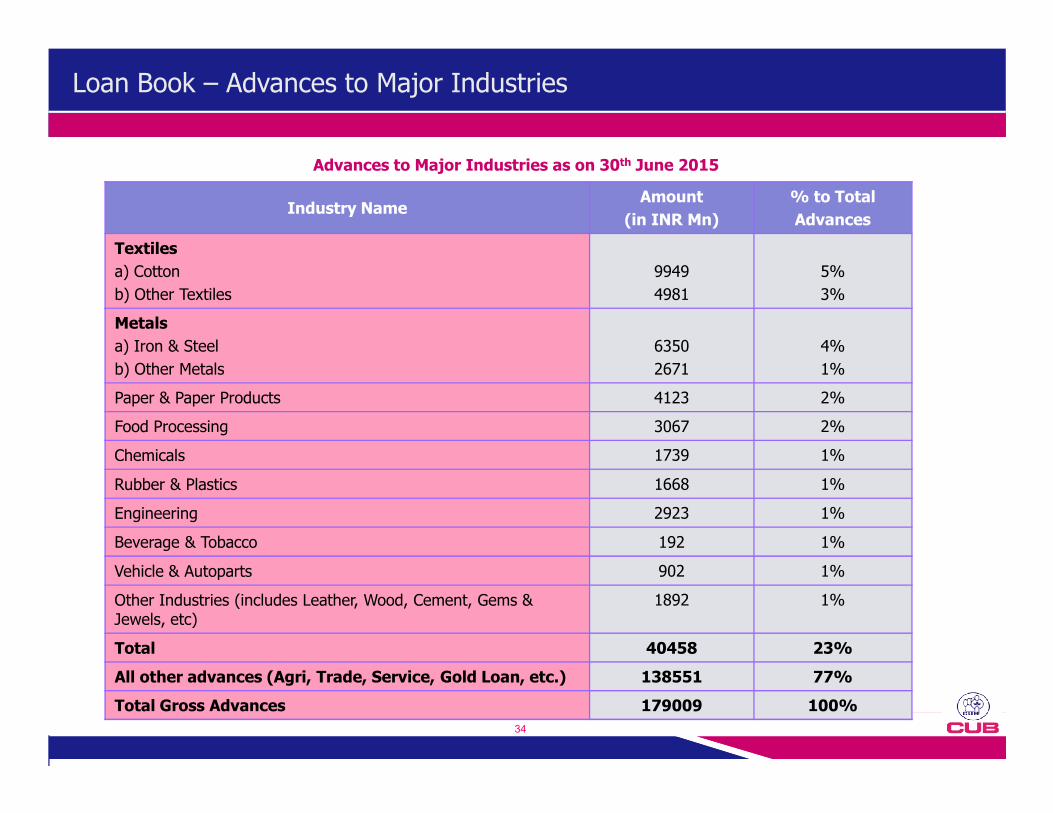
Loan Book – Advances to Major Industries
Industry NameAmount
(in INR Mn)
% to Total
Advances
Textiles
a) Cotton
b) Other Textiles
9949
4981
5%
3%
Metals
a) Iron & Steel
b) Other Metals
6350
2671
4%
1%
Paper & Paper Products 4123 2%
Advances to Major Industries as on 30th June 2015
34
Food Processing 3067 2%
Chemicals 1739 1%
Rubber & Plastics 1668 1%
Engineering 2923 1%
Beverage & Tobacco 192 1%
Vehicle & Autoparts 902 1%
Other Industries (includes Leather, Wood, Cement, Gems & Jewels, etc)
1892 1%
Total 40458 23%
All other advances (Agri, Trade, Service, Gold Loan, etc.) 138551 77%
Total Gross Advances 179009 100%

1973
2343
Asset Quality
Gross NPA Qtm & Gross NPA %
2931
3358
3594
Net NPA Qtm & Net NPA %
(Rs in Mn)
484540
964
31-Mar-12 31-Mar-13 31-Mar-14 31-Mar-15 30-Jun-15
35
1235
1731
31-Mar-12 31-Mar-13 31-Mar-14 31-Mar-15 30-Jun-15
1.01%
1.13%
1.81%1.86%
2.01%
0.44%0.63%
1.23%1.30% 1.32%
`

Asset Quality Position – Movement over the years
(Rs in Mn)FY
Mar-11FY
Mar-12FY
Mar-13F Y
Mar-14FY
Mar-15Q1 FY2016
NPA Opening balance 882 1125 1235 1731 2931 3358
Additions A 1207 1444 2234 4562 4250 776
Recovery / SR 376 649 486 1865 2118 193
Upgradations 114 165 232 168 227 88
Net Addition B 717 630 1516 2529 1905 495
Write-off 474 520 1020 1329 1478 259
NPA Closing balance 1125 1235 1731 2931 3358 3594
Technical Write-off (TW) during the period 540 484 948 1226 618 249
36
Technical Write-off (TW) during the period 540 484 948 1226 618 249
Provision made during the period C 672 570 970 1485 1650 500
T W recovery D 291 400 599 544 750 43
Provision made net of TW Recovery E = C-D 381 170 371 941 900 457
Gross Advance F 92555 122217 153428 162236 180885 179009
Additions % of Gross Advance A / F 1.30 1.18 1.46 2.81 2.35 0.43
Net Addition % of Gross Advance B / F 0.77 0.52 0.99 1.56 1.05 0.28
Credit cost E / F 0.41 0.14 0.24 0.58 0.50 0.26
Gross NPA % 1.21 1.01 1.13 1.81 1.86 2.01
Net NPA % 0.52 0.44 0.63 1.23 1.30 1.32

Restructured Accounts
Type Restructuring No. of
Borrowers
Amount
(in INR Mn)
Under CDR Mechanism 1 638
Under SME Debt Restructuring Mechanism 4 124
Under Other Debt Restructuring Mechanism 4 1675
Total 9 2437
Balance outstanding as on 30.06.2015 in respect of Restructured Standard borrowers:
No account has been restructured during Q1 FY 2016
37
� The above disclosure is in respect of Restructured Standard Accounts excluding NPA.
� Restructured Standard Advances to Gross Advances - 1.36% Q1 FY 16 Vs 1.62% Q1 FY 15
� No fresh sale to ARC during Q1 FY 2016 and amount outstanding in Security Receipts - 3730 Mn
� Amount serviced during Q4 FY 2015 in restructured standard accounts is Rs.28 Mn
� During Q1 FY 2016 two accounts slipped into NPA category from restructured standard accounts to the tune
of Rs.163 Mn

Investments – At a Glance
Particulars JUN 2015 MAR 2015 JUN 2014
SLR Securities 69723 54875 59106
Non-SLR Securities 4321 3849 807
Total Investments 74044 58724 59913
Yield on Investments 7.39% 7.63% 7.64%
Investments Breakup:
- A F S 22663 (31%) * 14304 (24%) 6899 (12%)
- H T M 51381 (69%) 44420 (76%) 52855 (88%)
Investments Breakup and Categorywise (in INR Mn)
38
- H T M 51381 (69%) 44420 (76%) 52855 (88%)
- H F T - - 159
Total Investments 74044 58724 59913
Modified Duration:
- A F S 1.90 2.28 1.77
- H T M 4.43 4.16 4.46
- H F T - - 5.70
- Overall Portfolio 3.76 3.83 4.22
* ���� Lower CD ratio and the resultant surplus funds deployed in money market instruments including T-bill
resulted in higher AFS portfolio and lower modified duration.
Annual General Meeting – 24.08.2015
� The Annual General Meeting will be held on 24.08.2015 at Kumbakonam
39
� We are seeking shareholders’ approval for an enabling resolution to go for QIP
upto Rs.500 cr.

40
Thank You