Embed Size (px)
Citation preview

NYSE:CMN
NYSE:CMD
Investor Presentation
June 2017

Forward Looking Statement
This document contains “forward-looking statements” – that is, statements related to future, not past,
events. In this context, forward-looking statements often address our expected future business and
financial performance and financial condition, and often contain words such as “expect,” “anticipate,”
“intend,” “plan,” “believe,” “seek,” “see,” “will,” “would,” or “target.” Forward-looking statements - such
as statements about our revenues; income; organic growth; acquisition strategy; and five-year strategic
plan – are generally based on current estimates and forecasts. By their nature, forward looking
statements address matters that are, to different degrees, subject to a risks, uncertainties and factors
that could cause our actual results to be materially different than those expressed in such statements.
Many of the material risks, uncertainties and factors are described in “Risk Factors” in our Annual
Report on Form 10-K for the year ended July 31, 2016 and filings with the Securities and Exchange
Commission. We do not intend, or assumes any obligation, to update or revise these forward-looking
statements in light of developments which differ from those anticipated.
This document also contains non-GAAP financial information. Management uses this information in its
internal analysis of results and believes that this information may be informative to investors in gauging
the quality of our financial performance, identifying trends in our results and providing meaningful
period-to-period comparisons. For a reconciliation of non-GAAP measures presented in this document,
see the accompanying appendix.
2

Purpose
Business
Priorities
Values
Mission Statement
3
Cantel Medical is dedicated to delivering innovative infection prevention
(“IP”) products and services for patients, caregivers, and other
healthcare providers, which improve outcomes and help save lives.
New
Products
Market
Expansion
Strategic
Acquisitions
Financial
Performance
Continuous
Improvement
Treat all people with respect while embracing diversity and cultural differences
Operate with integrity, ethics and comply with all regulations globally
Understand customers’ needs and deliver high quality, innovative, safe solutions
better than our competitors
Work in high-performance teams, empowered to make a difference and continue
to learn and grow
1
2
3
4
Act with accountability and a sense of urgency to deliver on our goals5

4
2,300+Global Team
members
40 LOCATIONS
IN NORTH
AMERICA
Cantel Medical Facilities
AUSTRALIA
BELGIUM
CANADA
CHINA
FRANCE
GERMANY
HONG KONG
ITALY
MALAYSIA
NETHERLANDS
UNITED KINGDOM
UNITED STATES
SINGAPORE
~250 distributors
in 105 countries
CONFIDENTIAL
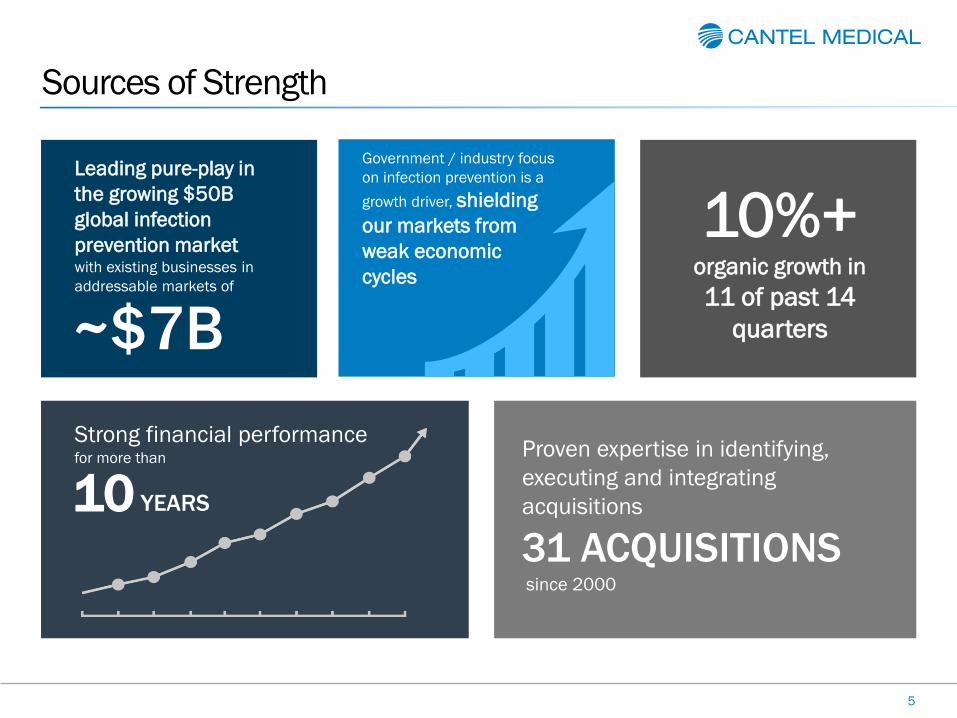
Sources of Strength
5
Leading pure-play in
the growing $50B
global infection
prevention marketwith existing businesses in
addressable markets of
~$7B
Strong financial performancefor more than
10 YEARS
Proven expertise in identifying,
executing and integrating
acquisitions
31 ACQUISITIONSsince 2000
10%+ organic growth in
11 of past 14
quarters
Government / industry focus
on infection prevention is a
growth driver, shielding
our markets from
weak economic
cycles

Infection Prevention Markets
6
Endoscopy Water Purification &
Filtration
Healthcare
Disposables
1 Segment Revenue (LTM) Last Twelve Months ending 4/30/2017
2 CDC website, http://www.cdc.gov/HAI/surveillance/index.html
3 Zimlichman, E, et al., Healthcare-associated infections: a Meta-analysis of Costs and Financial Impact on the US Health Care System, JAMA Intern Med., 2013, 173(22)
4 2010 US Report on Endoscopy, Millennium Research Group; 2014 European Markets for Gastrointestinal Endoscopic Devices, iData Research; 2012 China GI Census, Chinese Society of Digestive Endoscopy
5 Hemodialysis & Peritoneal Dialysis Market - Global Forecast to 2020
6 UN World Health Statistics, 2014
Our commitment is addressing critical infection prevention challenges globally
• More than 80 million global procedures annually growing at an estimated 7% CAGR3
• Colorectal cancer is 3rd most common cancer and 4th leading cause of cancer deaths globally3
• 3.6 million patients worldwide have ESRD5
• US de novo clinics growing 5% annually
• Diabetes, obesity and hypertension are among the main risk factors5
• 2 million dental practitioners globally6
• High margin dental infection prevention products opportunity
• Annual growth at ~ 2-3%
$385M1 $190M1 $138M1
TAM: ~ $4.5 Billion TAM: ~ $1.0 Billion TAM: ~ $1.2 Billion

Endoscopy Reprocessing
& Procedure
Room Products
Market Leader in Each of Our SegmentsProduct portfolio providing differentiated infection prevention solutions
7
Medical & Life Science
Water Purification
& Filters
Dental, Hospital, Sterility
Assurance
Endoscopy Water Purification &
Filtration
Healthcare
Disposables

10+ Years of Long Term Growth & Margin Expansion
8
Strong cash flow funds acquisition program with modest leverage
$0
$100
$200
$300
$400
$500
$600
$700
FY'03 FY'04 FY'05 FY'06 FY'07 FY'08 FY'09 FY'10 FY'11* FY'12 FY'13 FY'14 FY'15 FY'16
$ in
millio
ns
Net Sales Adj. EBITDAS Net Debt / (Cash)1,2 2,3
21%
1 Earnings before Interest, Taxes, Depreciation, Amortization, Stock compensation expense, (Gain)/Loss on Disposal of Fixed Asset, Acquisition-related items and Atypical items.2 See Appendix for GAAP to Non-GAAP reconciliation3 Net Debt calculated as Gross Debt minus cash on balance sheet
* FY’11 Net Debt includes $98M in debt assumed on the first day of fiscal year 2012 upon closing of the Byrne Medical acquisition.
CAGR:
’03-’16
16%
21%

Endoscopy,
$72.5
Water
Purification &
Filtration,
$33.5
Healthcare
Disposables,
$27.1
Dialysis, $8.0
Strong Financial Performance with High Quality Earnings
9
1 Before allocation of corporate expenses of ~$32.1M.2 Earnings before Interest, Taxes, Depreciation, Amortization, Stock compensation expense, (Gain)/Loss on Disposal of Fixed Asset, Acquisition-related items and Atypical items.3 See appendix for GAAP to Non-GAAP reconciliation.The effect of rounding may create minor data variances.
Last Twelve Months (LTM) Ended April 30, 2017
OPERATING INCOME: $141.0M1
OPERATING INCOME MARGIN: 19.0%1
NET SALES: $743.7M
Adjusted EBITDAS = $156.5M2,3
Adjusted EBITDAS Margin = 21.0%2,3
Total Revenue Growth = 16.7%
Organic Revenue Growth = 10.9%
18.8%
17.6%
19.7%
26.2%
Endoscopy,
$385.3
Water
Purification &
Filtration,
$190.3
Healthcare
Disposables,
$137.7
Dialysis,
$30.4

Long Term Growth Drivers: Endoscopy
10
• Focus on single-use products
to decrease cross-
contamination
• Transition from manual to
automated reprocessing in
emerging markets
• Single-shot AERs drive
continued high-margin
chemistry growth
Large and growing global
addressable market totaling over
$4.5 billion
• 80M procedures globally growing at mid-single digits
• Colorectal cancer is a leading global cause of death, driving worldwide screening and treatment efforts
• Improved adenoma detection rates will accelerate colonoscopy procedures
• Only pure-play infection
prevention provider
• Full-circle product solutions for
infection challenges
• 3 new AER platforms
• Direct sales and service teams
in the US, Canada, UK, Italy,
Germany, Benelux, France and
China
INDUSTRY DRIVERSMARKET SIZE AND
GROWTHTHE CANTEL DIFFERENCE

Long Term Growth Drivers:Water Purification & Filtration
11
• Continued expansion of
ESRD population
• Upgrade opportunity:
~6,5001 US clinics today,
majority use old technology
• Market adoption of heat-
based water disinfection
technology
• New opportunities in
filtration and chemical
sterilants
End-Stage Renal Disease
(ESRD) patient demographics
drive de novo clinic build in the
US
• US ESRD patient population growing at 3-4% annually1
• De novo clinic build increasing 5% annually1
• Leading technology in
Hemodialysis water
treatment
• Comprehensive network of
US-based service centers
available 24/7/365
• Strong partnerships with
leading dialysis providers
• REVOX sterilization
INDUSTRY DRIVERSMARKET SIZE AND
GROWTHTHE CANTEL DIFFERENCE
1 2015 US Renal Data System

Long Term Growth Drivers:Healthcare Disposables
12
• Infection prevention remains
headline risk for dental
practitioners globally
• Evolution of DSOs
consolidating providers driving
requirements for
comprehensive solutions
• Higher compliance standards
• ~ 210,000 dentists in the US
• 213 million annual1 US dental visits growing at 2-3%
• US single largest market for dental infection prevention products
• Aging global demographics will drive patient volumes
• Leading branded player in the
dental infection prevention
• Expansion of higher margin
Circle of Protection products
• DentaPure® Waterline
Disinfection System adds new
growth category
• Innovative face masks /
pandemic preparedness
• Leader in education and
training of dental community
INDUSTRY DRIVERSMARKET SIZE AND
GROWTHTHE CANTEL DIFFERENCE
1 May 2014 American Dental Association News

Experienced Executive Team
13
Jørgen B. HansenPresident &
Chief Executive Officer
Dottie Donnelly
Brienza
SVP and Chief Human
Resources Officer
Milicent Brooks
Director
Corporate
Communications
Gary Steinberg
President
Healthcare
Disposables
Curtis Weitnauer
President
Water Purification
and Filtration
Paul Helms
Exec. Vice
President
Operations
David Rosen
President
Continental EU,
MEA & Asia Pac
David Hemink
President
Endoscopy
Craig Smith
Vice President
RA & QA
Compliance Officer
Eric W. Nodiff
Exec. Vice President
General Counsel
Michael Spicer
President
Americas, Sales, UK
& Global Service
Lawrence Conway
Vice President
Business Systems
& Procurement
Peter G. Clifford
Exec. Vice President
Chief Financial Officer
Seth M. Yellin
Exec. Vice President
Strategy and Corporate
Development

Cantel Growth StrategyAchieve global IP leadership by executing our business priorities
14
New Products Global MarketExpansion
StrategicAcquisitions
Cantel Operating Model
Commercial Excellence | Team Development | Infrastructure | Continuous Improvement

Endoscopy Water Purification &
Filtration
Healthcare
Disposables
New Products: Global R&D process driving new product development
15
• RapidAER ®
• Advantage Plus® Pass-
Thru
• Medivators ® ISA ®
• Procedure kits
• Rapicide® PA
• CleanaScope®
• Revox® Sterilization
Solutions
• ROVER® Dialysis Water
Transport System
• CWP® Dialysis Water
System
• Millenium HX ® Dialysis
Water System
• Unique Sure-Check®
pouch
• Secure Fit™ masks
• Rapicide® OPA / 28
• BI/CI product-line
extensions
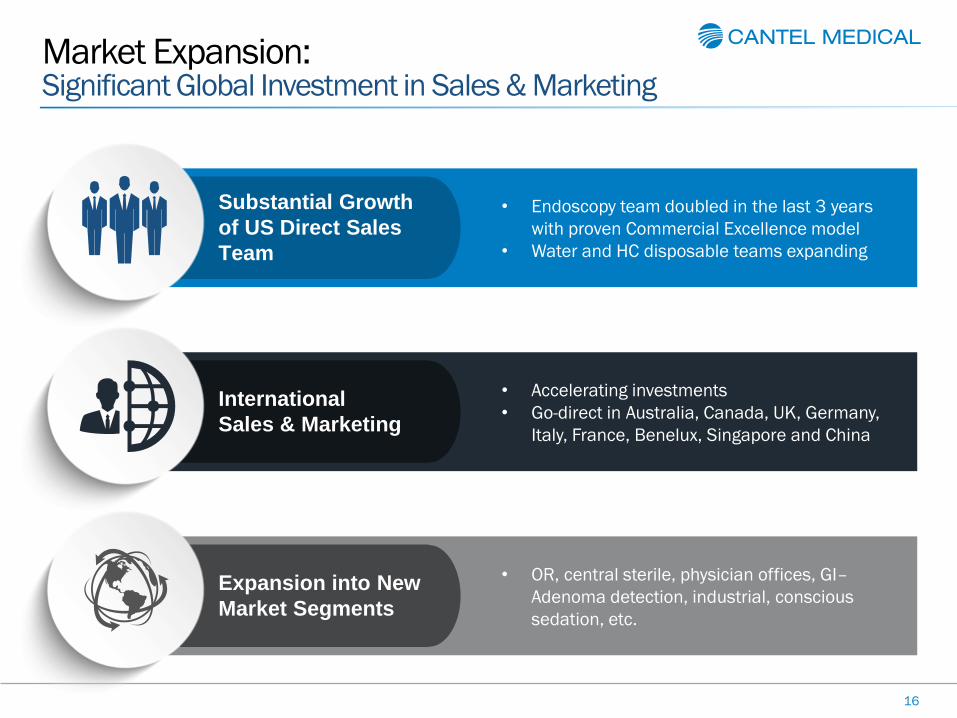
• Endoscopy team doubled in the last 3 years
with proven Commercial Excellence model
• Water and HC disposable teams expanding
Substantial Growth of US Direct Sales Team
Market Expansion: Significant Global Investment in Sales & Marketing
16
• Accelerating investments
• Go-direct in Australia, Canada, UK, Germany,
Italy, France, Benelux, Singapore and China
International Sales & Marketing
• OR, central sterile, physician offices, GI–
Adenoma detection, industrial, conscious
sedation, etc.
Expansion into New Market Segments
Endoscopy InternationalWater Purification & Filtration
Healthcare Disposables
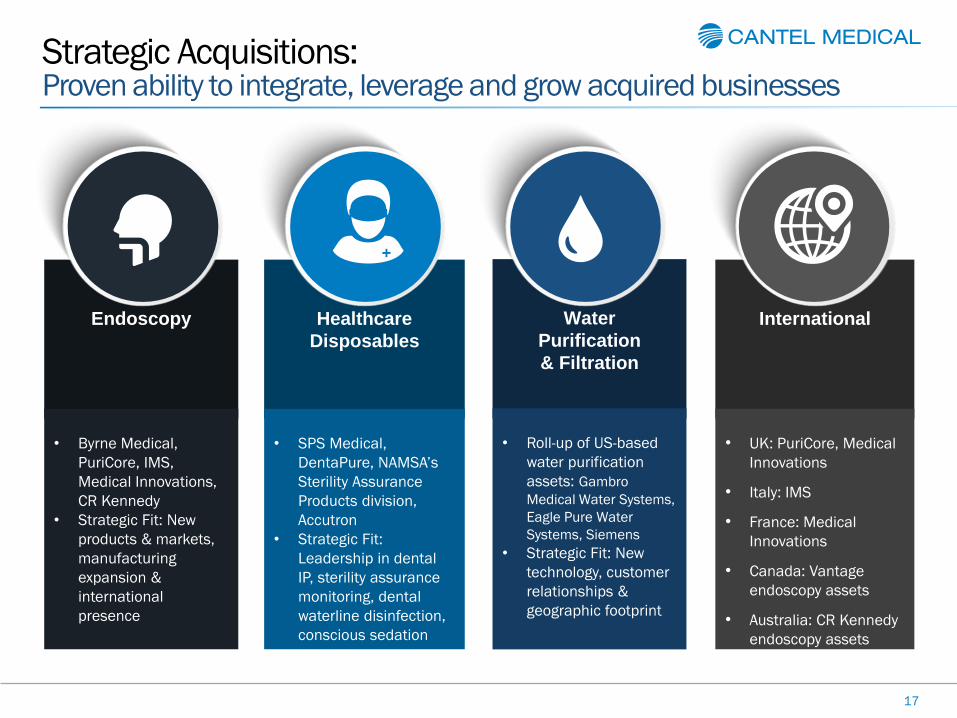
Strategic Acquisitions:Proven ability to integrate, leverage and grow acquired businesses
17
• Byrne Medical,
PuriCore, IMS,
Medical Innovations,
CR Kennedy
• Strategic Fit: New
products & markets,
manufacturing
expansion &
international
presence
• UK: PuriCore, Medical
Innovations
• Italy: IMS
• France: Medical
Innovations
• Canada: Vantage
endoscopy assets
• Australia: CR Kennedy
endoscopy assets
• Roll-up of US-based
water purification
assets: Gambro
Medical Water Systems,
Eagle Pure Water
Systems, Siemens
• Strategic Fit: New
technology, customer
relationships &
geographic footprint
• SPS Medical,
DentaPure, NAMSA’s
Sterility Assurance
Products division,
Accutron
• Strategic Fit:
Leadership in dental
IP, sterility assurance
monitoring, dental
waterline disinfection,
conscious sedation

Continuous
Improvement
Team
Development
The Cantel Operating Model is the Foundation to Enable Growth and Leverage
18
Target sales
growth in all
Cantel
divisions at
above market
rates
Establish
systems &
procedures to
optimize global
supply chain
Attract, retain
and develop
the best team
in the business
Deploy
strategic
procurement &
lean processes
globally
InfrastructureCommercial
Excellence

5-Yr Strategic PlanDouble Sales & EPS from FY16 to FY21
19
FY21 targeted
sales of $1.3B
and non-GAAP
net income of
$150M
Accelerate
international
sales by more
than 2x North
America
growth rates
Invest in
infrastructure,
technology
and systems
to drive
efficiencies
and scale
Investments
to develop
best-in-class
team industry
wide
Deploy
Commercial
Excellence
globally to
drive organic
sales growth
Successfully
execute M&A
program to
drive a third of
total sales
growth
New products
contribute half
of organic
growth

$743M1 NYSE Infection Prevention Leader
20
Recurring revenue
and $156.5M in LTM
Adj. EBITDAS1,2,3 Successful
acquisitions
since 2000
73%
31 Strong financial performancefor more than
10YEARS
Strong, recession-
buffered core
business with high
future growth
prospects
Sustainable double
digit growth in sales
and earnings for 10+
years
Total available
market 10x sales -
Global opportunities
organically and via
M&A
Excellent record with
the FDA, EPA and
global regulatory
bodies
Strong cash flow and
balance sheet (0.73x
leverage ratio3,4)
1 For last twelve months ended April 30, 2017.
2 Earnings before Interest, Taxes, Depreciation, Amortization, Stock compensation expense, (Gain)/Loss on Disposal of Fixed Asset, Acquisition-related items and Atypical items.
3 See appendix for GAAP to Non-GAAP reconciliation.
4 Net debt to LTM Adj. EBITDAS as of April 30, 2017. Net debt calculated as Gross Debt minus cash on balance sheet.

21
THANK YOU

NYSE:CMN
APPENDIX

AccutronAugust 1, 2016
23
Leading manufacturer of nitrous oxide delivery systems and single-use nasal masks
Purchase price of $53.0M in cash consideration
For calendar year ending December 31, 2015, Accutron
had reported revenues of $21.5M
Transaction further differentiates CMD’s infection
prevention product offering
• #1 US market share in both nitrous oxide equipment and nasal masks
• Leading manufacturer of single-use nasal masks driving the ongoing
transition of industry away from reusable nasal hoods, eliminating cross
contamination
• Allows early stage access to new dental office openings / dental office
decision makers

Medical InnovationsSeptember 14, 2015
24
Global endoscope storage and transport manufacturer
Purchase price of $79.6M in cash consideration
For last twelve months ending June 30, 2015, MI had
reported revenues of $28.5M
Transaction further enhances CMD’s position as leading
provider of infection prevention solutions in the
Gastrointestinal endoscopy market
• Provides CMD a market leading endoscope storage and transport system,
which is highly complimentary to existing endoscopy infection prevention
portfolio
• CMD’s ability to leverage existing sales channels, particularly in US and
direct markets, will further accelerate growth
• MI’s presence in over 80% of UK hospitals represents significant
opportunity for CMD to drive additional growth in the UK market

NAMSA’s Sterility Assurance Products DivisionMarch 1, 2016
25
Manufacturer of high-quality biological and chemical indicators
Purchase price of $13.4M in cash consideration
For year ending December 31, 2015, Sterility Assurance
Products division had adjusted revenues of $5.7M
Transaction further broadens HC Disposable’s Sterility
Assurance product offering
• Expands HC Disposable segment’s presence into attractive industrial
markets
• Opportunity to offer complete line of infection prevention and control
product portfolio to new customer base
• Strengthens new product development capabilities in sterility
monitoring segment

Historical P&L Reveals Success of Growth Programs
26
1 Earnings before Interest, Taxes, Depreciation, Amortization, Stock compensation expense, (Gain)/Loss on Disposal of Fixed Asset, Acquisition-related items and Atypical items.
2 See appendix for GAAP to Non-GAAP reconciliation.
3 Retroactively applies the 3:2 stock splits effective February 2012 and July 2013.
4 Last twelve months ended April 30, 2017.
($ in millions,
except per share data)
LTM Ending 4/30/2017
FY11 FY12 FY13 FY14 FY15 FY16CAGR:
’11 -’163Q17 LTM4
Net Sales $321.7 $386.5 $425.0 $488.7 $565.0 $665.0 16% $192.1 $743.7
Gross Profit
Gross Margin
$122.8
38.2%
$164.2
42.5%
$183.5
43.2%
$213.3
43.6%
$253.5
44.9%
$309.2
46.5%20%
$91.5
47.6%$354.7
Adjusted EBITDAS1, 2
% of sales
$48.5
15.1%
$71.9
18.6%
$83.7
17.3%
$97.5
20.0%
$113.8
20.1%
$137.9
20.8%27%
$38.8
20.2%$156.5
Op. Profit $31.3 $52.1 $63.2 $70.9 $80.8 $97.3 25% $27.4 $108.9
Net Income $20.4 $31.3 $39.2 $43.3 $48.0 $60.0 24% $17.5 $70.7
Diluted GAAP EPS3 $0.52 $0.77 $0.95 $1.04 $1.15 $1.44 22% $0.42 $1.69
Non-GAAP Diluted
EPS2,3 $0.64 $0.90 $1.10 $1.24 $1.44 $1.75 27% $0.51 $2.02
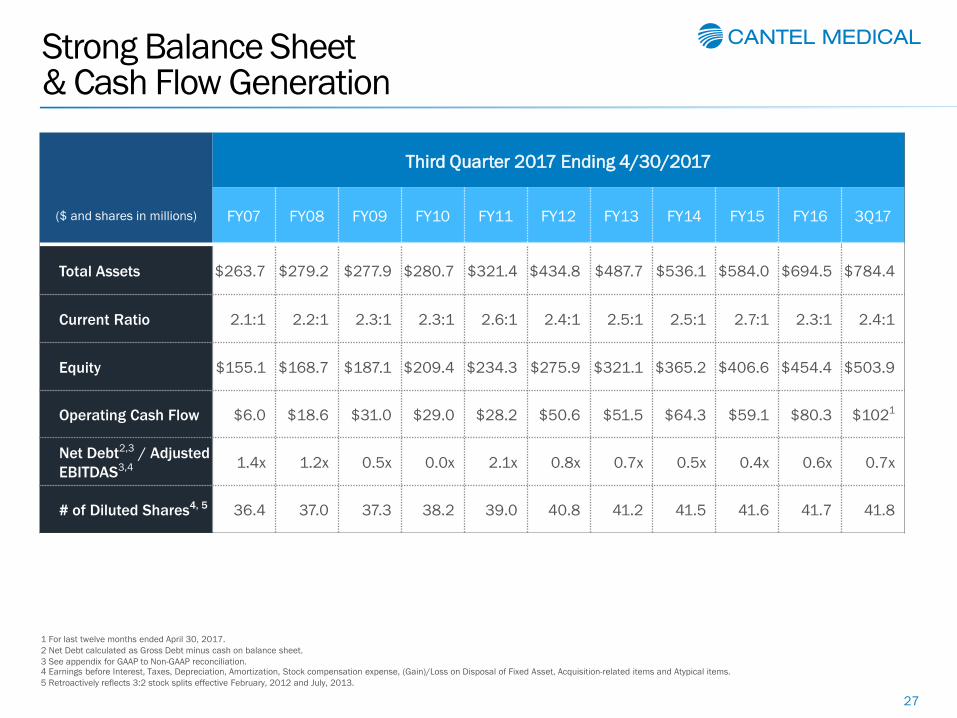
Strong Balance Sheet & Cash Flow Generation
27
1 For last twelve months ended April 30, 2017.
2 Net Debt calculated as Gross Debt minus cash on balance sheet.
3 See appendix for GAAP to Non-GAAP reconciliation. 4 Earnings before Interest, Taxes, Depreciation, Amortization, Stock compensation expense, (Gain)/Loss on Disposal of Fixed Asset, Acquisition-related items and Atypical items.
5 Retroactively reflects 3:2 stock splits effective February, 2012 and July, 2013.
($ and shares in millions)
Third Quarter 2017 Ending 4/30/2017
FY07 FY08 FY09 FY10 FY11 FY12 FY13 FY14 FY15 FY16 3Q17
Total Assets $263.7 $279.2 $277.9 $280.7 $321.4 $434.8 $487.7 $536.1 $584.0 $694.5 $784.4
Current Ratio 2.1:1 2.2:1 2.3:1 2.3:1 2.6:1 2.4:1 2.5:1 2.5:1 2.7:1 2.3:1 2.4:1
Equity $155.1 $168.7 $187.1 $209.4 $234.3 $275.9 $321.1 $365.2 $406.6 $454.4 $503.9
Operating Cash Flow $6.0 $18.6 $31.0 $29.0 $28.2 $50.6 $51.5 $64.3 $59.1 $80.3 $1021
Net Debt2,3 / Adjusted
EBITDAS3,4 1.4x 1.2x 0.5x 0.0x 2.1x 0.8x 0.7x 0.5x 0.4x 0.6x 0.7x
# of Diluted Shares4, 5 36.4 37.0 37.3 38.2 39.0 40.8 41.2 41.5 41.6 41.7 41.8

GAAP to Non-GAAP EPS Reconciliation
28
1 Last twelve months ended April 30, 2017.
2 Retroactively applies the 3:2 stock splits effective February 2012 and July 2013.
The effect of rounding may create minor data variances.
LTM Ending 4/30/2017
FY11 FY12 FY13 FY14 FY15 FY16 3Q17 LTM1
GAAP Diluted EPS2 $0.52 $0.77 $0.95 $1.04 $1.15 $1.44 $0.42 $1.69
+ Intangible amortization $0.10 $0.14 $0.16 $0.16 $0.21 $0.22 $0.07 $0.26
+ Acquisition related items $0.02 ($0.02) ($0.02) $0.02 $0.02 $0.06 $0.01 $0.04
+ Other Atypical items $0.00 $0.01 $0.01 $0.01 $0.06 $0.03 $0.01 $0.03
Non-GAAP Diluted EPS2 $0.64 $0.90 $1.10 $1.24 $1.44 $1.75 $0.51 $2.02

Net Income to Adjusted EBITDAS Net Income to Adjusted EBITDAS Reconciliation
29
1 Last twelve months ended April 30, 2017.
The effect of rounding may create minor data variances.
($ in millions)
LTM Ending 4/30/2017
FY07 FY08 FY09 FY10 FY11 FY12 FY13 FY14 FY15 FY16 3Q17 LTM1
Net Income $8.1 $8.7 $15.6 $19.9 $20.4 $31.3 $39.2 $43.3 $48.0 $60.0 $17.5 $70.7
+ Income taxes 6.0 5.2 9.4 11.6 10.0 16.5 21.1 25.3 28.2 34.0 8.9 34.1
+ Net Interest expense 2.8 4.1 2.4 1.3 0.9 3.8 2.9 2.3 2.4 3.3 1.1 4.1
+ D&A 10.2 11.7 11.4 11.4 12.4 15.9 17.3 18.9 24.0 25.1 7.7 29.4
+ Loss on disposal of fixed
asset- 0.1 0.1 0.2 - 0.1 0.2 0.5 0.4 0.5 0.1 0.9
+ Stock-based comp 1.5 2.0 3.2 3.1 3.4 3.8 3.7 5.4 5.9 8.4 1.9 9.5
+ Acquisition-related items - - - - 1.4 (1.2) (1.4) 1.1 1.6 3.2 0.7 1.8
+ Loss on sale of business - - - - - - - - 2.2 - - -
+ Other atypical items 0.5 1.0 - - - 1.7 0.8 0.6 1.3 3.5 0.9 6.0
Adjusted EBITDAS $29.1 $32.8 $42.1 $47.5 $48.5 $71.9 $83.7 $97.5 $113.8 $137.9 $38.8 $156.5

Gross Debt to Net Debt Reconciliation
30
1 FY’11 Net Debt includes $98M in debt assumed on the first day of fiscal year 2012 upon closing of the Byrne Medical acquisition.
1 FY’11 Net Debt includes $98M in debt assumed on the first day of fiscal year 2012 upon closing of the Byrne Medical acquisition.
($ in millions)
Third Quarter 2017 Ending 4/30/2017
FY07 FY08 FY09 FY10 FY11 FY12 FY13 FY14 FY15 FY16 3Q17
Gross Debt $57.0 $58.3 $43.3 $21.0 $122.0 $90.0 $95.0 $80.5 $78.5 $116.0 $145.0
- Cash (15.9) (18.3) (23.4) (22.6) (18.4) (30.2) (34.1) (31.8) (31.7) (28.4) (30.9)
Net Debt $41.1 $40.0 $19.9 ($1.6) $103.6 $59.8 $60.9 $48.7 $46.8 $87.6 $114.1

GAAP to Non-GAAP EPS Disclosure
31
Non-GAAP financial measures contained herein supplement information previously reported in filings on Form 10-Q and Form 10-K as well as in presentations by Company management to investors, analysts and others.
The information below will not be deemed “filed” for purposes of Section 18 of the Securities Exchange Act of 1934, as amended, or incorporated by reference in any filing under the Securities Act of 1933, as amended.
Non-GAAP Financial Measures
In evaluating our operating performance, we supplement the reporting of our financial information determined under accounting principles generally accepted in the United States (“GAAP”) with certain internally driven non-GAAP financial measures, namely (i) non-GAAP gross profit rate, (ii) non-GAAP income from operations, (iii) non-GAAP net income, (iv) non-GAAP earnings per common share – diluted (“EPS”), (v) income before interest, taxes, depreciation, amortization and stock-based compensation expense (“EBITDAS”), (vi) EBITDAS adjusted for atypical items (“Adjusted EBITDAS”), (vii) net debt and (viii) organic sales. These non-GAAP financial measures are indicators of the Company’s performance that are not required by, or presented in accordance with, GAAP. They are presented with the intent of providing greater transparency to financial information used by us in our financial analysis and operational decision-making. We believe that these non-GAAP measures provide meaningful information to assist investors, shareholders and other readers of our Condensed Consolidated Financial Statements in making comparisons to our historical operating results and analyzing the underlying performance of our results of operations. These non-GAAP financial measures are not intended to be, and should not be, considered separately from, or as an alternative to, the most directly comparable GAAP financial measures.
(a) Non-GAAP Gross Profit Rate
We define non-GAAP gross profit rate, adjusted to exclude acquisition related items as management deems these items to be atypical or non-operating in nature.
For the three months ended April 30, 2017 and 2016, respectively, we made adjustments to non-GAAP gross profit rate to exclude acquisition related items, as further explained below.
(b) Non-GAAP Income from Operations
We define non-GAAP income from operations, adjusted to exclude amortization, acquisition related items, significant reorganization and restructuring charges, and other significant items management deems atypical or non-operating in nature.
For the three months ended April 30, 2017, we made adjustments to non-GAAP income from operations to exclude (i) amortization expense, (ii) restructuring charges and (iii) acquisition related items.
For the three months ended April 30, 2016, we made adjustments to non-GAAP income from operations to exclude (i) amortization expense, (ii) acquisition related items and (iii) costs associated with the planned retirement of our former Chief Executive Officer.

GAAP to Non-GAAP EPS Disclosure
32
(c) Non-GAAP Diluted EPS
We define non-GAAP net income and non-GAAP diluted EPS as net income and diluted EPS, respectively, adjusted to exclude amortization,
acquisition related items, significant reorganization and restructuring charges, major tax events and other significant items management
deems atypical or non-operating in nature.
For the three and nine months ended April 30, 2017, we made adjustments to net income and diluted EPS to exclude (i) amortization
expense, (ii) significant acquisition related items impacting current operating performance including legal, transaction and integration
charges as well as fair value adjustments and (iii) restructuring charges. Additionally, we made adjustments to the nine months ended April
30, 2017 to exclude (i) costs associated with the planned retirement of our former Chief Executive Officer and (ii) the favorable impact of
atypical income tax benefits to arrive at our non-GAAP financial measures, non-GAAP net income and non-GAAP diluted EPS.
For the three and nine months ended April 30, 2016, we made adjustments to net income and diluted EPS to exclude (i) amortization
expense, (ii) significant acquisition related items, (iii) costs associated with the planned retirement of our former Chief Executive Officer
and (iv) with respect to the nine months ended April 30, 2016, the favorable impact of tax legislation to arrive at our non-GAAP financial
measures, non-GAAP net income and non-GAAP diluted EPS.
(d) Organic Sales
We define organic sales as net sales, calculated according to GAAP, less (i) the impact of foreign currency translation and (ii) net sales
related to acquired businesses during the first twelve months of ownership and divestures during the periods being compared. We believe
that reporting organic sales provides useful information to investors by helping identify underlying growth trends in our business and
facilitating easier comparisons of our revenue performance with prior periods. We exclude the effect of foreign currency translation from
organic sales because foreign currency translation is not under management’s control, is subject to volatility and can obscure underlying
business trends. We exclude the effect of acquisitions because the nature, size, and number of acquisitions can vary dramatically from
period to period and can obscure underlying business trends and make comparisons of financial performance difficult.
Amortization:
Amortization expense is a non-cash expense related to intangibles that were primarily the result of business acquisitions. Our history of
acquiring businesses has resulted in significant increases in amortization of intangible assets that reduced the Company’s net income. The
removal of amortization from our overall operating performance helps in assessing our cash generated from operations including our
return on invested capital, which we believe is an important analysis for measuring our ability to generate cash and invest in our continued
growth.

GAAP to Non-GAAP EPS Disclosure
33
Acquisition Related Items
Acquisition related items consist of (i) prior year fair value adjustments to contingent consideration and other contingent liabilities resulting
from acquisitions, (ii) due diligence, integration, legal charges and other transaction costs associated with our acquisition program and
(iii) acquisition accounting charges for the amortization of the initial fair value adjustments of acquired inventory and deferred revenue.
The adjustments of contingent consideration and other contingent liabilities are periodic adjustments to record such amounts at fair value
at each balance sheet date. Given the subjective nature of the assumptions used in the determination of fair value calculations, fair value
adjustments may potentially cause significant earnings volatility that are not representative of our operating results. Similarly, due
diligence, integration, legal and other acquisition costs associated with our acquisition program, including acquisition accounting charges
relating to recording acquired inventory and deferred revenue at fair market value, can be significant and also adversely impact our
effective tax rate as certain costs are often not tax-deductible. Since all of these acquisition related items are atypical and often mask
underlying operating performance, we excluded these amounts for purposes of calculating these non-GAAP financial measures to facilitate
an evaluation of our current operating performance and a comparison to past operating performance.
Other Atypical Items
In fiscal 2016, we announced the retirement of our former Chief Executive Officer and recorded costs associated with his planned
retirement in our Condensed Consolidated Financial Statements in the second half of fiscal 2016 and the first quarter of fiscal 2017. Since
these costs are atypical and masks our underlying operating performance, we made an adjustment to our net income and EPS to exclude
such costs to arrive at our non-GAAP financial measures.
In the second and third quarters of fiscal 2017, we recorded severance and other restructuring costs, primarily in our Endoscopy segment,
to improve operating efficiencies and realign resources for continued investment in strategic initiatives. We expect further restructuring
costs to occur in the fourth quarter of fiscal 2017. Since restructuring costs have historically been infrequent and masks our underlying
operating performance, we have made an adjustment to our net income and EPS to exclude such restructuring costs to arrive at our non-
GAAP financial measures.

GAAP to Non-GAAP EPS DisclosureContinued…
34
Other Atypical Items (continued)
The consolidated effective tax rate for the nine months ended April 30, 2017 was favorably affected by the recording of excess tax benefits
relating to stock awards that vested in October 2016. As a result of the adoption of a new accounting pronouncement on August 1, 2016,
we no longer record excess tax benefits as an increase to additional paid-in capital, but record such excess tax benefits on a prospective
basis as a reduction of income tax expense, which amounted to $2,241,000 in our first quarter of fiscal 2017. Since most of our stock
awards were granted annually in our first quarter and vest on the anniversaries of the grant date, we do not anticipate the recording of
additional significant excess tax benefits for the remainder of fiscal 2017. The magnitude of the impact of excess tax benefits generated in
the future, which may be favorable or unfavorable, are dependent upon the Company’s future grants of stock-based compensation, the
Company’s future stock price on the date awards vest in relation to the fair value of awards on grant date and the exercise behavior of the
Company’s option holders. Since these favorable tax benefits are largely unrelated to our current year’s income before taxes and is
unrepresentative of our normal effective tax rate, we excluded its impact on net income and EPS for our first quarter of fiscal 2017 for the
purposes of calculating these non-GAAP financial measures to facilitate an evaluation of our current performance and a comparison to
past performance.
The prior year consolidated effective tax rate was favorably affected by tax legislation enacted in the United States and internationally that
enabled us to record favorable tax benefits in our second quarter of fiscal 2016 relating to the entire calendar 2015. Since these favorable
tax benefits were largely unrelated to our second quarter’s income before taxes and was unrepresentative of our normal effective tax rate,
we excluded its impact on net income and EPS for purposes of calculating these non-GAAP financial measures.

GAAP to Non-GAAP EPS DisclosureContinued…
35
EBITDAS and Adjusted EBITDAS
We believe EBITDAS is an important valuation measurement for management and investors given the increasing effect that non-cash
charges, such as stock-based compensation, amortization related to acquisitions and depreciation of capital equipment, has on the
Company’s net income. In particular, acquisitions have historically resulted in significant increases in amortization of intangible assets that
reduce the Company’s net income. Additionally, we regard EBITDAS as a useful measure of operating performance and cash flow before
the effect of interest expense and is a complement to operating income, net income and other GAAP financial performance measures.
We define Adjusted EBITDAS as EBITDAS excluding the same atypical items as previously described as adjustments to net income. We use
Adjusted EBITDAS when evaluating the operating performance of the Company because we believe the exclusion of such atypical items, of
which a significant portion are non-cash items, is necessary to provide the most accurate measure of on-going core operating results and
to evaluate comparative results period over period.
Net Debt
We define net debt as long-term debt less cash and cash equivalents. Each of the components of net debt appears in the Condensed
Consolidated Balance Sheets. We believe that the presentation of net debt provides useful information to investors because we review net
debt as part of our management of our overall liquidity, financial flexibility, capital structure and leverage.