Embed Size (px)
Citation preview

Investor PresentationDecember, 2011

|
FORWARD-LOOKINGSTATEMENTS
This document contains forward-looking statements, including with respect to the negotiation, implementation and effects of the proposed
combination. Such statements may include words such as “anticipate,” “estimate,” “expect,” “project,” “intend,” “plan,” “believe,” “would” or other
similar expressions. Forward-looking statements are statements that are not historical facts, including statements about our beliefs and
expectations. These statements are based on current plans, estimates and projections, and, therefore, you should not place undue reliance on
them. Forward-looking statements involve inherent risks and uncertainties. We caution you that a number of important factors could cause actual
results to differ materially from those contained in any forward-looking statement. These factors and uncertainties include in particular those
described in the documents we have filed with the U.S. Securities and Exchange Commission. Forward-looking statements speak only as of the
date they are made, and we undertake no obligation to update publicly any of them, whether in light of new information, future events or
otherwise.
ADDITIONAL INFORMATION ABOUT THE PROPOSED BUSINESS COMBINATION AND WHERE TO FIND IT
This document relates to a proposed business combination between Lan Airlines S.A. (“LAN”) and TAM S.A. (“TAM”), which will become the
subject of a registration statement and prospectus to be filed with the SEC by LAN and a new entity to be formed in connection with the
combination. This press release is not a substitute for the registration statement, prospectus and offering materials that LAN and the new entity
will file with the SEC or any other documents that they may file with the SEC or send to shareholders in connection with the proposed
combination. INVESTORS AND SECURITY HOLDERS ARE URGED TO READ THE REGISTRATION STATEMENT, PROSPECTUS,
EXCHANGE OFFER DOCUMENTS AND ALL OTHER RELEVANT DOCUMENTS FILED OR THAT WILL BE FILED WITH THE SEC AS THEY
BECOME AVAILABLE BECAUSE THEY WILL CONTAIN IMPORTANT INFORMATION ABOUT THE PROPOSED BUSINESS COMBINATION.
All such documents, if filed, would be available free of charge at the SEC’s website (www.sec.gov) or by directing a request to LAN Investor
Relations, at 56-2-565-8785 or by e-mail at [email protected], or to TAM Investor Relations, at 55-11-5582-9715 or by e-mail at
2

| 3
LAN Airlines Santiago, 1929
LAN Peru Lima, 1999
LAN Ecuador Guayaquil, 2003
LAN Argentina Buenos Aires, 2005
LAN Colombia Bogotá, 2010
More competition
Consolidation
Greater opportunities
+
Global context has created an opportunity for a Latin American market leader to emerge

|
Complementary business models
– International passenger business
– Cargo business
– Domestic market leadership
Extensive route network
– Complementary networks with very little
overlap
– Existing relationship in maintenance and
aircraft purchases
Best service in the region
Focus on efficiency
Globally competitive frequent flyer programs
Why TAM?
4
|
LAN and TAM as of September 2011 (LTM)
5
EBITDAR Margin (USD millions)
Operating Margin (USD millions)
Aircraft
Aircraft orders
Revenue (USD billions)
Employees (thousands)
%
%
Market Cap (USD billions) 2
Net Income (USD millions) 1
3.0 10.9
29.0 50.2
106 251
158 299
-171 201
1,246 2,372
545 1,126
7.7 13.2
7.1%
16,2%
8.6%
18,0%
7.9
21.2
145
141
372
1,126
581
5.5
10.6%
20,5%
Passengers (millions) 37.8 59.021.2
(1) TAM´s net income includes a non operating impact due to exchange differences and mark-to-market
(2) Market Capitalization as of November 21, 2011

|
LATAM will offer an extensive passenger network
6
Main domestic markets
Regional within Latin America
North and Central America
Europe
South Pacific / Australia
1
2
3
4
5
South America + Domestics
102 Destinations
10 Countries
+1200 Daily Departures
US and Canada
6 Destinations
2 Countries
~19 Daily Departures
12 Destinations
11 Countries
~14 Daily Departures
Five main passenger flows in the
combined network
Operated by LAN only
Operated by TAM only
Operated by both carriers*
Europe and Rest of World
1
34
5
1
1 1
1
1
2
Source: OAG

|
LAN cargo expertise + TAM market opportunity = cargo growth
LAN’s global and diversified cargo network… …with TAM’s Brazilian market presence
Brazil is the largest domestic cargo market in
Latin America
TAM offers significant strengths
– Domestic widebody network
– Existing cargo operation
– Strong European network with growth potential
North America to
South America
Europe to South
America
Regional (intra) South
America
7

|
LATAM will be among the leading airlines in the world in terms of revenues…
8
Top 20 passenger airlines in revenue
USD Billions, 2010
1
5
10
15
20 10
10
11
11
11
11
12
12
12
12
12
15
16
16
20
22
31
32
34
36
Korean Air
Air Canada
Singapore Airlines
LATAM
China Eastern
China Southern
Cathay Pacific
US Airways
Southwest
Qantas
Air China
Emirates
ANA
JAL
BA-Iberia
AMR
Air France-KLM
Delta
United-Continental
Lufthansa
Source: Airline Business
|
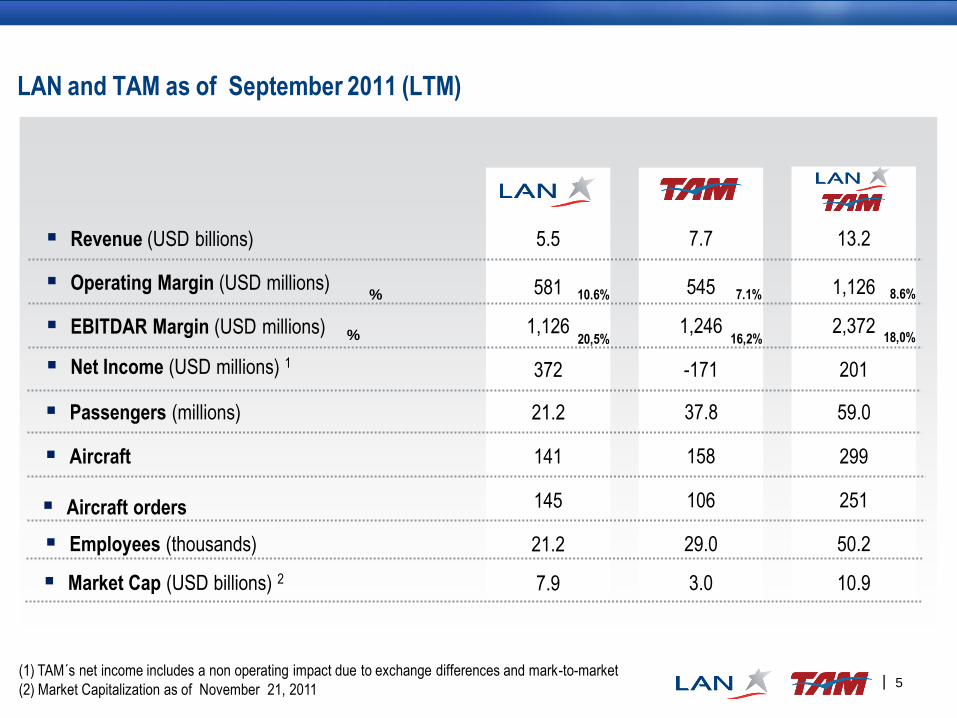
… and in terms of passenger and cargo transport
9
Top 12 airlines in passengers transported
Millions of passengers, 2010
Top 12 airlines in cargo transported
Thousands of tons, 2010
51
52
52
54
65
70
72
77
86
88
98
163
BA-Iberia
LATAM
US Airways
Lufthansa
China Eastern
Air France-KLM
Ryanair
China Southern
American
Southwest
United-Continental
Delta1
5
10
1
5
10
Source: Airline Business and WATS IATA 2010
911
951
1,052
1,055
1,069
1,104
1,149
1,347
1,555
1,579
1,777
1,805
JAL
LATAM
Lufthansa
China Southern
Air China
China Eastern
Singapore Airlines
China Airlines
United-Continental
Cathay Pacific
Emirates
Korean Air

|
LATAM will be the largest airline in the region…
10
Destinos
Númerode ciudades
Pasajeros
Millones, 2010
Ingresos
USD Billones, 2010
EBITDAR
USD Billones, 2010
CopaAvianca-
Taca (E)
GOLLAN-TAM
CopaAvianca-
Taca (E)
GOLLAN-TAM CopaAvianca-
Taca
GOLLAN-TAM
51.9
CopaAvianca-
Taca
GOLLAN-TAM
33.8
11.36.4
$2.1
$0.9
$0.4 $0.4
62 5851
$11.0
$4.0
120
$2.6$1.4
Source: Company reports and Airline Business
Destinos
Número de ciudades
Pasajeros
Millones, 2010
Ingresos
USD Billones, 2010
EBITDAR
USD Billones, 2010
CopaAvianca-
Taca (E)
GOLLAN-TAM
CopaAvianca-
Taca (E)
GOLLAN-TAM CopaAvianca-
Taca
GOLLAN-TAM
51.9
CopaAvianca-
Taca
GOLLAN-TAM
33.8
11.36.4
$2.1
$0.9
$0.4 $0.4
62 5851
$11.0
$4.0
120
$2.6$1.4
RevenuesUSD Billions, 2010
EBITDARUSD Billions, 2010

|
… offering the best connectivity…
11
Destinos
Númerode ciudades
Pasajeros
Millones, 2010
Ingresos
USD Billones, 2010
EBITDAR
USD Billones, 2010
CopaAvianca-
Taca (E)
GOLLAN-TAM
CopaAvianca-
Taca (E)
GOLLAN-TAM CopaAvianca-
Taca
GOLLAN-TAM
51.9
CopaAvianca-
Taca
GOLLAN-TAM
33.8
11.36.4
$2.1
$0.9
$0.4 $0.4
62 5851
$11.0
$4.0
120
$2.6$1.4
Buenos AiresSantiago
Lima
Guayaquil
Bogotá
Rio de Janeiro
Sao Paulo
Belo Horizonte
Salvador
Brasilia
LAN Hubs
TAM Hubs
Source: Company reports and Airline Business
Destinos
Número de ciudades
Pasajeros
Millones, 2010
Ingresos
USD Billones, 2010
EBITDAR
USD Billones, 2010
CopaAvianca-
Taca (E)
GOLLAN-TAM
CopaAvianca-
Taca (E)
GOLLAN-TAM CopaAvianca-
Taca
GOLLAN-TAM
51.9
CopaAvianca-
Taca
GOLLAN-TAM
33.8
11.36.4
$2.1
$0.9
$0.4 $0.4
62 5851
$11.0
$4.0
120
$2.6$1.4
DestinationsNumber of cities, 2010
PassengersMillions, 2010

|
… with strong presence in domestic markets…
12
ASKs
Source: OAG
Note: Information as of 2010
AerolíneasArgentinas
LATAM
LATAM
Avianca -TACA
TAME
LATAM
LATAM
GOL
SkyAirline
LATAM
Avianca -TACA
PeruvianCopa
LATAM
Avianca -TACA
SAMIcaro
0%
20%
40%
60%
80%
100%
Argentina Brazil Chile Colombia Ecuador Peru
|
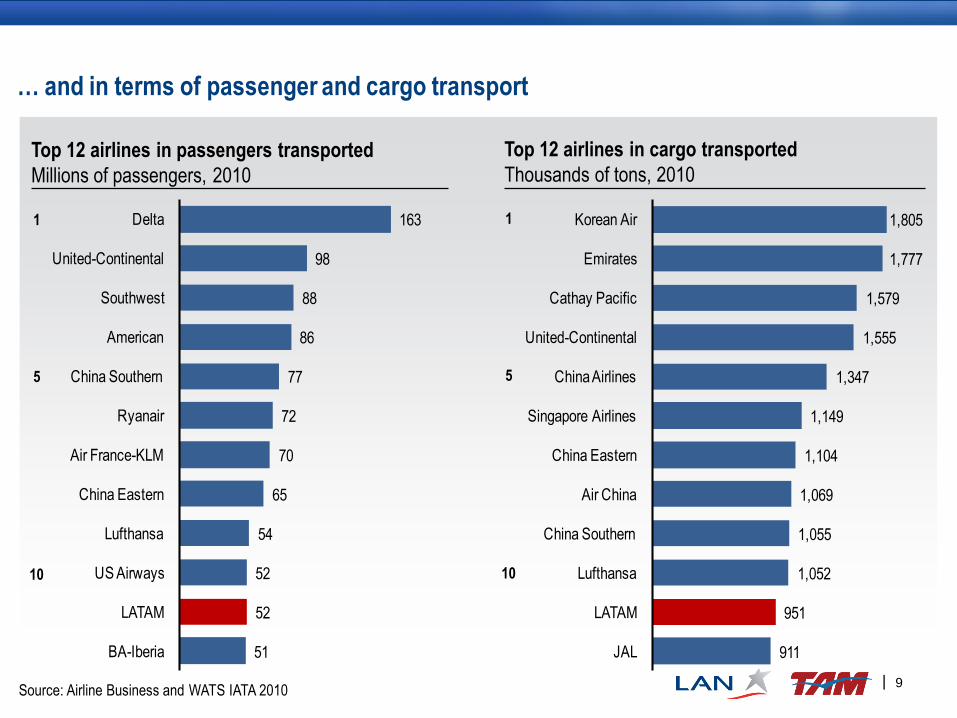
… and connecting South America with the world
13
ASKs
Source: OAG
Note: Information as of 2010
LATAM
AmericanBA - Iberia
Avianca - TACA
LATAM
Air France - KLM
GOL
United - Continental
LATAM
Aerolíneas ArgentinasDelta
TAP
Pluna Avianca - TACA
Lufthansa - Swiss
Others Others
AlitaliaAvianca - TACA
Air Europa
Others
0%
20%
40%
60%
80%
100%
WithinSouth America
USA andCanada
Europe

|
LATAM will have a globally competitive frequent flyer program
14
67,0
20,0
17,0
11,1
6,6 5,5 4,5 4,5 3,82,0
Members
(millions)
Source: frequentflyersservices.com

|
Opportunities for the group to grow faster and increase profitability
▪ Faster top-line growth
- Enhances ability to launch new flights
- Increases alternatives for passenger
and cargo clients, capturing new
customers
▪ Improved cost competitiveness
- Benefits from best practice sharing
- Operational coordination in
international markets
- Possibility to leverage economies of
scale
▪ Enhanced strategic positioning
- Creates the leading Latin American
carrier
- Better able to compete with other
global carriers15

| 16
Synergy
source
New service, sharing of best
practices
Improved access to joint hubs and
combined network appeal
(especially to high yield)
Combined network supports new
flights and hubs
Including consolidation of partner airline contracts and increased utilization
Consolidation of the programs and
sharing of best practices
Value
US$ Millions
Combined network creates new city
pairs and increased service
Synergy
source
Value
US$ Millions
Revenue: Cargo ~$110M, Pax ~$170M Cost ~$120M
10
35
New and
increased
connectivity
Frequent
flyer
New
flights
35
Other
passenger
revenue
40
Cargo 110
50Network
relevanceProcurement
15
25
Airports 25
Sales
20
20
15
Corporate
IT
Maintenance
Consolidation of functions in
overlapping stations
Leveraging economies of scale in
contracts
Streamlining of corporate overhead
and some functions
Efficiency of combined sales efforts
Efficiencies of common IT platforms
Leveraging economies and
efficiencies of scale
Detailing the estimated US ~$400M in synergies

|
LATAM will have the ability to grow into new markets
Brazil to Europe/Africa
Lima to North/Central America
New hubs
Four primary growth areas for the network initially…
Increased southern cone feed to support new service to Europe
Increased Brazil feed supports new service to US and Mexico
Potential new hubs could connect to Europe and US
Cargo Combination of LAN’s expertise and TAM’s footprint
Future growth
would result in
the creation of
jobs and
economic
growth in Latin
American
countries
where LATAM
will operate
17
3
1
4
2
1
2
3
4

|
Corporate Structure
18Note: assuming 100% participation of TAM shareholders in the exchange offer
LATAM AIRLINES GROUP(Currently LAN)
Chile
TAM S.A.Brazil
HoldCoChile
TAM Controlling shareholders
13.7%
LAN Controlling shareholders
24.1%
Others LAN46.7%
100% ON Shares
Others TAM15.5%
100% PN Shares
80% Class A Shares(voting)
20% Class A Shares (voting)100% Class B Shares (non voting)
PantanalBrazil
TLABrazil
100% 100%
Stock transaction: TAM shareholders
are offered newly issued LAN shares
(1 TAM = 0.9 LAN)
Structure designed to comply with
foreign ownership restrictions,
including 20% foreign ownership
restriction in Brazil
Economic alignment of all
shareholders

|
Corporate governance
19
▪ Shareholders’ agreements between the two companies provide for:
- LATAM board to have 9 members.
- Grupo Cueto agrees to vote for TEP Chile (Grupo Amaro) to be able to elect a second board member at LATAM, while TEP
Chile holds at least12.5% of LATAM.
- Grupo Cueto and Grupo Amaro agree to make their best effort to work cooperatively. When agreements cannot be reached,
matters shall be resolved by the Board or Ordinary Shareholders’ Meetings of LATAM.
- During the first 3 years, neither Grupo Cueto nor Grupo Amaro may reduce their holdings of LATAM to less than12.5% of
total. After this period, sales are subject to certain conditions. LAN shall have a right of first offer on shares in Holdco 1.
Grupo Amaro may not sell shares in LATAM without offering LAN the shares in Holdco 1.
- Inasmuch as is permitted under Brazilian legislation, LAN has the right to accrue most voting shares in Holdco 1.
- Boards of TAM and Holdco 1 with 6 members, 4 to be appointed by Grupo Amaro and 2 by LATAM.
- Voting quorum for TAM of 95% for shareholders’ meetings, and 5 members for board meetings. For significant issues,
quorum to require one LATAM board member in Holdco 1 and TAM.
- Grupo Amaro and LATAM may appoint the same number of board members in Multiplus.
- Selection of key executives in TAM requires coordination with the board of LATAM.
- Enrique Cueto to be CEO of LATAM, Marco Bologna to be CEO of TAM.

|
Milestones in the business combination process
20
January 18, 2011:
LAN and TAM signed binding agreements
August 13, 2010:
LAN and TAM announce their intentions to
combine
March 1, 2011:
ANAC approved the proposed
corporate structure
AntitrustEurope
Germany(Jul 2011)
Italy (Aug 2011)
Spain (Oct 2011)
AntitrustBrazil
SEAE (Aug 2011)
SDE (Aug 2011)
CADE (pending)
AntitrustChile:
TDLC (Sep 2011)
Supreme Court
(pending)
November 15, 2011:
F4 SEC filing(preliminary
version)

|
Antitrust measures imposed by TDLC
21
1. Exchange of 4 slots at GRU airport
2. Extend the frequent flyer program by 36 months
for other operators on routes between SCL and
SAO, RIO, ASU, MVD
3. Interline agreement with other operators on routes
between SCL and SAO, RIO, ASU, for 12 months
after compliance with measure 1
4. Not to increase, for a 12 month period, SCL-GRU
service within 15 minutes before or after the slots
exchanged under measure 1
5. Changes in domestic self regulation plan in Chile
6. Agree a sole alliance for LATAM
7. Codeshare agreements outside of the alliance
selected must be approved by TDLC, and may
not be conducted in South America with GOL
or Avianca-TACA
8. Provide four regular flights on the SCL – LIM –
USA route that make use of the 5th freedom of
the air between Peru and the USA
9. Support unilateral cabotage in Chile
10. Support expansion and development of airport
facilities at SCL and GRU
11. Restrictions on travel agency incentive plans
12. Maintain current frequencies of non-stop flights
from Chile to USA (12) and Europe (7) up tuntil
compliance with measures1,6,7, and 8
13. Freeze freight tariffs between Chile and Brazil, and
not to increase the average yield of passengers
per cabin on the SCL-SAO and SCL-RIO routes up
until compliance with measure 1
14. Contract a consultant to review compliance
with the measures
Measures appealed to the Supreme Court

|
Process in Chile
TDLC Approval *
LAN's Shareholder Meeting *
SVS Registration *
Process in USA
F4 Filing *
SEC Registration *
Process in Brazil
CADE Approval
Exchange Rate Appraisal *
BDR Registration (Bovespa) *
CVM Registration
Start of Exchange Offer
End of Exchange Offer
Mar 2012 Apr 2012Sep 2011 Oct 2011 Nov 2011 Dec 2011 Jan 2012 Feb 2012
Estimated merger timeline
22Steps completed
Steps pending