Embed Size (px)
Citation preview
Investor PresentationJune 2021
Company Information
FORWARD LOOKING STATEMENTS
This presentation includes “forward looking statements” within the meaning
of federal securities laws. All statements, other than statements of
historical fact, included in this presentation are forward looking statements,
including statements regarding the Partnership’s future results of
operations or ability to generate income or cash flow, make acquisitions, or
make distributions to unitholders. Words such as “anticipate,” “project,”
“expect,” “plan,” “goal,” “forecast,” “intend,” “could,” “believe,” “may” and
similar expressions and statements are intended to identify forward-looking
statements. Although management believes that the expectations on
which such forward-looking statements are based are reasonable, neither
the Partnership nor its general partner can give assurances that such
expectations will prove to be correct. Forward looking statements rely on
assumptions concerning future events and are subject to a number of
uncertainties, factors and risks, many of which are outside of
management’s ability to control or predict. If one or more of these risks or
uncertainties materialize, or if underlying assumptions prove incorrect, the
Partnership’s actual results may vary materially from those anticipated,
estimated, projected or expected.
Additional information concerning these and other factors that could impact
the Partnership can be found in Part I, Item 1A, “Risk Factors” of the
Partnership’s Annual Report on Form 10-K for the year ended March 31,
2021 and in the other reports it files from time to time with the Securities
and Exchange Commission.
Readers are cautioned not to place undue reliance on any forward-looking
statements contained in this presentation, which reflect management’s
opinions only as of the date hereof. Except as required by law, the
Partnership undertakes no obligation to revise or publicly update any
forward-looking statement.
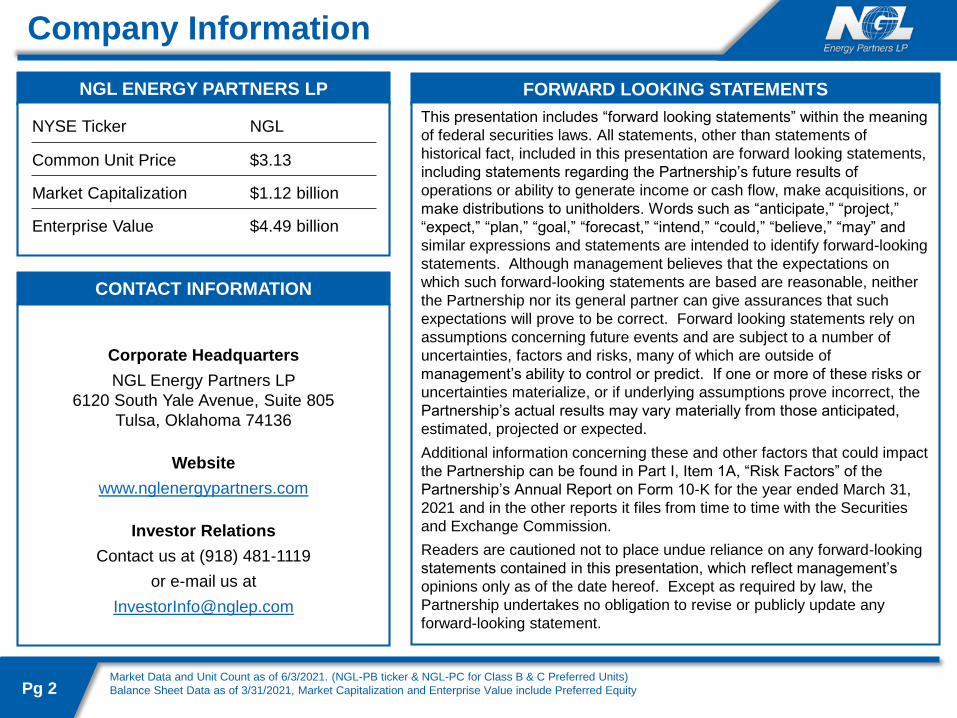
NGL ENERGY PARTNERS LP
NYSE Ticker NGL
Common Unit Price $3.13
Market Capitalization $1.12 billion
Enterprise Value $4.49 billion
CONTACT INFORMATION
Corporate Headquarters
NGL Energy Partners LP
6120 South Yale Avenue, Suite 805
Tulsa, Oklahoma 74136
Website
www.nglenergypartners.com
Investor Relations
Contact us at (918) 481-1119
or e-mail us at
Pg 2Market Data and Unit Count as of 6/3/2021. (NGL-PB ticker & NGL-PC for Class B & C Preferred Units)
Balance Sheet Data as of 3/31/2021, Market Capitalization and Enterprise Value include Preferred Equity
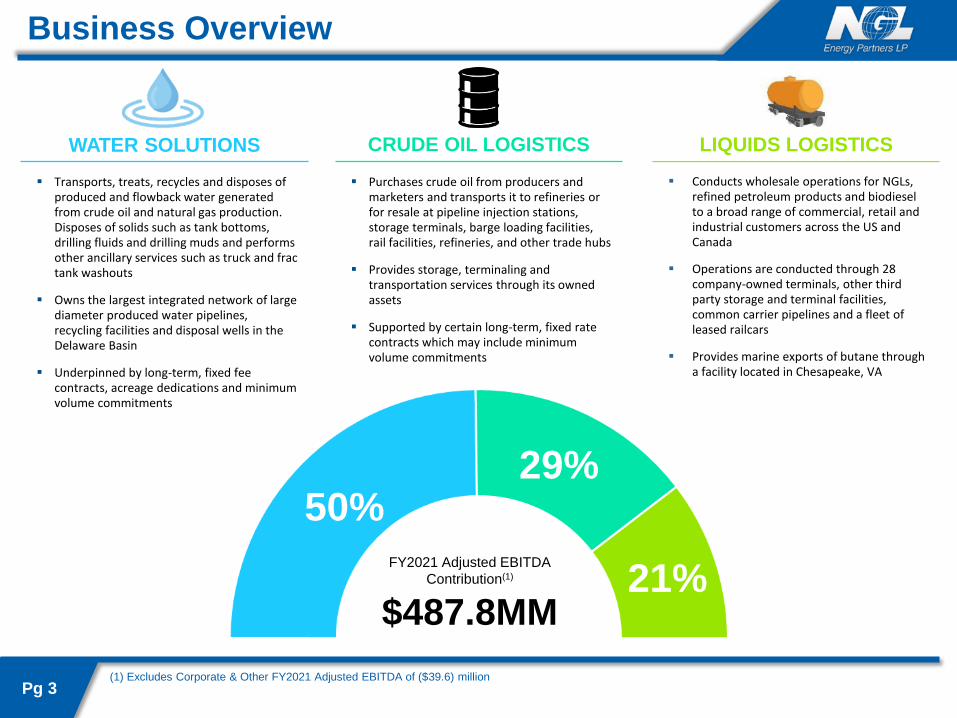
Business Overview
FY2021 Adjusted EBITDA
Contribution(1)
$487.8MM
WATER SOLUTIONS CRUDE OIL LOGISTICS LIQUIDS LOGISTICS
▪ Transports, treats, recycles and disposes of produced and flowback water generated from crude oil and natural gas production. Disposes of solids such as tank bottoms, drilling fluids and drilling muds and performs other ancillary services such as truck and frac tank washouts
▪ Owns the largest integrated network of large diameter produced water pipelines, recycling facilities and disposal wells in the Delaware Basin
▪ Underpinned by long-term, fixed fee contracts, acreage dedications and minimum volume commitments
▪ Purchases crude oil from producers and marketers and transports it to refineries or for resale at pipeline injection stations, storage terminals, barge loading facilities, rail facilities, refineries, and other trade hubs
▪ Provides storage, terminaling and transportation services through its owned assets
▪ Supported by certain long-term, fixed rate contracts which may include minimum volume commitments
▪ Conducts wholesale operations for NGLs, refined petroleum products and biodiesel to a broad range of commercial, retail and industrial customers across the US and Canada
▪ Operations are conducted through 28 company-owned terminals, other third party storage and terminal facilities, common carrier pipelines and a fleet of leased railcars
▪ Provides marine exports of butane through a facility located in Chesapeake, VA
Pg 3(1) Excludes Corporate & Other FY2021 Adjusted EBITDA of ($39.6) million
50%29%
21%
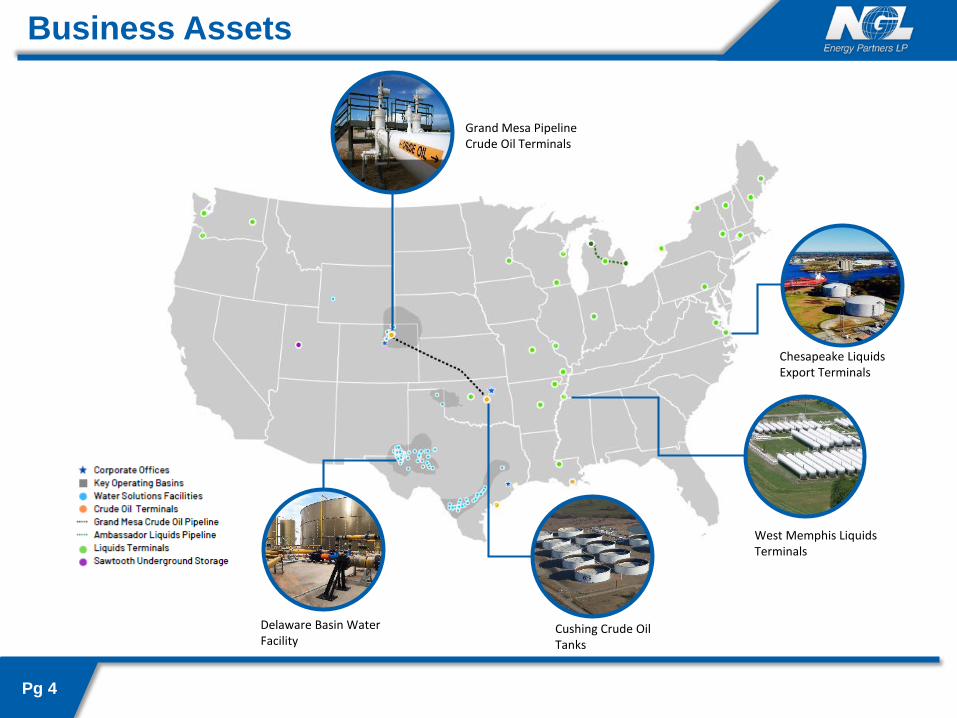
Business Assets
Pg 4
Grand Mesa Pipeline Crude Oil Terminals
Chesapeake Liquids Export Terminals
West Memphis Liquids Terminals
Cushing Crude Oil Tanks
Delaware Basin Water Facility
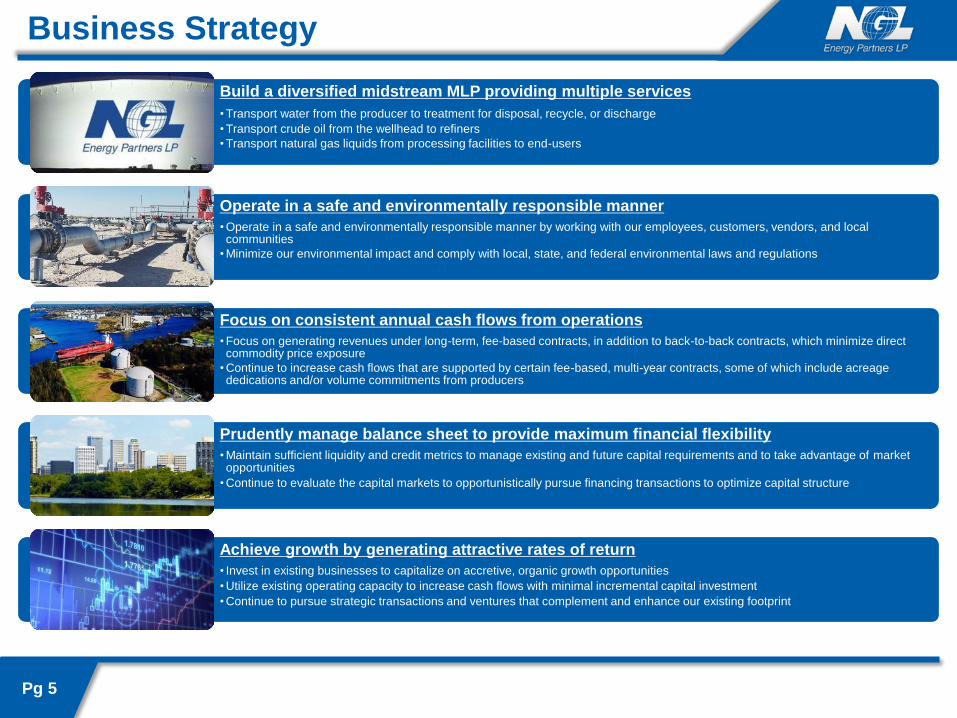
Business Strategy
Build a diversified midstream MLP providing multiple services
• Transport water from the producer to treatment for disposal, recycle, or discharge
• Transport crude oil from the wellhead to refiners
• Transport natural gas liquids from processing facilities to end-users
Operate in a safe and environmentally responsible manner
• Operate in a safe and environmentally responsible manner by working with our employees, customers, vendors, and local communities
• Minimize our environmental impact and comply with local, state, and federal environmental laws and regulations
Focus on consistent annual cash flows from operations
• Focus on generating revenues under long-term, fee-based contracts, in addition to back-to-back contracts, which minimize direct commodity price exposure
• Continue to increase cash flows that are supported by certain fee-based, multi-year contracts, some of which include acreage dedications and/or volume commitments from producers
Prudently manage balance sheet to provide maximum financial flexibility
• Maintain sufficient liquidity and credit metrics to manage existing and future capital requirements and to take advantage of market opportunities
• Continue to evaluate the capital markets to opportunistically pursue financing transactions to optimize capital structure
Achieve growth by generating attractive rates of return
• Invest in existing businesses to capitalize on accretive, organic growth opportunities
• Utilize existing operating capacity to increase cash flows with minimal incremental capital investment
• Continue to pursue strategic transactions and ventures that complement and enhance our existing footprint
Pg 5
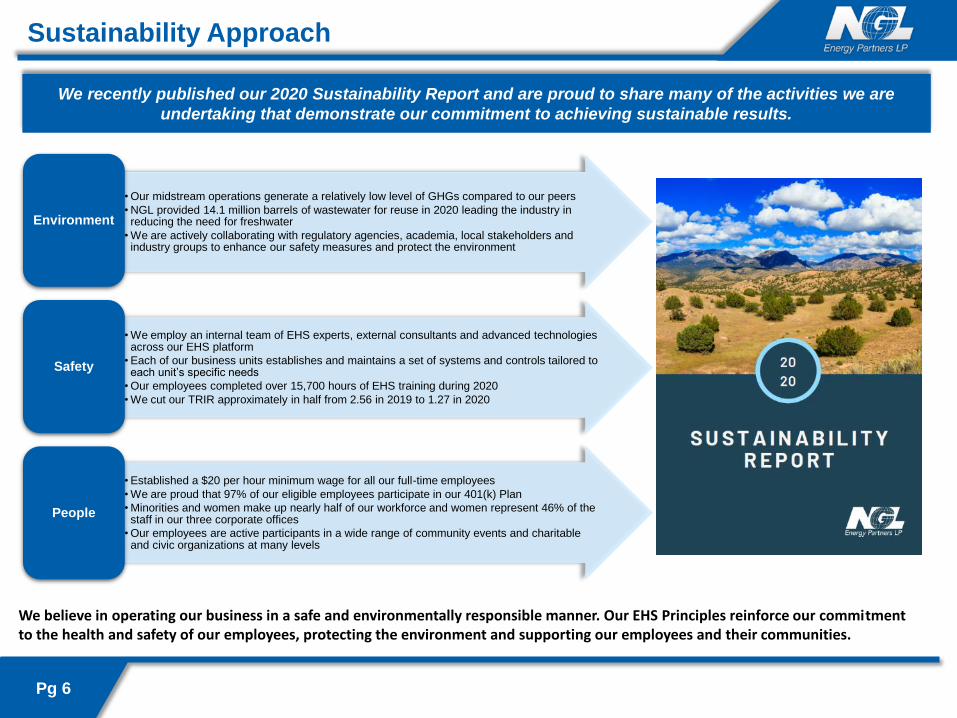
Pg 6
• Our midstream operations generate a relatively low level of GHGs compared to our peers
• NGL provided 14.1 million barrels of wastewater for reuse in 2020 leading the industry in reducing the need for freshwater
• We are actively collaborating with regulatory agencies, academia, local stakeholders and industry groups to enhance our safety measures and protect the environment
Environment
• We employ an internal team of EHS experts, external consultants and advanced technologies across our EHS platform
• Each of our business units establishes and maintains a set of systems and controls tailored to each unit’s specific needs
• Our employees completed over 15,700 hours of EHS training during 2020
• We cut our TRIR approximately in half from 2.56 in 2019 to 1.27 in 2020
Safety
• Established a $20 per hour minimum wage for all our full-time employees
• We are proud that 97% of our eligible employees participate in our 401(k) Plan
• Minorities and women make up nearly half of our workforce and women represent 46% of the staff in our three corporate offices
• Our employees are active participants in a wide range of community events and charitable and civic organizations at many levels
People
We recently published our 2020 Sustainability Report and are proud to share many of the activities we are
undertaking that demonstrate our commitment to achieving sustainable results.
We believe in operating our business in a safe and environmentally responsible manner. Our EHS Principles reinforce our commitment to the health and safety of our employees, protecting the environment and supporting our employees and their communities.
Sustainability Approach
Segment Overview
Pg 7
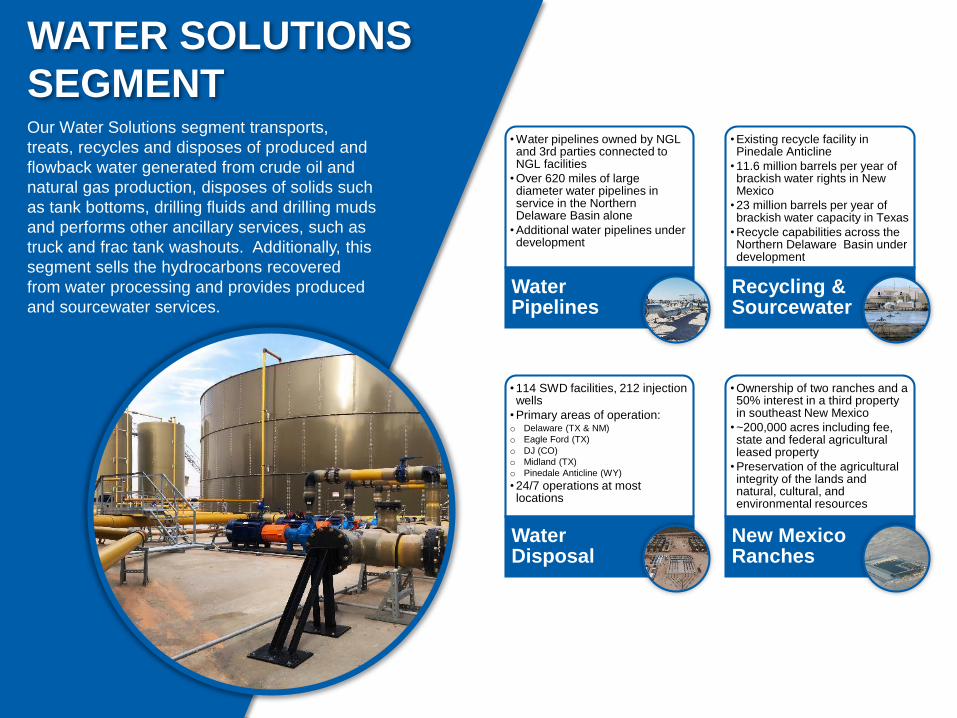
WATER SOLUTIONS
SEGMENTOur Water Solutions segment transports,
treats, recycles and disposes of produced and
flowback water generated from crude oil and
natural gas production, disposes of solids such
as tank bottoms, drilling fluids and drilling muds
and performs other ancillary services, such as
truck and frac tank washouts. Additionally, this
segment sells the hydrocarbons recovered
from water processing and provides produced
and sourcewater services.
• Water pipelines owned by NGL and 3rd parties connected to NGL facilities
• Over 620 miles of large diameter water pipelines in service in the Northern Delaware Basin alone
• Additional water pipelines under development
Water Pipelines
• Existing recycle facility in Pinedale Anticline
• 11.6 million barrels per year of brackish water rights in New Mexico
• 23 million barrels per year of brackish water capacity in Texas
• Recycle capabilities across the Northern Delaware Basin under development
Recycling & Sourcewater
• 114 SWD facilities, 212 injection wells
• Primary areas of operation:o Delaware (TX & NM)
o Eagle Ford (TX)
o DJ (CO)
o Midland (TX)
o Pinedale Anticline (WY)
• 24/7 operations at most locations
Water Disposal
• Ownership of two ranches and a 50% interest in a third property in southeast New Mexico
• ~200,000 acres including fee, state and federal agricultural leased property
• Preservation of the agricultural integrity of the lands and natural, cultural, and environmental resources
New Mexico Ranches
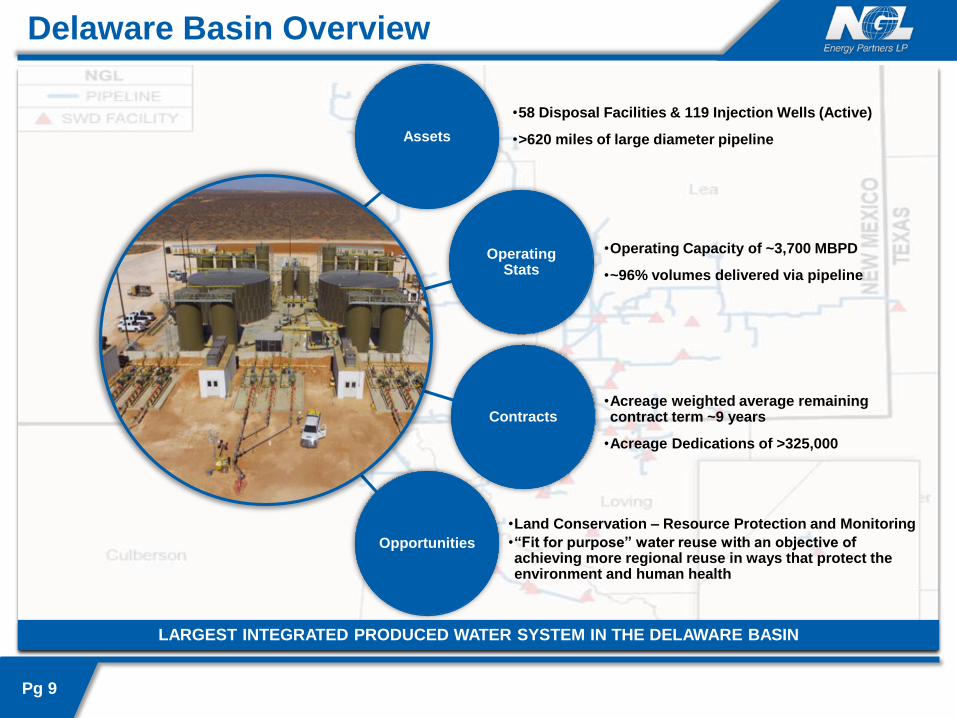
Delaware Basin Overview
Pg 9
LARGEST INTEGRATED PRODUCED WATER SYSTEM IN THE DELAWARE BASIN
Assets
•58 Disposal Facilities & 119 Injection Wells (Active)
•>620 miles of large diameter pipeline
Operating Stats
•Operating Capacity of ~3,700 MBPD
•~96% volumes delivered via pipeline
Contracts•Acreage weighted average remaining contract term ~9 years
•Acreage Dedications of >325,000
Opportunities
•Land Conservation – Resource Protection and Monitoring
•“Fit for purpose” water reuse with an objective of achieving more regional reuse in ways that protect the environment and human health
$-
$0.10
$0.20
$0.30
$0.40
$0.50
$0.60
$0.70
Q1FY17
Q2FY17
Q3FY17
Q4FY17
Q1FY18
Q2FY18
Q3FY18
Q4FY18
Q1FY19
Q2FY19
Q3FY19
Q4FY19
Q1FY20
Q2FY20
Q3FY20
Q4FY20
Q1FY21
Q2FY21
Q3FY21
Q4FY21
0
500,000
1,000,000
1,500,000
2,000,000
FY17Q1
FY17Q2
FY17Q3
FY17Q4
FY18Q1
FY18Q2
FY18Q3
FY18Q4
FY19Q1
FY19Q2
FY19Q3
FY19Q4
FY20Q1
FY20Q2
FY20Q3
FY20Q4
FY21Q1
FY21Q2
FY21Q3
FY21Q4
Disposal BBLs/Day
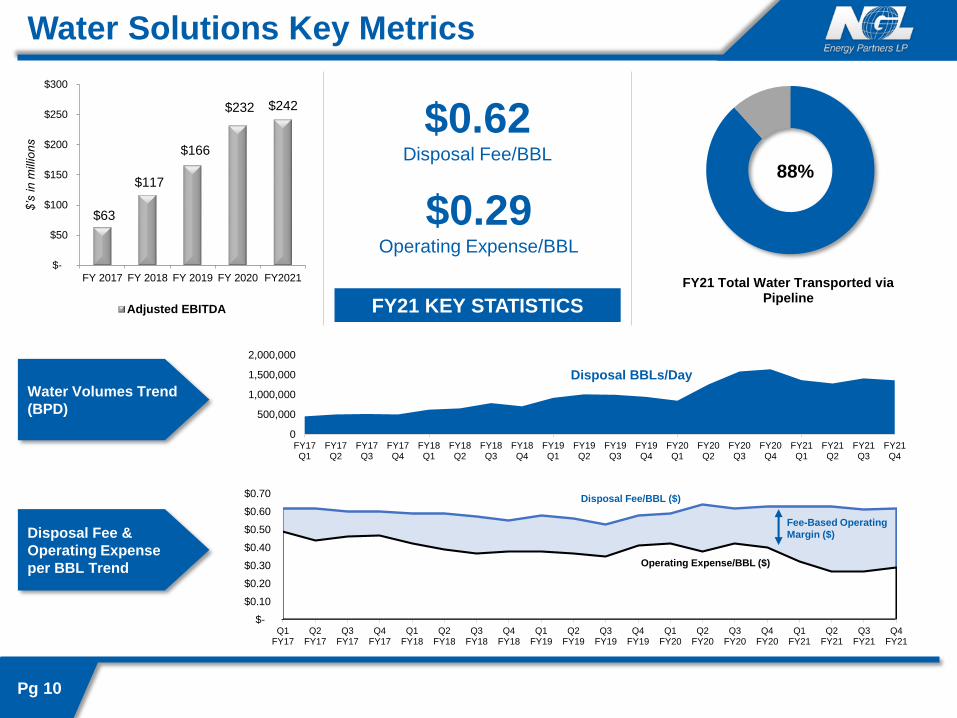
Water Solutions Key Metrics
$0.62Disposal Fee/BBL
88%
FY21 Total Water Transported via Pipeline
Water Volumes Trend
(BPD)
Disposal Fee &
Operating Expense
per BBL Trend
Pg 10
$0.29Operating Expense/BBL
Operating Expense/BBL ($)
Disposal Fee/BBL ($)
$63
$117
$166
$232 $242
$-
$50
$100
$150
$200
$250
$300
FY 2017 FY 2018 FY 2019 FY 2020 FY2021
$’s
in
mill
ion
s
Adjusted EBITDA
Fee-Based Operating
Margin ($)
FY21 KEY STATISTICS
CRUDE OIL LOGISTICS
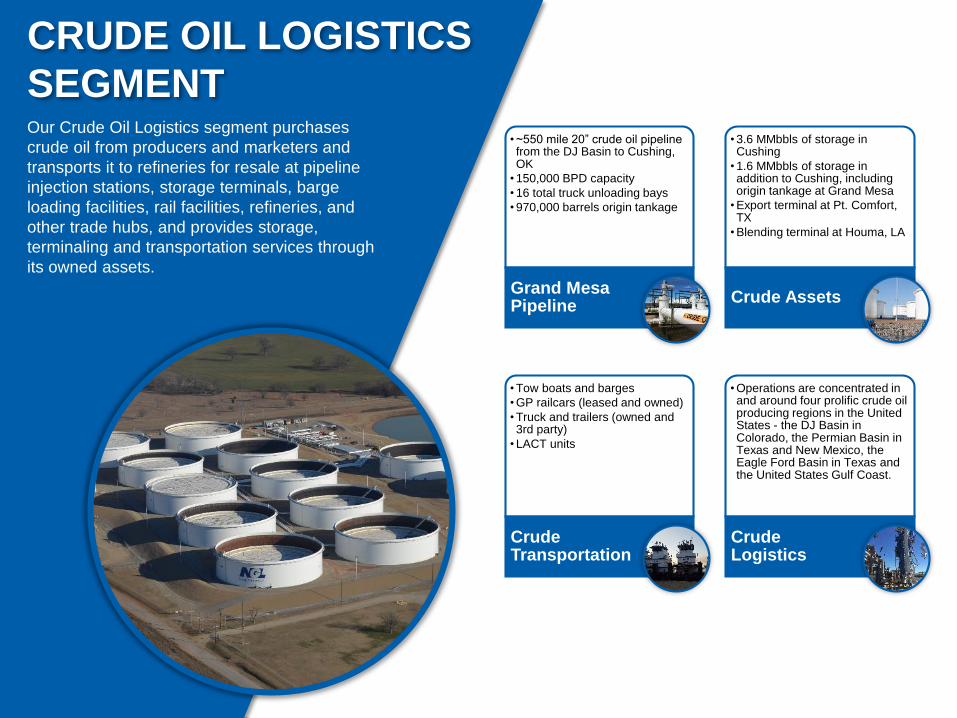
SEGMENTOur Crude Oil Logistics segment purchases
crude oil from producers and marketers and
transports it to refineries for resale at pipeline
injection stations, storage terminals, barge
loading facilities, rail facilities, refineries, and
other trade hubs, and provides storage,
terminaling and transportation services through
its owned assets.
• ~550 mile 20” crude oil pipeline from the DJ Basin to Cushing, OK
• 150,000 BPD capacity
• 16 total truck unloading bays
• 970,000 barrels origin tankage
Grand Mesa Pipeline
• 3.6 MMbbls of storage in Cushing
• 1.6 MMbbls of storage in addition to Cushing, including origin tankage at Grand Mesa
• Export terminal at Pt. Comfort, TX
• Blending terminal at Houma, LA
Crude Assets
• Tow boats and barges
• GP railcars (leased and owned)
• Truck and trailers (owned and 3rd party)
• LACT units
Crude Transportation
• Operations are concentrated in and around four prolific crude oil producing regions in the United States - the DJ Basin in Colorado, the Permian Basin in Texas and New Mexico, the Eagle Ford Basin in Texas and the United States Gulf Coast.
Crude Logistics
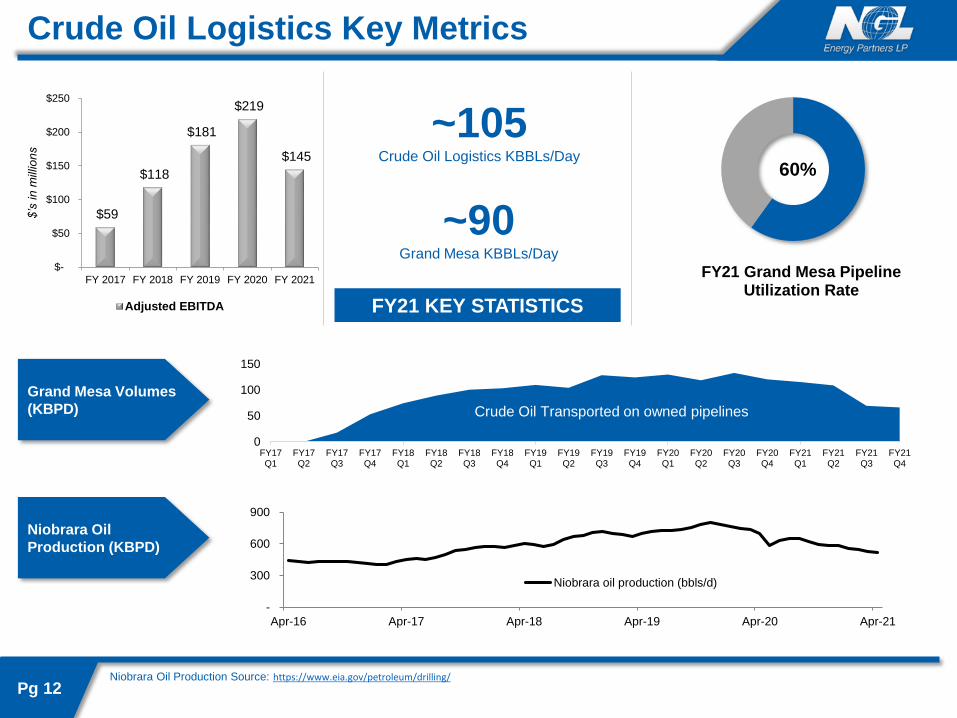
~105Crude Oil Logistics KBBLs/Day
-
300
600
900
Apr-16 Apr-17 Apr-18 Apr-19 Apr-20 Apr-21
Niobrara oil production (bbls/d)
Crude Oil Logistics Key Metrics
Grand Mesa Volumes
(KBPD)
Niobrara Oil
Production (KBPD)
60%
FY21 Grand Mesa Pipeline Utilization Rate
Pg 12Niobrara Oil Production Source: https://www.eia.gov/petroleum/drilling/
$59
$118
$181
$219
$145
$-
$50
$100
$150
$200
$250
FY 2017 FY 2018 FY 2019 FY 2020 FY 2021
$’s
in
mill
ion
s
Adjusted EBITDA
~90Grand Mesa KBBLs/Day
FY21 KEY STATISTICS
0
50
100
150
FY17Q1
FY17Q2
FY17Q3
FY17Q4
FY18Q1
FY18Q2
FY18Q3
FY18Q4
FY19Q1
FY19Q2
FY19Q3
FY19Q4
FY20Q1
FY20Q2
FY20Q3
FY20Q4
FY21Q1
FY21Q2
FY21Q3
FY21Q4
Crude Oil Transported on owned pipelines
LIQUIDS LOGISTICS
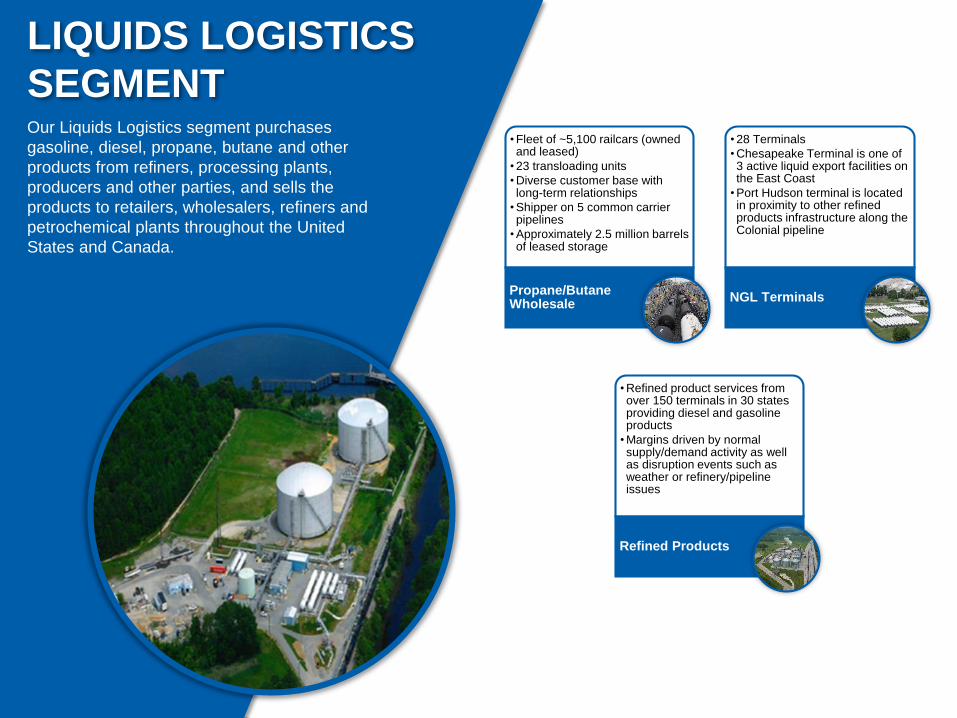
SEGMENTOur Liquids Logistics segment purchases
gasoline, diesel, propane, butane and other
products from refiners, processing plants,
producers and other parties, and sells the
products to retailers, wholesalers, refiners and
petrochemical plants throughout the United
States and Canada.
• Fleet of ~5,100 railcars (owned and leased)
• 23 transloading units
• Diverse customer base with long-term relationships
• Shipper on 5 common carrier pipelines
• Approximately 2.5 million barrels of leased storage
Propane/Butane Wholesale
• 28 Terminals
• Chesapeake Terminal is one of 3 active liquid export facilities on the East Coast
• Port Hudson terminal is located in proximity to other refined products infrastructure along the Colonial pipeline
NGL Terminals
• Refined product services from over 150 terminals in 30 states providing diesel and gasoline products
• Margins driven by normal supply/demand activity as well as disruption events such as weather or refinery/pipeline issues
Refined Products
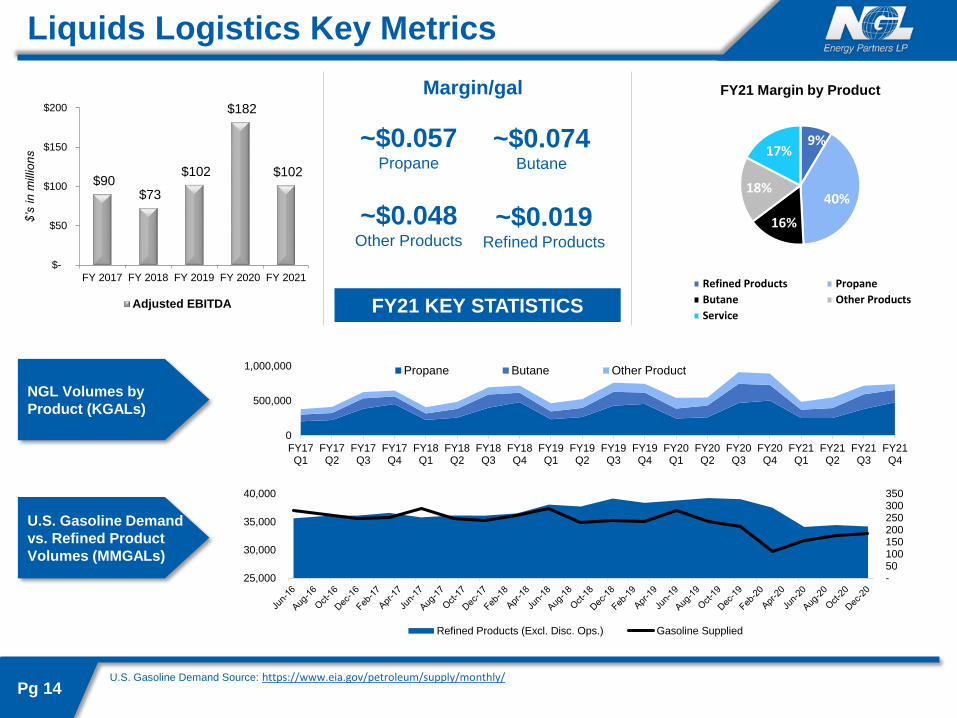
Liquids Logistics Key Metrics
9%
40%
16%
18%
17%
FY21 Margin by Product
Refined Products Propane
Butane Other Products
Service
~$0.057Propane
~$0.074Butane
~$0.048Other Products
NGL Volumes by
Product (KGALs)
U.S. Gasoline Demand
vs. Refined Product
Volumes (MMGALs)
Pg 14U.S. Gasoline Demand Source: https://www.eia.gov/petroleum/supply/monthly/
$90 $73
$102
$182
$102
$-
$50
$100
$150
$200
FY 2017 FY 2018 FY 2019 FY 2020 FY 2021
$’s
in
mill
ion
s
Adjusted EBITDA FY21 KEY STATISTICS
0
500,000
1,000,000
FY17Q1
FY17Q2
FY17Q3
FY17Q4
FY18Q1
FY18Q2
FY18Q3
FY18Q4
FY19Q1
FY19Q2
FY19Q3
FY19Q4
FY20Q1
FY20Q2
FY20Q3
FY20Q4
FY21Q1
FY21Q2
FY21Q3
FY21Q4
Propane Butane Other Product
5,0006,0007,0008,0009,000
10,00011,000
Margin/gal
~$0.019Refined Products
- 50 100 150 200 250 300 350
25,000
30,000
35,000
40,000
Refined Products (Excl. Disc. Ops.) Gasoline Supplied
Financial Overview
Pg 15
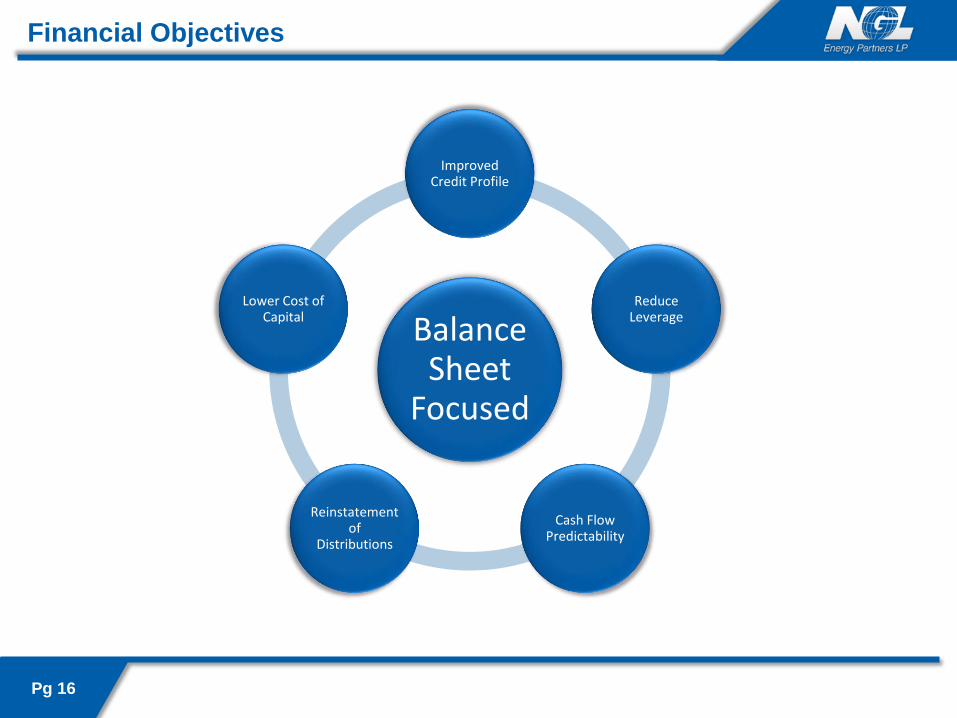
Balance Sheet
Focused
Improved Credit Profile
Reduce Leverage
Cash Flow Predictability
Reinstatement of
Distributions
Lower Cost of Capital
Pg 16
Financial Objectives
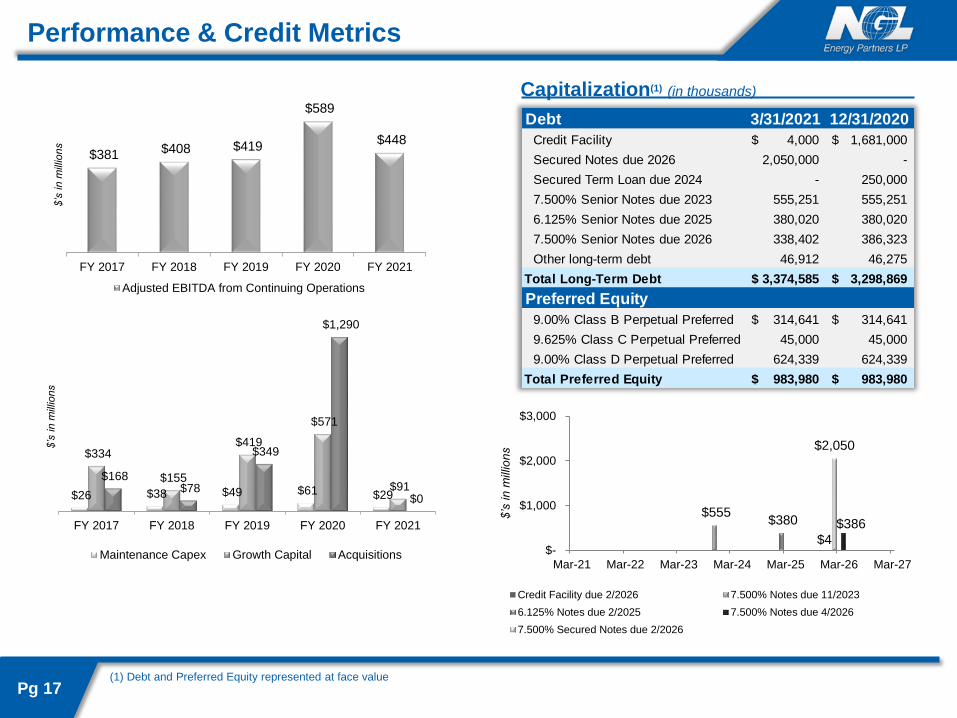
Debt 3/31/2021 12/31/2020
Credit Facility 4,000$ 1,681,000$
Secured Notes due 2026 2,050,000 -
Secured Term Loan due 2024 - 250,000
7.500% Senior Notes due 2023 555,251 555,251
6.125% Senior Notes due 2025 380,020 380,020
7.500% Senior Notes due 2026 338,402 386,323
Other long-term debt 46,912 46,275
Total Long-Term Debt 3,374,585$ 3,298,869$
Preferred Equity
9.00% Class B Perpetual Preferred 314,641$ 314,641$
9.625% Class C Perpetual Preferred 45,000 45,000
9.00% Class D Perpetual Preferred 624,339 624,339
Total Preferred Equity 983,980$ 983,980$
Performance & Credit Metrics
(1)
$4
$555 $380 $386
$2,050
$-
$1,000
$2,000
$3,000
Mar-21 Mar-22 Mar-23 Mar-24 Mar-25 Mar-26 Mar-27
$’s
in
mill
ion
s
Credit Facility due 2/2026 7.500% Notes due 11/2023
6.125% Notes due 2/2025 7.500% Notes due 4/2026
7.500% Secured Notes due 2/2026
Pg 17(1) Debt and Preferred Equity represented at face value
$381 $408 $419
$589
$448
FY 2017 FY 2018 FY 2019 FY 2020 FY 2021
$’s
in
mill
ions
Adjusted EBITDA from Continuing Operations
Capitalization(1) (in thousands)
$26 $38 $49 $61 $29
$334
$155
$419
$571
$91 $168
$78
$349
$1,290
$0
FY 2017 FY 2018 FY 2019 FY 2020 FY 2021
$’s
in
mill
ions
Maintenance Capex Growth Capital Acquisitions
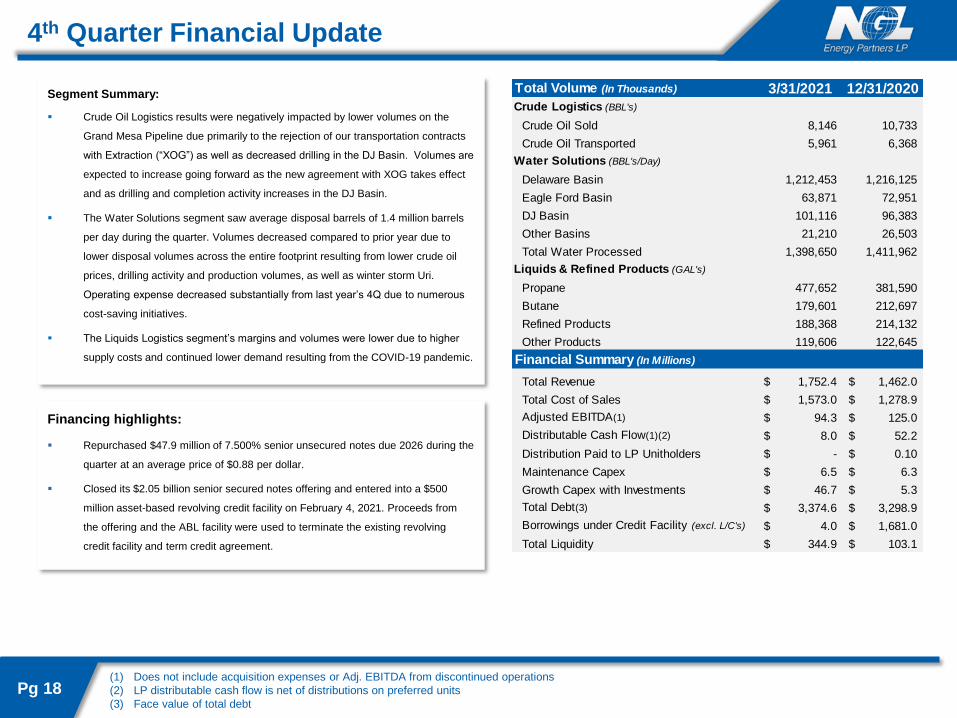
4th Quarter Financial Update
Segment Summary:
▪ Crude Oil Logistics results were negatively impacted by lower volumes on the
Grand Mesa Pipeline due primarily to the rejection of our transportation contracts
with Extraction (“XOG”) as well as decreased drilling in the DJ Basin. Volumes are
expected to increase going forward as the new agreement with XOG takes effect
and as drilling and completion activity increases in the DJ Basin.
▪ The Water Solutions segment saw average disposal barrels of 1.4 million barrels
per day during the quarter. Volumes decreased compared to prior year due to
lower disposal volumes across the entire footprint resulting from lower crude oil
prices, drilling activity and production volumes, as well as winter storm Uri.
Operating expense decreased substantially from last year’s 4Q due to numerous
cost-saving initiatives.
▪ The Liquids Logistics segment’s margins and volumes were lower due to higher
supply costs and continued lower demand resulting from the COVID-19 pandemic.
Financing highlights:
▪ Repurchased $47.9 million of 7.500% senior unsecured notes due 2026 during the
quarter at an average price of $0.88 per dollar.
▪ Closed its $2.05 billion senior secured notes offering and entered into a $500
million asset-based revolving credit facility on February 4, 2021. Proceeds from
the offering and the ABL facility were used to terminate the existing revolving
credit facility and term credit agreement.
Pg 18(1) Does not include acquisition expenses or Adj. EBITDA from discontinued operations
(2) LP distributable cash flow is net of distributions on preferred units
(3) Face value of total debt
Total Volume (In Thousands) 3/31/2021 12/31/2020
Crude Logistics (BBL's)
Crude Oil Sold 8,146 10,733
Crude Oil Transported 5,961 6,368
Water Solutions (BBL's/Day)
Delaware Basin 1,212,453 1,216,125
Eagle Ford Basin 63,871 72,951
DJ Basin 101,116 96,383
Other Basins 21,210 26,503
Total Water Processed 1,398,650 1,411,962
Liquids & Refined Products (GAL's)
Propane 477,652 381,590
Butane 179,601 212,697
Refined Products 188,368 214,132
Other Products 119,606 122,645
Financial Summary (In Millions)
Total Revenue 1,752.4$ 1,462.0$
Total Cost of Sales 1,573.0$ 1,278.9$
Adjusted EBITDA(1) 94.3$ 125.0$
Distributable Cash Flow(1)(2) 8.0$ 52.2$
Distribution Paid to LP Unitholders -$ 0.10$
Maintenance Capex 6.5$ 6.3$
Growth Capex with Investments 46.7$ 5.3$
Total Debt(3) 3,374.6$ 3,298.9$
Borrowings under Credit Facility (excl. L/C's) 4.0$ 1,681.0$
Total Liquidity 344.9$ 103.1$
Key Investment Highlights
Strategically Located and Attractive Asset Base✓
Vertical and Horizontal Integration✓
Diversified Cash Flows✓
Improving Credit Profile and Liquidity✓
Experienced & Incentivized Management Team✓
Pg 19
Appendix
Pg 20
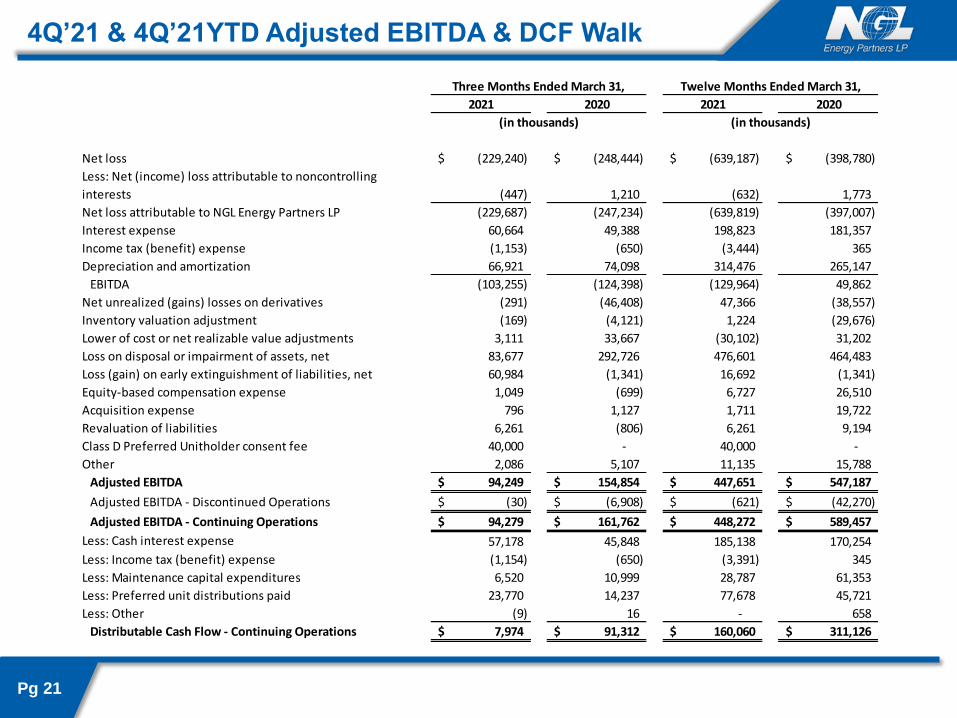
2021 2020 2021 2020
Net loss (229,240)$ (248,444)$ (639,187)$ (398,780)$
Less: Net (income) loss attributable to noncontrolling
interests (447) 1,210 (632) 1,773
Net loss attributable to NGL Energy Partners LP (229,687) (247,234) (639,819) (397,007)
Interest expense 60,664 49,388 198,823 181,357
Income tax (benefit) expense (1,153) (650) (3,444) 365
Depreciation and amortization 66,921 74,098 314,476 265,147
EBITDA (103,255) (124,398) (129,964) 49,862
Net unrealized (gains) losses on derivatives (291) (46,408) 47,366 (38,557)
Inventory valuation adjustment (169) (4,121) 1,224 (29,676)
Lower of cost or net realizable value adjustments 3,111 33,667 (30,102) 31,202
Loss on disposal or impairment of assets, net 83,677 292,726 476,601 464,483
Loss (gain) on early extinguishment of liabilities, net 60,984 (1,341) 16,692 (1,341)
Equity-based compensation expense 1,049 (699) 6,727 26,510
Acquisition expense 796 1,127 1,711 19,722
Revaluation of liabilities 6,261 (806) 6,261 9,194
Class D Preferred Unitholder consent fee 40,000 - 40,000 -
Other 2,086 5,107 11,135 15,788
Adjusted EBITDA 94,249$ 154,854$ 447,651$ 547,187$
Adjusted EBITDA - Discontinued Operations (30)$ (6,908)$ (621)$ (42,270)$
Adjusted EBITDA - Continuing Operations 94,279$ 161,762$ 448,272$ 589,457$
Less: Cash interest expense 57,178 45,848 185,138 170,254
Less: Income tax (benefit) expense (1,154) (650) (3,391) 345
Less: Maintenance capital expenditures 6,520 10,999 28,787 61,353
Less: Preferred unit distributions paid 23,770 14,237 77,678 45,721
Less: Other (9) 16 - 658
Distributable Cash Flow - Continuing Operations 7,974$ 91,312$ 160,060$ 311,126$
Three Months Ended March 31,
(in thousands)
Twelve Months Ended March 31,
(in thousands)
4Q’21 & 4Q’21YTD Adjusted EBITDA & DCF Walk
Pg 21
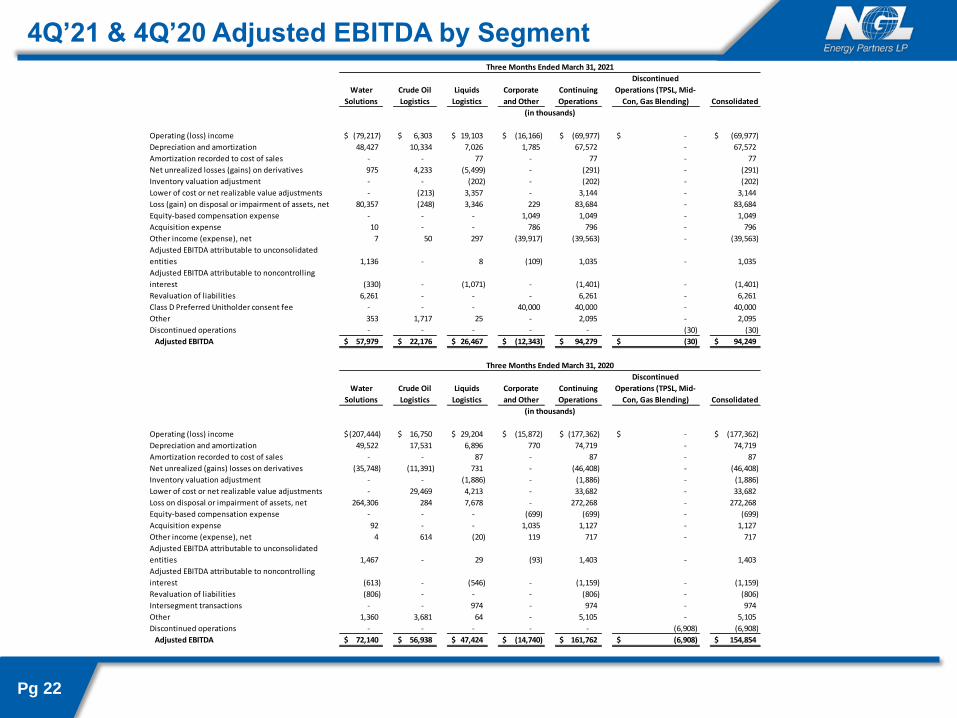
4Q’21 & 4Q’20 Adjusted EBITDA by Segment
Pg 22
Water
Solutions
Crude Oil
Logistics
Liquids
Logistics
Corporate
and Other
Continuing
Operations
Discontinued
Operations (TPSL, Mid-
Con, Gas Blending) Consolidated
Operating (loss) income (79,217)$ 6,303$ 19,103$ (16,166)$ (69,977)$ -$ (69,977)$
Depreciation and amortization 48,427 10,334 7,026 1,785 67,572 - 67,572
Amortization recorded to cost of sales - - 77 - 77 - 77
Net unrealized losses (gains) on derivatives 975 4,233 (5,499) - (291) - (291)
Inventory valuation adjustment - - (202) - (202) - (202)
Lower of cost or net realizable value adjustments - (213) 3,357 - 3,144 - 3,144
Loss (gain) on disposal or impairment of assets, net 80,357 (248) 3,346 229 83,684 - 83,684
Equity-based compensation expense - - - 1,049 1,049 - 1,049
Acquisition expense 10 - - 786 796 - 796
Other income (expense), net 7 50 297 (39,917) (39,563) - (39,563)
Adjusted EBITDA attributable to unconsolidated
entities 1,136 - 8 (109) 1,035 - 1,035
Adjusted EBITDA attributable to noncontrolling
interest (330) - (1,071) - (1,401) - (1,401)
Revaluation of liabilities 6,261 - - - 6,261 - 6,261
Class D Preferred Unitholder consent fee - - - 40,000 40,000 - 40,000
Other 353 1,717 25 - 2,095 - 2,095
Discontinued operations - - - - - (30) (30)
Adjusted EBITDA 57,979$ 22,176$ 26,467$ (12,343)$ 94,279$ (30)$ 94,249$
Water
Solutions
Crude Oil
Logistics
Liquids
Logistics
Corporate
and Other
Continuing
Operations
Discontinued
Operations (TPSL, Mid-
Con, Gas Blending) Consolidated
Operating (loss) income (207,444)$ 16,750$ 29,204$ (15,872)$ (177,362)$ -$ (177,362)$
Depreciation and amortization 49,522 17,531 6,896 770 74,719 - 74,719
Amortization recorded to cost of sales - - 87 - 87 - 87
Net unrealized (gains) losses on derivatives (35,748) (11,391) 731 - (46,408) - (46,408)
Inventory valuation adjustment - - (1,886) - (1,886) - (1,886)
Lower of cost or net realizable value adjustments - 29,469 4,213 - 33,682 - 33,682
Loss on disposal or impairment of assets, net 264,306 284 7,678 - 272,268 - 272,268
Equity-based compensation expense - - - (699) (699) - (699)
Acquisition expense 92 - - 1,035 1,127 - 1,127
Other income (expense), net 4 614 (20) 119 717 - 717
Adjusted EBITDA attributable to unconsolidated
entities 1,467 - 29 (93) 1,403 - 1,403
Adjusted EBITDA attributable to noncontrolling
interest (613) - (546) - (1,159) - (1,159)
Revaluation of liabilities (806) - - - (806) - (806)
Intersegment transactions - - 974 - 974 - 974
Other 1,360 3,681 64 - 5,105 - 5,105
Discontinued operations - - - - - (6,908) (6,908)
Adjusted EBITDA 72,140$ 56,938$ 47,424$ (14,740)$ 161,762$ (6,908)$ 154,854$
(in thousands)
(in thousands)
Three Months Ended March 31, 2021
Three Months Ended March 31, 2020
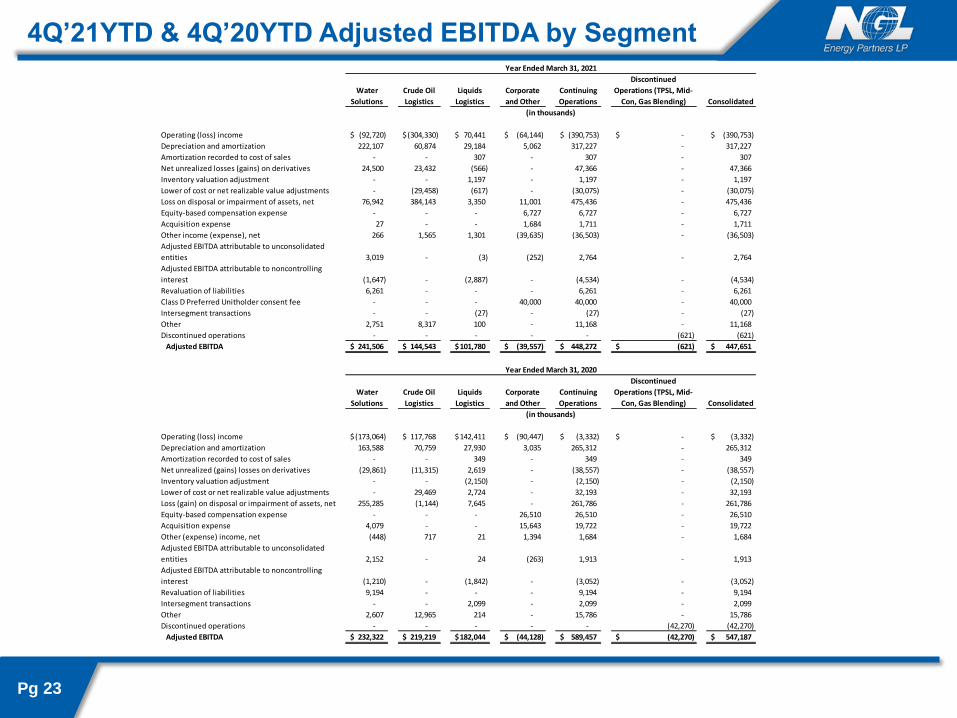
4Q’21YTD & 4Q’20YTD Adjusted EBITDA by Segment
Pg 23
Water
Solutions
Crude Oil
Logistics
Liquids
Logistics
Corporate
and Other
Continuing
Operations
Discontinued
Operations (TPSL, Mid-
Con, Gas Blending) Consolidated
Operating (loss) income (92,720)$ (304,330)$ 70,441$ (64,144)$ (390,753)$ -$ (390,753)$
Depreciation and amortization 222,107 60,874 29,184 5,062 317,227 - 317,227
Amortization recorded to cost of sales - - 307 - 307 - 307
Net unrealized losses (gains) on derivatives 24,500 23,432 (566) - 47,366 - 47,366
Inventory valuation adjustment - - 1,197 - 1,197 - 1,197
Lower of cost or net realizable value adjustments - (29,458) (617) - (30,075) - (30,075)
Loss on disposal or impairment of assets, net 76,942 384,143 3,350 11,001 475,436 - 475,436
Equity-based compensation expense - - - 6,727 6,727 - 6,727
Acquisition expense 27 - - 1,684 1,711 - 1,711
Other income (expense), net 266 1,565 1,301 (39,635) (36,503) - (36,503)
Adjusted EBITDA attributable to unconsolidated
entities 3,019 - (3) (252) 2,764 - 2,764
Adjusted EBITDA attributable to noncontrolling
interest (1,647) - (2,887) - (4,534) - (4,534)
Revaluation of liabilities 6,261 - - - 6,261 - 6,261
Class D Preferred Unitholder consent fee - - - 40,000 40,000 - 40,000
Intersegment transactions - - (27) - (27) - (27)
Other 2,751 8,317 100 - 11,168 - 11,168
Discontinued operations - - - - - (621) (621)
Adjusted EBITDA 241,506$ 144,543$ 101,780$ (39,557)$ 448,272$ (621)$ 447,651$
Water
Solutions
Crude Oil
Logistics
Liquids
Logistics
Corporate
and Other
Continuing
Operations
Discontinued
Operations (TPSL, Mid-
Con, Gas Blending) Consolidated
Operating (loss) income (173,064)$ 117,768$ 142,411$ (90,447)$ (3,332)$ -$ (3,332)$
Depreciation and amortization 163,588 70,759 27,930 3,035 265,312 - 265,312
Amortization recorded to cost of sales - - 349 - 349 - 349
Net unrealized (gains) losses on derivatives (29,861) (11,315) 2,619 - (38,557) - (38,557)
Inventory valuation adjustment - - (2,150) - (2,150) - (2,150)
Lower of cost or net realizable value adjustments - 29,469 2,724 - 32,193 - 32,193
Loss (gain) on disposal or impairment of assets, net 255,285 (1,144) 7,645 - 261,786 - 261,786
Equity-based compensation expense - - - 26,510 26,510 - 26,510
Acquisition expense 4,079 - - 15,643 19,722 - 19,722
Other (expense) income, net (448) 717 21 1,394 1,684 - 1,684
Adjusted EBITDA attributable to unconsolidated
entities 2,152 - 24 (263) 1,913 - 1,913
Adjusted EBITDA attributable to noncontrolling
interest (1,210) - (1,842) - (3,052) - (3,052)
Revaluation of liabilities 9,194 - - - 9,194 - 9,194
Intersegment transactions - - 2,099 - 2,099 - 2,099
Other 2,607 12,965 214 - 15,786 - 15,786
Discontinued operations - - - - - (42,270) (42,270)
Adjusted EBITDA 232,322$ 219,219$ 182,044$ (44,128)$ 589,457$ (42,270)$ 547,187$
(in thousands)
(in thousands)
Year Ended March 31, 2021
Year Ended March 31, 2020