Embed Size (px)
Citation preview

Investor Presentation | November 2017 Confidential
2
Neither Andina Acquisition Corp. II (“Andina”), Lazy Days R.V. Center, Inc. (“Lazydays”) nor any of their respective affiliates makes any representation or warranty as to the accuracy or completeness of the information contained in this presentation. The sole purpose of the presentation is to assist persons in deciding whether they wish to proceed with a further review of the proposed transaction discussed herein and is not intended to be all-inclusive or to contain all the information that a person may desire in considering the proposed transaction discussed herein. It is not intended to form the basis of any investment decision or any other decision in respect of the proposed transaction.
This presentation shall not constitute a solicitation of a proxy, consent or authorization with respect to any securities or in respect of the proposed transactions. This presentation shall also not constitute an offer to sell or the solicitation of an offer to buy any securities, nor shall there be any sale of securities in any jurisdictions in which such offer, solicitation or sale would be unlawful prior to registration or qualification under the securities laws of any such jurisdiction.
EarlyBirdCapital, Inc. (“EBC”), the sole book-running managing underwriter of Andina’s initial public offering consummated in December 2015, has been engaged to assist with Andina’s proposed business combination, for which it will receive a fee. Craig-Hallum Capital Group LLC (“Craig-Hallum”) is also assisting Andina in connection with the proposed business combination, for which it will receive a fee.
Andina and its directors and executive officers, EBC and Craig-Hallum may be deemed to be participants in the solicitation of proxies for the extraordinary general meeting of Andina shareholders to be held to approve the proposed business combination (“meeting”). Shareholders of Andina and other interested persons are advised to read, when available, Andina’s preliminary proxy statement and definitive proxy statement and the registration statement to be filed by Andina’s wholly-owned subsidiary, Andina II Holdco Corp. (“Holdco”) in connection with Andina’s solicitation of proxies for the meeting because these documents will contain important information. Such persons can also read Andina’s final prospectus, dated November 24, 2015, and Andina’s annual report on form 10-K for the fiscal year ended November 30, 2016 for a description of the security holdings of Andina’s officers and directors and of their respective interests as security holders in the successful consummation of the proposed business combination. The definitive proxy statement and prospectus to be included in Holdco’s registration statement will be mailed to shareholders of Andina as of a record date to be established for voting on the proposed business combination. Shareholders will also be able to obtain a copy of such document, without charge, by directing a request to: Andina Acquisition Corp. II, 250 West 57th Street, Suite 2223, New York, New York 10107. These documents, once available, and Andina’s IPO final prospectus and annual report on form 10-K can also be obtained, without charge, at the securities and exchange commission's internet site (http://www.sec.gov).
This presentation includes “forward-looking statements.” Andina’s and Lazydays’ actual results may differ from its expectations, estimates and projections and consequently, you should not rely on these forward looking statements as predictions of future events. Words such as “expect,” “estimate,” “project,” “budget,” “forecast,” “anticipate,” “intend,” “plan,” “may,” “will,” “could,” “should,” “believes,” “predicts,” “potential,” “continue,” and similar expressions are intended to identify such forward-looking statements. These forward-looking statements include, without limitation, Andina’s and Lazydays’ expectations with respect to future performance and anticipated financial impacts of the proposed transaction, the satisfaction of the closing conditions to the proposed transaction, and the timing of the completion of the proposed transaction.
Forward Looking Statements

3
These forward-looking statements involve significant risks and uncertainties that could cause the actual results to differ materially from the expected results. Most of these factors are outside Andina’s and Lazydays’ control and are difficult to predict. Factors that may cause such differences include, but are not limited to: (1) the outcome of any legal proceedings against Lazydays or Andina; (2) the inability to complete the business combination, including due to failure to obtain approval of the shareholders of Andina or other conditions to closing; (3) delays in obtaining, adverse conditions contained in, or the inability to obtain necessary regulatory approvals or complete regulator reviews required to complete the business combination; (4) the risk that the proposed transaction disrupts current plans and operations as a result of the announcement and consummation of the transaction described therein and herein; (6) the ability to recognize the anticipated benefits of the business combination, which may be affected by, among other things, competition, the ability of the combined company to grow and manage growth profitably, maintain relationships with suppliers and obtain adequate supply of products and retain its key employees; (7) costs related to the proposed business combination; (8) changes in applicable laws or regulations; (9) the possibility that the combined company may be adversely affected by other economic, business, and/or competitive factors; and (10) other risks and uncertainties to be indicated from time to time in Andina’s filings with the Securities and Exchange Commission.
Andina cautions that the foregoing list of factors is not exclusive. Andina cautions readers not to place undue reliance upon any forward-looking statements, which speak only as of the date made. Andina does not undertake or accept any obligation or undertaking to release publicly any updates or revisions to any forward-looking statements to reflect any change in its expectations or any change in events, conditions or circumstances on which any such statement is based.
Some of Lazydays’ financial information and data contained herein is unaudited and does not conform to SEC regulation S-X. Furthermore, it includes certain financial information (EBITDA) not derived in accordance with United States Generally Accepted Accounting Principles (“GAAP”). Accordingly, such information and data will be adjusted and presented differently in Andina’s proxy statement to solicit shareholder approval of the proposed transaction. Andina and Lazydays believe that the presentation of non-GAAP measurements provides information that is useful to investors as it indicates more clearly the ability of Lazydays to meet capital expenditures and working capital requirements and otherwise meet its obligation as they become due. However, this should not be construed to replace GAAP figures.
Forward Looking Statements (cont’d)
Ideal Business Combination
4
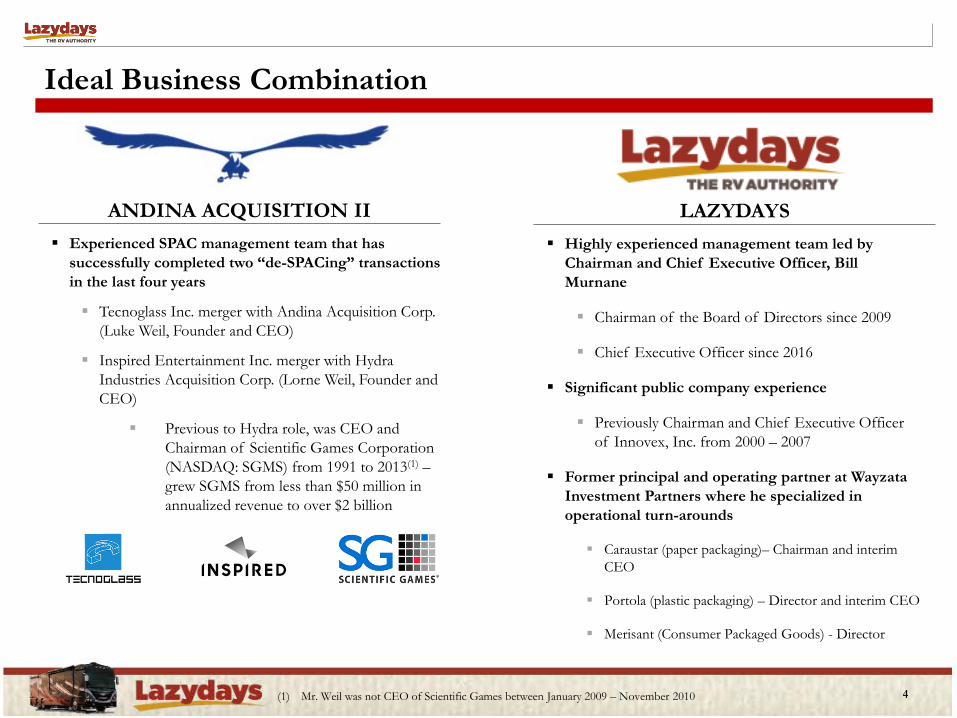
Experienced SPAC management team that has successfully completed two “de-SPACing” transactions in the last four years
Tecnoglass Inc. merger with Andina Acquisition Corp. (Luke Weil, Founder and CEO)
Inspired Entertainment Inc. merger with Hydra Industries Acquisition Corp. (Lorne Weil, Founder and CEO)
Previous to Hydra role, was CEO and Chairman of Scientific Games Corporation (NASDAQ: SGMS) from 1991 to 2013(1) – grew SGMS from less than $50 million in annualized revenue to over $2 billion
ANDINA ACQUISITION II Highly experienced management team led by
Chairman and Chief Executive Officer, Bill Murnane
Chairman of the Board of Directors since 2009
Chief Executive Officer since 2016
Significant public company experience
Previously Chairman and Chief Executive Officer of Innovex, Inc. from 2000 – 2007
Former principal and operating partner at Wayzata Investment Partners where he specialized in operational turn-arounds
Caraustar (paper packaging)– Chairman and interim CEO
Portola (plastic packaging) – Director and interim CEO
Merisant (Consumer Packaged Goods) - Director
LAZYDAYS
(1) Mr. Weil was not CEO of Scientific Games between January 2009 – November 2010

5
Transaction Overview
Andina has agreed to merge with Lazydays
Lazydays is a premier recreational vehicle (“RV”) dealership destination - The RV Authority on new and pre-owned RV sales, service, rentals and accessories
Newly formed Delaware holding company to be new parent company post transaction
Lazydays’ current stockholders will receive a minimum cash payment of $85.0 million and approximately 2.9 million shares of Holdco common stock
Additionally, Holdco has entered into a series of financing agreements with a group of investors led by Coliseum Capital Management, LLC for a private placement of approximately $88.5 million, to be consummated simultaneously with the closing; Lazydays also expects to refinance its existing term debt with a new $20 million facility
Existing Lazydays management will retain current management positions and the Board of Directors will include Bill Murnane as Executive Chairman and Lorne Weil as Vice Chairman
Estimated closing of the transaction in Q1 2018
Transaction Rationale
Going public via a business combination will provide Lazydays faster public capital market access to implement its growth strategy
Multiple opportunities to drive organic growth and margin optimization across a diversified set of revenue streams
Highly fragmented industry with many smaller dealerships that can derive substantial benefit from a national brand like Lazydays and be significantly accretive to revenue and EBITDA
Geographic growth will improve economies of scale and achieve strong operational efficiencies
Compelling Valuation
The combined company implies an estimated FY 2017 Adj. EBITDA multiple of 7.0x – 7.5x(1)(2), including $56 million of sale leaseback financing liability (“SLB”), or an estimated FY 2017 Adj. EBITDA multiple of 6.1x – 6.6x(2)(3) without SLB accounting effects
Public company comparables generally trade between approximately 6x – 12x, with the pure play comparable trading 12x + (1) Estimated FY 2017 Adj. EBITDA range of $28 million – $30 million (2) Based on a stock price of $10.21 (3) Does not include $56 million of financing liability due to sale leaseback; assumes estimated FY 2017 Adj. EBITDA range of $23 million - $25 million due to treatment of financing liability interest as an
operating expense

Transaction Overview
6
Estimated Sources ($ in millions)
Estimated Uses ($ in millions)
Pro Forma Ownership(4) (shares in millions)
Pro Forma Capitalization ($ in millions)
(1) Assumes no redemptions from cash in trust account at October 30, 2017 (2) Reflects a combination of investments by third party institutions in the form of convertible preferred shares, the issuance of 3.3 million common shares, and 2.2 million warrants (3) Maximum stock consideration issued to existing Lazydays stockholders (4) Based on estimated 10.6 million pro forma outstanding shares of Holdco common stock and 1.0 million share equivalents following the conversion of rights. Pro forma outstanding
shares assumes no exercise of outstanding warrants. Assumes none of the ANDA public stockholders exercise their redemption rights (5) Cash as of June 30, 2017 was $4.0 million (6) Assumes stock price of $10.21 (7) Estimated FY 2017 Adj. EBITDA range of $28 million – $30 million (8) Does not include $56 million of financing liability due to sale leaseback; assumes estimated FY 2017 Adj. EBITDA range of $23 million - $25 million due to treatment of financing liability
interest as an operating expense
Cash Consideration $85.0Stock Consideration(3) 25.0Cash to Balance Sheet 41.4Estimated Transaction Fees and Expenses 8.5
Total Estimated Uses $159.9
Existing Lazydays Stockholders 2.9 25%ANDA Public Stockholders 4.1 36%ANDA Founders 1.4 12%Private Placement Investors 3.3 28%
Pro Forma Outstanding Shares 11.6 100%
Cash from ANDA Trust(1) $36.4Private Placement(2) 88.5New Debt Funding 9.9Stock Consideration(3) 25.0
Total Estimated Sources $159.9
Pro Forma Cash(5) ($45.4)Term Loan 20.0Convertible Preferred 60.0Financing Liability 56.0
Net Debt 90.6
Market Capitalization(6) 118.6Enterprise Value $209.2FY 2017 Est. Adj. EBITDA Multiple(7) 7.0x - 7.5x
FY 2017 Est. Adj. EBITDA Multiple (No Financing Liability)(8) 6.1x - 6.6x

Introduction to Lazydays Premier RV dealership destination with the reputation as The
RV Authority on new and pre-owned RV sales, service, rentals and accessories
Nationally recognized brand reinforced through strategic advertising and a national TV show (“Big Time RV”)
Vast product offering of both motorized and towable RVs in five locations across three strong geographic markets
Complementary high-margin revenue streams include financing and insurance (F&I), service and repair, parts and accessories, rentals, and hospitality offerings
Significant opportunity to increase margins through efficiency gains, service and repair, and F&I penetration
Demonstrated success growing in a highly fragmented market: RV America (2015); well positioned to execute on a growth strategy with strong analysis and integration capabilities
Attractive business model supported by strong free cash flow generation, recurring income from multiple sources and low capex requirements
Sizeable organic growth opportunities, low capex requirements and industry leading inventory turns
LAZYDAYS BY THE NUMBERS
$564 million 2016 Revenue(1)
$25.3 million 2016 Adj. EBITDA(1)
6,978 2016 RV Deliveries(1)
25+ # of Brands Carried
~750 Employees
~500,000 # of Annual Visitors
~5.5 million # of Web & Mobile Visits
5 Distinct Dealerships
(1) Audited financials for the year ended December 31, 2016 7

Tampa, FL Johnstown, Denver, Longmont, CO Tucson, AZ
Number of Locations 1 3 1
Location Size 126-acres 45-acres with 135,000 square foot showroom at flagship Johnstown location 48-acres
Service Bays 234 30 48
Primary Markets Florida, Southeast, National for high-end motorized Colorado, Wyoming, Nebraska, Kansas Arizona, New Mexico,
National for Class A
Seasonality Peak during winter, strong local year round Peak during summer Peak during winter
Avg. Units on Hand 950+ 700+ 250+
Key OEMs / Brands Carried
Special Features RV Resort, Florida’s largest RV accessories
store, Crown Club, 3 restaurants, 2 swimming pools, health club, tennis courts
Largest indoor showroom in the industry New Airstream store, on-site
KOA Campground
Successful and Large-Scale Selling Platforms
8

Highly Fragmented Market – Prime opportunity for growth through geographic expansion
Organic Growth – Opportunities for organic growth and margin enhancements
Growing RV Market – Fundamental and demographic trends driving growth in the RV industry
Diversified Business Model – Five distinct and growing revenue streams
Industry Leader – Reputation as The RV Authority for RVs and RV related products
Compelling Financial Profile – Strong generation of FCF
Investment Highlights
9
Established Business and
Brand
Substantial Growth
Opportunities

252.3285.7
321.1356.7 374.2
430.7
0
150
300
450
2011 2012 2013 2014 2015 2016
Lazydays Opportunity
Complementary high-margin revenue streams include financing and insurance (F&I), service and repair, parts and accessories, rentals, and hospitality offerings
Revenue streams include new and used RV sales, financing and insurance, service and repair, accessories and hospitality
Large opportunity to increase margins by improving and enhancing service and repair operations and increasing penetration for margin-rich finance and insurance programs
Leading retailer for RVs and RV related products: Reputation as the RV Authority on new and pre-owned RVs – dominant player in the
most profitable high-end RV market segment
National presence with dealership locations across multiple geographic markets – including the largest RV dealership in North America (Lazydays Tampa)
25+ brands sold and 1,600+ RV units on display – all major RV OEMs are represented
Industry leader in inventory turns (5.5x in Tampa vs. 2.5x industry average)(1)
RV market growing with highly favorable industry tailwinds: The RV dealership industry is a $21.5 billion market
More than 9 million households now own an RV – 16% increase since 2001 and a 64% gain since 1980(2)
Millennial and GenX consumers have continually posted the largest gains in ownership rates – signaling a healthy market for years to come
Baby boomer retirements will provide a wave of new potential customers: 10,000 individuals retiring each day through 2030(3)
10
REPRESENTATIVE OEMS
RV Shipments (in ‘000s)
INDUSTRY RV SHIPMENTS(2)
2016 TOTAL REVENUE MIX(4)
(1) Management estimates (2) RVIA Research ( April 2017 and June 2017) (3) Pew Research
(4) Audited financials for the year ended December 31, 2016
New Vehicles
55% Used
Vehicles 34%
Service & Repair
5%
F&I 5%
Other 1%

New Vehicle Sales 55%
Used RV Sales 34%
Service & Repair
5%
F&I 5%
Campground & Other
1%
Five Distinct Revenue Streams(1)
Vast product offering that includes all of the industry’s top brands and 1,600+ RVs on display
11
NEW RV SALES
$309M 2016 REVENUE 10% GP MARGIN
Extensive trade-in program allows Lazydays to acquire in-demand units at attractive prices
Strong margins
USED RV SALES
$192M 2016 REVENUE 17% GP MARGIN
High-margin segment Majority of new units sold access financing Large installed base generates annual insurance policy renewals
FINANCE & INSURANCE
$29M 2016 REVENUE 95% GP MARGIN
300+ on-site service bays across five locations Specialized warranty repairs provided for all OEMs Labor costs as a % of GP have decreased 30%+ since 2007 Largest organic opportunity
SERVICE & REPAIRS
$28M 2016 REVENUE 58% GP MARGIN
RV resort at Tampa dealership (avg. guest stays 3-5 nights) Parts, accessories, and retail provide stable revenue through all
cycles
OTHER (RENTAL, CAMPING, ETC)
$7M 2016 REVENUE
Diversified revenue streams provide stability with room for substantial growth
2016 Revenue Mix by Segment(1)
(1) Audited financials for the year ended December 31, 2016

Expanding RV Demographic
34%: New RVs sold in the industry in 2016 were to first time buyers
- 8 in 10 of new buyers were under age 65
Continued Interest in Outdoors
129M: Consumers identify as “nature lovers” – the most likely to own an RV
Continued Strong Macro Environment
• Strong consumer confidence
• Favorable employment and wage trends
• Wide credit availability
• Low interest rates
• Stable fuel prices
Fundamental Growth
10% CAGR: New RV unit shipments since 2010
49M: Potential buyers visited an RV showroom or dealership in 2016
16.6M: Consumers were interested in new RVs
Source: RVIA, RV Industry Power Breakfast Presentation, May 2017; RVIA Go RVing Communications Study 2016; KOA 2017 North American Camping Reports; The Outdoor Industry Association
Trends Driving RV Industry Growth – Strong Fundamentals
26%: Of all campers were minorities, up from 13% in 2012
72%: Of people camping in 2016 were GenX or Millennials
37M: North American families go camping at least once a year – 22% of them are RV campers
$887B: Spent on “outdoor economy” in 2016
12

Trends Driving RV Industry Growth – Core Demographics
The RV dealerships industry is a $21.5 billion market that is poised for significant g rowth(1)
13
9 million U.S. households now own a RV
Strong core baby boomer demographic with continued growth by Millennial and Gen X customers
10,000 baby boomers will reach retirement age (65) each day through 2030 – an important RV demographic
Millennial and Gen X customers (35 – 54) have continually posted the largest gains in ownership rates(2) – signaling a healthy market of owners for years to come
RV owners typically trade-in to buy another RV every 4 – 5 years(3) and upgrade as they get older
Healthy credit environment and low delinquency rates will encourage continued sales
RVs capture the trend towards active, healthy, outdoor lifestyles and vacations for families
61% of U.S. households went camping in 2016, and 3.4 million U.S. households went camping for the first time over the last 3 years(3)
5.0%5.9% 5.8% 5.8%
6.5% 6.9%7.9%
8.9% 9.3%
1980 1984 1988 1993 1997 2001 2004 2011 2015
RV OWNERSHIP % AMONG U.S. HOUSEHOLDS(3) RV OWNERSHIP DEMOGRAPHICS(3)
34%
44%
28%
28%
28%
17%
10%
11%
All Campers
New Campers
Millennials Gen X Boomer Mature
(1) April 2017 IBIS World RV Dealers Industry Report (2) RVIA data and reports
(3) Management estimates

RV Shipment Growth
13.2 25.2 24.8 28.2 38.4 44.0 47.3 54.8 62.6 66.8
21.9 24.1 24.0 25.833.5
39.345.0
50.3
2009 2010 2011 2012 2013 2014 2015 2016 2017E 2018E
Wholesale Shipments Retail Registrations
152.5 217.1 227.5 257.6 282.8 312.8 326.9 376.0 409.5 420.4
164.1186.0 205.9 224.5
256.7280.6 317.6
352.5
2009 2010 2011 2012 2013 2014 2015 2016 2017E 2018E
Wholesale Shipments Retail Registrations
87%
13%
Towable Motorized
61%
39%
Towable Motorized
Industry Unit Split
Industry Revenue Split
Motorized Unit Volumes (North America, in thousands)
Towable Unit Volumes (North America, in thousands)
Wholesale Shipments: 23% CAGR
Wholesale Shipments: 14% CAGR
Source: RVIA 2016 Industry Profile
Source: RVIA 2016 Industry Profile
Source: RVIA 2016 Industry Profile; 2017 and 2018 estimates represent RVIA estimates as of 6/5/2017 Towable data includes Travel Trailers, Fifth Wheels, Folding Campers and Truck Campers
Strong industry tailwinds and core demographic trends continue to boost RV shipments
14

Lazydays Geographic Growth Opportunity Highly attractive growth pipeline in a fragmented market:
The RV dealership market is highly fragmented with many “mom & pop” regional dealerships
There are roughly 2,200 RV dealership companies in the U.S., yet only ~6% of them generate more than $25 million in revenue(1)
Potential to grow geographically by either opening new or acquiring existing, smaller dealerships that can benefit from a national brand like Lazydays
Opportunity to quickly grow top and bottom-line by implementing best practices, expanding floorplan flexibility, and growing underutilized, high margin F&I and service business segments
15
GROWTH STRATEGY
Attractive opportunity to open or acquire additional dealerships and grow geographically
Revenue and cost saving synergies Strong marketing capabilities and
synergies Strong integration system and
capabilities National brand with strong OEM
relationships
(1) Management data (2) Audited financials for the year ended December 31, 2016 (3) Management estimates that are unaudited and not reviewed and are subject to change
FRAGMENTED INDUSTRY DYNAMICS
Revenue Range # of Dealer CompaniesOver $1 billion 1$500 million to $1 billion 3$100 million to $500 million 15$50 million to $100 million 30$25 million to $50 million 75$0 to $25 million 2,050Total 2,174
Compelling financial profile:
2016 Financials(2):
- Revenue: ~$564 million
- Gross Profit: ~$116 million (~21%)
- Adj. EBITDA: ~$25 million (~5%)
2017 Estimated financials(3):
- Adj. EBITDA: $28 million - $30 million
Floor plan credit facility has significant excess capacity to add incremental purchases
Term loan: ~$10 million outstanding(2)
Cash on hand: ~$4 million(2)

Significant Organic Growth Opportunities
Lazydays’ scale and reputation allows for significant organic growth initiatives at current state and organically post acquisitions
Room for significant top-line and bottom-line improvement in the near-term post potential for new opening or acquisitions
1) Significant opportunity to optimize new dealership operations
- Implementation of Lazydays’ brand and execution of Lazydays marketing capabilities will drive higher traffic to new dealerships
- Implementation of Lazydays’ sales and F&I procedures will convert new dealerships at a higher rate
- Implementation and/or expansion of Accessories and Rental businesses will drive incremental profitability at new dealerships
2) Scale enables better economics and financial flexibility at new dealerships
- Economies of scale allows Lazydays to offer a broader lineup and higher-end units at smaller dealerships
- Significant OEM relationships lead to improved product availability, economics and selection
- Lazydays’ floor plan financing flexibility allows the Company to place larger orders and display top units on its lots
- Lower inventory borrowing costs and increase turns
3) Immediate opportunity to expand service and repair offerings that will add to bottom line growth
- Grow regional and national service presence
- Improve operating efficiencies and margins
16

Platform Poised for National Expansion
17
The Lazydays model is well equipped to support additional locations and generate an immediate impact
Strong Marketing and Sales 1
• Leverage Lazydays’ lead generation and sales capabilities
• Advanced digital marketing enhancements lead to increased dealership traffic
• Proven sales processes yield higher conversion rates
Improved Systems and Processes 2
• “Lazydays Way” • Proven processes and procedures
enhance performance • Well defined integration management
system drives faster synergy conversion and strong results
F&I Penetration 3
• Regional dealerships can have lower F&I penetration – opportunity for immediate margin improvement
• Lazydays’ F&I process and procedures drive a higher penetration and product index rates
Management Capabilities 4
• Deep bench capable of supporting additional sites without the need to add significant resources
• Ability to quickly identify and improve least-best areas
Economies of Scale 5
• Solid performance against OEM metrics leads to improved product availability, selection and economics
• Floor plan financing flexibility enables larger orders and ability to display top units
• Extremely strong national marketing presence and brand name
Network Effects 6
• Customers benefit from each additional location by expanding contact points where they can access service and amenities
• Expand product availability at newly acquired locations due to performance, reputation, size and relationships of the parent company
• Each new location strengthens the Lazydays brand and increases web and foot traffic

Bill Murnane, Chairman and Chief Executive Officer • Lazydays Chairman of Board of Directors since 2009 and became Chief Executive Officer in 2016 • Former Principal and Operating Partner at Wayzata Investment Partners where he specialized in operational turn-arounds • Previously Chairman and Chief Executive Officer at Innovex Inc., a global manufacturer of electronic products
Key Management
18
Lorne Weil, Prospective Vice-Chairman • Previously Chairman of Scientific Games Corporation from 1991-2013 and Chief Executive Officer from 1992-2011 where he grew the
company from ~$50 million in revenue to over $2 billion • Chairman of Inspired Entertainment, Inc. (INSE) and Tecnoglass Inc. (TGLS) • Successfully completed two business combinations in the past 4 years:
- Hydra Industries Acquisition Corp. merger with Inspired Entertainment, Inc. in December 2016 - Andina Acquisition Corporation merger with Tecnoglass, Inc. in December 2013
Maura Berney, Chief Financial Officer • Joined Lazydays in June 2017 • Previously Regional Vice President of Finance and VP of the National Finance Training Team at AutoNation where she oversaw the
finance functions for more than 100 dealerships that totaled annual revenues of over $7 billion • Ms. Berney has over 30 years of experience in financial management, accounting, acquisition integration, capital allocation, internal
controls and reporting
Lazydays Key Management
Andina Acquisition Corp. II

Lazydays Historical P&L
19 (1) Management estimates that are unaudited and not reviewed and are subject to change (2) Audited financials for the years ended December 31, 2015 and 2016
$ in millions June YTD(1) Fiscal Year(2) FY 2017(1)
2016 2017 2015 2016 Estimates
Consolidated RV Deliveries 3,896 4,088 5,097 6,978
Consolidated Revenue 316.4$ 334.3$ 511.9$ 564.4$
Consolidated Gross Profit 62.1$ 69.2$ 95.3$ 116.3$
Consolidated SG&A 48.8$ 52.4$ 77.1$ 96.7$
Consolidated Adj. EBITDA 15.7$ 19.7$ 21.8$ 25.3$ $28 - 30
Consolidated Gross Profit % 19.6% 20.7% 18.6% 20.6%
Consolidated Adj. EBITDA % 5.0% 5.9% 4.3% 4.5%
20
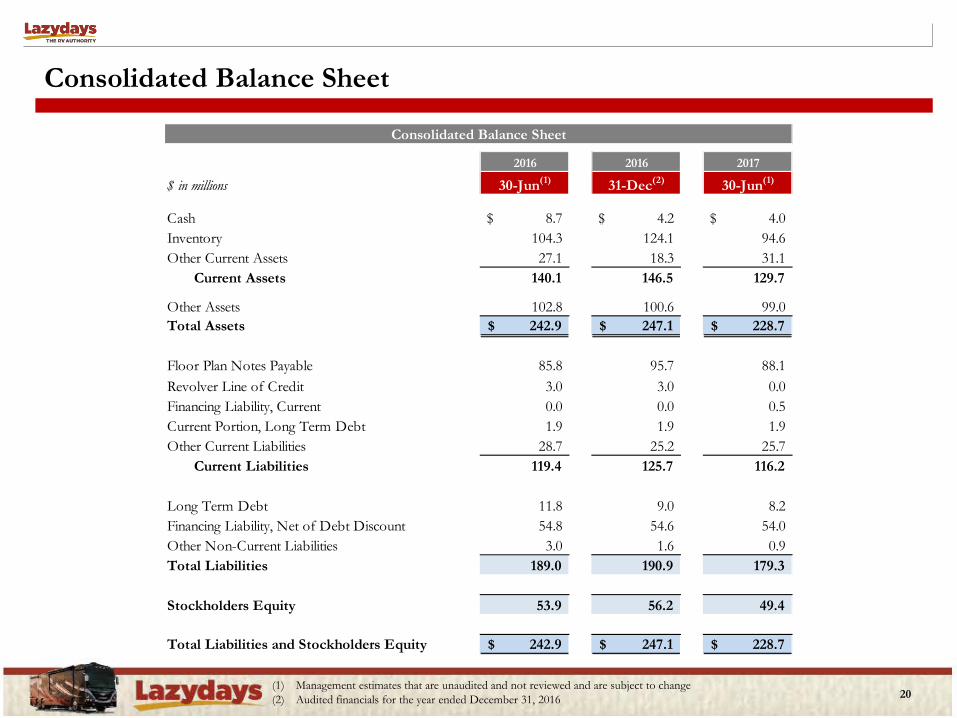
Consolidated Balance Sheet
(1) Management estimates that are unaudited and not reviewed and are subject to change (2) Audited financials for the year ended December 31, 2016
Consolidated Balance Sheet
2016 2016 2017
$ in millions 30-Jun(1) 31-Dec(2) 30-Jun(1)
Cash 8.7$ 4.2$ 4.0$ Inventory 104.3 124.1 94.6Other Current Assets 27.1 18.3 31.1
Current Assets 140.1 146.5 129.7
Other Assets 102.8 100.6 99.0Total Assets 242.9$ 247.1$ 228.7$
Floor Plan Notes Payable 85.8 95.7 88.1Revolver Line of Credit 3.0 3.0 0.0Financing Liability, Current 0.0 0.0 0.5Current Portion, Long Term Debt 1.9 1.9 1.9Other Current Liabilities 28.7 25.2 25.7
Current Liabilities 119.4 125.7 116.2
Long Term Debt 11.8 9.0 8.2Financing Liability, Net of Debt Discount 54.8 54.6 54.0Other Non-Current Liabilities 3.0 1.6 0.9Total Liabilities 189.0 190.9 179.3
Stockholders Equity 53.9 56.2 49.4
Total Liabilities and Stockholders Equity 242.9$ 247.1$ 228.7$

Comparable Companies
21
(1) Stock prices as of 10/30/2017. Lazydays stock price assumed at $10.21. (2) Net debt and enterprise value exclude floor plan debt and used vehicle lines of credit (3) Does not include $56 million of financing liability due to sale leaseback; assumes estimated FY 2017 Adj. EBITDA range of $23 million - $25 million due to treatment
of financing liability interest as an operating expense (4) FY 2017 estimated Adj. EBITDA reflects $29 million, midpoint of management’s estimated Adj. EBITDA range of $28 million - $30 million (and $24 million
excluding financing liability due to treatment of financing liability interest as an operating expense)
COMPARABLE COMPANY ANALYSIS
$ in millions except per share amounts 2017 Est. 2017E Multiple 15A - '17E CAGR
Company Ticker Price High Cap(1) Debt(2) Value(2) Adj. EBITDA Adj. EBITDA Adj. EBITDA(4)
Lazydays (Pro Forma) 10.21$ 119$ 91$ 209$ $28 - 30 7.0x - 7.5x 15%
Lazydays (Excludes Financing Liability)(3) 10.21$ 119$ 35$ 153$ $23 - 25 6.1x - 6.6x 19%
Camping World Holdings, Inc. CWH 42.96$ 93.7% 3,753$ 484$ 4,237$ 379$ 11.2x 19%
MarineMax, Inc. HZO 15.20$ 64.3% 361$ (42)$ 319$ 52$ 6.1x 20%
Titan Machinery Inc. TITN 14.90$ 77.5% 318$ 64$ 382$ 26$ 14.9x -23%
Lithia Motors, Inc. LAD 112.77$ 91.3% 2,822$ 547$ 3,369$ 447$ 7.5x 6%
Asbury Automotive Group, Inc. ABG 60.85$ 85.7% 1,267$ 913$ 2,180$ 306$ 7.1x -5%
Harley-Davidson, Inc. HOG 47.20$ 74.4% 7,987$ 5,255$ 13,243$ 1,152$ 11.5x -10%
High 7,987$ 5,255$ 13,243$ 1,152$ 14.9x 20%
Median 2,044 516 2,774 342 9.4x 0%
Average 2,751 1,204 3,955 393 7.2x -9%
Low 318 (42) 319 26 6.1x -23%
Stock % of 52W Market Net Enterprise

Lazydays Adjusted EBITDA Reconciliation
22 (1) Management estimates that are unaudited and not reviewed and are subject to change (2) Audited financials for the years ended December 31, 2015 and 2016
Lazydays Adjusted EBITDA
$ in millions 1H 2016(1) 1H 2017(1) FY 2015(2) FY 2016(2)
Net Profit 4.6$ 7.2$ 9.0$ 7.8$
Interest Expense 2.5 2.2 1.5 5.0 Depreciation 1.9 2.7 2.5 4.5 Amortization 0.4 0.6 0.3 0.8 Taxes 4.9 5.4 6.3 4.5 Non-compete/severance - 0.3 - 0.3 LIFO 1.2 1.2 1.7 1.9 Transaction Costs 0.2 0.1 0.5 0.5
Adjusted EBITDA 15.7$ 19.7$ 21.8$ 25.3$