Embed Size (px)
Citation preview

INVESTOR PRESENTATIONJune 2013

Page 2
DISCLAIMER
June 2013
This presentation may contain forward-looking statements including, but not limited to,projections of future performance of products, financial conditions, results of operationsand cash flows. The statements are made on the basis of management’s views andassumptions regarding future events and business performance as of the time thestatements are made. Sonova cautions you that a number of important risks anduncertainties could cause actual results to differ materially from those discussed in theforward-looking statements. Such differences may result from the ability of Sonova tosuccessfully develop and introduce new products and market existing products, changesin competitive conditions and regulatory developments as well as from changes in theeconomic conditions that may affect the performance of the operations of Sonova.Sonova undertakes no obligation to update any forward-looking statements, whether asa result of new information, future events or otherwise. Therefore you should not placeundue reliance on them.
This presentation serves marketing purposes and constitutes neither an offer to sell nora solicitation to buy any securities. This presentation does not constitute an offeringprospectus within the meaning of Article 652a of the Swiss Code of Obligations nor alisting prospectus within the meaning of the listing rules of SIX Swiss Exchange.

Page 3
VISION
AT SONOVA, WE ENVISION …
June 2013
A WORLD WHERE EVERYONE
ENJOYS THE DELIGHT OF HEARING AND
THEREFORE LIVES A LIFE WITHOUT LIMITATIONS

Page 4
SONOVA GROUP
BROADEST OFFERING: HEARING INSTRUMENTS, COCHLEAR IMPLANTS …
… AND PROFESSIONAL AUDIOLOGICAL SERVICES
June 2013
HI Hearing Instruments Behind-The-Ear hearing instruments (BTE) FM systems
Custom In-The-Ear hearing instruments (ITE)
Hearing protection Wireless communication systems
Invisible extended-wear hearing instruments
Cochlear implants
CI Cochlear Implants

Page 5
BUSINESS CASE
CLEAR AND FOCUSED STRATEGY – CUSTOMER DRIVEN INNOVATION
June 2013
SONOVA: «HEAR THE WORLD»
Key to our success - Our customers and our employees
Broadest product and service offering / portfolio - Hearing instruments (Phonak, Unitron)
- Cochlear implants (Advanced Bionics)
- Professional services (Connect Hearing Group)
Strong competitive positions - Leading position in hearing instruments
- Strong contender on cochlear implants
- Strong position in selected key retail markets
Significant market share gain potential - High R&D spend – fast product introduction
- Differentiated multi-brand strategy
- Optimized multi-channel approach
Strong product pipelines - High innovation rate and rapid new product introduction
Productivity / efficiency gains - Leverage existing global infrastructure to expand margins
Financial targets until FY 2016/17(at constant FX rates)
- EBITA margin: return to mid-twenties
- ROCE: expand to low-thirties

Page 6
CONTENTS
1 MARKET PAGE 7
2 BUSINESS PAGE 11
3 CORPORATE STRATEGY PAGE 20
4 BUSINESS STRATEGIES PAGE 30
5 FINANCIAL INFORMATION PAGE 51
June 2013

1. MARKET

Page 8
MARKET
LOW PENETRATION RATE – AROUND 20% IN DEVELOPED COUNTRIES
MILD
MODERATE
PROFOUND
With hearing system Without hearing system
END-USER MARKET – PENETRATION*
- Profound loss- Moderate loss- Mild loss
70%50%10%
HI
HI
CI
HI
15%
* Source: Several industry statistics, Sonova estimates
AROUND 15% OF ADULTS HAVE SOME DEGREE OF HEARING IMPAIRMENT
June 2013

Page 9
MARKET
HEARING SOLUTIONS: INSTRUMENTS, IMPLANTS AND SERVICES
TOTAL HEARING CARE MARKET
- Market Size- Market CAGR- HI Size (units)- CI Size (units)
~ CHF 15-16 billion~ + 3-5%
10-11 million~ 40 thousand
COCHLEAR IMPLANTS CI
- Market Size- Market CAGR- CI Size (units)
~ CHF 900 million~ +10%
~ 40 thousand
HEARING INSTRUMENTS HI
- Market Size- Market CAGR- HI Size (units)
~ CHF 4.3 billion~ + 2-4%
10-11 million
CI
HI
June 2013

Page 10
MARKET
SERVICE CHANNELS: KEY TO ACCESS END-USERS
TOTAL HEARING CARE MARKET
- Market Size- Market CAGR- HI Size (units)- CI Size (units)
~ CHF 15-16 billion~ + 3-5%
10-11 million~ 40 thousand
COCHLEAR IMPLANTS CI
- Market Size- Market CAGR- CI Size (units)
~ CHF 900 million~ +10%
~ 40 thousand
HEARING INSTRUMENTS HI
- Market Size- Market CAGR- HI Size (units)
~ CHF 4.3 billion~ + 2-4%
10-11 millionINDEPENDENTS
GLOBAL KEY
ACCOUNTSLARGE RETAIL
ACCOUNTS
BUYINGGROUPS
HOSPITALS GOVERNMENT
OTHERS
June 2013

2. BUSINESS

Page 12
SONOVA GROUP
PERFORMANCE HISTORY – STRONG FINANCIAL TRACK RECORD
1H
SALESin CHF million
EBITAin CHF million
EBITAmargin in %
0
200
400
600
800
1'0001'200
1'400
1'600
1'800
2'000
07/08 08/09 09/10 10/11 11/12 12/13 13/140%
5%
10%
15%
20%
25%
30%
35%
40%
45%
0
50
100
150
200
250
300
350
400
450
07/08 08/09 09/10 10/11 11/12 12/13 13/14
FY 2008/09 FY 2009/10 FY 2010/11 FY 2011/12 FY 2012/13 CAGR 5-y
Sales growth reported +3.7% +20.1% +7.8% +0.2% +10.8% +8.3%
Sales growth in LC +10.8% +23.8% +13.3% +11.6% +7.4% +13.2%
EBITA margin 26.6% 28.0% 20.2% 19.5% 21.5% N/A
Basic EPS 4.35 3.32 3.50 3.71 4.62 +0.3%
Notes: FY 2007/08 Excluding one-off cost for the prohibited acquisition of the GN ReSound GroupFY 2009/10 Restated based on finalization of the acquisition accounting of Advanced BionicsFY 2012/13 Excluding one-off cost for AB Vendor B provision increase, AB Rixheim restructuring and settlement with a group of investors
2H
June 2013

Page 13
AB Center
Unitron Center
Sonova & Phonak HQ & Centers
DistributorsWHS Group Companies
Operation CentersPhonak Communications Center
InSound Center
Murten (CH)
Kitchener (CAN)
Ho Chi Minh City (VN)
Suzhou (CN)
Valencia (USA)
Newark (USA)
Stäfa (CH)
SONOVA GROUP
WELL ESTABLISHED GLOBAL INFRASTRUCTURE AND NETWORK
STRONG LOCAL PRESENCE – SUPPORTING CUSTOMERS WORLDWIDE
June 2013
Page 14
SONOVA GROUP
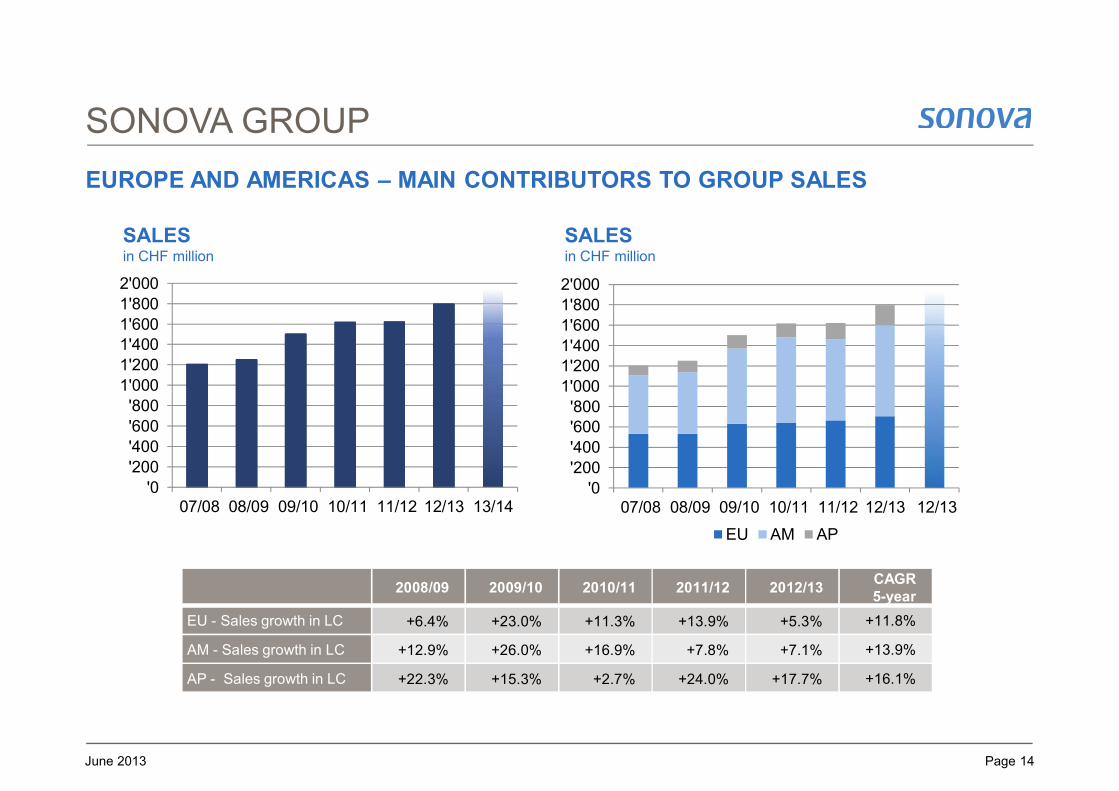
EUROPE AND AMERICAS – MAIN CONTRIBUTORS TO GROUP SALES
June 2013
SALESin CHF million
SALESin CHF million
2008/09 2009/10 2010/11 2011/12 2012/13CAGR5-year
EU - Sales growth in LC +6.4% +23.0% +11.3% +13.9% +5.3% +11.8%
AM - Sales growth in LC +12.9% +26.0% +16.9% +7.8% +7.1% +13.9%
AP - Sales growth in LC +22.3% +15.3% +2.7% +24.0% +17.7% +16.1%
'0
'200
'400
'600'800
1'000
1'2001'400
1'600
1'800
2'000
07/08 08/09 09/10 10/11 11/12 12/13 12/13
EU AM AP
'0
'200
'400
'600
'800
1'000
1'200
1'4001'600
1'800
2'000
07/08 08/09 09/10 10/11 11/12 12/13 13/14
Page 15
MARKET POSITION
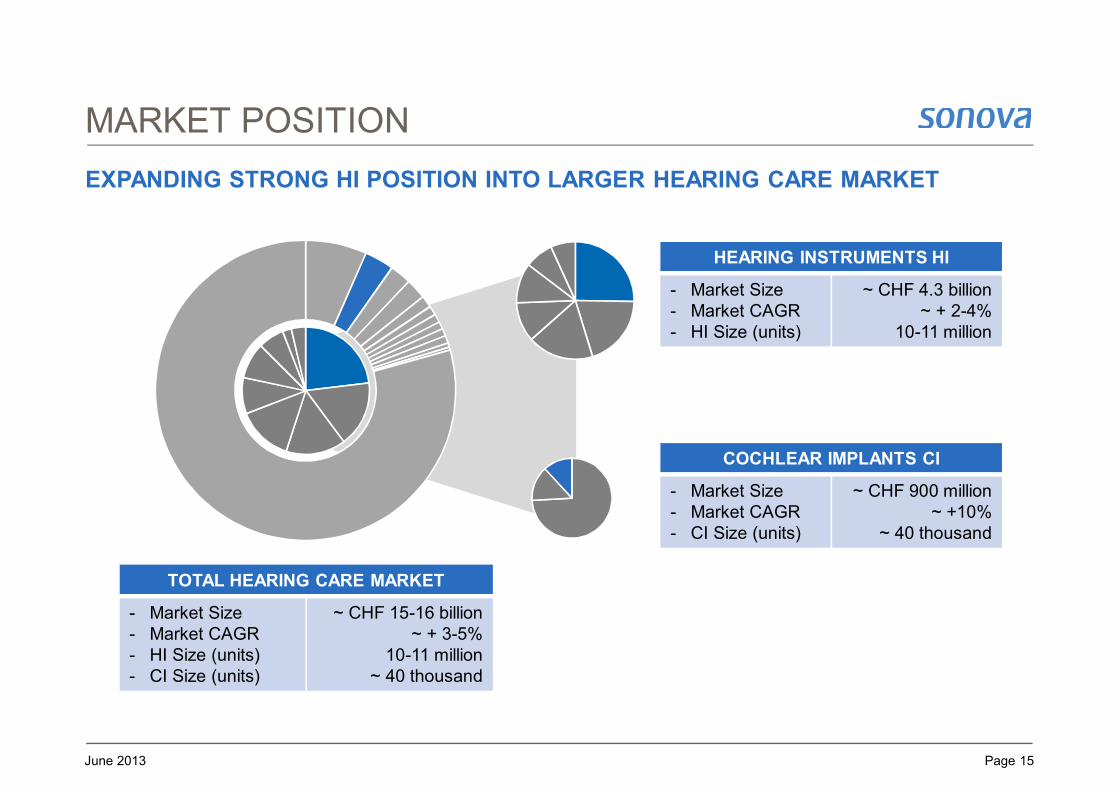
EXPANDING STRONG HI POSITION INTO LARGER HEARING CARE MARKET
June 2013
TOTAL HEARING CARE MARKET
- Market Size- Market CAGR- HI Size (units)- CI Size (units)
~ CHF 15-16 billion~ + 3-5%
10-11 million~ 40 thousand
COCHLEAR IMPLANTS CI
- Market Size- Market CAGR- CI Size (units)
~ CHF 900 million~ +10%
~ 40 thousand
HEARING INSTRUMENTS HI
- Market Size- Market CAGR- HI Size (units)
~ CHF 4.3 billion~ + 2-4%
10-11 million

Page 16
MARKET POSITION
SERVICE CHANNELS: STRONG PARTNER TO IND, LRA, BG AND GOVT
TOTAL HEARING CARE MARKET
- Market Size- Market CAGR- HI Size (units)- CI Size (units)
~ CHF 15-16 billion~ + 3-5%
10-11 million~ 40 thousand
COCHLEAR IMPLANTS CI
- Market Size- Market CAGR- CI Size (units)
~ CHF 900 million~ +10%
~ 40 thousand
HEARING INSTRUMENTS HI
- Market Size- Market CAGR- HI Size (units)
~ CHF 4.3 billion~ + 2-4%
10-11 millionINDEPENDENTS
GLOBAL KEY
ACCOUNTSLARGE RETAIL
ACCOUNTS
BUYINGGROUPS
HOSPITALS GOVERNMENT
OTHERS
SOONSales Split
June 2013

Page 17
BUSINESSES
BALANCED PORTFOLIO OF PROFITABLE GROWTH BUSINESSES
June 2013
SONOVA Group
HEARING INSTRUMENT (HI)Segment
IMPLANT (CI)Segment
CIADVANCED
BIONICS
Business
HIPHONAK
Business
HIUNITRON
Business
HIRETAIL
Business

Page 18
HI SEGMENT
PERFORMANCE HISTORY – STRONG FINANCIAL TRACK RECORD
SALESin CHF million
EBITAin CHF million
EBITAmargin in %
0
200
400
600
800
1'000
1'200
1'400
1'600
1'800
2'000
07/08 08/09 09/10 10/11 11/12 12/130%
5%
10%
15%
20%
25%
30%
35%
40%
45%
0
50
100
150
200
250
300
350
400
450
07/08 08/09 09/10 10/11 11/12 12/13
1H 2H
FY 2008/09 FY 2009/10 FY 2010/11 FY 2011/12 FY 2012/13 CAGR 5-y
Sales growth reported +3.7% +18.1% +4.8% -1.4% +8.2% +6.5%
Sales growth in LC +10.8% +21.7% +10.1% +9.7% +4.9% +11.3%
EBITA margin 27.2% 29.0% 24.1% 22.3% 23.3% N/A
Note: FY 2007/08 Excluding one-off cost for the prohibited acquisition of the GN ReSound Group
June 2013

Page 19
CI SEGMENT
PERFORMANCE HISTORY
SALESin CHF million
EBITAin CHF million
EBITAmargin in %
0
25
50
75
100
125
150
07/08 08/09 09/10 10/11 11/12 12/13-100%
-80%
-60%
-40%
-20%
0%
20%
-50
-40
-30
-20
-10
0
10
07/08 08/09 09/10 10/11 11/12 12/13
FY 2008/09 FY 2009/10 FY 2010/11 FY 2011/12 FY 2012/13 CAGR 3-y
Sales growth reported -- -- +180.5% +36.0% +52.3% > +80.0%
Sales growth in LC -- -- +202.1% +53.5% +47.1% > +80.0%
EBITA margin* -- -31.0% -63.4% -25.0% 1.2% N/A
1H 2H
* FY 2012/13 Excluding one-off cost for AB Vendor B provision at AB, AB Rixheim restructuring and settlement with a group of investors
June 2013

3. CORPORATE STRATEGY
Page 21
MISSION
June 2013
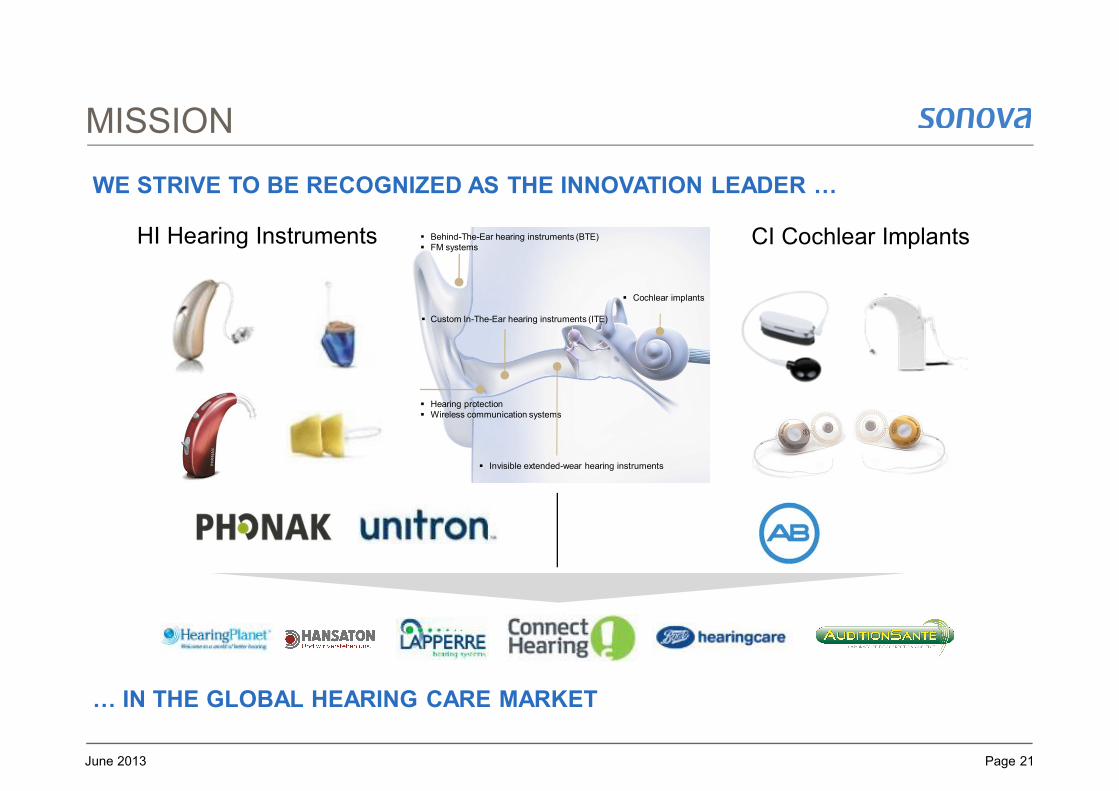
WE STRIVE TO BE RECOGNIZED AS THE INNOVATION LEADER …
… IN THE GLOBAL HEARING CARE MARKET
HI Hearing Instruments Behind-The-Ear hearing instruments (BTE) FM systems
Custom In-The-Ear hearing instruments (ITE)
Hearing protection Wireless communication systems
Invisible extended-wear hearing instruments
Cochlear implants
CI Cochlear Implants

Page 22
FINANCIAL TARGETS
ON COURSE FOR MID TERM FINANCIAL TARGETS
Notes: FY 2007/08 Excluding one-off cost for the prohibited acquisition of the GN ReSound GroupFY 2009/10 Restated based on finalization of the acquisition accounting of Advanced BionicsFY 2012/13 Excluding one-off cost for AB Vendor B provision at AB, AB Rixheim restructuring and settlement with a group of investors
June 2013
Page 23
STRATEGY
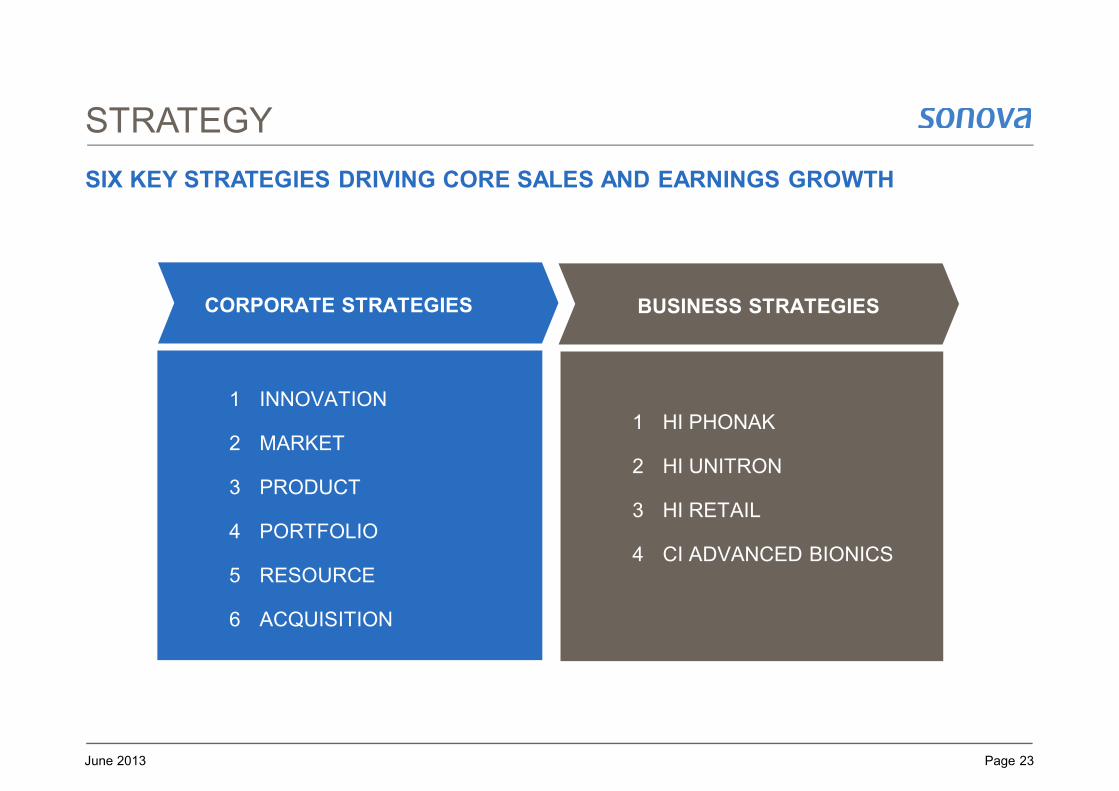
SIX KEY STRATEGIES DRIVING CORE SALES AND EARNINGS GROWTH
1 INNOVATION
2 MARKET
3 PRODUCT
4 PORTFOLIO
5 RESOURCE
6 ACQUISITION
CORPORATE STRATEGIES
1 HI PHONAK
2 HI UNITRON
3 HI RETAIL
4 CI ADVANCED BIONICS
BUSINESS STRATEGIES
June 2013

Page 24
INNOVATION STRATEGY
FOCUS ON CONTINUOUS INNOVATION TO GROW SALES AND EARNINGS
June 2013
Q1 15 Q2 15Q1 14 Q2 14 Q3 14 Q4 14Q1 13 Q2 13 Q3 13 Q4 13
MARKETING
SALES & DISTRIBUTION
PRODUCTIVITY & EFFICIENCY
RESOURCES & PROCESSES
NEW PRODUCTS
CORE: DRIVE STRONG NEW PRODUCT PIPELINE – GROSS R&D 7-8% OF SALES
Page 25
MARKET STRATEGY
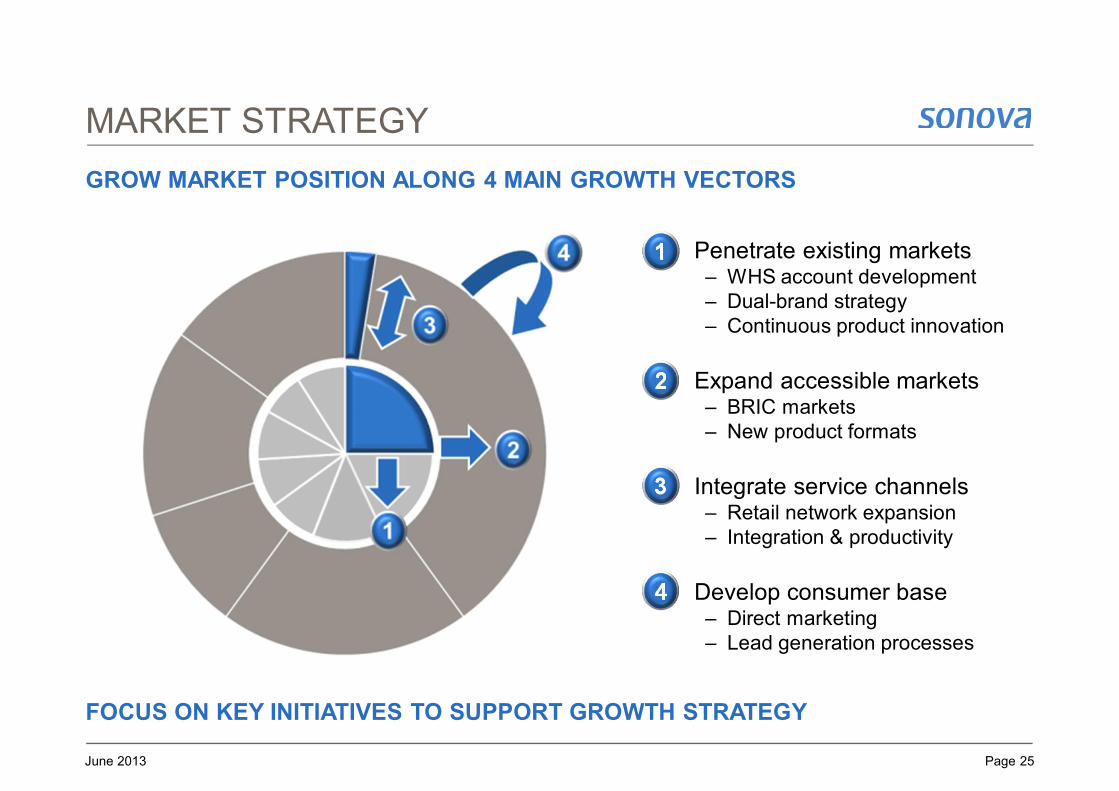
GROW MARKET POSITION ALONG 4 MAIN GROWTH VECTORS
June 2013
FOCUS ON KEY INITIATIVES TO SUPPORT GROWTH STRATEGY
1
2
3
4
Penetrate existing markets– WHS account development– Dual-brand strategy– Continuous product innovation
Expand accessible markets– BRIC markets– New product formats
Integrate service channels– Retail network expansion– Integration & productivity
Develop consumer base– Direct marketing– Lead generation processes

Page 26
PRODUCT STRATEGY
PROVIDE COMPLETE CUSTOMER SOLUTIONS: HW, SW AND SERVICES
June 2013
PLATFORM CONCEPT APPROACH TO SOLUTION DEVELOPMENT

Page 27
PORTFOLIO STRATEGY
DEVELOP BALANCED PORTFOLIO OF PROFITABLE GROWTH BUSINESSES
June 2013
LEAD INNOVATION IN HEARING INSTRUMENTS AND IMPLANTS
DOG
???
COW
STAR
MARKET SHARE
Hig
hLo
w
MA
RK
ET
GR
OW
TH
LYRIC
HighLow
Hig
hLo
w
HI
CI
COM
INVEST RETURN

Page 28
RESOURCE STRATEGY
LEVERAGE GLOBAL INFRASTRUCTURE TO EXPAND MARGINS
RE-BALANCE GLOBAL OPEX BASE TO CREATE NATURAL HEDGE
0
50
100
150
200
2012 2016
SALES
OPEX0
50
100
150
200
2012 2016
SALES
OPEX0
50
100
150
200
2012 2016
SALES
OPEX
AMERICAS EUROPE APAC
June 2013

Page 29
ACQUISITION STRATEGY
INVEST TO LEVERAGE EXISTING CHANNELS AND PRODUCTS
June 2013
TARGETS: STRICT CRITERIA FOR STRATEGIC AND FINANCIAL FIT
HI
CI
Channels
,0
3,000
06/07 07/08 08/09 09/10 10/11 11/12 12/13 13/14 14/15 15/16
ISM
AB

4. BUSINESS STRATEGIES

Page 31
PHONAK
SONOVA: BALANCED PORTFOLIO OF PROFITABLE GROWTH BUSINESSES
June 2013
SONOVA Group
HEARING INSTRUMENT (HI)Segment
IMPLANT (CI)Segment
CIADVANCED
BIONICS
Business
HIPHONAK
Business
HIUNITRON
Business
HIRETAIL
Business

Page 32
PHONAK
BUSINESS STRATEGY
PHONAK: «LIFE IS ON»
Mission / value proposition - Drive innovation leadership to expand market position
Markets - Cover broadest global (whole)sale, distribution & support network
Products - Offer complete range across all form factors and performance levels
Product pipeline - Drive high innovation rate and rapid new product introduction
Productivity / efficiency - Leverage global sales & production infrastructure to expand margins
Selected initiatives 2013/14 - B2B/B2C marketing campaign: «Phonak engaging voices»
- New product launch Spring 2013
- New product launch Fall 2013
- Lyric 2.3
- DM (2.4 GHz) communication / wireless connectivity standard “ROGER”
- China market growth and expansion (lead)
- etc.
June 2013

Page 33
PHONAK
MARKETS: COVER BROADEST GLOBAL SALES & SUPPORT NETWORK
FURTHER PENETRATE AM AND EU – EXPAND POSITIONS IN AP (CHINA)
AM EU
AP
June 2013

Page 34
PHONAK
PRODUCT PIPELINE: DRIVE HIGH INNOVATION & PRODUCT LAUNCH RATE
COMPLETE RANGE ACROSS ALL FORMATS AND PERFORMANCE LEVELS
SPICE (new HW / new DSP / 65nm) QUEST (new HW / new core SW / 65nm) NEXT PLATFORM
BT
E –
Bo
lero
Q
ITE
–V
irto
Q
RIC
–A
ud
éo Q
PO
WE
R –
Naí
da
Q
F 5
F 1
F 2
F 3
F 4
F 5
Lyric2 Lyric3
T 2.1 T 3.3T 3.0 T 4.0T 3.1 T 3.2 T 4.1 T 4.2T 2.0T 1.1
FM System (analog) Roger (digital / 2.4 GHz)
F1 / 4
HI - Premium
HI - Advanced
HI - Standard
HI - Essential/Basic
HI - Platform
HI - New EW Format
Fitting Software(TARGET)
Communication
F 1
F 3
F 1
F 1
F 2
F 2
F 4
F 5
F 5
1H 15 2H 151H 13 2H 131H 11 2H 11 1H 14 2H 141H 12 2H 12TIMELINE / CY
Note: Subject to change
June 2013

Page 35
PHONAK PRODUCT PORTFOLIO
June 2013
* based on previous generation platforms
BTE product line ITE product line RIC Power Pediatric
Premium Phonak Bolero Q90 Phonak Virto Q90 Audéo Q90 Naída Q90
Advanced Phonak Bolero Q70 Phonak Virto Q70 Audéo Q70 Naída Q70 Nios S V*
Standard Phonak Bolero Q50 Phonak Virto Q50 Audéo Q50 Naída Q50 Nios S III*
Essential Phonak Dalia* Phonak Dalia* Audéo Q30 Naída Q30
Basic Milo* Milo*

Page 36
UNITRON
SONOVA: BALANCED PORTFOLIO OF PROFITABLE GROWTH BUSINESSES
June 2013
SONOVA Group
HEARING INSTRUMENT (HI)Segment
IMPLANT (CI)Segment
CIADVANCED
BIONICS
Business
HIPHONAK
Business
HIUNITRON
Business
HIRETAIL
Business

Page 37
UNITRON
BUSINESS STRATEGY
UNITRON: «HEARING MATTERS»
Mission / value proposition - Drive leadership in customer experience
Markets - Deeper penetration in core markets in Europe and NA
Products - Offer flexible range across many form factors and all performance levels
Product pipeline - Drive focused innovation and rapid new product introduction
Productivity / efficiency - Leverage Sonova technology & production platform to expand margins
Selected initiatives 2013/14 - B2B Marketing campaign “favorite sound”
- UT customer experience initiatives
- New product launch Spring 2013
- New product launch Fall 2013
- China market growth and expansion (complement Phonak initiative)
- etc.
June 2013

Page 38
UNITRON
MARKETS: EXPAND GLOBAL NETWORK FROM STRONG BASE IN NA
DEVELOP POSITIONS IN EU – SUPPORT SONOVA EXPANSION IN AP (CHINA)
AM EU
AP
June 2013

Page 39
UNITRON
PRODUCT PIPELINE: DRIVE FOCUSED PRODUCT INNOVATION
FLEXIBLE RANGE ACROSS 3 FORMATS AND ALL PERFORMANCE LEVELS
ERA (new HW / new DSP / 65nm) NEXT PLATFORM Q
–F
LE
X 1
M–
FL
EX
1
Mo
xi K
iss
–R
IC
FL
EX
Tri
al&
Up
gra
de
F 1
F2
F 3
TF 1.1 TF 2.3TF 2.0 TF 2.3TF 2.1 TF 2.2 TF 4.0 TF 4.1TF 1.0
HI - Premium
HI - Advanced
HI - Standard
HI - Essential/Basic
HI - Platform
Fitting Software(TRUEFIT)
Q P
RO
MP
RO
Q-
M 2
Q P
RO
MP
RO
Q 1
M 1
1H 15 2H 151H 13 2H 131H 11 2H 11 1H 14 2H 141H 12 2H 12TIMELINE / CY
Note: Subject to change
June 2013

Page 40
UNITRON PRODUCT PORTFOLIO
June 2013
* based on previous generation platforms
BTE product line ITE product line RIC Power Flex Trial
Premium Quantum Pro Quantum Pro Moxi Kiss Pro Moxi Pro
Quantum 20 Quantum 20 Moxi Kiss 20 Moxi 20 Max 20
Quantum 12 Quantum 12 Moxi Kiss 12 Moxi 12
Standard Quantum 6 Quantum 6 Moxi Kiss 6 Moxi 6 Max 6
Essential Quantum E Quantum E Moxi Kiss E Moxi E Max E
Basic Shine* Shine*
Advanced
An
y Perfo
rman
ce
Level

Page 41
CONNECT HEARING
SONOVA: BALANCED PORTFOLIO OF PROFITABLE GROWTH BUSINESSES
June 2013
SONOVA Group
HEARING INSTRUMENT (HI)Segment
IMPLANT (CI)Segment
CIADVANCED
BIONICS
Business
HIPHONAK
Business
HIUNITRON
Business
HIRETAIL
Business
Page 42
CONNECT HEARING
BUSINESS STRATEGY
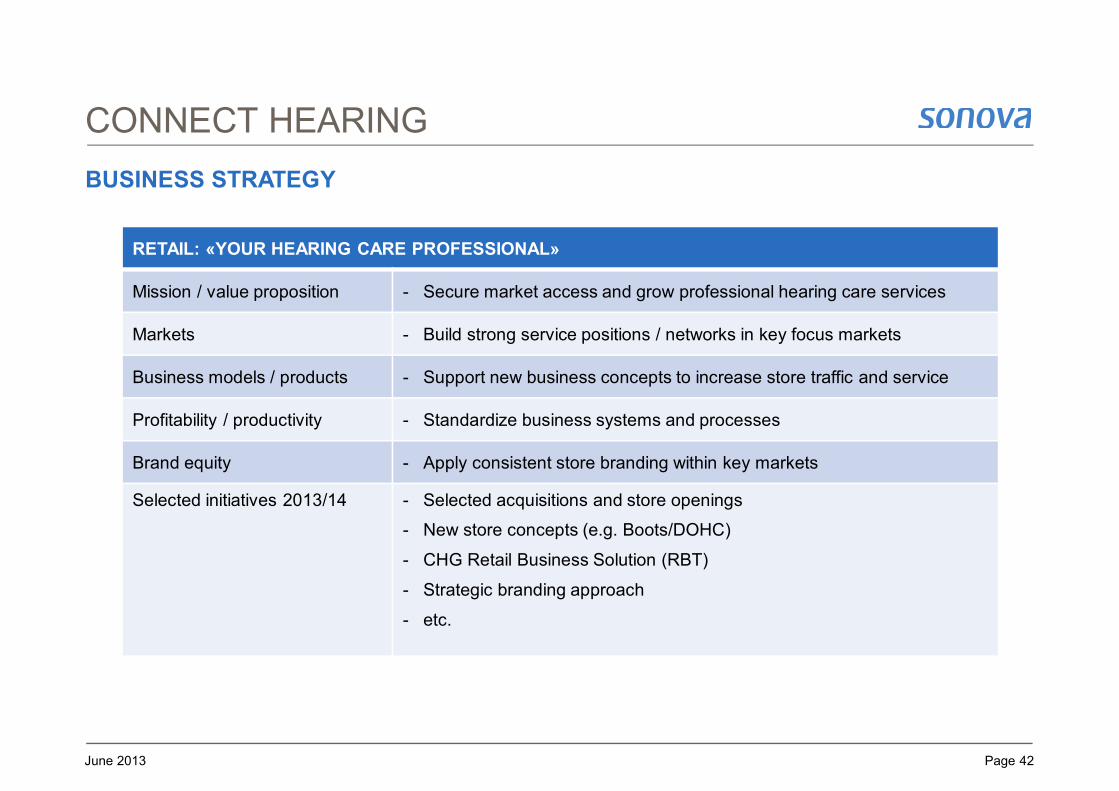
RETAIL: «YOUR HEARING CARE PROFESSIONAL»
Mission / value proposition - Secure market access and grow professional hearing care services
Markets - Build strong service positions / networks in key focus markets
Business models / products - Support new business concepts to increase store traffic and service
Profitability / productivity - Standardize business systems and processes
Brand equity - Apply consistent store branding within key markets
Selected initiatives 2013/14 - Selected acquisitions and store openings
- New store concepts (e.g. Boots/DOHC)
- CHG Retail Business Solution (RBT)
- Strategic branding approach
- etc.
June 2013

Page 43
CONNECT HEARING
MARKETS: BUILD STRONG SERVICE POSITIONS IN KEY MARKETS
FOCUS ON: US, CA, BR, UK, FR, BE, AT, AUS/NZ
AMEU
AP
June 2013

Page 44
CONNECT HEARING OFFERING
MARKET LEADING SHOP IN SHOP CONCEPT – EXAMPLE DOHC / BOOTS (UK)
PREMIUM MARKET ACCESS BY PARTNERSHIP WITH LEADING PHARMACY CHAIN
Well-established partnership between David Ormerod Hearing Centres (DOHC) and Boots since 2003
Number of locations in the UK grew from 64 to more than 340 during that time
Boots hearingcare offers professional audiological services at attractive locations
Clear synergies for both sides from increased store traffic
Partnership expanded through 49% minority stake in DOHC by Boots
June 2013

Page 45
ADVANCED BIONICS
SONOVA: BALANCED PORTFOLIO OF PROFITABLE GROWTH BUSINESSES
June 2013
SONOVA Group
HEARING INSTRUMENT (HI)Segment
IMPLANT (CI)Segment
CIADVANCED
BIONICS
Business
HIPHONAK
Business
HIUNITRON
Business
HIRETAIL
Business

Page 46
ADVANCED BIONICS
BUSINESS STRATEGY
ADVANCED BIONICS: «PATIENTS ALWAYS FIRST»
Mission / value proposition - Strive for performance leadership – leverage AB and PH combination
Markets - Build global direct sales & support network - grow from strong US base
Products - Expand innovative range of processors, implants and electrodes
Product pipeline - Accelerate innovation rate – synchronize with PH pipeline and platforms
Productivity / efficiency - Leverage PH technology & process platform to expand margins
Selected initiatives 2013/14 - AB Partner Program for retail: «Think beyond Hearing Aids»
- AB / PH system & product pipeline
- New product launches 2013/14 (implants, electrodes, processors)
- China market development
- etc.
June 2013

Page 47
ADVANCED BIONICS
MARKETS: EXPAND GLOBAL NETWORK FROM STRONG BASE IN US
GROW POSITIONS IN EU, BR, JP – BUILD PLATFORM IN CHINA
AM EU
AP
June 2013

Page 48
ADVANCED BIONICS
HOW A COCHLEAR IMPLANT WORKS
SoundprocessorSound is captured and converted into detailed digital information
Magnetic headpieceTransmits digital signal wirelessly to the implant
ImplantConverts digital information into electrical signal
ElectrodeDelivers signal as electrical stimulation to the auditory nerve
June 2013

Page 49
ADVANCED BIONICS
PRODUCT PIPELINE: ACCELERATE INNOVATION RATE – LEVERAGE PH
EXPAND RANGE OF INNOVATIVE PROCESSORS, IMPLANTS, ELECTRODES
FDACE
FDACE
FDACE
WOLVERINE / QUEST (new HW / new DSP / 65nm) NEXT PLATFORM
CI - Electrodes
CI - Implants
CI - Processors
CI - Platform
Fitting Software(SOUNDWAVE)
N Pro 1 N Pro 2N Pro 2N Pro 3
N Imp 2 N Imp 3
N El 2 N El 3
1H 15 2H 151H 13 2H 131H 11 2H 11 1H 14 2H 141H 12 2H 12TIMELINE / CY
SW 2.0 SW 3.0 SW 4.0
NeptuneNeptune Naída CI Q70
N Imp 2
N Pro 3
N Imp 3
N El 3HiFocusMid-Scala N El 2
Note: Subject to change, timing dependent upon regulatory approvals
HiRes 90kAdvantage
June 2013

Page 50
ADVANCED BIONICS PRODUCT PORTFOLIO
June 2013
* approved in Europa and Canada, not yet approved in the US
Implant HiRes 90K Advantage HiRes 90K
Electrodes HiFocus Mid-Scala HiFocus 1j HiFocus Helix
Sound Processors Naída CI* Neptune Harmony BTE
Software SoundWave 2.1

5. FINANCIAL INFORMATION

Page 52
FULL YEAR 2012/13
SUMMARY OF FINANCIAL RESULTS
May 21, 2013
– Solid sales growth
– Sales of CHF 1’795.3 million – up 10.8% in Swiss francs and 7.4% in LC
– All major regions contributing to the increase
– Strong EBITA growth and margin expansion – normalized for one-off charges
– Normalized EBITA of CHF 386.4 million – up 22.6% in Swiss francs and 15.4% in LC
– Normalized EBITA margin of 21.5%, expanding by 200 bps and by 140 bps in LC
– Reported EBITA of CHF 182.8 million – fully reflecting Vendor B provision increase
– Both segments contributing
– Robust growth in hearing instruments (+4.9% in LC) – EBITA margin expanding by 100 bps
– Break-even target reached in cochlear implants – supported by a strong growth of +47.1% in LC
– High growth in cash flow – sound financial position
– Operating free cash flow of CHF 318.6 million – up 33% in Swiss francs
– Net cash position of CHF 185.8 million
– Normalized ROCE of 22.6%, up from 19.2% in FY 2011/12
– Dividend increase of 33% to CHF 1.60 proposed

Page 53
FY 2012/13
June 2013
in CHF million FY 2011/12 FY 2012/13 Δ % in CHF Δ % in LC
Sales 1'619.8 1'795.3 10.8% 7.4%
Gross profit 1'105.9 1'240.1 12.1% 8.2%
- Gross profit margin 68.3% 69.1%
OPEX 790.7 853.7 8.0% 5.4%
EBITA 315.2 386.4 22.6% 15.4%
- EBITA margin 19.5% 21.5%
Operating free cash flow 239.5 318.6 33.0%
EPS (in CHF) 3.71 4.62 24.5%
ROCE 19.2% 22.6%
EXPANSION OF GROSS PROFIT MARGIN - IN BOTH SEGMENTS
SOLID FINANCIAL PERFORMANCE – NORMALIZED

Page 54
FY 2012/13
GROUP EBITA DEVELOPMENT
SOLID EBITA IMPROVEMENT FROM ORGANIC GROWTH – CI BREAKING EVEN
EBITA2011/12
Organic Growth
EBITA2012/13
normalized
FX effect
EBITA2012/13
const. FXnormalized
386.4
+22.7
315.2 +43.4
+48.5+15.4%
+71.2+22.6%Margin:
19.5%Margin:21.5%
+5.1
Acquisitions
363.7
Margin:20.9%
One-offcost
2012/13
EBITA (reported) 2012/13
-203.6
182.8
Notes: Average FX rates: USD/CHF 0.94 (prior year: 0.88) and EUR/CHF 1.21 (prior year: 1.21)One-off cost: AB Vendor-B case CHF 197.8m, restructuring AB Rixheim CHF 3.2m, settlement with a group of investors CHF 2.6m
Margin:10.2%
June 2013

Page 55
FY 2012/13
DETAILS BY BUSINESS SEGMENTS
in CHF million 2011/12 2012/13Growth
in lcGrowth in CHF
Sales
Hearing Instruments- thereof organic
1’523.5 1’648.5 +4.9%+2.6%
+8.2%
Cochlear Implants 96.3 146.7 +47.1% +52.3%
Group 1’619.8 1’795.3 +7.4% +10.8%
EBITA
Hearing Instruments 339.3 384.7 +6.7% +13.4%
Cochlear Implants -24.1 1.8 n/a n/a
Group 315.2 386.4 +15.4% +22.6%
June 2013

Page 56
FY 2012/13
June 2013
OPERATING EXPENSES
* One-off cost: AB Vendor B case CHF 197.8m, restructuring AB Sarl CHF 3.2m, settlement with group of investors CHF 2.6m
SALES & MARKETING, G&A INCREASE: DRIVEN BY RETAIL ACQUISITION INTEGRATION, CONCENTRATED PRODUCT LAUNCH AND LYRIC RAMP UP EFFORTS
in CHF million FY 2011/12 FY 2012/13 Δ % in CHF Δ % in LC
Research & Development 116.2 113.5 -2.3% -3.7%
in % of sales 7.2% 6.3%
Sales & Marketing 503.4 558.9 11.0% 8.0%
in % of sales 31.1% 31.1%
General & Administration 168.7 181.3 7.5% 5.4%
in % of sales 10.4% 10.1%
Subtotal 788.2 853.7 8.3% 5.7%
in % of sales 48.7% 47.6%
Other expenses* 2.5 203.6
Page 57
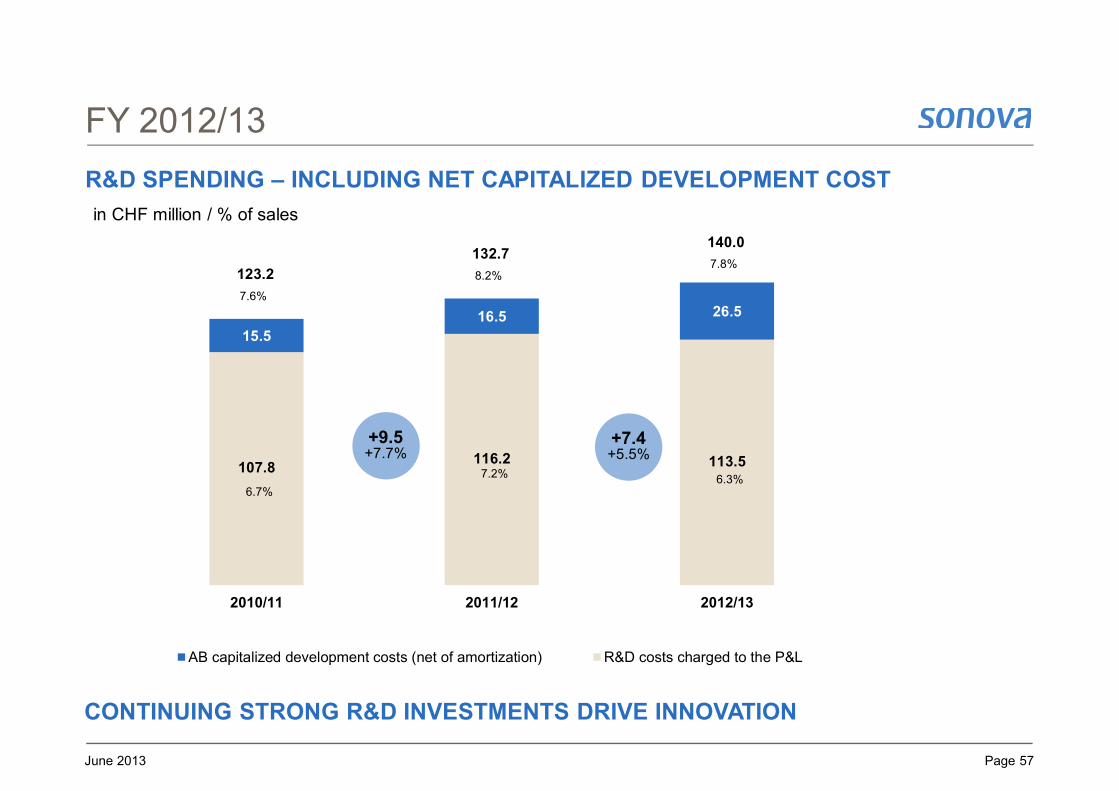
107.8116.2 113.5
15.5
16.5 26.57.6%
8.2%7.8%
123.2
132.7140.0
6.7%
7.2% 6.3%
2010/11 2011/12 2012/13
AB capitalized development costs (net of amortization) R&D costs charged to the P&L
FY 2012/13
June 2013
R&D SPENDING – INCLUDING NET CAPITALIZED DEVELOPMENT COST
+9.5+7.7%
+7.4+5.5%
in CHF million / % of sales
CONTINUING STRONG R&D INVESTMENTS DRIVE INNOVATION

Page 58
FY 2012/13
June 2013
REPORTED RESULTS AND INCOME TAXES
POTENTIAL TAX EFFECT OF VENDOR B PROVISION INCREASE NOT CAPITALIZED
in CHF million FY 2011/12 FY 2012/13 Δ % in CHF
EBITA 315.2 182.8 -42.0%
Amortization / Impairment -27.5 -26.1 -5.0%
Operating profit (EBIT)in % of sales
287.717.8%
156.78.7%
-45.5%
Financial result -5.9 -6.9 15.9%
Income before taxes 281.8 149.8 -46.8%
Income taxes -35.4 -37.8 6.8%
- Income tax rate 12.6% 25.2%
Income after taxesin % of sales
246.415.2%
112.06.2%
-54.5%

Page 59
FY 2012/13
June 2013
SIGNIFICANT INCREASE IN CASH FLOW
in CHF million FY 2011/12 FY 2012/13 Δ % in CHF
Cash flow before changes in NWC 387.5 443.7 14.5%
Changes in net working capital and taxes paid -82.7 -56.6 -31.5%
Operating cash flowin % of sales
304.818.8%
387.121.6%
27.0%
Cash flow from investing activities (excl. acquisitions) -65.3 -68.5 4.9%
Operating free cash flowin % of sales
239.514.8%
318.617.7%
33.0%
Cash consideration for acquisitions -83.1 -56.2 -32.4%
Free cash flow 156.4 262.4 67.7%
Cash flow from financing activities -127.5 -21.8 n/a
Changes in cash and cash equivalents 26.8 242.8 > 100%
OPERATING FREE CASH FLOW INCREASING 33.0%

Page 60
FY 2012/13
June 2013
BALANCE SHEET
TURNING NET CASH POSITIVE – INVENTORY INCREASES DRIVEN BY LAUNCHES
in CHF million FY 2011/12 FY 2012/13 Δ % in CHF
Net working capital 163.4 187.1 14.5%
Days sales outstanding (DSO) 72 71 -1.4%
Days inventory outstanding (DIO) 122 148 21.3%
Capital employed 1'540.3 1'449.5 -5.9%
Net cash -64.4 185.8 > 100%
Equity 1'475.9 1'635.3 10.8%
Equity in % of total assets 64.5% 61.0%
Page 61
FY 2012/13
June 2013
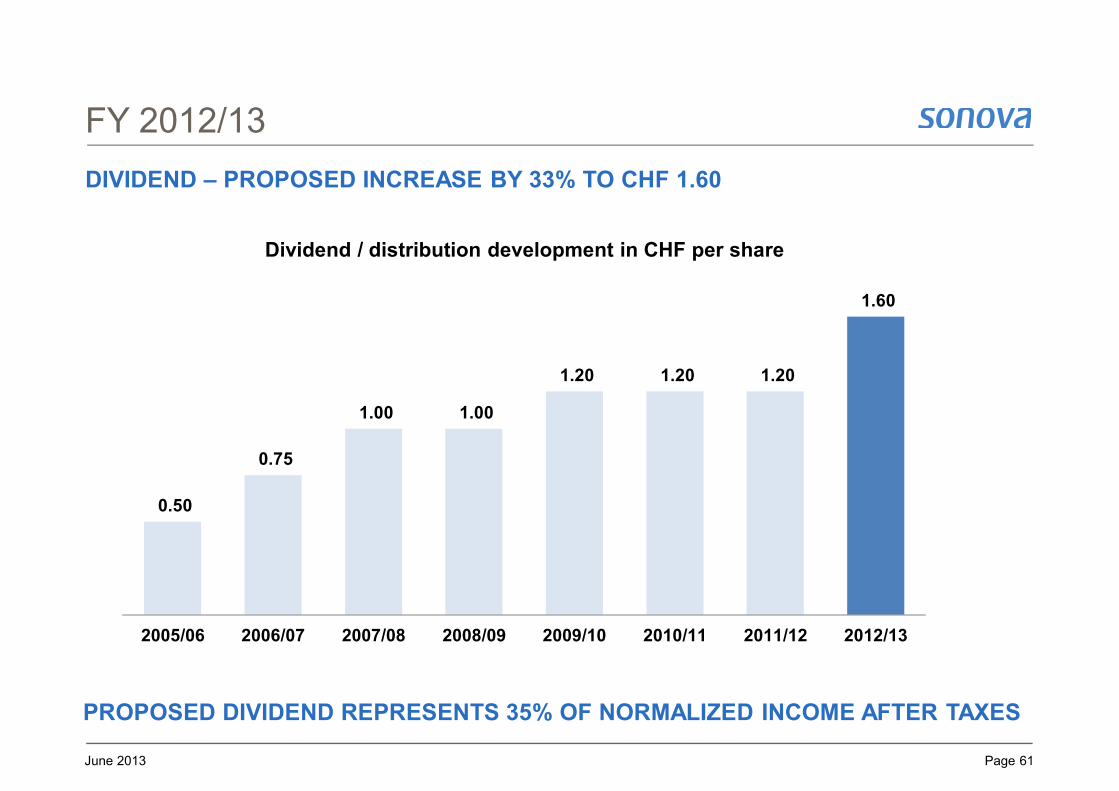
DIVIDEND – PROPOSED INCREASE BY 33% TO CHF 1.60
0.50
0.75
1.00 1.00
1.20 1.20 1.20
1.60
2005/06 2006/07 2007/08 2008/09 2009/10 2010/11 2011/12 2012/13
Dividend / distribution development in CHF per share
PROPOSED DIVIDEND REPRESENTS 35% OF NORMALIZED INCOME AFTER TAXES

Page 62
OUTLOOK
FY 2013/14 GUIDANCE – IN LOCAL CURRENCIES
Guidance
FY 2013/14
Actual - normalized
FY 2012/13
Sales
Sales growth in LC
thereof acquisition related growth
FX-impact
Total sales growth in CHF
6%-8%
approx. 1%
n/a
n/a
7.4%
2.2%
3.4%
10.8%
EBITA
EBITA growth in lc
FX-impact
Total EBITA growth in CHF
9%-13%
n/a
n/a
15.4%
7.2%
22.6%
June 2013

Page 63
OUTLOOK
FY 2013/14 GUIDANCE – FX IMPACT ON SALES AND MARGINS
0.70
0.75
0.80
0.85
0.90
0.95
1.00
Ap
r-11
Ma
y-1
1
Ju
n-1
1
Jul-1
1
Au
g-1
1
Se
p-1
1
Oct
-11
Oct
-11
No
v-1
1
De
c-1
1
Ja
n-1
2
Fe
b-1
2
Ma
r-1
2
Ap
r-12
Ma
y-1
2
Ju
n-1
2
Jul-1
2
Au
g-1
2
USD/CHF EUR/CHF
Rate Sales EBITA
USD/CHF +/- 5% +/- CHF 38 million +/- CHF 11 million
EUR/CHF +/- 5% +/- CHF 24 million +/- CHF 12 million
June 2013

Page 64
BUSINESS CASE
CLEAR AND FOCUSED STRATEGY – CUSTOMER DRIVEN INNOVATION
SONOVA: «HEAR THE WORLD»
Key to our success - Our customers and our employees
Broadest product and service offering / portfolio - Hearing instruments (Phonak, Unitron)
- Cochlear implants (Advanced Bionics)
- Professional services (Connect Hearing Group)
Strong competitive positions - Leading position in hearing instruments
- Strong contender on cochlear implants
- Strong position in selected key retail markets
Significant market share gain potential - High R&D spend – fast product introduction
- Differentiated multi-brand strategy
- Optimized multi-channel approach
Strong product pipelines - High innovation rate and rapid new product introduction
Productivity / efficiency gains - Leverage existing global infrastructure to expand margins
Financial targets until FY 2016/17(at constant FX rates)
- EBITA margin: return to mid-twenties
- ROCE: expand to low-thirties
June 2013

THANK YOU VERY MUCH


![PIRAMAL HEALTHCARE LTD - Investor Presentation_June 2011[1]](https://img.pdfslide.net/doc/110x75/5500452f4a7959e6728b52a6/piramal-healthcare-ltd-investor-presentationjune-20111.jpg)