Embed Size (px)
Citation preview
Investor Presentation Q3 FY 2017-18
February 2018
This presentation is confidential and may not be copied, published, distributed or transmitted. The information in this presentation is being provided by Ujjivan Financial Services Limited (also referred to as ‘Company’). By attending a meeting where this presentation is made, or by reading this presentation material, you agree to be bound by following limitations:
The information in this presentation has been prepared for use in presentations by Company for information purposes only and does not constitute, or should be regarded as, or form part of any offer, invitation, inducement or advertisement to sell or issue, or any solicitation or any offer to purchase or subscribe for, any securities of the Company in any jurisdiction, including the United States and India, nor shall it, or the fact of its distribution form the basis of, or be relied on in connection with, any investment decision or any contract or commitment to purchase or subscribe for any securities of the Company in any jurisdiction, including the United States and India. This presentation does not constitute a recommendation by the Company or any other party to sell or buy any securities of the Company.
This presentation and its contents are not and should not be construed as a prospectus or an offer document, including as defined under the Companies Act, 2013, to the extent notified and in force or an offer document under the Securities and Exchange Board of India (Issue of Capital and Disclosure Requirements) Regulations, 2009as amended
The Company may alter, modify, or otherwise change in any manner the contents of this presentation without obligation to modify any person of such change or changes
No representation warranty implied as to and reliance or warranty, express or implied, is made to, no should be placed on, the fairness, accuracy, completeness or correctness of the information or opinions contained in this presentation. Neither Company nor any of its affiliates, advisors or representatives shall have any responsibility or liability whatsoever (for negligence or otherwise) for any loss howsoever arising from any use of this presentation or its contents or otherwise arising in connection with this presentation. The information set out herein may be subject to updating, completion, revision, verification and amendment and such information may change materially. This presentation is based on the economic, regulatory, market and other conditions as in effect on the date hereof. It should be understood that subsequent developments may affect the information contained in this presentation, which neither Company nor its affiliates, advisors or representatives are under an obligation to update, revise or affirm.
This presentation contains certain supplemental measures of performance and liquidity that are not required by or presented in accordance with Indian GAAP, and should not be considered as an alternative to profit, operating revenue or any other performance measures derived in accordance with Indian GAAP or an alternative to cash flow from operations as a measure of liquidity of the Company.
You must make your own assessment of the relevance, accuracy and adequacy of the information contained in this presentation and must make independent analysis as you may consider necessary or appropriate for such purpose. Any opinions expressed in this presentation are subject to change without notice and past performance is not indicative of future results. By attending this presentation you acknowledge that you will be solely responsible for your own assessment of the market position of the Company and that you will conduct your own analysis and be solely responsible for forming your own view of the potential future performance of the Company’s business.
This presentation contains forward‐looking statements based on the currently held beliefs and assumptions of the management of the Company, which are expressed in good faith and, in their opinion, reasonable. Forward‐looking statements involve known and unknown risks, uncertainties and other factors, which may cause the actual results, financial condition, performance, or achievements of the Company or industry results, to differ materially from the results, financial condition, performance or achievements expressed or implied by such forward‐looking statements. The risks and uncertainties relating to these statements include, but are not limited to, risks and uncertainties regarding expansion plans and the benefits there from, fluctuations in our earnings, our ability to manage growth and implement strategies, competition in our business including those factors which may affect our cost advantage, wage increases in India, our ability to attract and retain highly skilled professionals, our ability to win new contracts, changes in technology, availability of financing, our ability to successfully complete and integrate our expansion plans, liabilities, political instability and general economic conditions affecting our industry. Unless otherwise indicated, the information contained herein is preliminary and indicative and is based on management information, current plans and estimates. Industry and market‐related information is obtained or derived from industry publications and other sources and has not been verified by us. Given these risks, uncertainties and other factors, recipients of this document are cautioned not to place undue reliance on these forward‐looking statements. The Company disclaims any obligation to update these forward‐looking statements to reflect future events or developments.
This presentation is not an offer for sale of securities in the UNITED STATES or elsewhere.
Disclaimer 2
Performance Highlights - UFSL and USFB
Business Performance Overview
Liabilities Profile
Financial Performance Overview - Consolidated
Financial Performance Overview - Ujjivan SFB
Contents 3
Performance Highlights – UFSL and USFB
4
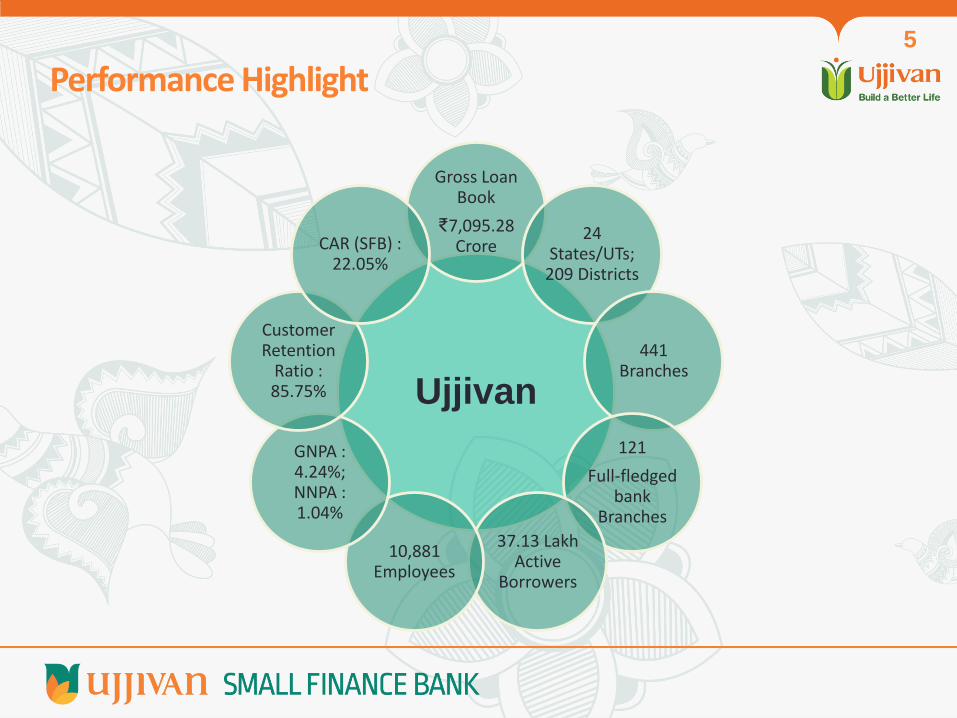
Ujjivan
Gross Loan Book
₹7,095.28 Crore
24 States/UTs;
209 Districts
441 Branches
121
Full-fledged bank
Branches
37.13 Lakh Active
Borrowers
10,881 Employees
GNPA : 4.24%; NNPA : 1.04%
Customer Retention
Ratio : 85.75%
CAR (SFB) : 22.05%
Performance Highlight 5
Business and Operational Highlights 6
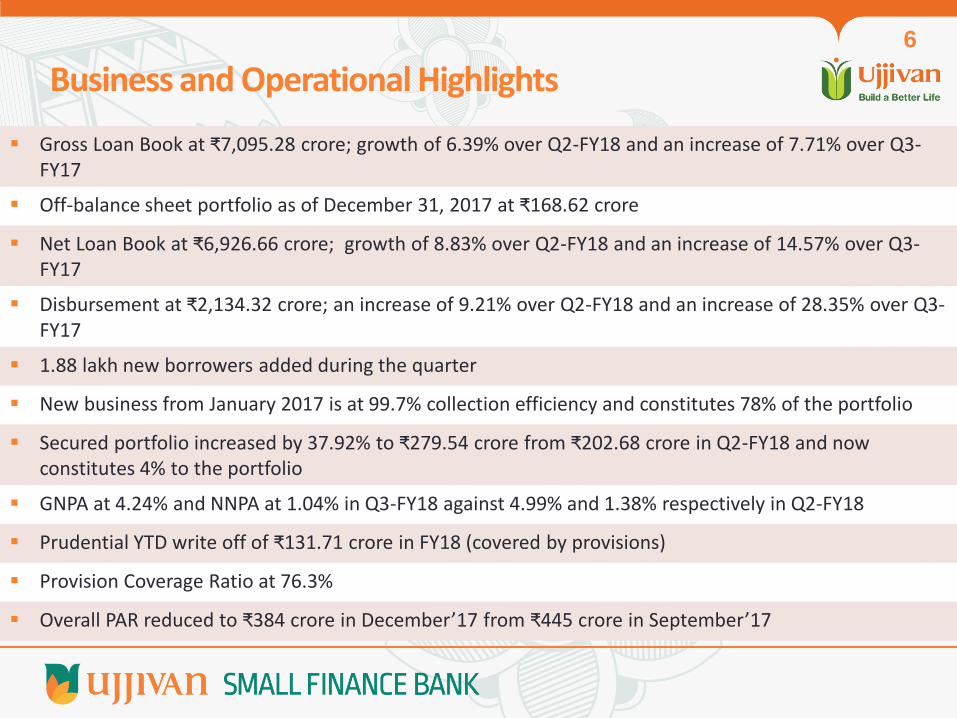
Gross Loan Book at ₹7,095.28 crore; growth of 6.39% over Q2-FY18 and an increase of 7.71% over Q3-FY17
Off-balance sheet portfolio as of December 31, 2017 at ₹168.62 crore
Net Loan Book at ₹6,926.66 crore; growth of 8.83% over Q2-FY18 and an increase of 14.57% over Q3-FY17
Disbursement at ₹2,134.32 crore; an increase of 9.21% over Q2-FY18 and an increase of 28.35% over Q3-FY17
1.88 lakh new borrowers added during the quarter
New business from January 2017 is at 99.7% collection efficiency and constitutes 78% of the portfolio
Secured portfolio increased by 37.92% to ₹279.54 crore from ₹202.68 crore in Q2-FY18 and now constitutes 4% to the portfolio
GNPA at 4.24% and NNPA at 1.04% in Q3-FY18 against 4.99% and 1.38% respectively in Q2-FY18
Prudential YTD write off of ₹131.71 crore in FY18 (covered by provisions)
Provision Coverage Ratio at 76.3%
Overall PAR reduced to ₹384 crore in December’17 from ₹445 crore in September’17
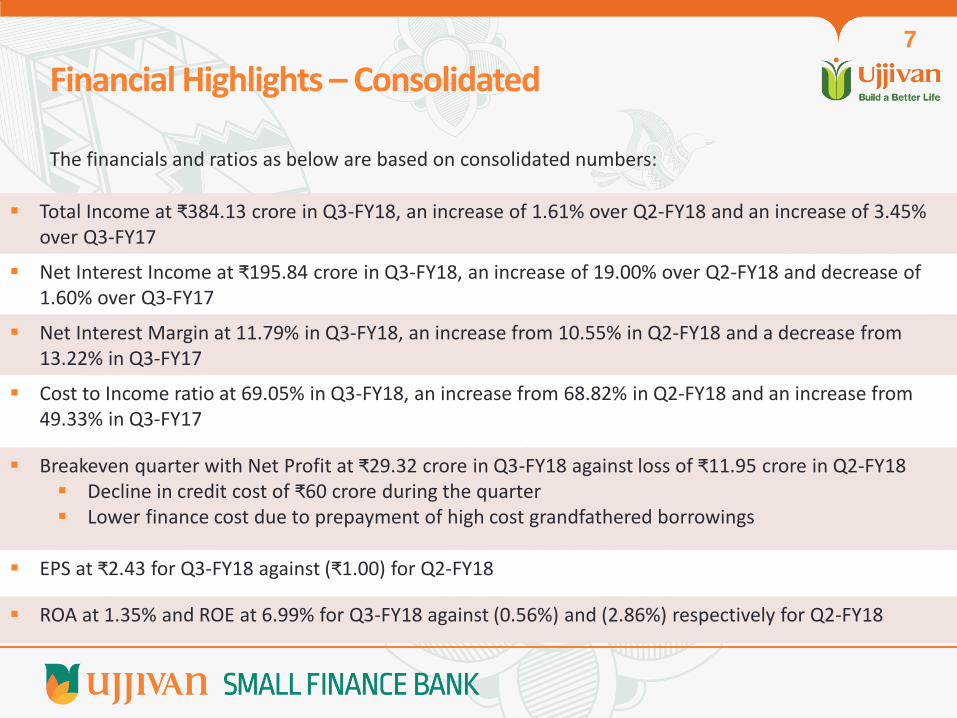
The financials and ratios as below are based on consolidated numbers:
Financial Highlights – Consolidated 7
Total Income at ₹384.13 crore in Q3-FY18, an increase of 1.61% over Q2-FY18 and an increase of 3.45% over Q3-FY17
Net Interest Income at ₹195.84 crore in Q3-FY18, an increase of 19.00% over Q2-FY18 and decrease of 1.60% over Q3-FY17
Net Interest Margin at 11.79% in Q3-FY18, an increase from 10.55% in Q2-FY18 and a decrease from 13.22% in Q3-FY17
Cost to Income ratio at 69.05% in Q3-FY18, an increase from 68.82% in Q2-FY18 and an increase from 49.33% in Q3-FY17
Breakeven quarter with Net Profit at ₹29.32 crore in Q3-FY18 against loss of ₹11.95 crore in Q2-FY18 Decline in credit cost of ₹60 crore during the quarter Lower finance cost due to prepayment of high cost grandfathered borrowings
EPS at ₹2.43 for Q3-FY18 against (₹1.00) for Q2-FY18
ROA at 1.35% and ROE at 6.99% for Q3-FY18 against (0.56%) and (2.86%) respectively for Q2-FY18
Financial Highlights – Ujjivan SFB 8
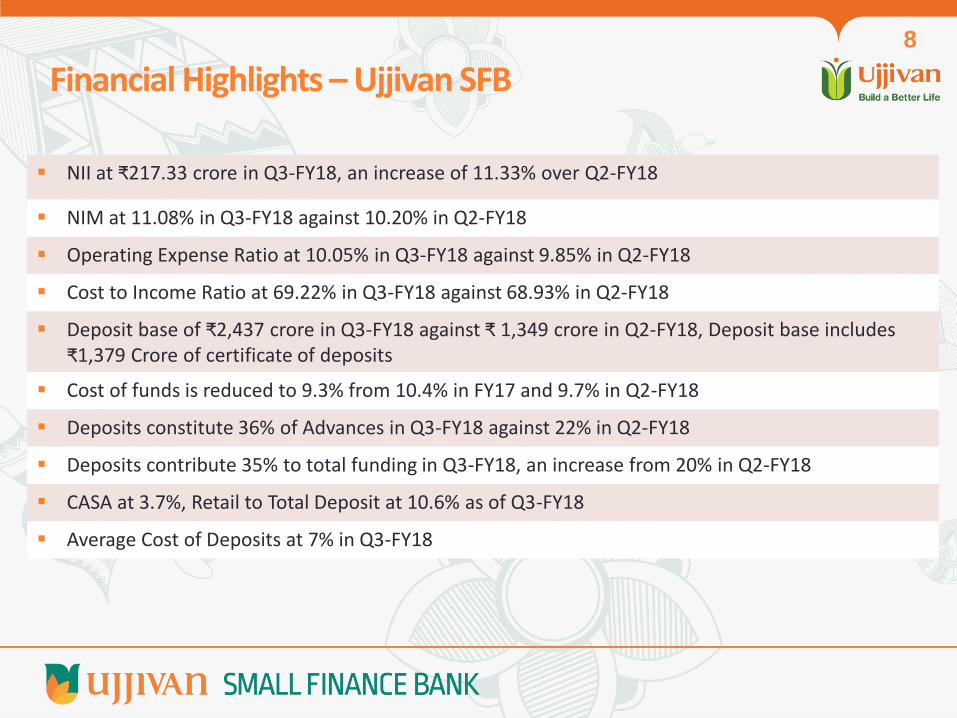
NII at ₹217.33 crore in Q3-FY18, an increase of 11.33% over Q2-FY18
NIM at 11.08% in Q3-FY18 against 10.20% in Q2-FY18
Operating Expense Ratio at 10.05% in Q3-FY18 against 9.85% in Q2-FY18
Cost to Income Ratio at 69.22% in Q3-FY18 against 68.93% in Q2-FY18
Deposit base of ₹2,437 crore in Q3-FY18 against ₹ 1,349 crore in Q2-FY18, Deposit base includes ₹1,379 Crore of certificate of deposits
Cost of funds is reduced to 9.3% from 10.4% in FY17 and 9.7% in Q2-FY18
Deposits constitute 36% of Advances in Q3-FY18 against 22% in Q2-FY18
Deposits contribute 35% to total funding in Q3-FY18, an increase from 20% in Q2-FY18
CASA at 3.7%, Retail to Total Deposit at 10.6% as of Q3-FY18
Average Cost of Deposits at 7% in Q3-FY18

GNPA and NNPA
PAR and Provision - On Book (₹ in Crore)
PAR %
PAR and Provision - All Assets (₹ in Crore)
511.4
395.2
337.7 270.9 268.7
258.0
June September December
PAR Provision
571.2
445.5 383.6
277.2 276.5 271.6
June September DecemberPAR Provision
2.30% 1.38% 1.04%
6.16%
4.99% 4.24%
Q1-FY18 Q2-FY18 Q3-FY18
NNPA GNPA
GNPA, NNPA and PAR
8.8%
6.7%
5.4%
6.1%
5.5%
4.6%
June September December
PAR>0 PAR>90
9

Overall PAR has reduced by ₹61.9 crore during the quarter and stands at ₹383.6 crore as of 31st December’17 (post technical write-off)
YTD FY18 write off amount close to ₹131.71 crore, Q3-FY18 write off amount at ₹33.53 crore
Dedicated focus on collection of hard bucket OD resulted in better traction (34% in Q3)
Particulars (on Book) Q3 FY-18 (₹ in Crore)
GNPA 4.24%
Standard Assets 6,640.9
NPA 294.3
Provision on NPA 224.5
Cumulative Provision 271.6
Provision Coverage Ratio 76.3%
Provisioning and Write offs 10

Ujjivan SFB Business
11
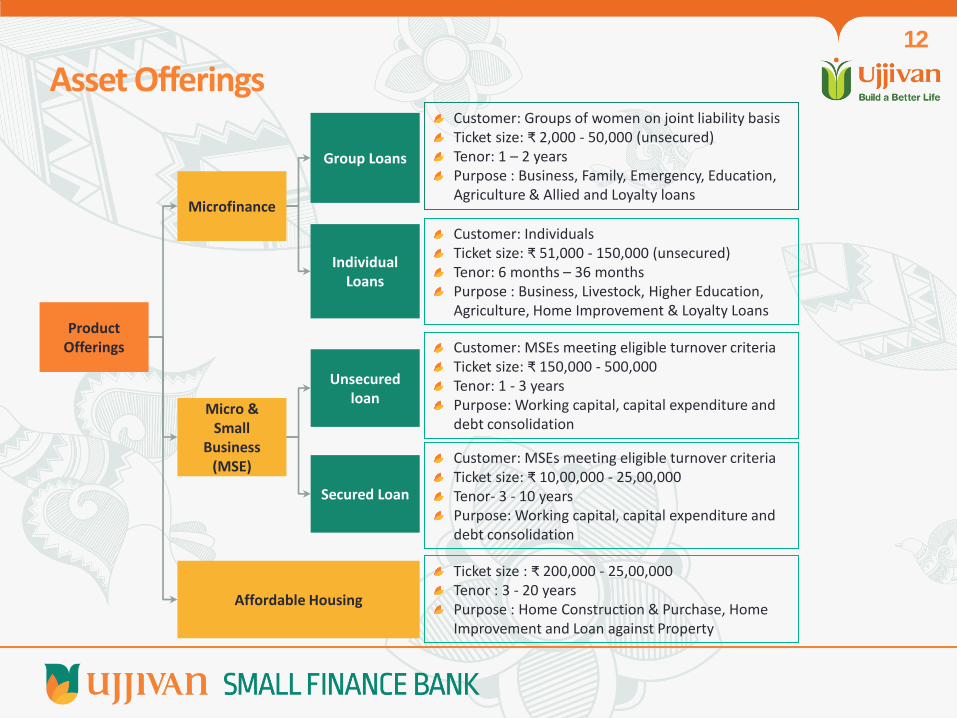
Microfinance
Group Loans
Individual Loans
Customer: Groups of women on joint liability basis Ticket size: ₹ 2,000 - 50,000 (unsecured) Tenor: 1 – 2 years Purpose : Business, Family, Emergency, Education, Agriculture & Allied and Loyalty loans
Product Offerings
Customer: Individuals Ticket size: ₹ 51,000 - 150,000 (unsecured) Tenor: 6 months – 36 months Purpose : Business, Livestock, Higher Education, Agriculture, Home Improvement & Loyalty Loans
Micro & Small
Business (MSE)
Unsecured loan
Secured Loan
Affordable Housing
Customer: MSEs meeting eligible turnover criteria Ticket size: ₹ 150,000 - 500,000 Tenor: 1 - 3 years Purpose: Working capital, capital expenditure and debt consolidation
Customer: MSEs meeting eligible turnover criteria Ticket size: ₹ 10,00,000 - 25,00,000 Tenor- 3 - 10 years Purpose: Working capital, capital expenditure and debt consolidation
Ticket size : ₹ 200,000 - 25,00,000 Tenor : 3 - 20 years Purpose : Home Construction & Purchase, Home Improvement and Loan against Property
Asset Offerings 12

Fee Based Products (Third Party Insurance products)
Partnered with Bajaj Allianz Life Insurance Co Ltd, HDFC Standard Life Insurance Co Ltd,
Aditya Birla Sun Life Insurance Co Ltd to cover our Loan Borrowers.
Pilot Launched in 20 bank Branches with 11 Individual Insurance Products in association with Bajaj Allianz Life Insurance Co Ltd & Aditya Birla Sun Life Insurance Co Ltd targeted at existing and new to Bank customers. Shortly we will be rolling out products with HDFC Standard Life Insurance Co Ltd.
Product proposition under discussion with Bajaj Allianz General Insurance Co Ltd for MSE and Housing borrowers
No minimum deposit charges, no minimum balance requirement
Unlimited free transactions at Ujjivan SFB ATMs
Product for Senior Citizen launched on 11th Dec; provided free lifetime debit card
Interest rate : 4%
Attractive Entry Level - ₹ 1000 for FD and ₹ 100 for RD
No penalty upon premature and partial withdrawal after 6 months
Processing through branch, centre meetings, mobile and internet banking
Interest rate of 5.5% - 8%, additional interest rate of 0.5% for senior citizens
TAX SAVER FIXED DEPOSIT (launched on 8th Jan)
Avail tax exemption under Section 80C of Income Tax Act, 1961
Min Rs 1000 and Max of Rs 1,50,000 with monthly/quarterly interest pay out
Free cash deposits across all Ujjivan branches upto 10 times of the previous month’s average balance
Electronic fund transfer and unlimited free ATM transactions at Ujjivan ATMs
Deposits
• Retail
• Institutional
Current Accounts
Savings Account
Liability Offerings Update 13
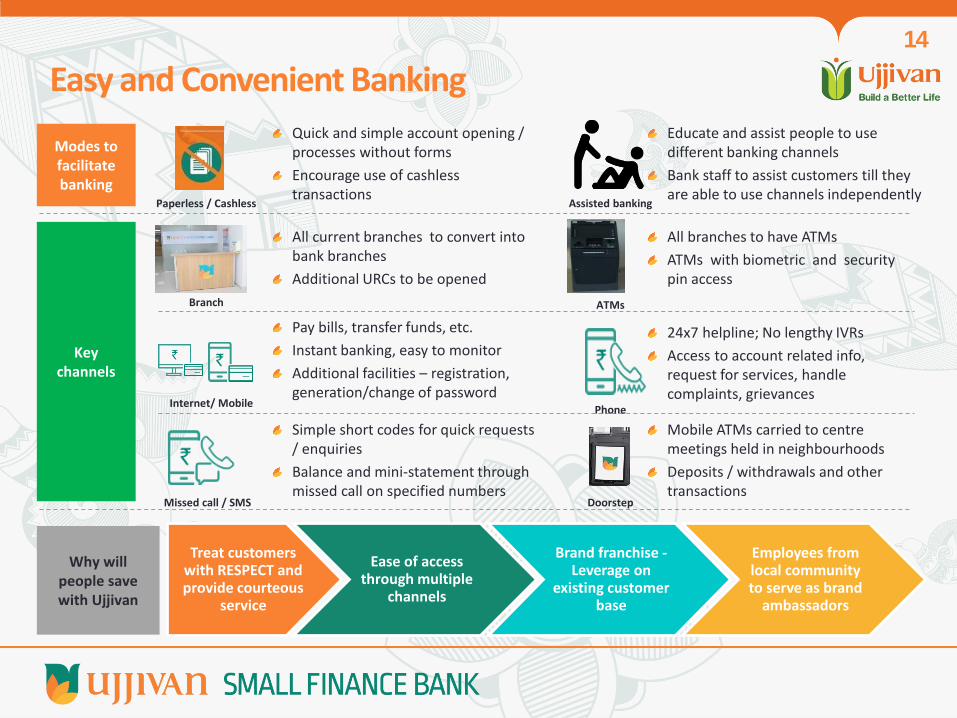
All branches to have ATMs
ATMs with biometric and security pin access
Key channels
Pay bills, transfer funds, etc.
Instant banking, easy to monitor
Additional facilities – registration, generation/change of password
Mobile ATMs carried to centre meetings held in neighbourhoods
Deposits / withdrawals and other transactions
All current branches to convert into bank branches
Additional URCs to be opened
Simple short codes for quick requests / enquiries
Balance and mini-statement through missed call on specified numbers
24x7 helpline; No lengthy IVRs
Access to account related info, request for services, handle complaints, grievances
Why will people save with Ujjivan
Treat customers with RESPECT and provide courteous
service
Ease of access through multiple
channels
Brand franchise - Leverage on
existing customer base
Employees from local community to serve as brand
ambassadors
Branch ATMs
Internet/ Mobile Phone
Missed call / SMS Doorstep
Quick and simple account opening / processes without forms
Encourage use of cashless transactions
Educate and assist people to use different banking channels
Bank staff to assist customers till they are able to use channels independently
Paperless / Cashless Assisted banking
Modes to facilitate banking
Easy and Convenient Banking 14
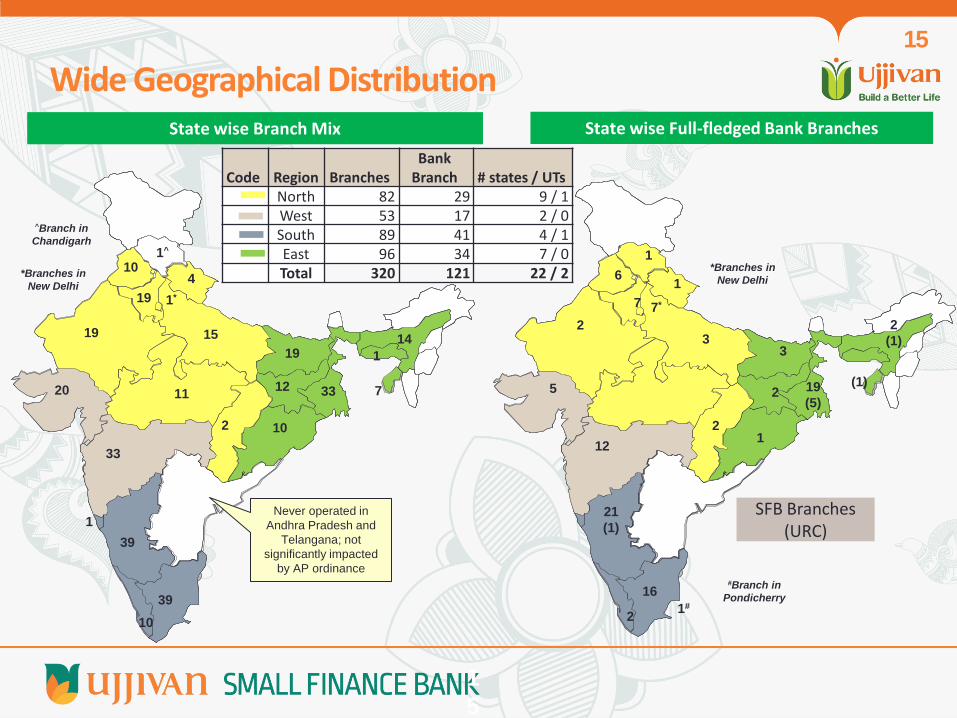
State wise Branch Mix
39
33
39
33
20
15
19
19 14
12
10
10
10
19
#Branch in
Pondicherry
11 7
4 *Branches in
New Delhi
2
1
1^
^Branch in
Chandigarh
1
Code Region Branches
Bank Branch # states / UTs
North 82 29 9 / 1 West 53 17 2 / 0 South 89 41 4 / 1 East 96 34 7 / 0 Total 320 121 22 / 2
Never operated in
Andhra Pradesh and
Telangana; not
significantly impacted
by AP ordinance
Wide Geographical Distribution
1*
1
5
15
State wise Full-fledged Bank Branches
6
2
(1) 3
2
5
7
1
2
21
(1)
16
2
19
(5)
12
3 2
1
1
7*
*Branches in
New Delhi
1#
(1)
SFB Branches (URC)

0.10% 0.12% 0.20% 0.24%
0.57% 0.57% 0.74%
1.32% 1.57%
1.91% 2.32%
2.80% 2.82% 2.92%
3.58% 3.64%
4.10% 4.63%
5.04% 6.14%
10.87% 13.87%
14.74% 15.17%
GOAHimachal Pradesh
Chandigarh(UT)Meghalaya
ChhattisgarhUttarakhandPondicherry
TripuraMadhya Pradesh
New DelhiKerala
JharkhandOdishaPunjab
RajasthanUttar Pradesh
AssamHaryana
BiharGujarat
MaharashtraWest Bengal
KarnatakaTamil nadu
Highly diversified
with no state
accounting for more than 16% of overall portfolio
State wise Portfolio Mix (%) – Q3 FY2017-18
33.08%
30.19%
19.72%
17.01%
South East North West
Total Gross Loan Book: ₹ 7,095.28 Crore
Gross Loan Book Mix - Region wise
Diversified Portfolio Mix
1
6
16
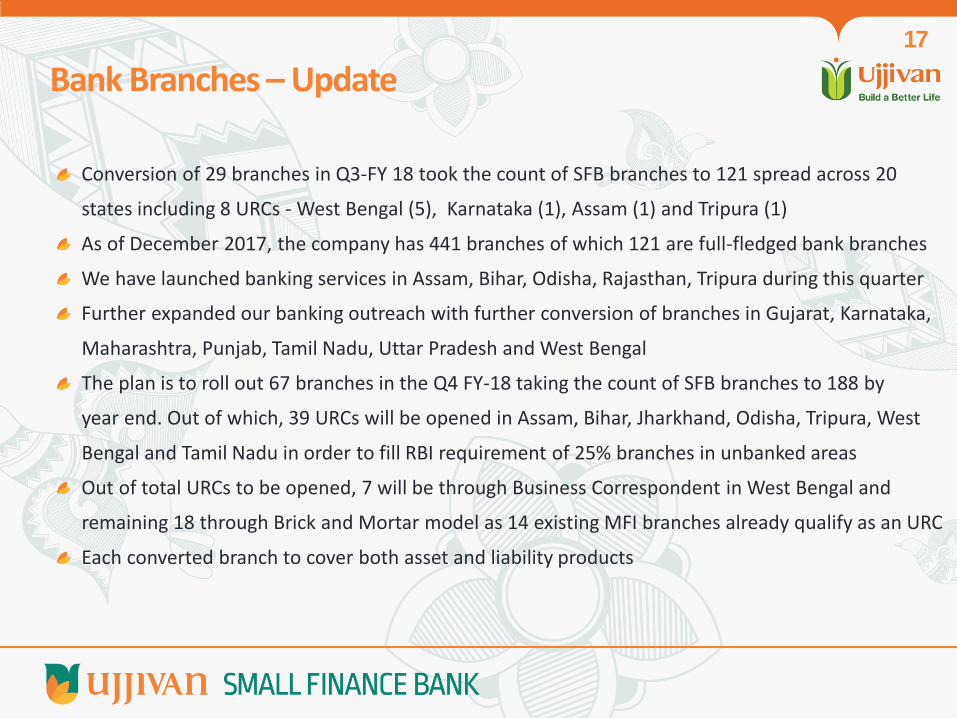
Conversion of 29 branches in Q3-FY 18 took the count of SFB branches to 121 spread across 20
states including 8 URCs - West Bengal (5), Karnataka (1), Assam (1) and Tripura (1)
As of December 2017, the company has 441 branches of which 121 are full-fledged bank branches
We have launched banking services in Assam, Bihar, Odisha, Rajasthan, Tripura during this quarter
Further expanded our banking outreach with further conversion of branches in Gujarat, Karnataka,
Maharashtra, Punjab, Tamil Nadu, Uttar Pradesh and West Bengal
The plan is to roll out 67 branches in the Q4 FY-18 taking the count of SFB branches to 188 by
year end. Out of which, 39 URCs will be opened in Assam, Bihar, Jharkhand, Odisha, Tripura, West
Bengal and Tamil Nadu in order to fill RBI requirement of 25% branches in unbanked areas
Out of total URCs to be opened, 7 will be through Business Correspondent in West Bengal and
remaining 18 through Brick and Mortar model as 14 existing MFI branches already qualify as an URC
Each converted branch to cover both asset and liability products
Bank Branches – Update 17
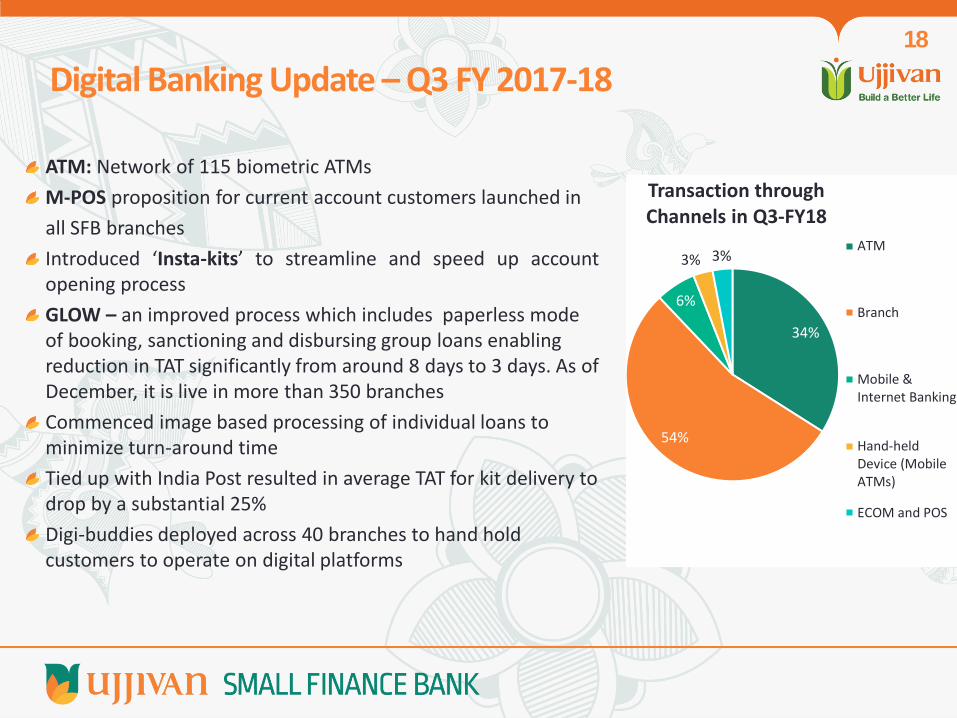
ATM: Network of 115 biometric ATMs
M-POS proposition for current account customers launched in
all SFB branches
Introduced ‘Insta-kits’ to streamline and speed up account opening process
GLOW – an improved process which includes paperless mode of booking, sanctioning and disbursing group loans enabling reduction in TAT significantly from around 8 days to 3 days. As of December, it is live in more than 350 branches
Commenced image based processing of individual loans to minimize turn-around time
Tied up with India Post resulted in average TAT for kit delivery to drop by a substantial 25%
Digi-buddies deployed across 40 branches to hand hold customers to operate on digital platforms
34%
54%
6%
3% 3%
Transaction through Channels in Q3-FY18
ATM
Branch
Mobile &Internet Banking
Hand-heldDevice (MobileATMs)
ECOM and POS
Digital Banking Update – Q3 FY 2017-18 18
Business Performance Overview
19
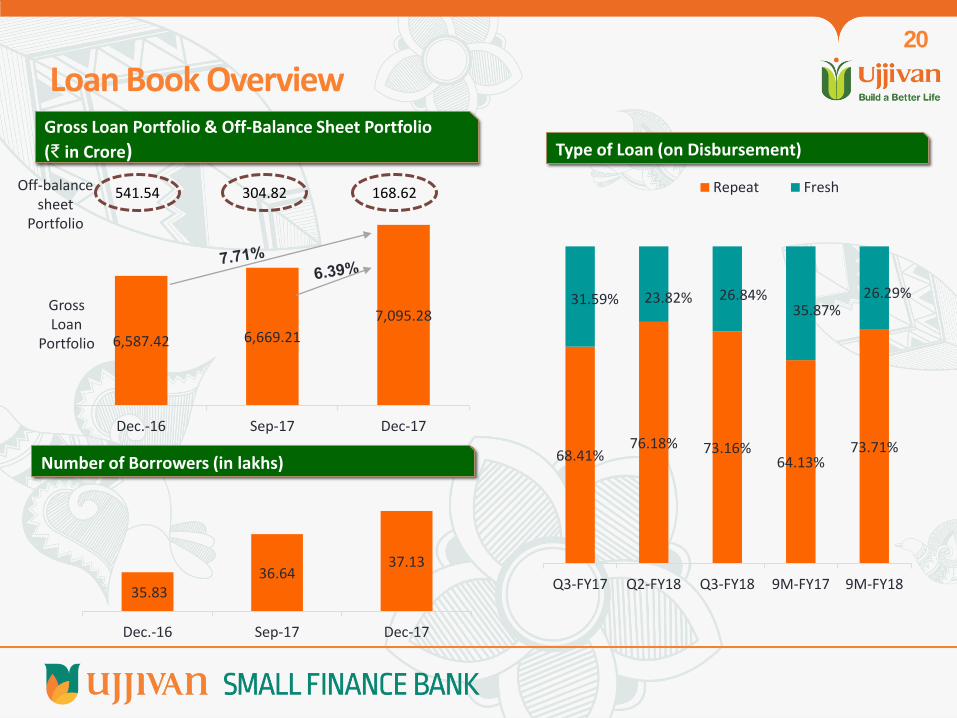
6,587.42 6,669.21
7,095.28
Dec.-16 Sep-17 Dec-17
Gross Loan
Portfolio
168.62 Off-balance sheet
Portfolio
Gross Loan Portfolio & Off-Balance Sheet Portfolio
(₹ in Crore)
35.83 36.64
37.13
Dec.-16 Sep-17 Dec-17
Loan Book Overview
541.54 304.82
Number of Borrowers (in lakhs)
20
Type of Loan (on Disbursement)
68.41% 76.18% 73.16%
64.13% 73.71%
31.59% 23.82% 26.84% 35.87%
26.29%
Q3-FY17 Q2-FY18 Q3-FY18 9M-FY17 9M-FY18
Repeat Fresh
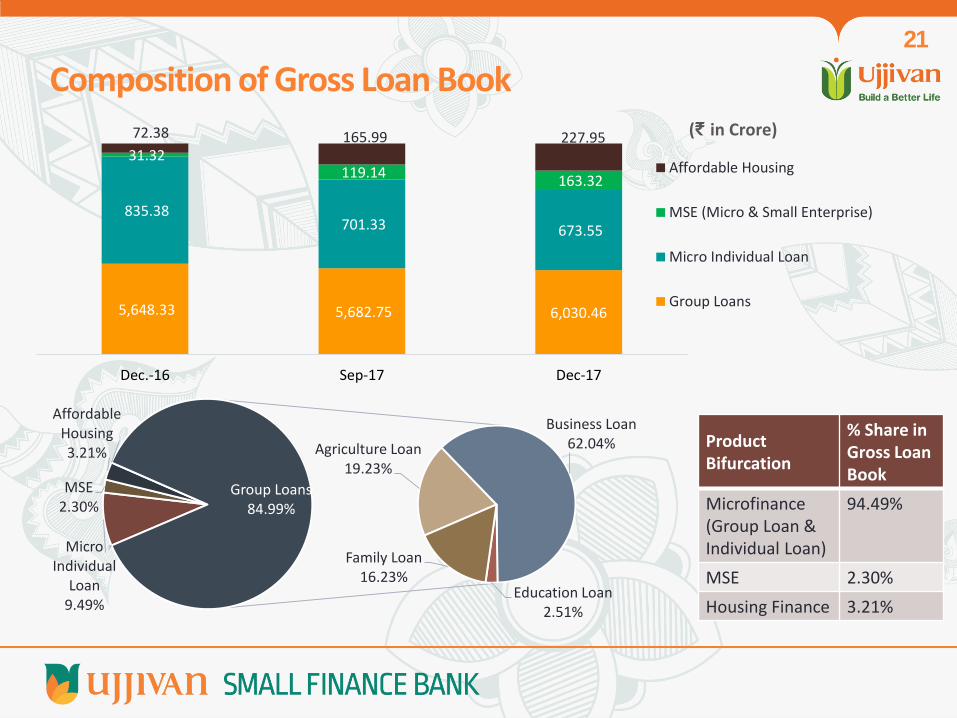
5,648.33 5,682.75 6,030.46
835.38 701.33 673.55
31.32 119.14
163.32
72.38 165.99 227.95
Dec.-16 Sep-17 Dec-17
Affordable Housing
MSE (Micro & Small Enterprise)
Micro Individual Loan
Group Loans
Product Bifurcation
% Share in Gross Loan Book
Microfinance (Group Loan & Individual Loan)
94.49%
MSE 2.30%
Housing Finance 3.21%
(₹ in Crore)
Micro Individual
Loan 9.49%
MSE 2.30%
Affordable Housing 3.21% Agriculture Loan
19.23%
Business Loan 62.04%
Education Loan 2.51%
Family Loan 16.23%
Group Loans 84.99%
Composition of Gross Loan Book 21
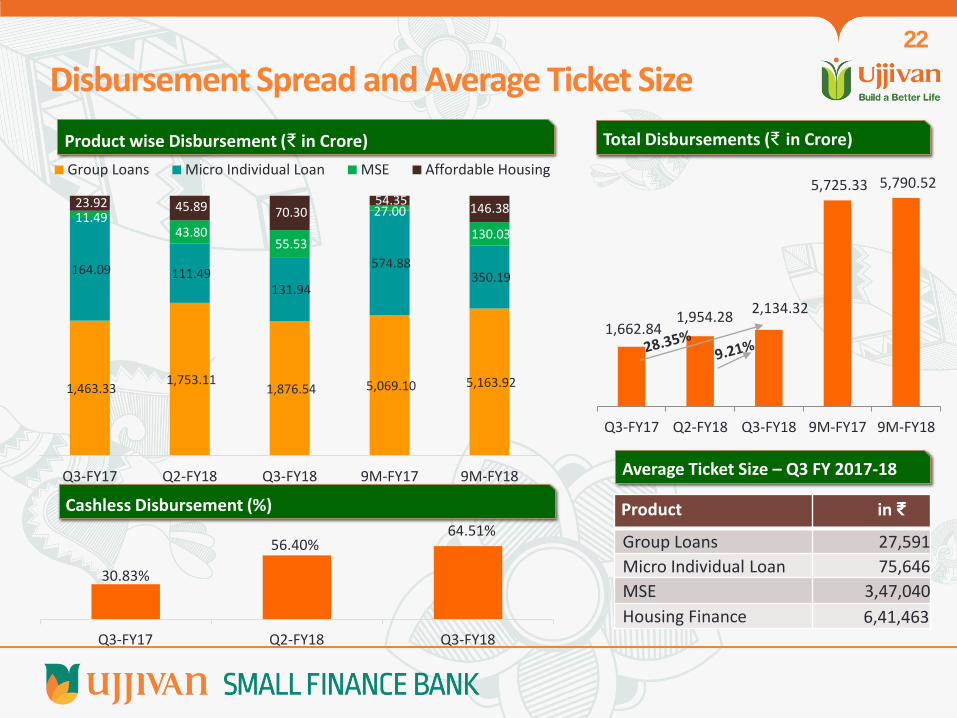
Product wise Disbursement (₹ in Crore)
Product in ₹
Group Loans 27,591
Micro Individual Loan 75,646
MSE 3,47,040
Housing Finance 6,41,463
Average Ticket Size – Q3 FY 2017-18
1,463.33 1,753.11
1,876.54 5,069.10 5,163.92
164.09 111.49 131.94
574.88 350.19
11.49 43.80
55.53
27.00
130.03
23.92 45.89 70.30 54.35
146.38
Q3-FY17 Q2-FY18 Q3-FY18 9M-FY17 9M-FY18
Group Loans Micro Individual Loan MSE Affordable Housing
1,662.84 1,954.28
2,134.32
5,725.33 5,790.52
Q3-FY17 Q2-FY18 Q3-FY18 9M-FY17 9M-FY18
Total Disbursements (₹ in Crore)
Disbursement Spread and Average Ticket Size 22
30.83%
56.40% 64.51%
Q3-FY17 Q2-FY18 Q3-FY18
Cashless Disbursement (%)
Liabilities Profile
23
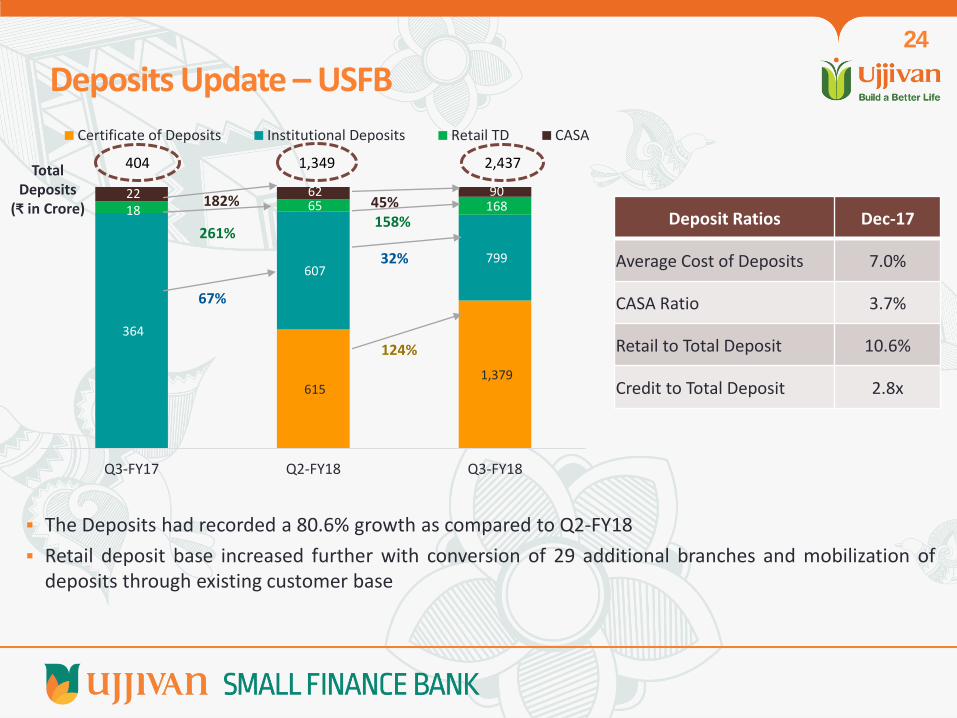
615 1,379
364
607 799
18 65 168 22 62 90
Q3-FY17 Q2-FY18 Q3-FY18
Certificate of Deposits Institutional Deposits Retail TD CASA
The Deposits had recorded a 80.6% growth as compared to Q2-FY18
Retail deposit base increased further with conversion of 29 additional branches and mobilization of deposits through existing customer base
Deposit Ratios Dec-17
Average Cost of Deposits 7.0%
CASA Ratio 3.7%
Retail to Total Deposit 10.6%
Credit to Total Deposit 2.8x
Deposits Update – USFB 24
67%
32%
182% 45%
261% 158%
124%
404 Total Deposits
(₹ in Crore)
1,349 2,437
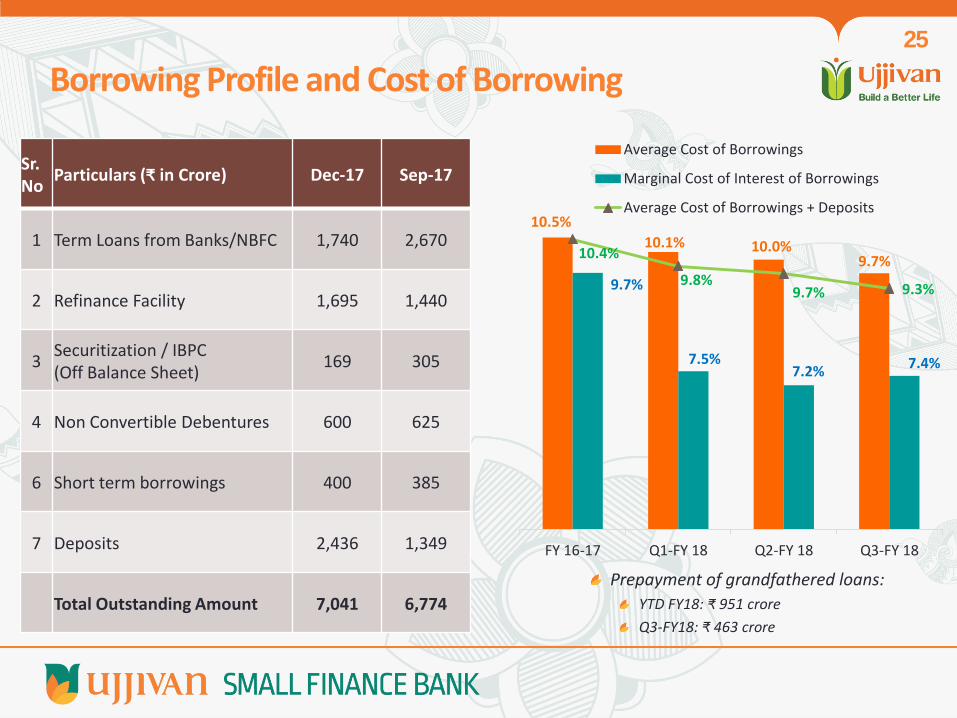
Sr. No
Particulars (₹ in Crore) Dec-17 Sep-17
1 Term Loans from Banks/NBFC 1,740 2,670
2 Refinance Facility 1,695 1,440
3 Securitization / IBPC (Off Balance Sheet)
169 305
4 Non Convertible Debentures 600 625
6 Short term borrowings 400 385
7 Deposits 2,436 1,349
Total Outstanding Amount 7,041 6,774
Borrowing Profile and Cost of Borrowing
10.5%
10.1% 10.0% 9.7%
9.7%
7.5% 7.2%
7.4%
10.4%
9.8% 9.7% 9.3%
FY 16-17 Q1-FY 18 Q2-FY 18 Q3-FY 18
Average Cost of Borrowings
Marginal Cost of Interest of Borrowings
Average Cost of Borrowings + Deposits
25
Prepayment of grandfathered loans:
YTD FY18: ₹ 951 crore
Q3-FY18: ₹ 463 crore
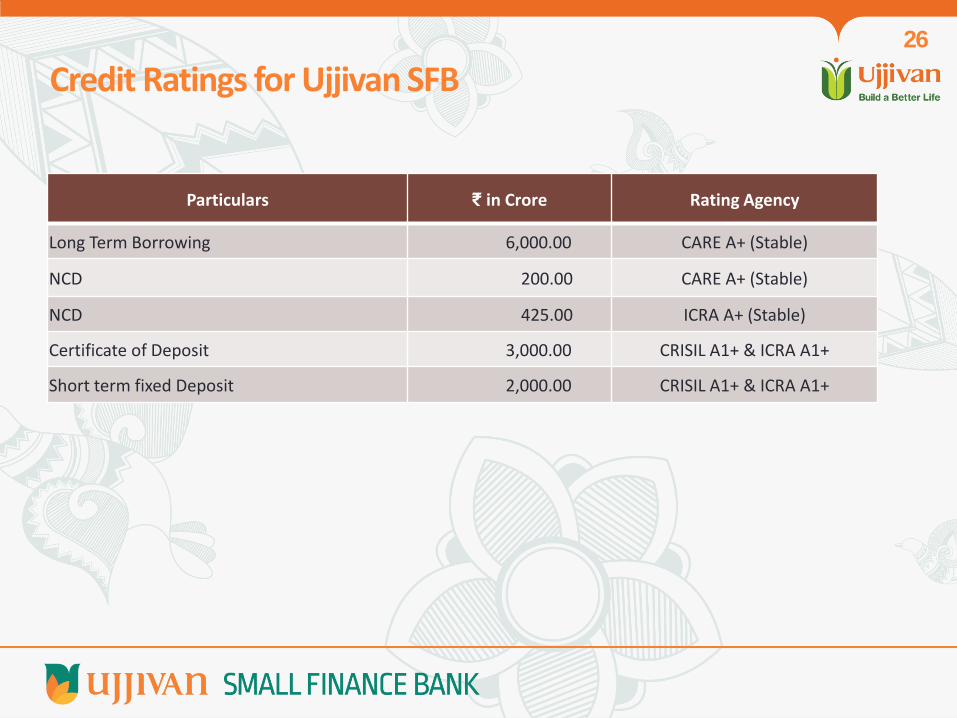
Particulars ₹ in Crore Rating Agency
Long Term Borrowing 6,000.00 CARE A+ (Stable)
NCD 200.00 CARE A+ (Stable)
NCD 425.00 ICRA A+ (Stable)
Certificate of Deposit 3,000.00 CRISIL A1+ & ICRA A1+
Short term fixed Deposit 2,000.00 CRISIL A1+ & ICRA A1+
Credit Ratings for Ujjivan SFB 26
Financial Overview – Consolidated UFSL
27

NII (₹ in Crore) and NIM
Total Income and Net Profit (₹ in Crore)
371.32 378.03 384.13
1,057.63 1,120.79
Q3-FY17 Q2-FY18 Q3-FY18 9M-FY17 9M-FY18
29.32 Net
Profit
Total Income
Average Net
worth
Average Total
Assets
Average Total Assets and Net worth (₹ in Crore)
Avg. Debt / Avg. Net
worth
Average Debt
Average Debt (₹ in Crore)
(11.95)
199.01 164.57 195.84
559.09 498.63
13.22%
10.55% 11.79% 13.42%
10.39%
Q3-FY17 Q2-FY18 Q3-FY18 9M-FY17 9M-FY18
NII NIM (%)
6,938.32 8,497.25 8,699.29
6,475.40
8,698.50
Q3-FY17 Q2-FY18 Q3-FY18 9M-FY17 9M-FY18
4,919.71
5,579.30
4,777.57 4,744.34
5,363.41
Q3-FY17 Q2-FY18 Q3-FY18 9M-FY17 9M-FY18
Financial Overview
43.94 1,709.83
3.01 3.34 2.85
1,671.25 1,676.80 188.32 (57.58) 1,465.31 1,724.43
3.52 3.11
28
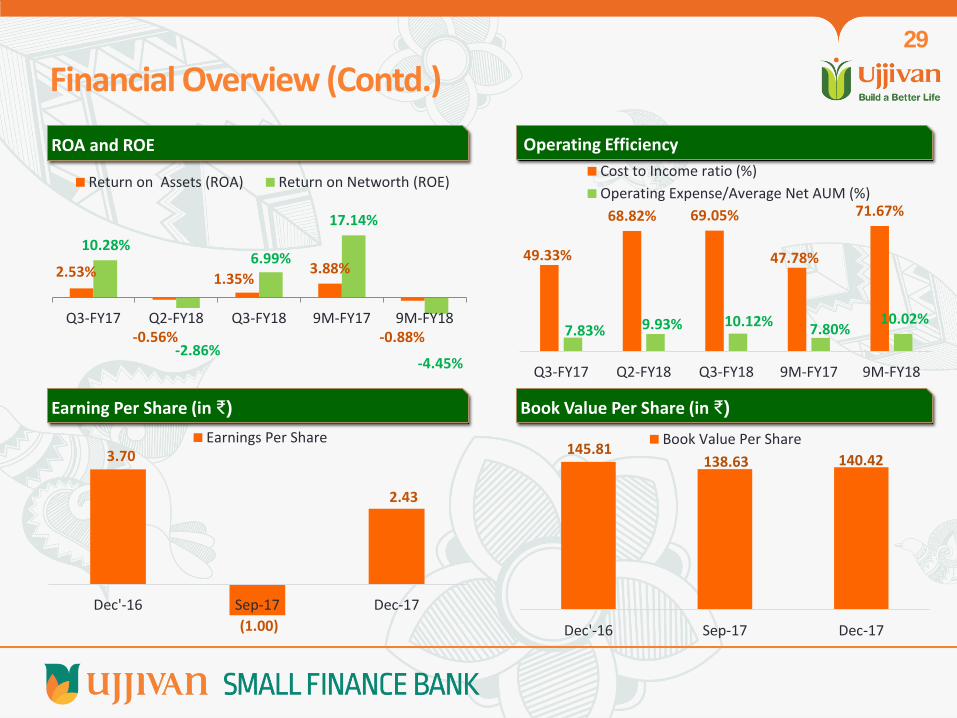
Earning Per Share (in ₹)
Operating Efficiency
Book Value Per Share (in ₹)
145.81 138.63 140.42
Dec'-16 Sep-17 Dec-17
Book Value Per Share
ROA and ROE
3.70
(1.00)
2.43
Dec'-16 Sep-17 Dec-17
Earnings Per Share
Financial Overview (Contd.)
2.53%
-0.56%
1.35% 3.88%
-0.88%
10.28%
-2.86%
6.99%
17.14%
-4.45%
Q3-FY17 Q2-FY18 Q3-FY18 9M-FY17 9M-FY18
Return on Assets (ROA) Return on Networth (ROE)
49.33%
68.82% 69.05%
47.78%
71.67%
7.83% 9.93% 10.12% 7.80%
10.02%
Q3-FY17 Q2-FY18 Q3-FY18 9M-FY17 9M-FY18
Cost to Income ratio (%)
Operating Expense/Average Net AUM (%)
29
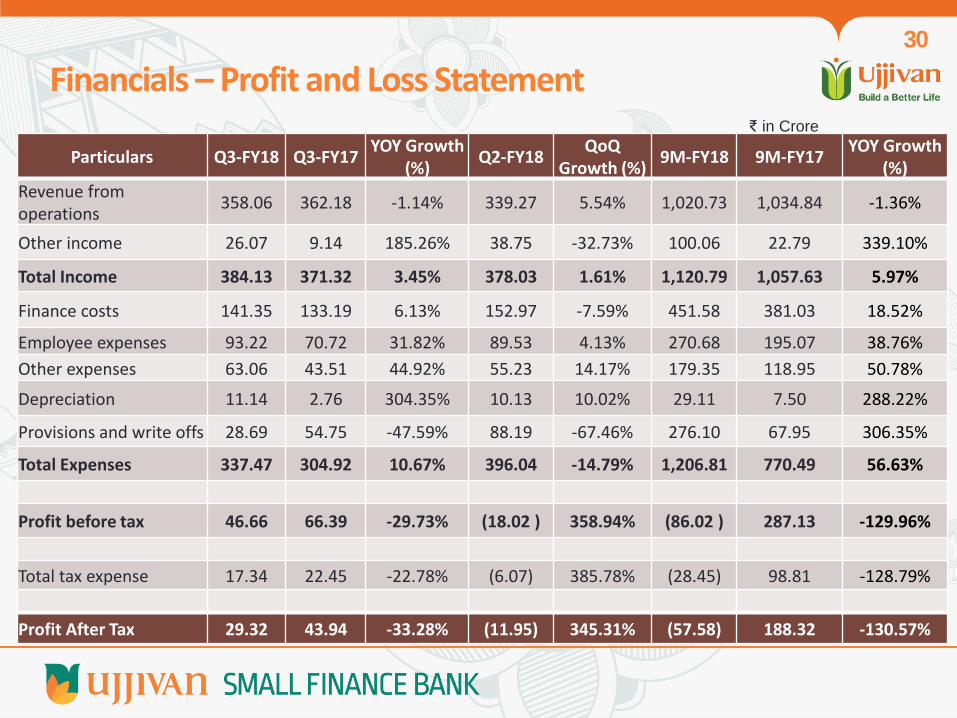
Particulars Q3-FY18 Q3-FY17 YOY Growth
(%) Q2-FY18
QoQ Growth (%)
9M-FY18 9M-FY17 YOY Growth
(%) Revenue from operations
358.06 362.18 -1.14% 339.27 5.54% 1,020.73 1,034.84 -1.36%
Other income 26.07 9.14 185.26% 38.75 -32.73% 100.06 22.79 339.10%
Total Income 384.13 371.32 3.45% 378.03 1.61% 1,120.79 1,057.63 5.97%
Finance costs 141.35 133.19 6.13% 152.97 -7.59% 451.58 381.03 18.52%
Employee expenses 93.22 70.72 31.82% 89.53 4.13% 270.68 195.07 38.76%
Other expenses 63.06 43.51 44.92% 55.23 14.17% 179.35 118.95 50.78%
Depreciation 11.14 2.76 304.35% 10.13 10.02% 29.11 7.50 288.22%
Provisions and write offs 28.69 54.75 -47.59% 88.19 -67.46% 276.10 67.95 306.35%
Total Expenses 337.47 304.92 10.67% 396.04 -14.79% 1,206.81 770.49 56.63%
Profit before tax 46.66 66.39 -29.73% (18.02 ) 358.94% (86.02 ) 287.13 -129.96%
Total tax expense 17.34 22.45 -22.78% (6.07) 385.78% (28.45) 98.81 -128.79%
Profit After Tax 29.32 43.94 -33.28% (11.95) 345.31% (57.58) 188.32 -130.57%
₹ in Crore
Financials – Profit and Loss Statement 30
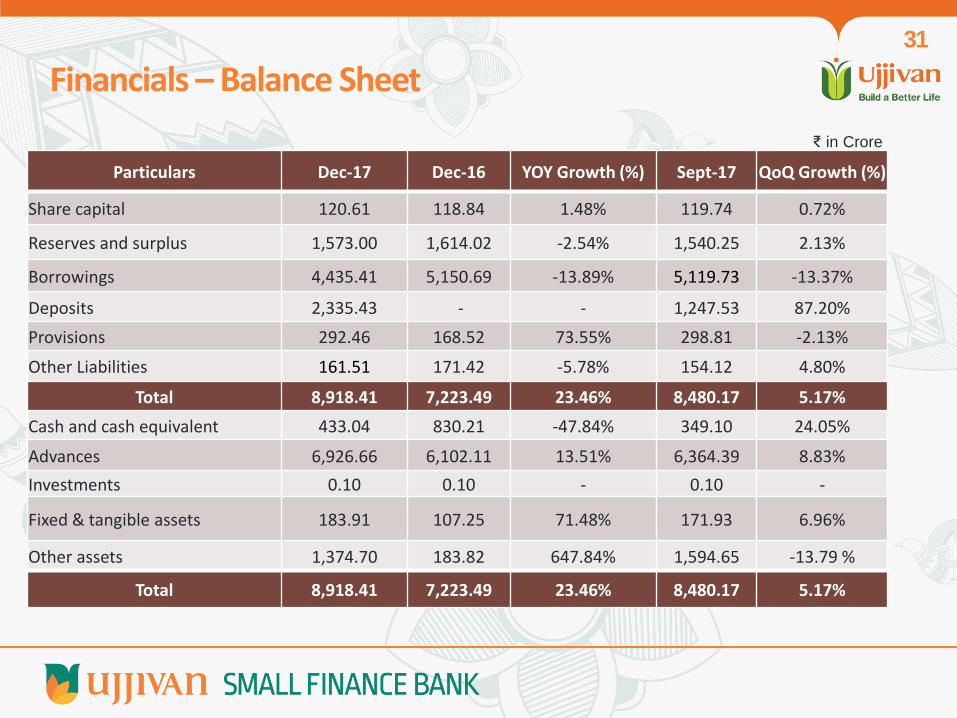
₹ in Crore
Particulars Dec-17 Dec-16 YOY Growth (%) Sept-17 QoQ Growth (%)
Share capital 120.61 118.84 1.48% 119.74 0.72%
Reserves and surplus 1,573.00 1,614.02 -2.54% 1,540.25 2.13%
Borrowings 4,435.41 5,150.69 -13.89% 5,119.73 -13.37%
Deposits 2,335.43 - - 1,247.53 87.20%
Provisions 292.46 168.52 73.55% 298.81 -2.13%
Other Liabilities 161.51 171.42 -5.78% 154.12 4.80%
Total 8,918.41 7,223.49 23.46% 8,480.17 5.17%
Cash and cash equivalent 433.04 830.21 -47.84% 349.10 24.05%
Advances 6,926.66 6,102.11 13.51% 6,364.39 8.83%
Investments 0.10 0.10 - 0.10 -
Fixed & tangible assets 183.91 107.25 71.48% 171.93 6.96%
Other assets 1,374.70 183.82 647.84% 1,594.65 -13.79 %
Total 8,918.41 7,223.49 23.46% 8,480.17 5.17%
Financials – Balance Sheet 31
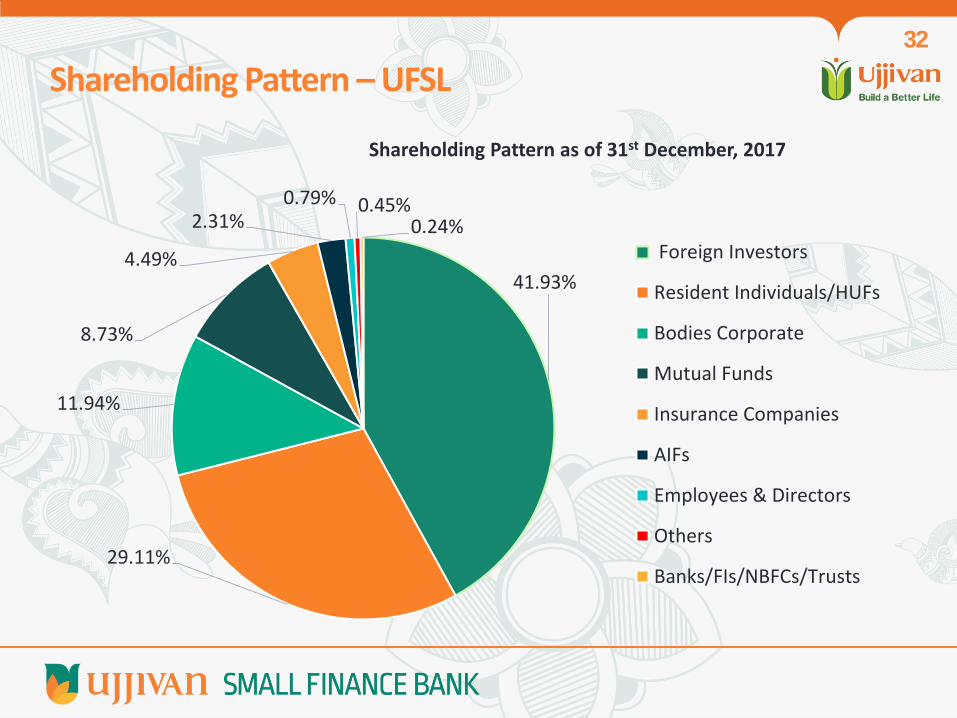
41.93%
29.11%
11.94%
8.73%
4.49%
2.31% 0.79% 0.45%
0.24%
Shareholding Pattern as of 31st December, 2017
Foreign Investors
Resident Individuals/HUFs
Bodies Corporate
Mutual Funds
Insurance Companies
AIFs
Employees & Directors
Others
Banks/FIs/NBFCs/Trusts
Shareholding Pattern – UFSL 32
Financial Overview – Ujjivan SFB
33
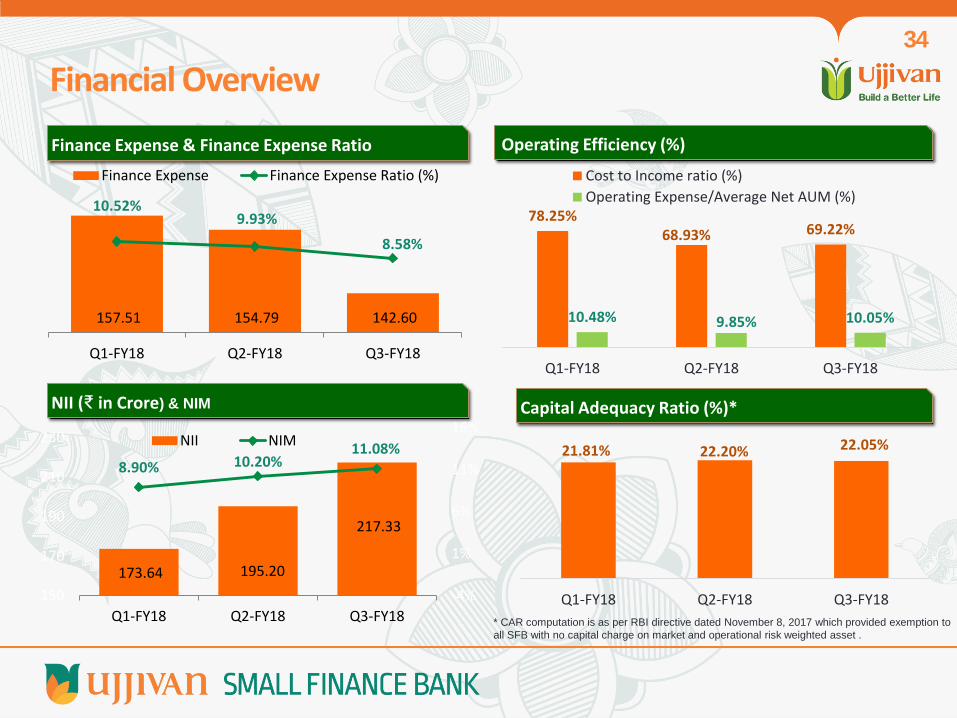
NII (₹ in Crore) & NIM
Operating Efficiency (%)
78.25% 68.93% 69.22%
10.48% 9.85% 10.05%
Q1-FY18 Q2-FY18 Q3-FY18
Cost to Income ratio (%)
Operating Expense/Average Net AUM (%)
Finance Expense & Finance Expense Ratio
157.51 154.79 142.60
10.52% 9.93%
8.58%
Q1-FY18 Q2-FY18 Q3-FY18
Finance Expense Finance Expense Ratio (%)
Financial Overview
173.64 195.20
217.33
8.90% 10.20% 11.08%
-4%
1%
6%
11%
16%
150
170
190
210
230
Q1-FY18 Q2-FY18 Q3-FY18
NII NIM
34
Capital Adequacy Ratio (%)*
21.81% 22.20% 22.05%
Q1-FY18 Q2-FY18 Q3-FY18
* CAR computation is as per RBI directive dated November 8, 2017 which provided exemption to
all SFB with no capital charge on market and operational risk weighted asset .
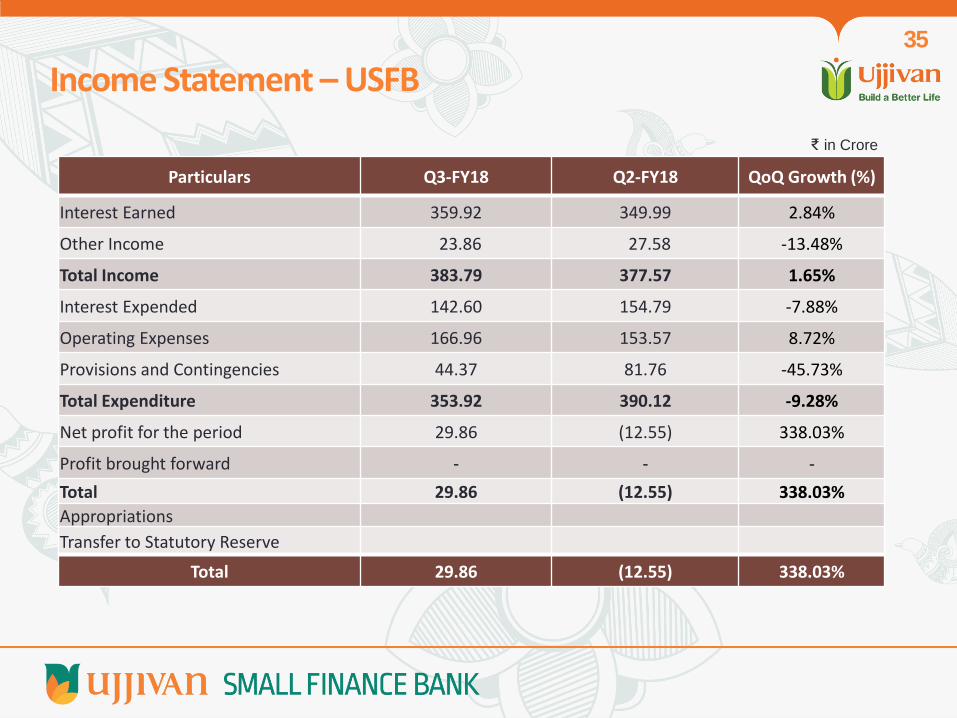
Particulars Q3-FY18 Q2-FY18 QoQ Growth (%)
Interest Earned 359.92 349.99 2.84%
Other Income 23.86 27.58 -13.48%
Total Income 383.79 377.57 1.65%
Interest Expended 142.60 154.79 -7.88%
Operating Expenses 166.96 153.57 8.72%
Provisions and Contingencies 44.37 81.76 -45.73%
Total Expenditure 353.92 390.12 -9.28%
Net profit for the period 29.86 (12.55) 338.03%
Profit brought forward - - -
Total 29.86 (12.55) 338.03%
Appropriations
Transfer to Statutory Reserve
Total 29.86 (12.55) 338.03%
₹ in Crore
Income Statement – USFB 35
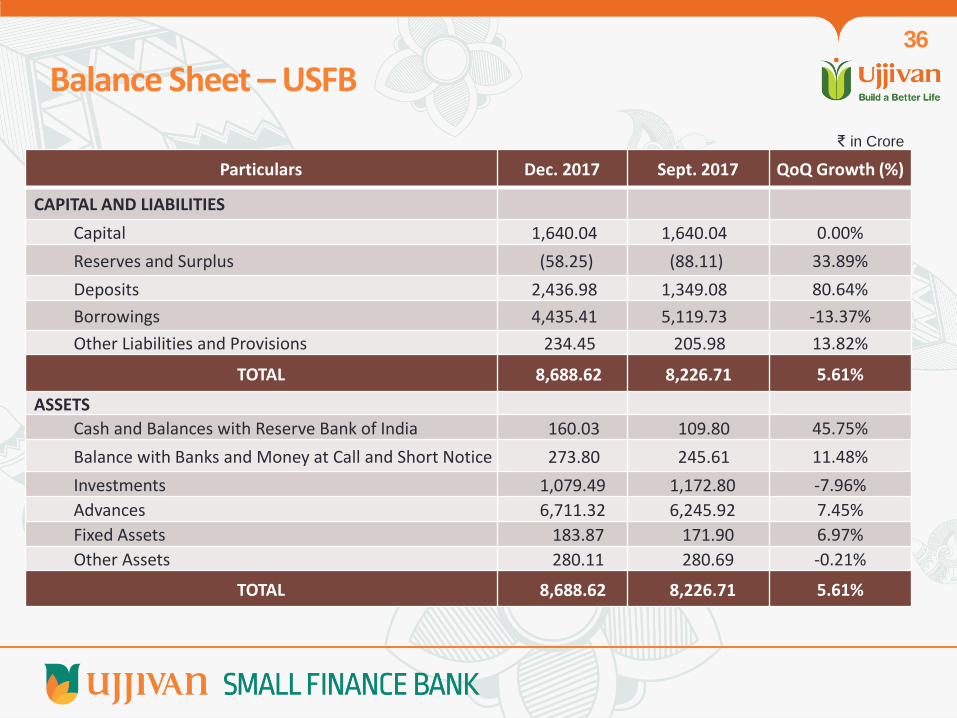
Particulars Dec. 2017 Sept. 2017 QoQ Growth (%)
CAPITAL AND LIABILITIES
Capital 1,640.04 1,640.04 0.00%
Reserves and Surplus (58.25) (88.11) 33.89%
Deposits 2,436.98 1,349.08 80.64%
Borrowings 4,435.41 5,119.73 -13.37%
Other Liabilities and Provisions 234.45 205.98 13.82%
TOTAL 8,688.62 8,226.71 5.61%
ASSETS
Cash and Balances with Reserve Bank of India 160.03 109.80 45.75%
Balance with Banks and Money at Call and Short Notice 273.80 245.61 11.48%
Investments 1,079.49 1,172.80 -7.96%
Advances 6,711.32 6,245.92 7.45%
Fixed Assets 183.87 171.90 6.97%
Other Assets 280.11 280.69 -0.21%
TOTAL 8,688.62 8,226.71 5.61%
₹ in Crore
Balance Sheet – USFB 36
Thank You!
37