Embed Size (px)
Citation preview

Investor PresentationQ3 FY2020-21
January 2021
1

Disclaimer
• This presentation is confidential and may not be copied, published, distributed or transmitted. The information in this presentation is being provided byBandhan Bank Limited (also referred to as ‘Bank’). By attending a meeting where this presentation is made, or by reading this presentation material, you agreeto be bound by following limitations:
• The information in this presentation has been prepared for use in presentations by Bank for information purposes only and does not constitute, or should be regardedas, or form part of any offer, invitation, inducement or advertisement to sell or issue, or any solicitation or any offer to purchase or subscribe for, any securities of theCompany in any jurisdiction, including the United States and India, nor shall it, or the fact of its distribution form the basis of, or be relied on in connection with, anyinvestment decision or any contract or commitment to purchase or subscribe for any securities of the Company in any jurisdiction, including the United States andIndia. This presentation does not constitute a recommendation by the Bank or any other party to sell or buy any securities of the Bank. This presentation and itscontents are not and should not be construed as a prospectus or an offer document, including as defined under the Companies Act, 2013, to the extent notified and inforce or an offer document under the Securities and Exchange Board of India (Issue of Capital and Disclosure Requirements) Regulations, 2009as amended.
• The Bank may alter, modify, or otherwise change in any manner the contents of this presentation without obligation to modify any person of such change or changes.No representation warranty implied as to and reliance or warranty, express or implied, is made to, nor should be placed on, the fairness, accuracy, completeness orcorrectness of the information or opinions contained in this presentation. Neither Bank nor any of its affiliates, advisors or representatives shall have any responsibilityor liability whatsoever (for negligence or otherwise) for any loss howsoever arising from any use of this presentation or its contents or otherwise arising in connectionwith this presentation. The information set out herein may be subject to updating, completion, revision, verification and amendment and such information maychange materially. This presentation is based on the economic, regulatory, market and other conditions as in effect on the date hereof. It should be understood thatsubsequent developments may affect the information contained in this presentation, which neither Bank nor its affiliates, advisors or representatives are under anyobligation to update, revise or affirm.
• This presentation contains certain supplemental measures of performance and liquidity that are not required by or presented in accordance with Indian GAAP, andshould not be considered as an alternative to profit, operating revenue or any other performance measures derived in accordance with Indian GAAP or an alternativeto cash flow from operations as a measure of liquidity of the Bank. You must make your own assessment of the relevance, accuracy and adequacy of the informationcontained in this presentation and must make independent analysis as you may consider necessary or appropriate for such purpose. Any opinions expressed in thispresentation are subject to change without notice and past performance is not indicative of future results. By attending this presentation you acknowledge that youwill be solely responsible for your own assessment of the market position of the Bank and that you will conduct your own analysis and be solely responsible forforming your own view of the potential future performance of the Bank ’s business.
• This presentation contains forward‐looking statements based on the currently held beliefs and assumptions of the management of the Bank , which are expressed ingood faith and, in their opinion, reasonable. Forward‐looking statements involve known and unknown risks, uncertainties and other factors, which may cause theactual results, financial condition, performance, or achievements of the Bank or industry results, to differ materially from the results, financial condition, performanceor achievements expressed or implied by such forward‐looking statements. The risks and uncertainties relating to these statements include, but are not limited to,risks and uncertainties regarding expansion plans and the benefits there from, fluctuations in our earnings, our ability to manage growth and implement strategies,competition in our business including those factors which may affect our cost advantage, wage increases in India, our ability to attract and retain highly skilledprofessionals, our ability to win new contracts, changes in technology, availability of financing, our ability to successfully complete and integrate our expansion plans,liabilities, political instability and general economic conditions affecting our industry. Unless otherwise indicated, the information contained herein is preliminary andindicative and is based on management information, current plans and estimates. Industry and market‐related information is obtained or derived from industrypublications and other sources and has not been verified by us. Given these risks, uncertainties and other factors, recipients of this document are cautioned not toplace undue reliance on these forward‐looking statements. The Bank disclaims any obligation to update these forward‐looking statements to reflect future events ordevelopments.
• This presentation is not an offer for sale of securities in the UNITED STATES or elsewhere.
2

Key Highlights
3

States & UTs
34
Key Highlights
4
Bandhan Bank - Overview
Loan portfolio (on book + off book) for Q3 FY 20-21 grew 22.6% Y-o-Y
Deposits grew by 29.7% Y-o-Y in Q3 FY 20-21; Retail Deposit to Total Deposit at
81%
Gross NPA is at 1.1% & Net NPA is at 0.3%
Added 1.66 million Customer during the quarter with total customer base
reaching to 22.48 million (EEB- 17.13 million, Non EEB – 5.35 million)
During the quarter, the Bank has made further provision of ₹ 10 billion on
standard advances against the potential impact of COVID-19 taking the aggregate
additional provision held by the bank to ₹ 31.2 bn
Cities548
Employees
47,260
Customers
22.48mn
Snapshot of operations Q3 FY 2020-21
₹ 711.9 bnTotal Deposits
Banking Units
4,090
ATMs
487
1,107Branches EEB** Group
based loans
59.6%
1. On book + Off Book (including TLTRO ₹ 5 bn)*Annualised **Emerging Entrepreneurs Business (Erstwhile Miro Banking Unit)
₹ 802.6 bn1Total Loans and advances
8.3%* Net Interest Margin (NIM)
42.9% CASA Ratio
2.4%*ROAA (%)
14.6%*ROAE (%)

Steady growth in overall Bank’s business
5
549 571 606 661 712
655718 743
767802
Dec'19 Mar'20 Jun'20 Sep'20 Dec'20
Deposit Advance
1,2891,428
1,3491,204
1,514
Industry growth
26%
17%
YTD YoY
Bandhan Growth
11.7% 22.6%
24.7% 29.6%
YTD YoY
Source : RBI WSS dtd. 01.01.2021 ; Data is as per last reporting Fridays of the respective quarters;
1.7% 6.1%
6.7% 11.3%
All values are in ₹ Billions

32%
169215
309
401
530
Dec'16 Dec'17 Dec'18 Dec'19 Dec'20
EEB Portfolio Movement
6
Portfolio values are in ₹ Billions
98%90%
2%10%
Dec'19 Dec'20
Healthy growth in EEB portfolio with increased focus on Individual Loans
7
52
Dec'19 Dec'20
EEB Individual Y-o-Y Growth
691%
394478
Dec'19 Dec'20
EEB Group Y-o-Y Growth
21%
EEB Individual vs. EEB Group Comparison
Share of Group & Individual in EEB
EEB Group
EEB Individual

7
States Dec’20 1st - 16th Jan’21
West Bengal 90% 89%
Assam 88% 78%
Rest of India 94% 94%
Total 92% 90%
EEB Collection Efficiency [Value% ] of top states
Steady Collection Efficiency
94% 94%92%
89%92%
90%
for the month of Sept'20(Monthly Avg.)
for the month of Dec'20(Monthly Avg.)
1st Jan'21 - 16th Jan'21(Monthly Avg.)
EEB Collection Efficiency (Excluding arrears)
Customer % Value %
98% 98%
Sept'20 Dec'20
Commercial Banking Collection Efficiency
98% 98%
Sept'20 Dec'20
Affordable Housing Collection Efficiency
8
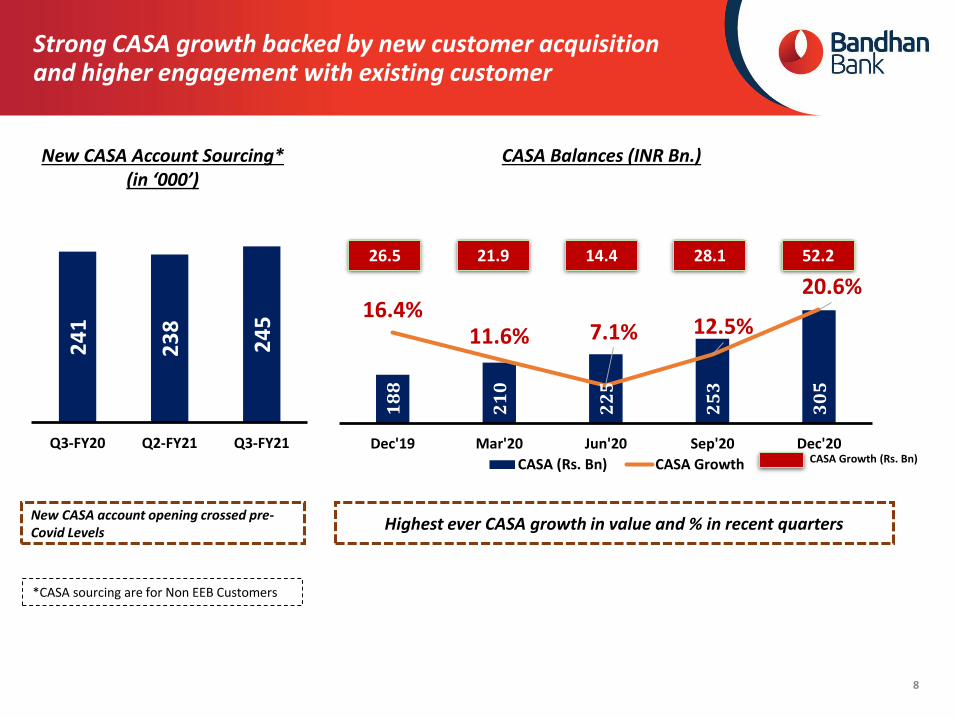
188
210
225
253
305
16.4%11.6% 7.1% 12.5%
20.6%
0.0%
5.0%
10.0%
15.0%
20.0%
25.0%
100
150
200
250
300
350
Dec'19 Mar'20 Jun'20 Sep'20 Dec'20
CASA (Rs. Bn) CASA Growth
26.5 21.9 14.4 28.1 52.2
CASA Growth (Rs. Bn)
Highest ever CASA growth in value and % in recent quarters
24
1
23
8
24
5
Q3-FY20 Q2-FY21 Q3-FY21
New CASA Account Sourcing* (in ‘000’)
New CASA account opening crossed pre-Covid Levels
*CASA sourcing are for Non EEB Customers
CASA Balances (INR Bn.)
Strong CASA growth backed by new customer acquisition and higher engagement with existing customer

9
YoY Growth: 107%Share: 5%
Retail Deposit Growth
YoY Growth: 33%Share: 62%
YoY Growth: 23%Share: 5%
YoY Growth: 40%Share: 10%
YoY Growth: 65%Share: 5%
YoY Growth: 27%Share: 8%
76%
78% 78%77%
81%
Dec'19 Mar'20 Jun'20 Sep'20 Dec'20
Retail Share %
Strong growth observed in retail deposit book across all regions in Q3FY21
Geo-Region Share of Bank Branch %
Share of Retail Deposit %
East & N-East 64% 67%
Central 13% 10%
West 9% 8%
North 7% 5%
South 6% 5%
Business & Financial Overview
10

Geographical Distribution
11
Banking Outlets
3,279 4,090 3,656
1,009 1,107
1,045
Dec'19 Dec'20 Sep'20
Banking Units Branches
4,288 4,701
Focus on serving the rural & underbanked population
Diversifying presence with non-east increasing over 50% now
Banking Outlets as on 31st Dec 2020*
*Basis original classification at the time of opening
5,197
10%18%
38%
34%Metro
Urban
Semi-Urban
Rural
Central21%
Other East & North-
East11%
WB & Assam
0%
Northern7%
Southern41%
Western20%
New BUs expansion focussing outside WB& Assam in Q3FY21
45% 47%
11% 13%17% 17%7% 7%10% 7%
10% 9%
Dec'20 Sep'20
Western
Southern
Northern
Central
North Eastern
Eastern
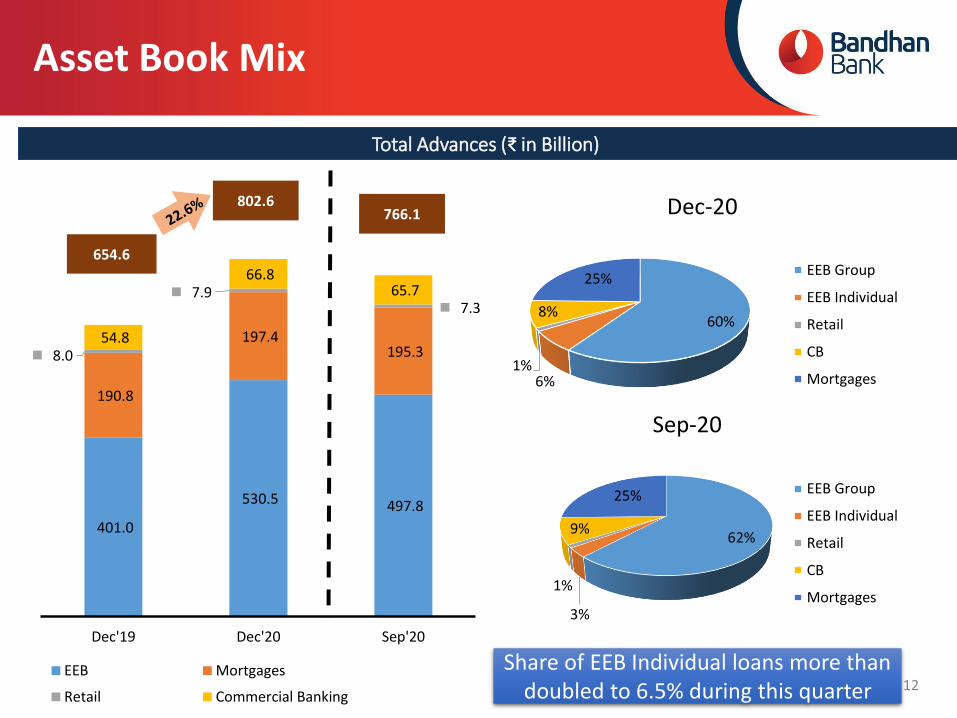
Asset Book Mix
Total Advances (₹ in Billion)
60%
6%1%
8%
25%
Dec-20
EEB Group
EEB Individual
Retail
CB
Mortgages
62%
3%
1%
9%
25%
Sep-20
EEB Group
EEB Individual
Retail
CB
Mortgages
401.0
530.5 497.8
190.8
197.4 195.3 8.0
7.9 7.3
54.8
66.8 65.7
Dec'19 Dec'20 Sep'20
EEB Mortgages
Retail Commercial Banking
654.6
802.6766.1
12
Share of EEB Individual loans more than doubled to 6.5% during this quarter

394.3477.9 465.8
6.7
52.632.0
Dec'19 Dec'20 Sep'20Group Based Individual
401.0
530.5
Emerging Entrepreneurs Asset Growth(₹ in Billion)
13
Emerging Entrepreneurs Business
EEB Loan Disbursement (₹ in Billion)
Number of Active Borrowers (Mn)
10.5
11.3 11.2
Dec'19 Dec'20 Sep'20
497.8
139.2 139.9
92.9
6.425.9
11.4
Dec'19 Dec'20 Sep'20EEB Group EEB Individual
145.6
104.3
165.8
0.4
23.7
9.2
Dec'19 Sep'20 Dec'20
Top-up Loan Disbursement(₹ in Billion)
Growth Comparison
125% 305%
51% 0.5%
Q-o-Q YoY

Housing Finance
14
82% 82% 85%
14% 15% 12%
4% 3% 3%
Dec'19 Dec'20 Sep'20
Housing LAP Construction
8.711.2
8.1
Dec'19 Dec'20 Sep'20
156.2 162.7 166.3
26.8 29.5 22.77.8 5.2 6.3
Dec'19 Dec'20 Sep'20Housing LAP Construction
195.3
197.4
190.8
Housing Asset Bifurcation (₹ in Billion)
Housing Asset Disbursements (₹ in Billion)Housing Asset Segment wise (in %)
55.1%
44.3%
0.6%Customers
Salaried
Self Employed
Professionals
6.2% 5%
Q-o-Q YoY
Housing Fin Growth Excluding Construction FIn
Housing Excluding Construction FIn
In 2020, CLSS Subsidy of ₹ 2.68 bn reduces book growth in spite of robust disbursements

15
Commercial Banking (CB) & Retail Assets
Product wise CB Assets (₹ in Billion )
24.419.0 23.5
7.1 9.7 8.5
23.3 38.1 33.7
Dec'19 Dec'20 Sep'20
NBFC -MFI NBFC-Others* SME
54.8
65.7
0.6 1.4 1.2
7.5 7.6
5.3
Dec'19 Dec'20 Sep'20
Retail CB
6.5
9.08.1
*Includes ILF&S exposure of ₹ 3.85 billion which is fully provided
CB & Retail Disbursements# – (₹ in Billion)
Product wise Retail Assets (₹ in Billion )
1.7
3.3 2.9
4.73.9 3.8
1.6 0.7 0.6
Dec'19 Dec'20 Sep'20
Gold TD-OD others
8.0 7.9
66.8
7.3
14% 37%
13% 64%
Q-o-Q YoY
SME & NBFC Others Growth
NBFC-OthersSME
# Term Loan disbursements Only

28.3 34.9 32.8
160.1
270.3220.0
229.8
271.5
255.9
130.9
135.2
152.6
Dec'19 Dec'20 Sep'20
CA SA TD Retail TD Others
711.9
661.3
Deposits Growth (₹ in Billion)
34.3%42.9%
38.2%
Dec'19 Dec'20 Sep'20
CASA (%)
549.1
16
Liabilities Profile
Retail to Total Deposits (%)
76.2% 81.0% 76.9%
Dec'19 Dec'20 Sep'20
Average SA Balance Per Customer (₹ in 000’)
40.3 59.1 51.3
1.91.9 1.6
Dec'19 Dec'20 Sep'20
General Banking EEB

17
Financial Performance
PAT (₹ in Billion)
Total income (₹ in Billion)
7.36.3
9.2
Q3 FY 20 Q3 FY 21# Q2 FY 21#
15.420.7 19.2
3.6
5.63.8
19.0
26.3
23.1
Q3 FY 20 Q3 FY 21 Q2 FY 21
Net Interest Income Other Income Total Income
# PAT for Q3 FY21 is after taking accelerated additional COVID 19 related provision on standard advances of ₹ 10 bn and in Q2FY21 amounting to ₹3 bn
Operating Profit (₹ in Billion)
12.6
19.116.3
Q3 FY 20 Q3 FY 21 Q2 FY 21
Strong Operating Profit growth on account of higher NIMs & Non-interest income

18
Financial Performance
7.9% 8.3% 8.0%
0.00%
10.00%
Q3 FY 20 Q3 FY 21 Q2 FY 21
NIM (Annualized)Capital Adequacy Ratio (CRAR)
23.1% 21.4% 22.2%
1.6% 4.8% 3.5%
24.7% 26.2% 25.7%
Dec'19 Dec'20 Sep'20
Tier I Tier II Total
Spread (Annualized)
14.0% 13.3% 13.3%
7.2%6.0% 6.2%
6.7% 7.3% 7.1%
Q3 FY20 Q3 FY21 Q2 FY21
Yield Cost of funds (Excl Cap.) Spread
CRAR for Dec’20 after considering 9M FY21 Profits is 29.2%

Financial Performance
ROAA & ROAE (Annualized)#
3.5% 2.4% 3.6%
20.0%
14.6%
22.5%
Q3 FY20 Q3 FY21# Q2 FY21#
ROAA ROAE
Cost to Income Ratio
33.4%
27.1% 29.4%
Q3 FY20 Q3 FY21 Q2 FY21
Operating expenses to Average Assets (Annualized)
2.9%2.6% 2.6%
Q3 FY20 Q3 FY21 Q2 FY21
# ROAA & ROAE for Q3 FY21 is after taking accelerated additional COVID 19 related provision on standard advances of ₹ 10 bn and in Q2FY21 amounting to ₹3 bn

20
Financial Performance
1.9%
1.1% 1.2%0.8%
0.3% 0.4%
Dec'19 Dec'20 Sep'20
Gross NPA (%) Net NPA
Gross NPA and Net NPA
0.5%0.2% 0.3%
1.3%5.4% 1.8%
Q3 FY 20 Q3 FY 21 Q2 FY 21
Credit Cost - NPA Credit Cost - Standard
1.8%
5.6%
2.1%
Credit Cost (Annualized)
2.9
0.9 1.0
3.0
2.4 2.3
5.5
5.2 5.3
0.4
0.1 0.1
Dec' 19 Dec' 20 Sep' 20
Retail
CB*
Housing
EEB
8.711.8
8.6
Segmental GNPA movement - (₹ in Billion)
*Others includes ₹ 3.85 bn of IL&FS
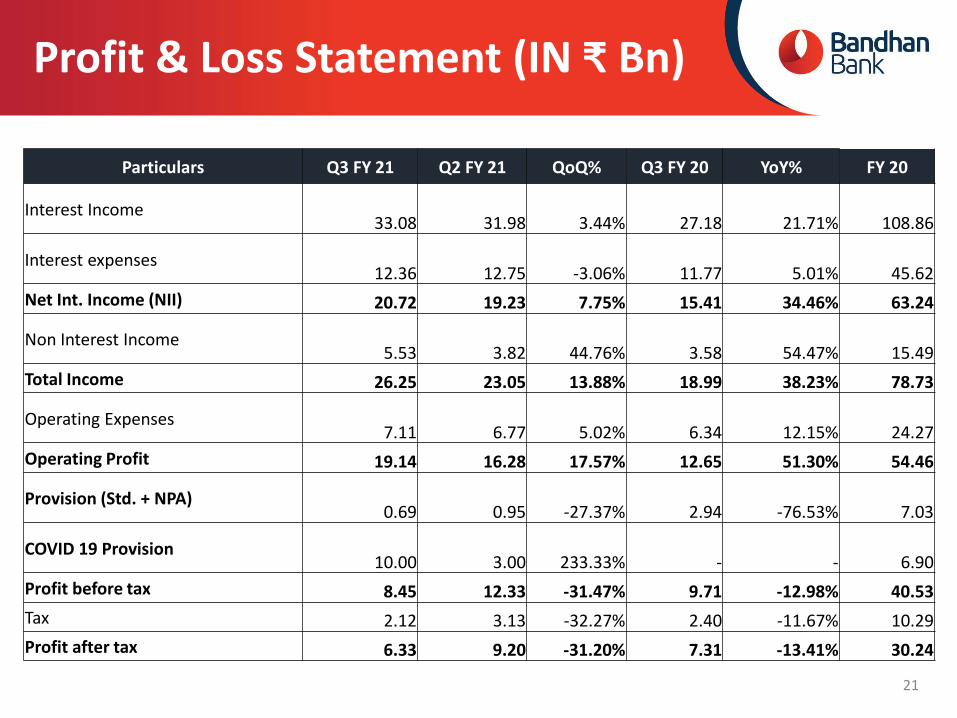
Profit & Loss Statement (IN ₹ Bn)
Particulars Q3 FY 21 Q2 FY 21 QoQ% Q3 FY 20 YoY% FY 20
Interest Income33.08 31.98 3.44% 27.18 21.71% 108.86
Interest expenses12.36 12.75 -3.06% 11.77 5.01% 45.62
Net Int. Income (NII) 20.72 19.23 7.75% 15.41 34.46% 63.24
Non Interest Income5.53 3.82 44.76% 3.58 54.47% 15.49
Total Income 26.25 23.05 13.88% 18.99 38.23% 78.73
Operating Expenses7.11 6.77 5.02% 6.34 12.15% 24.27
Operating Profit 19.14 16.28 17.57% 12.65 51.30% 54.46
Provision (Std. + NPA)0.69 0.95 -27.37% 2.94 -76.53% 7.03
COVID 19 Provision10.00 3.00 233.33% - - 6.90
Profit before tax 8.45 12.33 -31.47% 9.71 -12.98% 40.53
Tax 2.12 3.13 -32.27% 2.40 -11.67% 10.29
Profit after tax 6.33 9.20 -31.20% 7.31 -13.41% 30.24
21

Balance Sheet (IN ₹Billion)
ParticularsAs at As at
% Change31st Dec. 2020 31st Mar 2020
Capital & Liabilities
Capital 16.10 16.10 0.00%
Reserves & Surplus 156.90 135.85 15.50%
Shareholder Funds 173.00 151.95 13.85%
Deposits 711.88 570.82 24.71%
Borrowings 126.67 163.79 -22.66%
Other liabilities and provisions 61.43 30.62 100.62%
Total 1,072.98 917.18 16.99%
Assets
Cash and balances with Reserve Bank of India 42.73 63.45 -32.66%
Balance with Banks and Money at call and short notice 16.54 20.08 -17.63%
Investments 224.09 153.52 45.97%
Advances 767.75 666.30 15.23%
Fixed Assets 4.45 3.69 20.60%
Other Assets 17.42 10.14 71.79%
Total 1,072.98 917.18 16.99%
22

Credit Rating
23
Rating of Bank’s Financial Securities
Instrument Rating Rating AgencyAmount
(₹ in Billion)
Subordinated Tier II Non -
Convertible Debenture
CARE AA-; Stable CARE Ratings1.60
[ICRA]AA; Stable ICRA
Non-Convertible Debenture #[ICRA] AA; Stable ICRA
50.75**CRISIL AA/Stable CRISIL
Term Loans From Bank ICRA]AA Stable ICRA 0.80
Certificate of DepositCRISIL A1+ CRISIL
60.00*[ICRA] A1+ ICRA
Fixed Deposit Program # CRISIL FAAA/Stable CRISIL 1.60
Subordinated Debt # CRISIL AA/Stable CRISIL 0.35
*Rating of ICRA is for ₹ 30 bn only
**Rating of ICRA is for ₹ 2.26 bn only
#erstwhile GRUH Finance Limited transferred to Bandhan Bank Ltd.

Our Board & Management
24

Experienced and professional team…
25
Santanu BanerjeeHead, HR 27+ years of experience in the field of banking and finance Previously worked as Head of HR Business Relationship at Axis bank
Man
age
me
nt
Team
Chandra Shekhar GhoshMD & CEO Founder of BFSL, has 27 years of experience in the field of
microfinance and development Awarded ‘Entrepreneur of the Year’ by Forbes and ET in 2014
Sunil SamdaniChief Financial Officer 20+ years of experience in financial industry Previously served as Head of Business Analytics and Strategy at
Development Credit Bank and as CFO at Karvy
Sanjeev Naryani
Head , Business 32+ years of experience in banking Industry Previously worked as Chief General Manager and Head of Real
Estate and Housing Business Unit at SBI
Biswajit DasChief Risk Officer 28 years of experience in banking industry Previously served as Head-RBS and regulatory reporting at ICICI Bank
Kumar AshishHead , Emerging Entrepreneurs Business 26+ years experience in the field of Banking and Finance. Previously served as North Zone Head of ICICI Bank and as Group
Director at Airtel Money.
Ronti KarChief Information Officer 27+ years of experience in IT Sector. Previously served as Project Manager at Cognizant Technology
Solution
Indranil BanerjeeCompany Secretary 20+ years experience in financial industry Previously served as Company Secretary at Energy Development
Company
Nand Kumar SinghHead, Banking Operations and Customer Services 27+ years experience in banking industry Previously served as Retail Banking Head, Patna Circle, at Axis Bank
Siddhartha SanyalChief Economist and Head Research 20+ years of experience in the field of Macro Economic Previously served as Director and Chief India Economist at
Barclays Bank PLC.
Deepankar BoseHead, Corporate Centre 36+ years experience in banking industry Previously served as Chief General Manager and Head Of Wealth
Management business, at SBI
Sudhin ChokseyHead, Housing Finance 41+ years experience in financial industry. Previously served as Managing Director at GRUH Finance Limited.
Srinivasan BalachanderChief Compliance Officer 20+ years experience in banking industry. Previously served as Chief Compliance Officer at Axis Bank Ltd.
Rahul Dhanesh ParikhChief Marketing & Digital Officer 20+ years experience in Financial Industry. Previously served as Chief Executive Officer at Bajaj Capital Ltd.
Arvind KanagasabaiHead, Treasury 30+ years of experience at a PSU Bank Previously served as CFO at SBI DFHI Limited, Mumbai

… backed by a strong independent Board
26
Bo
ard
of
Dir
ect
ors
Bhaskar Sen Director Retired as Chairman & MD of United Bank of India Previously, Executive Director of Dena Bank Having significant experience in Banking.
Snehomoy BhattacharyaDirector Significant experience in public and private banking sector Previously worked as Executive Director – Corporate Affairs, Axis
Bank
Sisir Kumar ChakrabartiDirector Previously, Deputy Managing Director at Axis Bank Also worked with State Bank of Bikaner and Jaipur prior to joining
Axis Bank
Chandra Shekhar GhoshMD & CEO Has significant experience in the field of microfinance Awarded ‘Outstanding Leadership Award’ by Dhaka University Having more than 30 years of experience in microfinance & development
terrain
T. S. Raji Gain Director Significant experience in the field of agricultural and rural
development, Previously, she has worked with BIRD Currently, CCM & State in Charge – MP, NABARD
Dr. Holger Dirk MichaelisNominee Director Significant experience in private equity and as strategic advisor to
financial services companies Currently, he is working with GIC
Ranodeb Roy Non-executive Director Founder of RV Capital Management Private Limited, Singapore, he
was earlier heading Fixed Income Asia Pacific in Morgan Stanley Asia) Singapore
Harun Rashid KhanDirector Retired as Deputy Governor of Reserve Bank of India Previously, Nominee Director of RBI on the Board of several Banks,
NABARD, NHB
Dr. A S RamasastriDirector
Previously, Director of Institute for Development & Research of Banking Technology (IDRBT);
Prior to IDRBT, he was the CGM-in-charge of Department of IT at RBI
Santanu MukherjeeDirector Significant experience in Banking at various capacities in SBI
Group Former MD of State Bank of Hyderabad
Dr. Anup Kumar SinhaNon-executive Chairman Economist with Ph.D from University of Southern California Served as Professor of Economics at IIM Calcutta for 25 years
N V P TendulkarDirector Significant experience in finance, accounts and management Former Whole time Director – Finance, Hewlett Packard (India)
Vijay N BhattDirector Significant experience in accounting, audit and assurance Former Sr. Independent Director of BSR & Co., Chartered Accountants
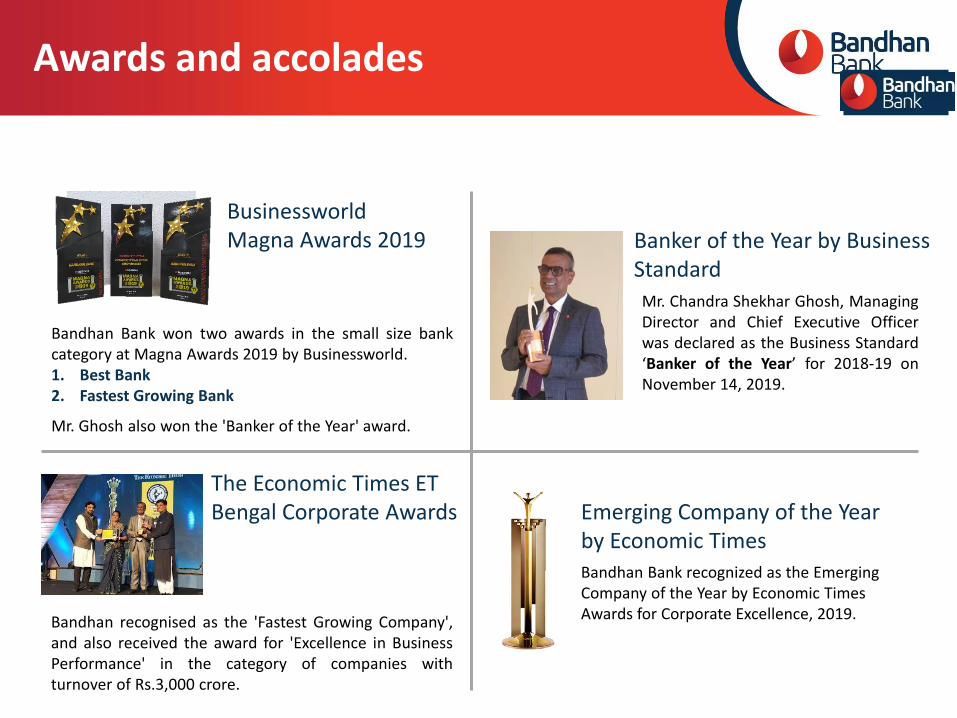
BusinessworldMagna Awards 2019
Bandhan Bank won two awards in the small size bankcategory at Magna Awards 2019 by Businessworld.1. Best Bank2. Fastest Growing Bank
Mr. Ghosh also won the 'Banker of the Year' award.
Awards and accolades
Emerging Company of the Year by Economic Times Bandhan Bank recognized as the Emerging Company of the Year by Economic Times Awards for Corporate Excellence, 2019.
Mr. Chandra Shekhar Ghosh, ManagingDirector and Chief Executive Officerwas declared as the Business Standard‘Banker of the Year’ for 2018-19 onNovember 14, 2019.
Banker of the Year by Business Standard
The Economic Times ET Bengal Corporate Awards
Bandhan recognised as the 'Fastest Growing Company',and also received the award for 'Excellence in BusinessPerformance' in the category of companies withturnover of Rs.3,000 crore.