Embed Size (px)
Citation preview
Investor presentationQ4 and full-year 2020
3 February 2021
DISCLAIMERThis presentation contains certain forward-looking statements, including but not limited to, the statements and expectations contained in the
“Financial Outlook” section of this presentation. Statements herein, other than statements of historical fact, regarding our future results of operations,
financial condition, cash flows, business strategy, plans and future objectives are forward-looking statements. Words such as “targets”, “believe”,
“expect”, “aim”, “intend”, “plan”, “seek”, “will”, “may”, “should”, ”anticipate”, “continue”, “predict” or variations of these words, as well as other
statements regarding matters that are not historical facts or regarding future events or prospects, constitute forward-looking statements.
Ørsted have based these forward-looking statements on its current views with respect to future events and financial performance. These views involve
a number of risks and uncertainties, which could cause actual results to differ materially from those predicted in the forward-looking statements and
from the past performance of Ørsted. Although, Ørsted believes that the estimates and projections reflected in the forward-looking statements are
reasonable, they may prove materially incorrect and actual results may materially differ due to a variety of factors, including, but not limited to
changes in temperature, wind conditions, wake and blockage effects, and precipitation levels, the development in power, coal, carbon, gas, oil,
currency and interest rate markets, changes in legislation, regulation or standards, the renegotiation of contracts, changes in the competitive
environment in our markets and reliability of supply. As a result you should not rely on these forward-looking statements. Please also refer to the
overview of risk factors in “Risk and Management” on p. 70 of the 2020 annual report, available at www.orsted.com.
Unless required by law, Ørsted is under no duty and undertakes no obligation to update or revise any forward-looking statement after the distribution
of this presentation, whether as a result of new information, future events or otherwise.
2
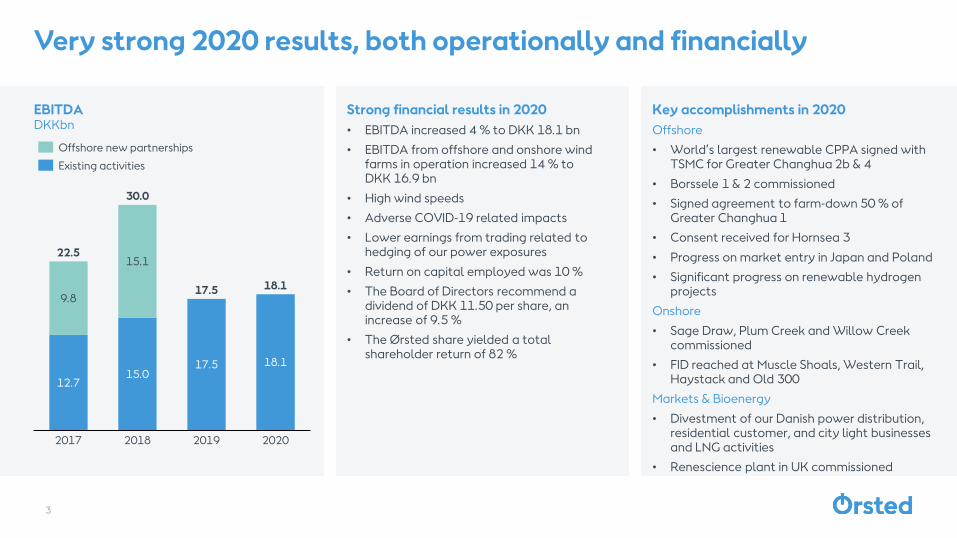
Very strong 2020 results, both operationally and financially
12.715.0
17.5 18.1
9.8
15.1
2017 2018 2019 2020
22.5
30.0
18.117.5
Offshore new partnerships
Existing activities
EBITDADKKbn
Key accomplishments in 2020
Offshore
• World’s largest renewable CPPA signed with TSMC for Greater Changhua 2b & 4
• Borssele 1 & 2 commissioned
• Signed agreement to farm-down 50 % of Greater Changhua 1
• Consent received for Hornsea 3
• Progress on market entry in Japan and Poland
• Significant progress on renewable hydrogen projects
Onshore
• Sage Draw, Plum Creek and Willow Creek commissioned
• FID reached at Muscle Shoals, Western Trail, Haystack and Old 300
Markets & Bioenergy
• Divestment of our Danish power distribution, residential customer, and city light businesses and LNG activities
• Renescience plant in UK commissioned
Strong financial results in 2020
• EBITDA increased 4 % to DKK 18.1 bn
• EBITDA from offshore and onshore wind farms in operation increased 14 % to DKK 16.9 bn
• High wind speeds
• Adverse COVID-19 related impacts
• Lower earnings from trading related to hedging of our power exposures
• Return on capital employed was 10 %
• The Board of Directors recommend a dividend of DKK 11.50 per share, an increase of 9.5 %
• The Ørsted share yielded a total shareholder return of 82 %
3
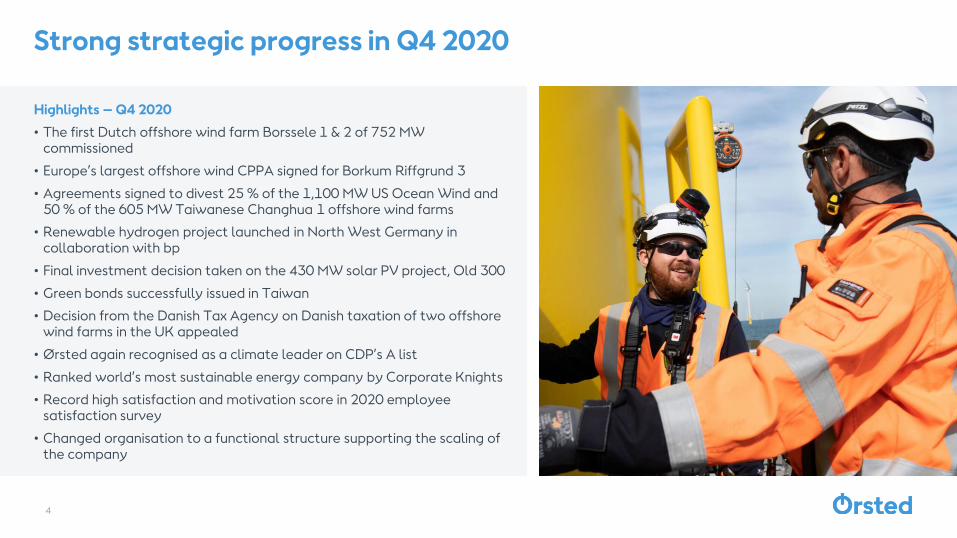
Strong strategic progress in Q4 2020
Highlights – Q4 2020
• The first Dutch offshore wind farm Borssele 1 & 2 of 752 MW commissioned
• Europe’s largest offshore wind CPPA signed for Borkum Riffgrund 3
• Agreements signed to divest 25 % of the 1,100 MW US Ocean Wind and 50 % of the 605 MW Taiwanese Changhua 1 offshore wind farms
• Renewable hydrogen project launched in North West Germany in collaboration with bp
• Final investment decision taken on the 430 MW solar PV project, Old 300
• Green bonds successfully issued in Taiwan
• Decision from the Danish Tax Agency on Danish taxation of two offshore wind farms in the UK appealed
• Ørsted again recognised as a climate leader on CDP’s A list
• Ranked world’s most sustainable energy company by Corporate Knights
• Record high satisfaction and motivation score in 2020 employee satisfaction survey
• Changed organisation to a functional structure supporting the scaling of the company
4
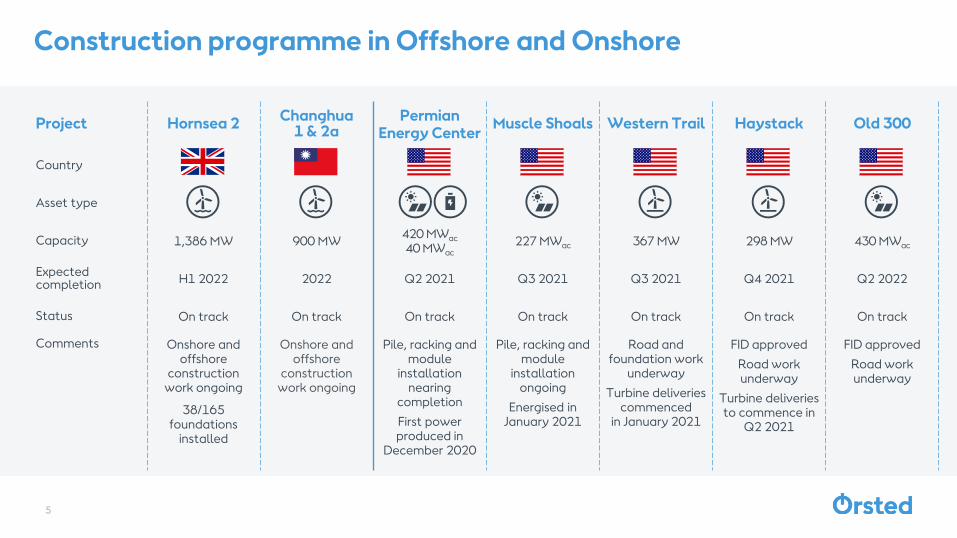
Project Hornsea 2Changhua
1 & 2a
Country
Asset type
Capacity 1,386 MW 900 MW
Expected completion H1 2022 2022
Status On track On track
Comments Onshore and offshore
construction work ongoing
38/165 foundations
installed
Onshore and offshore
constructionwork ongoing
5
Construction programme in Offshore and Onshore
Permian Energy Center
Muscle Shoals Western Trail Haystack Old 300
420 MWac
40 MWac
227 MWac 367 MW 298 MW 430 MWac
Q2 2021 Q3 2021 Q3 2021 Q4 2021 Q2 2022
On track On track On track On track On track
Pile, racking and module
installation nearing
completion
First power produced in
December 2020
Pile, racking and module
installation ongoing
Energised in January 2021
Road and foundation work
underway
Turbine deliveries commenced
in January 2021
FID approved
Road work underway
Turbine deliveries to commence in
Q2 2021
FID approved
Road work underway

Award in H2 2021Maryland 2~400 MW
6
Offshore auctions and tenders likely to reach ~25 GW in 2021
H2 2021Massachusetts 3
1,600 MW
H2 2021Rhode Island
up to 600 MW
2021Polish award
5,900 MW
2021German tender
900 MW
Award in Q2 2021New Jersey 2
up to 2,400 MW
H2 2021Danish tender800-1,000 MW
H2 2021Maryland 3~400 MW
H2 2021Connecticut 4
~1,000 MW
All auction and tender timelines and capacities based on current expectations and subject to changeMaryland: Auctions in 2020, 2021 and 2022 to procure around 1,200 MW cumulatively
H2 2021UK Round 4
Up to 12,000 MW
H1 2021Japanese round 1
~1,500 MW
2021French tender 4
1,000 MW
H2 2021 / H1 2022Taiwan auction
TBA
Q4 2021 / Q1 2022Holland Coast West
1,520 MW
Q4 2020 – Strong operational performance
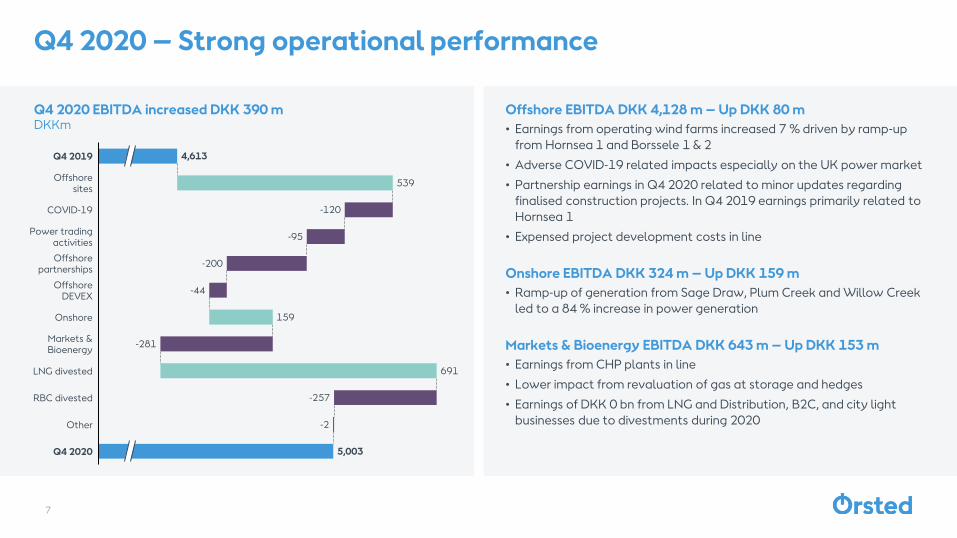
Q4 2020 EBITDA increased DKK 390 mDKKm
Offshore EBITDA DKK 4,128 m – Up DKK 80 m
• Earnings from operating wind farms increased 7 % driven by ramp-up
from Hornsea 1 and Borssele 1 & 2
• Adverse COVID-19 related impacts especially on the UK power market
• Partnership earnings in Q4 2020 related to minor updates regarding
finalised construction projects. In Q4 2019 earnings primarily related to
Hornsea 1
• Expensed project development costs in line
Onshore EBITDA DKK 324 m – Up DKK 159 m
• Ramp-up of generation from Sage Draw, Plum Creek and Willow Creek
led to a 84 % increase in power generation
Markets & Bioenergy EBITDA DKK 643 m – Up DKK 153 m
• Earnings from CHP plants in line
• Lower impact from revaluation of gas at storage and hedges
• Earnings of DKK 0 bn from LNG and Distribution, B2C, and city light
businesses due to divestments during 2020
539
159
691
-44
Q4 2019
Offshoresites
Markets &Bioenergy
COVID-19
LNG divested
Onshore
Other
Q4 2020 5,003
OffshoreDEVEX
RBC divested
Offshorepartnerships
4,613
-120
-95
-200
-281
-2
Power tradingactivities
-257
7
Q4 2020 – Financial performance in line with expectations
8
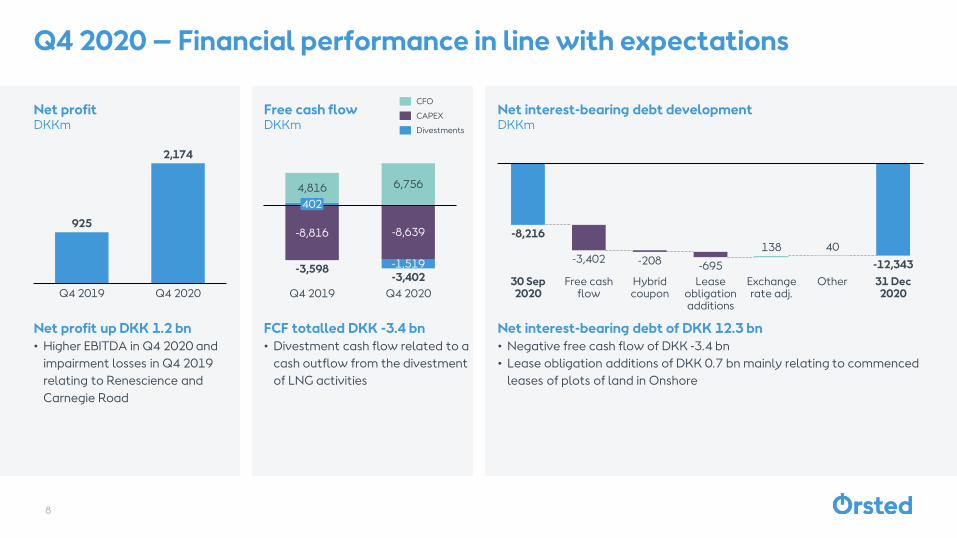
Net profitDKKm
Net profit up DKK 1.2 bn
• Higher EBITDA in Q4 2020 and
impairment losses in Q4 2019
relating to Renescience and
Carnegie Road
Free cash flowDKKm
FCF totalled DKK -3.4 bn
• Divestment cash flow related to a
cash outflow from the divestment
of LNG activities
6,7564,816
-8,639-8,816
-1,519
402
Q4 2019
-3,402
Q4 2020
-3,598
CFO
CAPEX
Divestments
925
2,174
Q4 2019 Q4 2020
Net interest-bearing debt developmentDKKm
Net interest-bearing debt of DKK 12.3 bn
• Negative free cash flow of DKK -3.4 bn
• Lease obligation additions of DKK 0.7 bn mainly relating to commenced
leases of plots of land in Onshore
-8,216
-12,343-3,402 -208 -695
Free cash flow
30 Sep 2020
Hybrid coupon
Lease obligation additions
Exchange rate adj.
Other 31 Dec 2020
40138
Q4 2020 – Financial and non-financial ratios
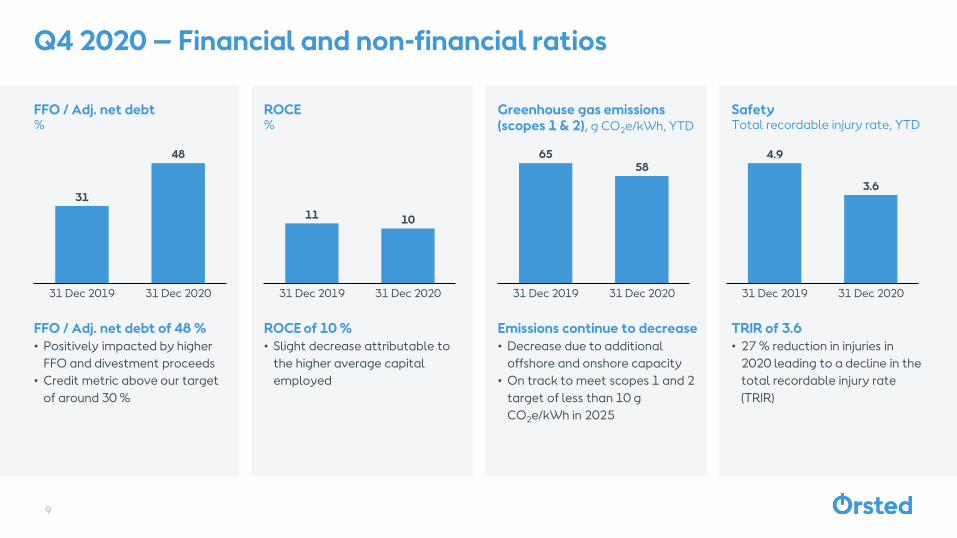
FFO / Adj. net debt%
FFO / Adj. net debt of 48 %
• Positively impacted by higher
FFO and divestment proceeds
• Credit metric above our target
of around 30 %
ROCE%
ROCE of 10 %
• Slight decrease attributable to
the higher average capital
employed
31
48
31 Dec 2019 31 Dec 2020
11 10
31 Dec 202031 Dec 2019
9
Greenhouse gas emissions (scopes 1 & 2), g CO2e/kWh, YTD
SafetyTotal recordable injury rate, YTD
6558
31 Dec 2019 31 Dec 2020
4.9
3.6
31 Dec 2019 31 Dec 2020
Emissions continue to decrease
• Decrease due to additional
offshore and onshore capacity
• On track to meet scopes 1 and 2
target of less than 10 g
CO2e/kWh in 2025
TRIR of 3.6
• 27 % reduction in injuries in
2020 leading to a decline in the
total recordable injury rate
(TRIR)
Outlook – Guidance for 2021
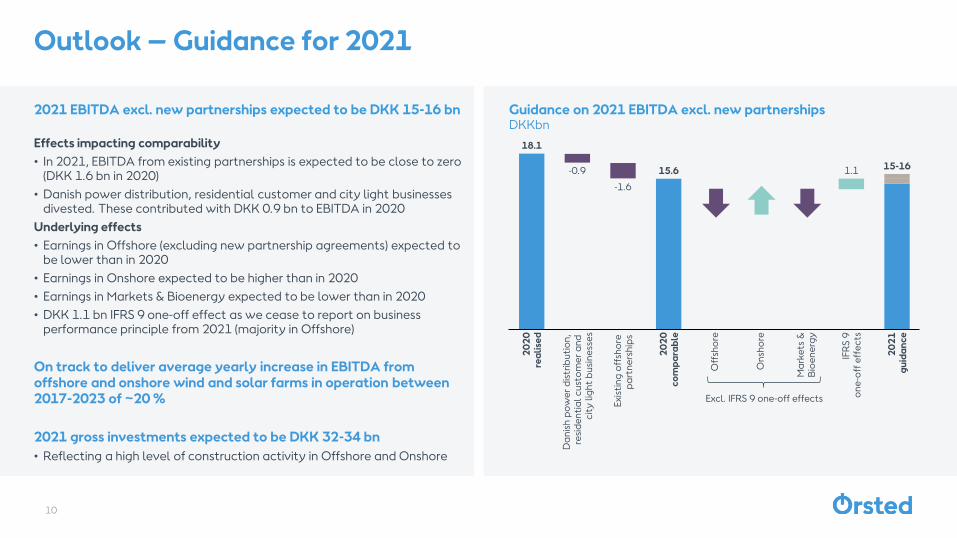
Guidance on 2021 EBITDA excl. new partnershipsDKKbn
2021 EBITDA excl. new partnerships expected to be DKK 15-16 bn
Effects impacting comparability
• In 2021, EBITDA from existing partnerships is expected to be close to zero (DKK 1.6 bn in 2020)
• Danish power distribution, residential customer and city light businesses divested. These contributed with DKK 0.9 bn to EBITDA in 2020
Underlying effects
• Earnings in Offshore (excluding new partnership agreements) expected to be lower than in 2020
• Earnings in Onshore expected to be higher than in 2020
• Earnings in Markets & Bioenergy expected to be lower than in 2020
• DKK 1.1 bn IFRS 9 one-off effect as we cease to report on business performance principle from 2021 (majority in Offshore)
On track to deliver average yearly increase in EBITDA from offshore and onshore wind and solar farms in operation between 2017-2023 of ~20 %
2021 gross investments expected to be DKK 32-34 bn
• Reflecting a high level of construction activity in Offshore and Onshore
18.1
1.1
Ma
rke
ts &
Bio
en
erg
y
IFR
S 9
on
e-o
ff e
ffe
cts
20
20
rea
lise
d
20
20
co
mp
ara
ble
Off
sho
re
On
sho
re
Da
nis
h p
ow
er
dis
trib
uti
on
, re
sid
en
tia
l c
ust
om
er
an
d
cit
y l
igh
t b
usi
ne
sse
s
Exi
stin
g o
ffsh
ore
p
art
ne
rsh
ips
-0.9
20
21
gu
ida
nc
e
-1.6
15-1615.6
10
Excl. IFRS 9 one-off effects
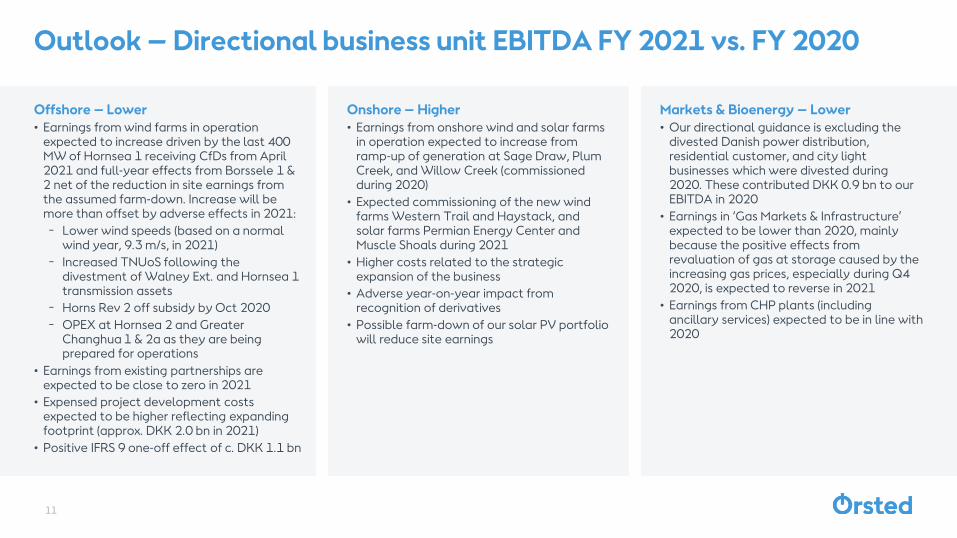
Outlook – Directional business unit EBITDA FY 2021 vs. FY 2020
Offshore – Lower
• Earnings from wind farms in operation expected to increase driven by the last 400 MW of Hornsea 1 receiving CfDs from April 2021 and full-year effects from Borssele 1 & 2 net of the reduction in site earnings from the assumed farm-down. Increase will be more than offset by adverse effects in 2021:
Lower wind speeds (based on a normal wind year, 9.3 m/s, in 2021)
Increased TNUoS following the divestment of Walney Ext. and Hornsea 1 transmission assets
Horns Rev 2 off subsidy by Oct 2020
OPEX at Hornsea 2 and Greater Changhua 1 & 2a as they are being prepared for operations
• Earnings from existing partnerships are expected to be close to zero in 2021
• Expensed project development costs expected to be higher reflecting expanding footprint (approx. DKK 2.0 bn in 2021)
• Positive IFRS 9 one-off effect of c. DKK 1.1 bn
Onshore – Higher
• Earnings from onshore wind and solar farms in operation expected to increase from ramp-up of generation at Sage Draw, Plum Creek, and Willow Creek (commissioned during 2020)
• Expected commissioning of the new wind farms Western Trail and Haystack, and solar farms Permian Energy Center and Muscle Shoals during 2021
• Higher costs related to the strategic expansion of the business
• Adverse year-on-year impact from recognition of derivatives
• Possible farm-down of our solar PV portfolio will reduce site earnings
Markets & Bioenergy – Lower
• Our directional guidance is excluding the divested Danish power distribution, residential customer, and city light businesses which were divested during 2020. These contributed DKK 0.9 bn to our EBITDA in 2020
• Earnings in ‘Gas Markets & Infrastructure’ expected to be lower than 2020, mainly because the positive effects from revaluation of gas at storage caused by the increasing gas prices, especially during Q4 2020, is expected to reverse in 2021
• Earnings from CHP plants (including ancillary services) expected to be in line with 2020
11
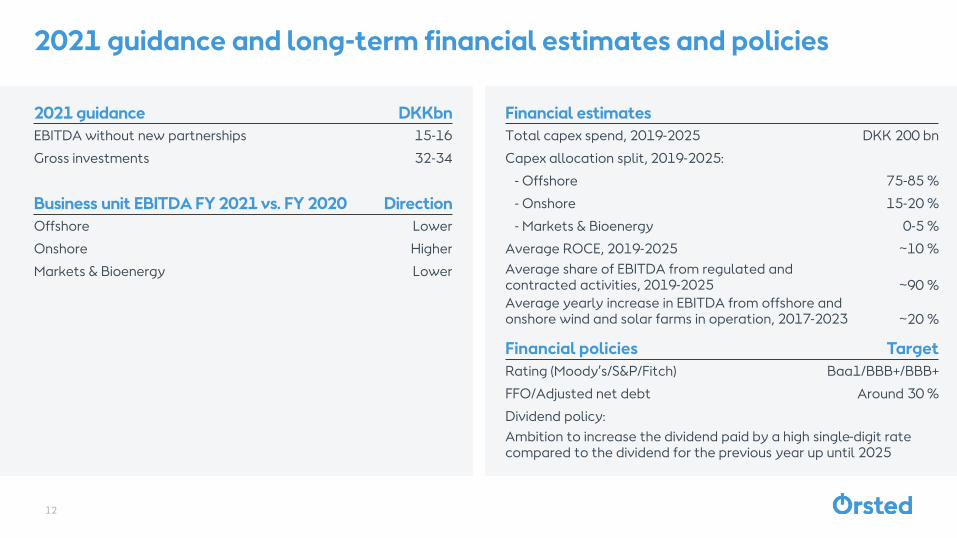
2021 guidance and long-term financial estimates and policies
Financial policies Target
Rating (Moody’s/S&P/Fitch) Baa1/BBB+/BBB+
FFO/Adjusted net debt Around 30 %
Dividend policy:
Ambition to increase the dividend paid by a high single-digit rate compared to the dividend for the previous year up until 2025
12
2021 guidance DKKbn
EBITDA without new partnerships 15-16
Gross investments 32-34
Business unit EBITDA FY 2021 vs. FY 2020 Direction
Offshore Lower
Onshore Higher
Markets & Bioenergy Lower
Financial estimates
Total capex spend, 2019-2025 DKK 200 bn
Capex allocation split, 2019-2025:
- Offshore 75-85 %
- Onshore 15-20 %
- Markets & Bioenergy 0-5 %
Average ROCE, 2019-2025 ~10 %
Average share of EBITDA from regulated and contracted activities, 2019-2025 ~90 %
Average yearly increase in EBITDA from offshore and onshore wind and solar farms in operation, 2017-2023 ~20 %
Ørsted Capital Markets Day
Save the date2 June 2021
Conference callDK: +45 7815 0110UK: +44 333 300 9270US: +1 833 249 8407
For questions, please press 01
Q&A
Appendix
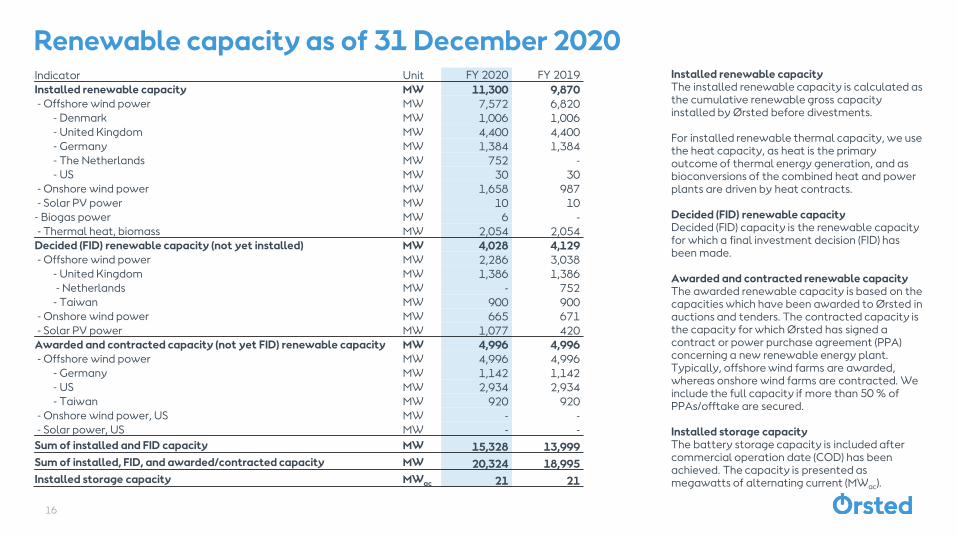
Renewable capacity as of 31 December 2020Indicator Unit FY 2020 FY 2019
Installed renewable capacity MW 11,300 9,870
- Offshore wind power MW 7,572 6,820
- Denmark MW 1,006 1,006
- United Kingdom MW 4,400 4,400
- Germany MW 1,384 1,384
- The Netherlands MW 752 -
- US MW 30 30
- Onshore wind power MW 1,658 987
- Solar PV power MW 10 10
- Biogas power MW 6 -
- Thermal heat, biomass MW 2,054 2,054
Decided (FID) renewable capacity (not yet installed) MW 4,028 4,129
- Offshore wind power MW 2,286 3,038
- United Kingdom MW 1,386 1,386
- Netherlands MW - 752
- Taiwan MW 900 900
- Onshore wind power MW 665 671
- Solar PV power MW 1,077 420
Awarded and contracted capacity (not yet FID) renewable capacity MW 4,996 4,996
- Offshore wind power MW 4,996 4,996
- Germany MW 1,142 1,142
- US MW 2,934 2,934
- Taiwan MW 920 920
- Onshore wind power, US MW - -
- Solar power, US MW - -
Sum of installed and FID capacity MW 15,328 13,999
Sum of installed, FID, and awarded/contracted capacity MW 20,324 18,995
Installed storage capacity MWac 21 21
Installed renewable capacityThe installed renewable capacity is calculated as the cumulative renewable gross capacity installed by Ørsted before divestments.
For installed renewable thermal capacity, we usethe heat capacity, as heat is the primary outcome of thermal energy generation, and as bioconversions of the combined heat and power plants are driven by heat contracts.
Decided (FID) renewable capacityDecided (FID) capacity is the renewable capacity for which a final investment decision (FID) has been made.
Awarded and contracted renewable capacityThe awarded renewable capacity is based on thecapacities which have been awarded to Ørsted inauctions and tenders. The contracted capacity is the capacity for which Ørsted has signed a contract or power purchase agreement (PPA) concerning a new renewable energy plant. Typically, offshore wind farms are awarded, whereas onshore wind farms are contracted. We include the full capacity if more than 50 % of PPAs/offtake are secured.
Installed storage capacityThe battery storage capacity is included aftercommercial operation date (COD) has been achieved. The capacity is presented as megawatts of alternating current (MWac).
16

Forecasted renewable capacity build-out
679
1,571536
1,559
236
823
206183
36
2020
143
2030(Post-COVID-19)
1,630
4,342
+10 %/year
CAGR2 % biomass19 % Offshore wind13 % Small-scale PV11 % Large-scale PV9 % Onshore wind
Global renewable energy capacity by technology1
GW installed
Global offshore wind capacity, excl. mainland ChinaGW installed
24
44
10210
36
7
23
2025
0
2015
0
2020 2030
11
24
61
161
+3 GW/year
+7 GW/year
+20 GW/year
Europe
North America
Asia Pacific
North American renewable capacity by technology2
GW installed
86134
199227
57
120
152
33
66
94
23
16
17
408
17
7
12
16
20202015 2025
16
2030
240
132
512
+8 %/year
Biomass
Onshore wind
Large-scale PV
Offshore wind
Small-scale PV
1. Excludes solar thermal, geothermal, marine, tidal, and others which combined account for less than 1 % of capacity2. North America includes the United States and Canada. Excludes solar thermal, geothermal, marine, and tidal which combined account for less than 1 % of capacitySource:. BNEF New Energy Outlook 2020 for 2020 capacity for all technologies except offshore wind. Offshore wind figures from BNEF Offshore Wind Market Outlook H2 2020 for 2020 capacity and post-COVID-19 2030 forecast
17

Country UK Taiwan US US Germany Taiwan
Expected completion
H1 2022 2022Pending FIDs
post 2020Pending FIDs
post 2020
2024-2025.Pending FID
end 2021
2025/2026.Pending FID
in 2023
Turbine 165 x 8 MW
SiemensGamesa
111 x 8 MW SiemensGamesa
Siemens Gamesa
12 MW GE
11 MW Siemens Gamesa
Turbine selection pending
Offshore wind build-out plan
7,572
9,858
14,854
1,386900
1,7141,220
1,142920
Installed capacityQ4 2020
US Mid-Atlantic cluster2
Hornsea 2 Decided (FID’ed) and installed
capacity(2022)
Greater Changhua
1 & 2a
US North-East cluster1
German Portfolio3
Greater Changhua
2b & 4
Decided (FID’ed), installed and
awarded capacity
18
Under construction
Awarded
Installed capacityMW
1. US North-East cluster: South Fork (130 MW), Revolution Wind (704 MW), and Sunrise Wind (880 MW)2. US Mid-Atlantic cluster: Skipjack (120 MW) and Ocean Wind (1,100 MW)3. German Portfolio: Gode Wind 3 (242 MW) and Borkum Riffgrund 3 (900 MW)
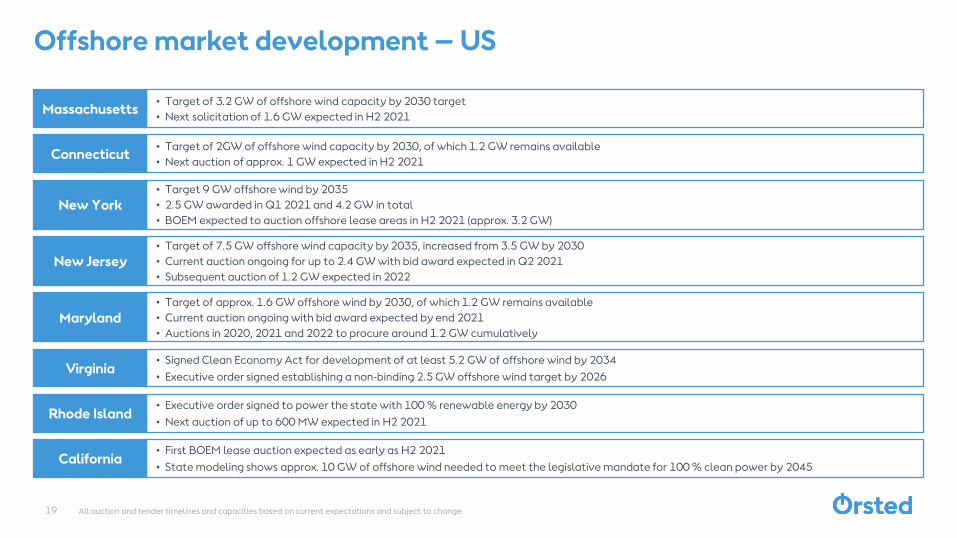
Massachusetts• Target of 3.2 GW of offshore wind capacity by 2030 target
• Next solicitation of 1.6 GW expected in H2 2021
New York
• Target 9 GW offshore wind by 2035
• 2.5 GW awarded in Q1 2021 and 4.2 GW in total
• BOEM expected to auction offshore lease areas in H2 2021 (approx. 3.2 GW)
New Jersey• Target of 7.5 GW offshore wind capacity by 2035, increased from 3.5 GW by 2030
• Current auction ongoing for up to 2.4 GW with bid award expected in Q2 2021
• Subsequent auction of 1.2 GW expected in 2022
Connecticut• Target of 2GW of offshore wind capacity by 2030, of which 1.2 GW remains available
• Next auction of approx. 1 GW expected in H2 2021
Maryland
• Target of approx. 1.6 GW offshore wind by 2030, of which 1.2 GW remains available
• Current auction ongoing with bid award expected by end 2021
• Auctions in 2020, 2021 and 2022 to procure around 1.2 GW cumulatively
Virginia• Signed Clean Economy Act for development of at least 5.2 GW of offshore wind by 2034
• Executive order signed establishing a non-binding 2.5 GW offshore wind target by 2026
Rhode Island• Executive order signed to power the state with 100 % renewable energy by 2030
• Next auction of up to 600 MW expected in H2 2021
Offshore market development – US
California• First BOEM lease auction expected as early as H2 2021
• State modeling shows approx. 10 GW of offshore wind needed to meet the legislative mandate for 100 % clean power by 2045
19 All auction and tender timelines and capacities based on current expectations and subject to change
20
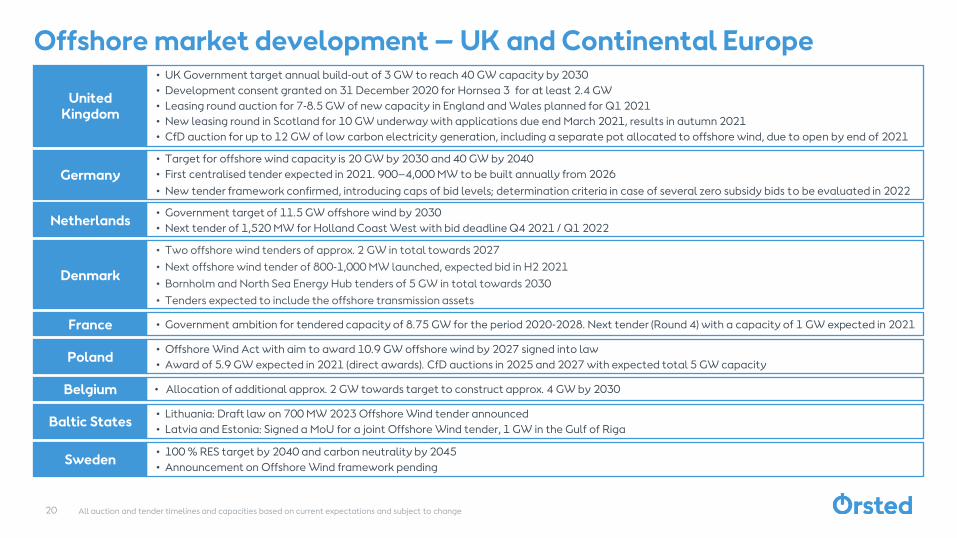
Offshore market development – UK and Continental Europe
Denmark
• Two offshore wind tenders of approx. 2 GW in total towards 2027
• Next offshore wind tender of 800-1,000 MW launched, expected bid in H2 2021
• Bornholm and North Sea Energy Hub tenders of 5 GW in total towards 2030
• Tenders expected to include the offshore transmission assets
Germany
• Target for offshore wind capacity is 20 GW by 2030 and 40 GW by 2040
• First centralised tender expected in 2021. 900–4,000 MW to be built annually from 2026
• New tender framework confirmed, introducing caps of bid levels; determination criteria in case of several zero subsidy bids to be evaluated in 2022
Netherlands• Government target of 11.5 GW offshore wind by 2030
• Next tender of 1,520 MW for Holland Coast West with bid deadline Q4 2021 / Q1 2022
United Kingdom
• UK Government target annual build-out of 3 GW to reach 40 GW capacity by 2030
• Development consent granted on 31 December 2020 for Hornsea 3 for at least 2.4 GW
• Leasing round auction for 7-8.5 GW of new capacity in England and Wales planned for Q1 2021
• New leasing round in Scotland for 10 GW underway with applications due end March 2021, results in autumn 2021
• CfD auction for up to 12 GW of low carbon electricity generation, including a separate pot allocated to offshore wind, due to open by end of 2021
France • Government ambition for tendered capacity of 8.75 GW for the period 2020-2028. Next tender (Round 4) with a capacity of 1 GW expected in 2021
Poland• Offshore Wind Act with aim to award 10.9 GW offshore wind by 2027 signed into law
• Award of 5.9 GW expected in 2021 (direct awards). CfD auctions in 2025 and 2027 with expected total 5 GW capacity
Belgium • Allocation of additional approx. 2 GW towards target to construct approx. 4 GW by 2030
Baltic States• Lithuania: Draft law on 700 MW 2023 Offshore Wind tender announced
• Latvia and Estonia: Signed a MoU for a joint Offshore Wind tender, 1 GW in the Gulf of Riga
Sweden• 100 % RES target by 2040 and carbon neutrality by 2045
• Announcement on Offshore Wind framework pending
All auction and tender timelines and capacities based on current expectations and subject to change
21
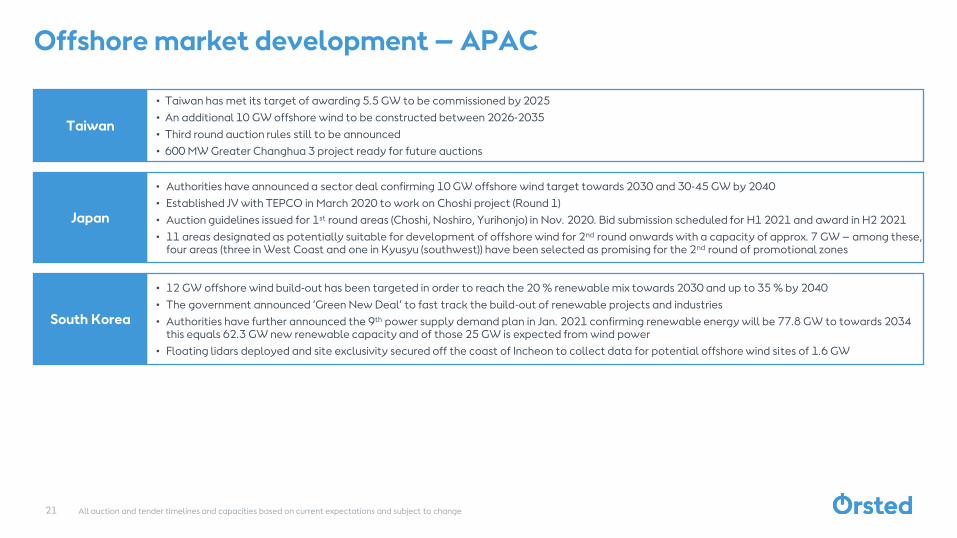
Offshore market development – APAC
Japan
• Authorities have announced a sector deal confirming 10 GW offshore wind target towards 2030 and 30-45 GW by 2040
• Established JV with TEPCO in March 2020 to work on Choshi project (Round 1)
• Auction guidelines issued for 1st round areas (Choshi, Noshiro, Yurihonjo) in Nov. 2020. Bid submission scheduled for H1 2021 and award in H2 2021
• 11 areas designated as potentially suitable for development of offshore wind for 2nd round onwards with a capacity of approx. 7 GW – among these, four areas (three in West Coast and one in Kyusyu (southwest)) have been selected as promising for the 2nd round of promotional zones
Taiwan
• Taiwan has met its target of awarding 5.5 GW to be commissioned by 2025
• An additional 10 GW offshore wind to be constructed between 2026-2035
• Third round auction rules still to be announced
• 600 MW Greater Changhua 3 project ready for future auctions
South Korea
• 12 GW offshore wind build-out has been targeted in order to reach the 20 % renewable mix towards 2030 and up to 35 % by 2040
• The government announced ‘Green New Deal’ to fast track the build-out of renewable projects and industries
• Authorities have further announced the 9th power supply demand plan in Jan. 2021 confirming renewable energy will be 77.8 GW to towards 2034 this equals 62.3 GW new renewable capacity and of those 25 GW is expected from wind power
• Floating lidars deployed and site exclusivity secured off the coast of Incheon to collect data for potential offshore wind sites of 1.6 GW
All auction and tender timelines and capacities based on current expectations and subject to change
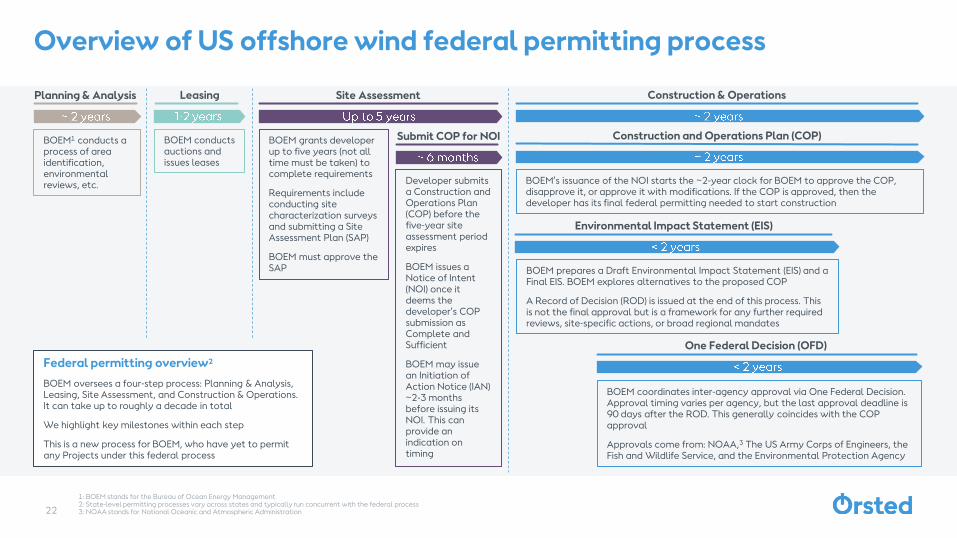
1: BOEM stands for the Bureau of Ocean Energy Management 2: State-level permitting processes vary across states and typically run concurrent with the federal process3: NOAA stands for National Oceanic and Atmospheric Administration22
Overview of US offshore wind federal permitting process
Planning & Analysis Leasing Site Assessment Construction & Operations
Submit COP for NOI Construction and Operations Plan (COP)BOEM1 conducts a process of area identification, environmental reviews, etc.
BOEM conducts auctions and issues leases
BOEM grants developer up to five years (not all time must be taken) to complete requirements
Requirements include conducting site characterization surveys and submitting a Site Assessment Plan (SAP)
BOEM must approve the SAP
Developer submits a Construction and Operations Plan (COP) before the five-year site assessment period expires
BOEM issues a Notice of Intent (NOI) once it deems the developer’s COP submission as Complete and Sufficient
BOEM may issue an Initiation of Action Notice (IAN) ~2-3 months before issuing its NOI. This can provide an indication on timing
BOEM’s issuance of the NOI starts the ~2-year clock for BOEM to approve the COP, disapprove it, or approve it with modifications. If the COP is approved, then the developer has its final federal permitting needed to start construction
Environmental Impact Statement (EIS)
BOEM prepares a Draft Environmental Impact Statement (EIS) and a Final EIS. BOEM explores alternatives to the proposed COP
A Record of Decision (ROD) is issued at the end of this process. This is not the final approval but is a framework for any further required reviews, site-specific actions, or broad regional mandates
One Federal Decision (OFD)
BOEM coordinates inter-agency approval via One Federal Decision. Approval timing varies per agency, but the last approval deadline is 90 days after the ROD. This generally coincides with the COP approval
Approvals come from: NOAA,3 The US Army Corps of Engineers, the Fish and Wildlife Service, and the Environmental Protection Agency
Federal permitting overview2
BOEM oversees a four-step process: Planning & Analysis, Leasing, Site Assessment, and Construction & Operations. It can take up to roughly a decade in total
We highlight key milestones within each step
This is a new process for BOEM, who have yet to permit any Projects under this federal process

RegionERCOT,
TXSERC,
ALERCOT,
TXSPP, NE
ERCOT, TX
Expected completion
Q2 2021 Q3 2021 Q3 2021 Q4 2021 Q2 2022
Technology Jinko & JA Solar First Solar GESiemensGamesa
LONGi Solar & JA Solar
Offtake solution
PPA with ExxonMobil
PPA with Tennessee
Valley Authority (TVA)
PPA with PepsiCo
PPAs with PepsiCo & two
other companies
PPA signed
Onshore build-out plan
23
Installed capacityMW
1. Permian Energy Center consists of 420 MWac Solar PV and 40 MWac storage facility
1,658
3,400
420227
367298
430
2025ambition
HaystackInstalled capacityQ4 2020
Western TrailPermian Energy Center1
Muscle Shoals Old 300 Decided (FID’ed) and
installed capacity
~5,000
Under construction
24
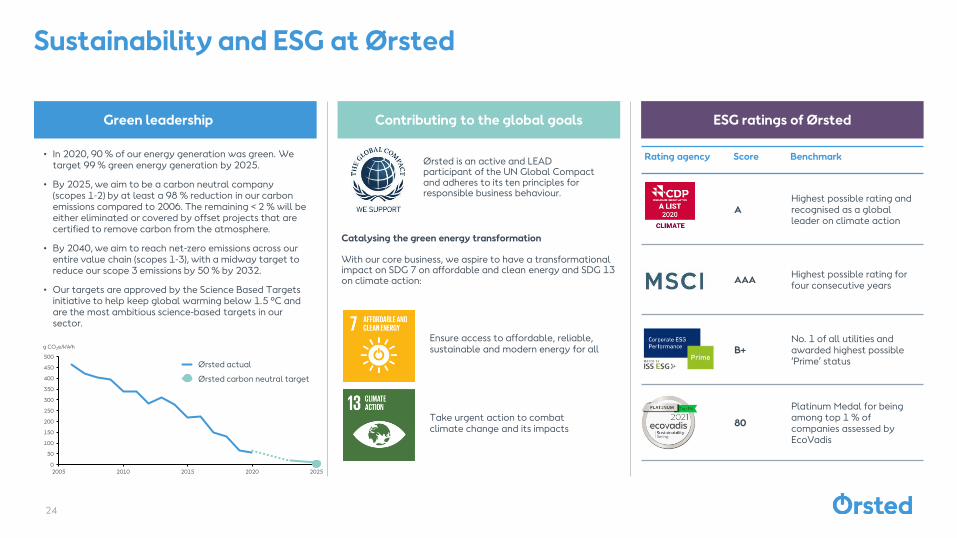
Sustainability and ESG at Ørsted
Green leadership Contributing to the global goals ESG ratings of Ørsted
Rating agency Score Benchmark
AHighest possible rating and recognised as a global leader on climate action
AAAHighest possible rating for four consecutive years
B+No. 1 of all utilities and awarded highest possible ‘Prime’ status
80
Platinum Medal for being among top 1 % of companies assessed by EcoVadis
Ørsted is an active and LEAD participant of the UN Global Compact and adheres to its ten principles for responsible business behaviour.
Ensure access to affordable, reliable, sustainable and modern energy for all
Take urgent action to combat climate change and its impacts
Catalysing the green energy transformation
With our core business, we aspire to have a transformational impact on SDG 7 on affordable and clean energy and SDG 13 on climate action:
• In 2020, 90 % of our energy generation was green. We target 99 % green energy generation by 2025.
• By 2025, we aim to be a carbon neutral company (scopes 1-2) by at least a 98 % reduction in our carbon emissions compared to 2006. The remaining < 2 % will be either eliminated or covered by offset projects that are certified to remove carbon from the atmosphere.
• By 2040, we aim to reach net-zero emissions across our entire value chain (scopes 1-3), with a midway target to reduce our scope 3 emissions by 50 % by 2032.
• Our targets are approved by the Science Based Targets initiative to help keep global warming below 1.5 ºC and are the most ambitious science-based targets in our sector.
0
50
100
150
200
250
300
350
400
450
500
2005 2010 2015 2020 2025
g CO2e/kWh
Ørsted actual
Ørsted carbon neutral target
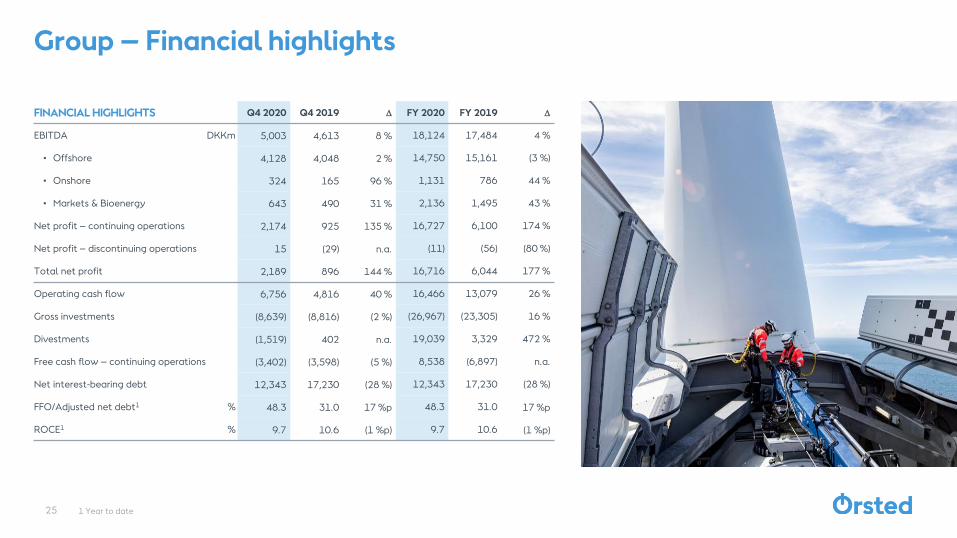
1 Year to date
Group – Financial highlights
FINANCIAL HIGHLIGHTS Q4 2020 Q4 2019 D FY 2020 FY 2019 D
EBITDA DKKm 5,003 4,613 8 % 18,124 17,484 4 %
• Offshore 4,128 4,048 2 % 14,750 15,161 (3 %)
• Onshore 324 165 96 % 1,131 786 44 %
• Markets & Bioenergy 643 490 31 % 2,136 1,495 43 %
Net profit – continuing operations 2,174 925 135 % 16,727 6,100 174 %
Net profit – discontinuing operations 15 (29) n.a. (11) (56) (80 %)
Total net profit 2,189 896 144 % 16,716 6,044 177 %
Operating cash flow 6,756 4,816 40 % 16,466 13,079 26 %
Gross investments (8,639) (8,816) (2 %) (26,967) (23,305) 16 %
Divestments (1,519) 402 n.a. 19,039 3,329 472 %
Free cash flow – continuing operations (3,402) (3,598) (5 %) 8,538 (6,897) n.a.
Net interest-bearing debt 12,343 17,230 (28 %) 12,343 17,230 (28 %)
FFO/Adjusted net debt1 % 48.3 31.0 17 %p 48.3 31.0 17 %p
ROCE1 % 9.7 10.6 (1 %p) 9.7 10.6 (1 %p)
25
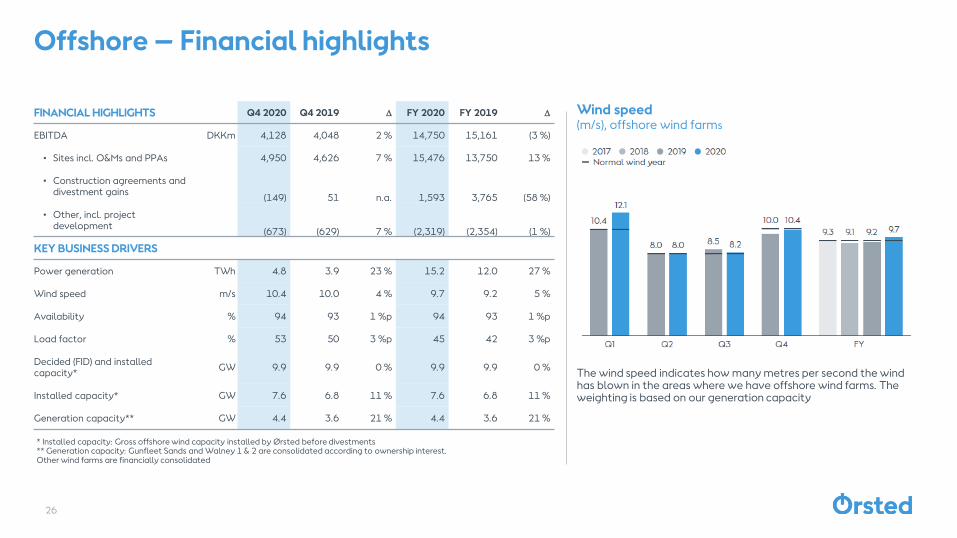
Offshore – Financial highlights
26
Wind speed(m/s), offshore wind farms
The wind speed indicates how many metres per second the wind has blown in the areas where we have offshore wind farms. The weighting is based on our generation capacity
* Installed capacity: Gross offshore wind capacity installed by Ørsted before divestments** Generation capacity: Gunfleet Sands and Walney 1 & 2 are consolidated according to ownership interest. Other wind farms are financially consolidated
FINANCIAL HIGHLIGHTS Q4 2020 Q4 2019 D FY 2020 FY 2019 D
EBITDA DKKm 4,128 4,048 2 % 14,750 15,161 (3 %)
• Sites incl. O&Ms and PPAs 4,950 4,626 7 % 15,476 13,750 13 %
• Construction agreements and divestment gains
(149) 51 n.a. 1,593 3,765 (58 %)
• Other, incl. project development
(673) (629) 7 % (2,319) (2,354) (1 %)
KEY BUSINESS DRIVERS
Power generation TWh 4.8 3.9 23 % 15.2 12.0 27 %
Wind speed m/s 10.4 10.0 4 % 9.7 9.2 5 %
Availability % 94 93 1 %p 94 93 1 %p
Load factor % 53 50 3 %p 45 42 3 %p
Decided (FID) and installed capacity*
GW 9.9 9.9 0 % 9.9 9.9 0 %
Installed capacity* GW 7.6 6.8 11 % 7.6 6.8 11 %
Generation capacity** GW 4.4 3.6 21 % 4.4 3.6 21 %
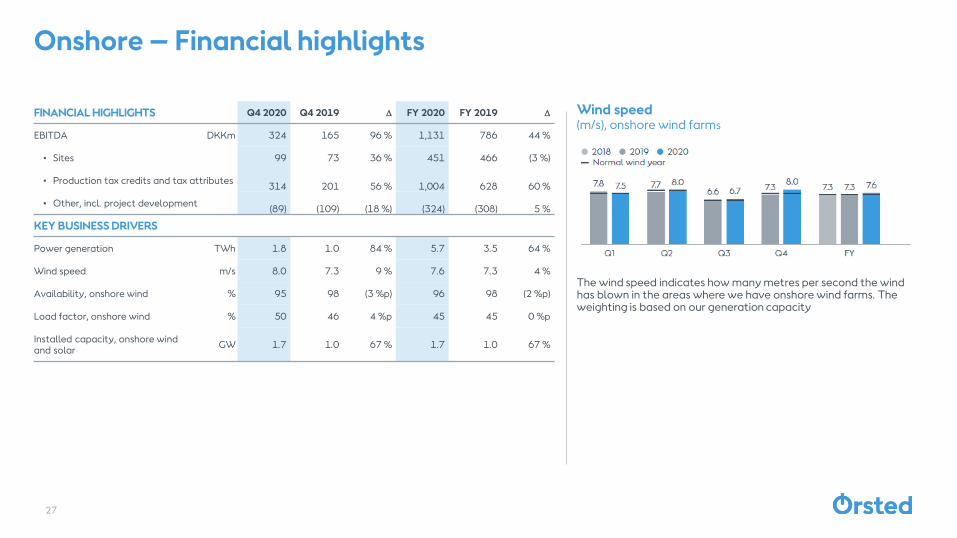
Onshore – Financial highlights
27
The wind speed indicates how many metres per second the wind has blown in the areas where we have onshore wind farms. The weighting is based on our generation capacity
Wind speed(m/s), onshore wind farms
FINANCIAL HIGHLIGHTS Q4 2020 Q4 2019 D FY 2020 FY 2019 D
EBITDA DKKm 324 165 96 % 1,131 786 44 %
• Sites 99 73 36 % 451 466 (3 %)
• Production tax credits and tax attributes314 201 56 % 1,004 628 60 %
• Other, incl. project development(89) (109) (18 %) (324) (308) 5 %
KEY BUSINESS DRIVERS
Power generation TWh 1.8 1.0 84 % 5.7 3.5 64 %
Wind speed m/s 8.0 7.3 9 % 7.6 7.3 4 %
Availability, onshore wind % 95 98 (3 %p) 96 98 (2 %p)
Load factor, onshore wind % 50 46 4 %p 45 45 0 %p
Installed capacity, onshore wind and solar
GW 1.7 1.0 67 % 1.7 1.0 67 %
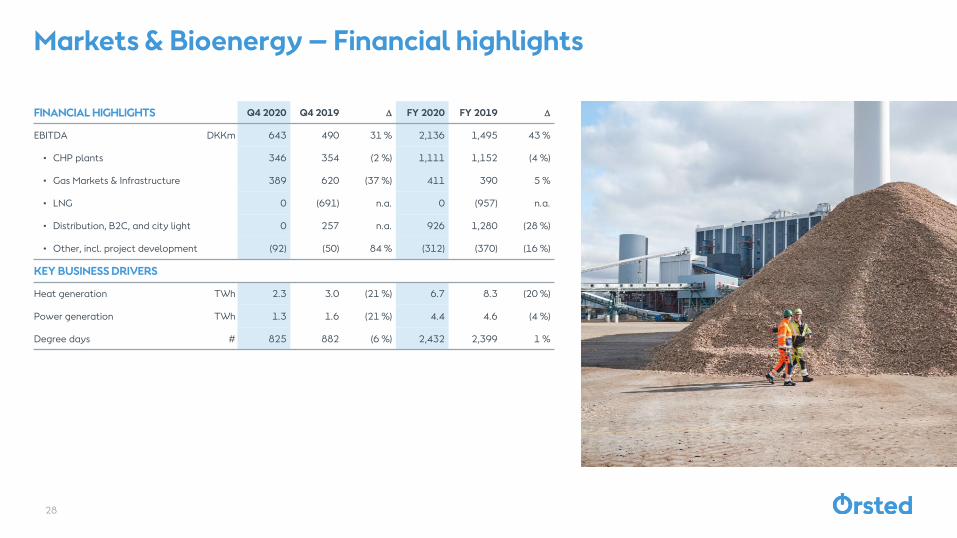
Markets & Bioenergy – Financial highlights
28
FINANCIAL HIGHLIGHTS Q4 2020 Q4 2019 D FY 2020 FY 2019 D
EBITDA DKKm 643 490 31 % 2,136 1,495 43 %
• CHP plants 346 354 (2 %) 1,111 1,152 (4 %)
• Gas Markets & Infrastructure 389 620 (37 %) 411 390 5 %
• LNG 0 (691) n.a. 0 (957) n.a.
• Distribution, B2C, and city light 0 257 n.a. 926 1,280 (28 %)
• Other, incl. project development (92) (50) 84 % (312) (370) (16 %)
KEY BUSINESS DRIVERS
Heat generation TWh 2.3 3.0 (21 %) 6.7 8.3 (20 %)
Power generation TWh 1.3 1.6 (21 %) 4.4 4.6 (4 %)
Degree days # 825 882 (6 %) 2,432 2,399 1 %
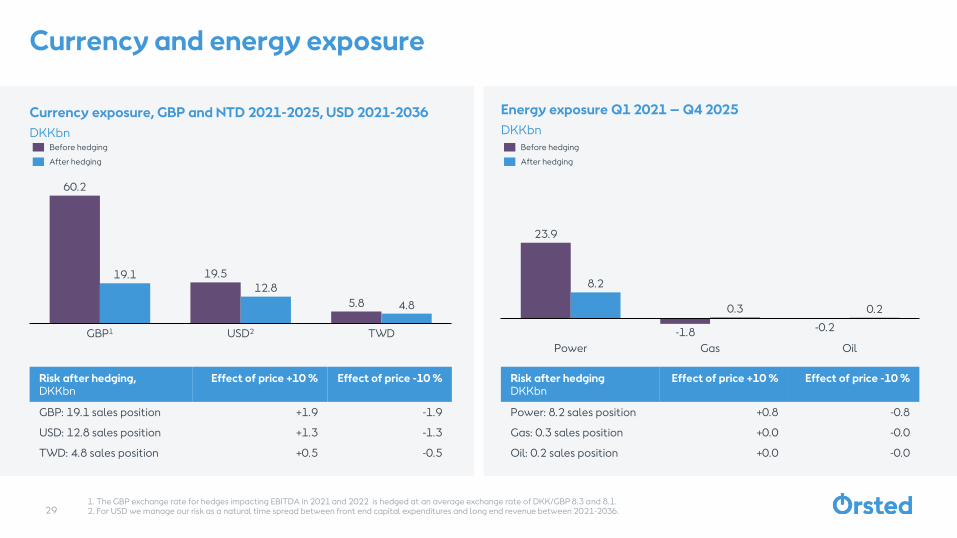
Currency exposure, GBP and NTD 2021-2025, USD 2021-2036
DKKbn
Currency and energy exposure
60.2
19.5
5.8
19.112.8
4.8
TWDGBP1 USD2
23.9
-1.8 -0.2
8.2
0.3 0.2
Power OilGas
Before hedging
After hedging
Before hedging
After hedging
Risk after hedgingDKKbn
Effect of price +10 % Effect of price -10 %
Power: 8.2 sales position +0.8 -0.8
Gas: 0.3 sales position +0.0 -0.0
Oil: 0.2 sales position +0.0 -0.0
Risk after hedging,DKKbn
Effect of price +10 % Effect of price -10 %
GBP: 19.1 sales position +1.9 -1.9
USD: 12.8 sales position +1.3 -1.3
TWD: 4.8 sales position +0.5 -0.5
Energy exposure Q1 2021 – Q4 2025
DKKbn
291. The GBP exchange rate for hedges impacting EBITDA in 2021 and 2022 is hedged at an average exchange rate of DKK/GBP 8.3 and 8.1.2. For USD we manage our risk as a natural time spread between front end capital expenditures and long end revenue between 2021-2036.
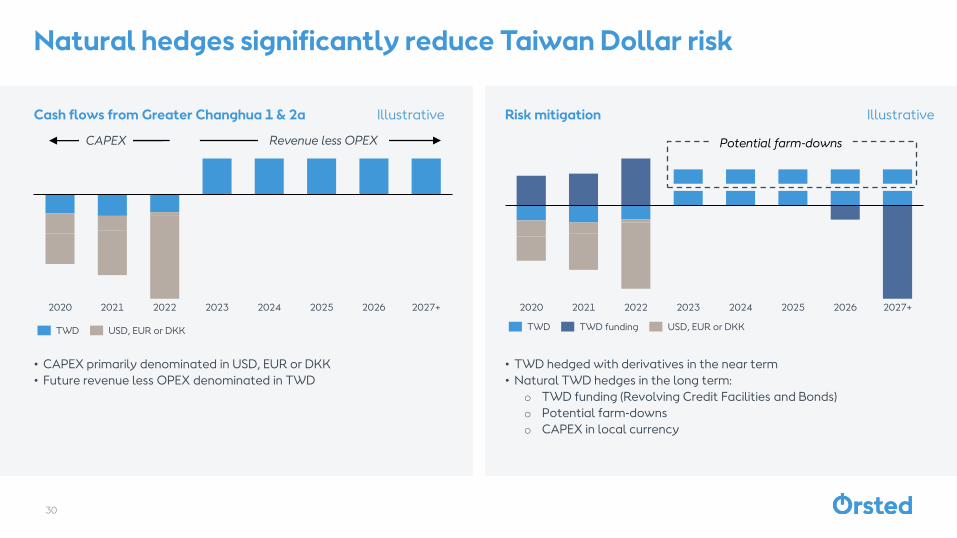
Natural hedges significantly reduce Taiwan Dollar risk
Cash flows from Greater Changhua 1 & 2a
• CAPEX primarily denominated in USD, EUR or DKK
• Future revenue less OPEX denominated in TWD
Risk mitigation
• TWD hedged with derivatives in the near term
• Natural TWD hedges in the long term:
o TWD funding (Revolving Credit Facilities and Bonds)
o Potential farm-downs
o CAPEX in local currency
2027+2020 20232021 2022 20252024 2026
Revenue less OPEXCAPEX
Illustrative
TWD USD, EUR or DKK
2027+2020 202320222021 2024 2025 2026
TWD TWD funding USD, EUR or DKK
Illustrative
Potential farm-downs
30
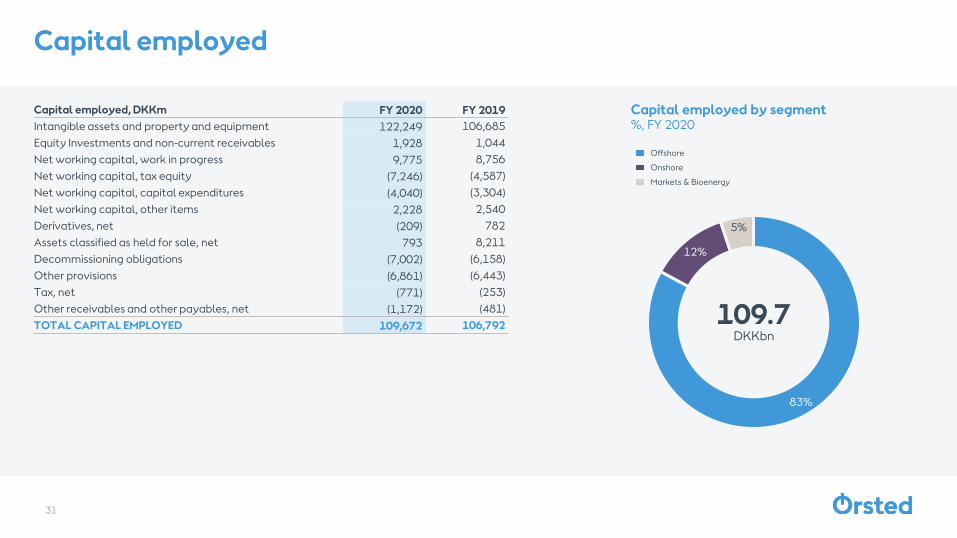
Capital employed
31
Capital employed, DKKm FY 2020 FY 2019
Intangible assets and property and equipment 122,249 106,685
Equity Investments and non-current receivables 1,928 1,044
Net working capital, work in progress 9,775 8,756
Net working capital, tax equity (7,246) (4,587)
Net working capital, capital expenditures (4,040) (3,304)
Net working capital, other items 2,228 2,540
Derivatives, net (209) 782
Assets classified as held for sale, net 793 8,211
Decommissioning obligations (7,002) (6,158)
Other provisions (6,861) (6,443)
Tax, net (771) (253)
Other receivables and other payables, net (1,172) (481)
TOTAL CAPITAL EMPLOYED 109,672 106,792
83%
12%
5%
Capital employed by segment%, FY 2020
109.7DKKbn
Offshore
Onshore
Markets & Bioenergy
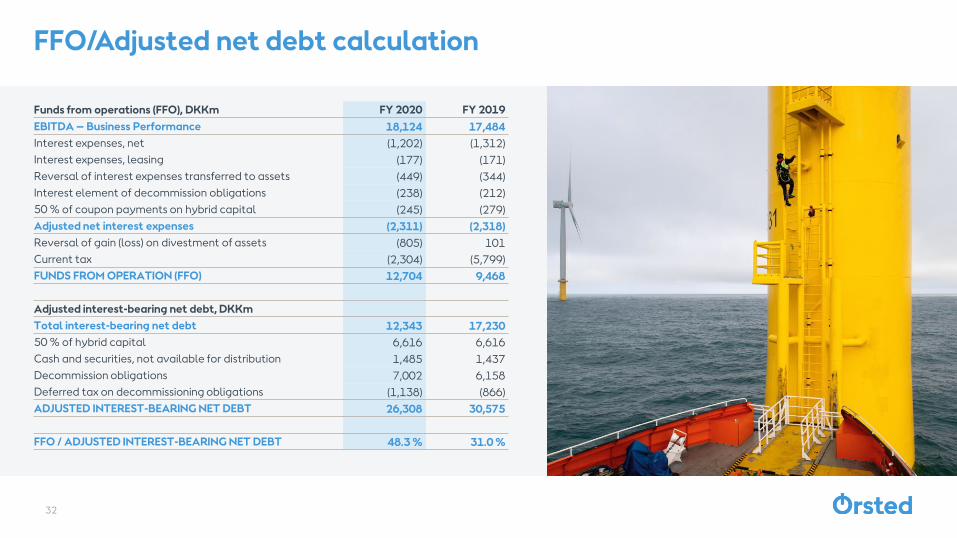
FFO/Adjusted net debt calculation
Funds from operations (FFO), DKKm FY 2020 FY 2019
EBITDA – Business Performance 18,124 17,484
Interest expenses, net (1,202) (1,312)
Interest expenses, leasing (177) (171)
Reversal of interest expenses transferred to assets (449) (344)
Interest element of decommission obligations (238) (212)
50 % of coupon payments on hybrid capital (245) (279)
Adjusted net interest expenses (2,311) (2,318)
Reversal of gain (loss) on divestment of assets (805) 101
Current tax (2,304) (5,799)
FUNDS FROM OPERATION (FFO) 12,704 9,468
Adjusted interest-bearing net debt, DKKm
Total interest-bearing net debt 12,343 17,230
50 % of hybrid capital 6,616 6,616
Cash and securities, not available for distribution 1,485 1,437
Decommission obligations 7,002 6,158
Deferred tax on decommissioning obligations (1,138) (866)
ADJUSTED INTEREST-BEARING NET DEBT 26,308 30,575
FFO / ADJUSTED INTEREST-BEARING NET DEBT 48.3 % 31.0 %
32
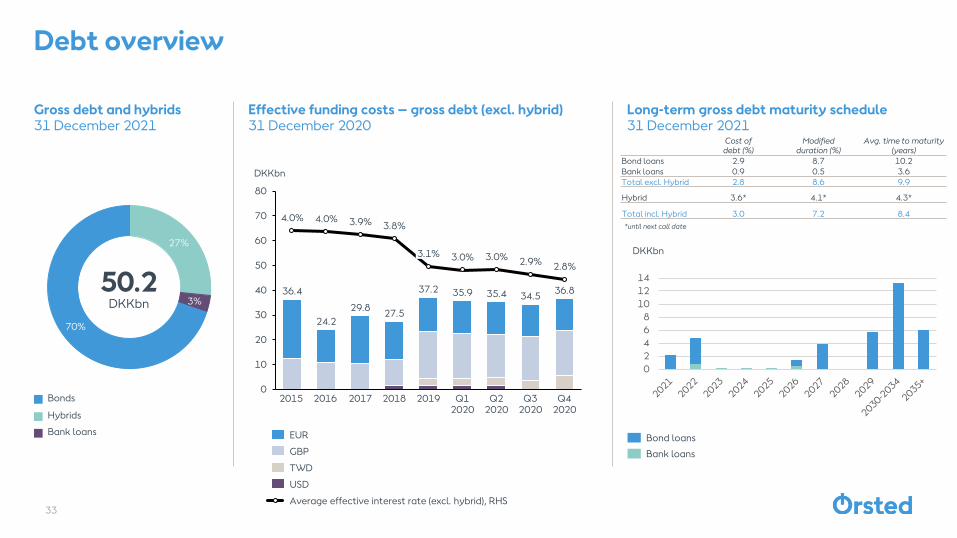
27%
3%
70%
Long-term gross debt maturity schedule 31 December 2021
Gross debt and hybrids31 December 2021
Bonds
Hybrids
Bank loans
50.2DKKbn
Debt overview
33
0
10
20
30
40
50
60
70
80
2018
DKKbn
2015
36.8
4.0% 4.0% 3.9%
2016 2017
3.8%
3.1%
2019
3.0%
Q1 2020
Q3 2020
3.0%
Q2 2020
2.9%2.8%
Q4 2020
36.4
24.2
29.827.5
37.2 35.9 35.4 34.5
EUR
GBP
TWD
USD
Average effective interest rate (excl. hybrid), RHS
Effective funding costs – gross debt (excl. hybrid)31 December 2020
Cost of debt (%)
Modified duration (%)
Avg. time to maturity (years)
Bond loans 2.9 8.7 10.2
Bank loans 0.9 0.5 3.6
Total excl. Hybrid 2.8 8.6 9.9
Hybrid 3.6* 4.1* 4.3*
Total incl. Hybrid 3.0 7.2 8.4
DKKbn
Bond loans
Bank loans
*until next call date
0
2
4
6
8
10
12
14
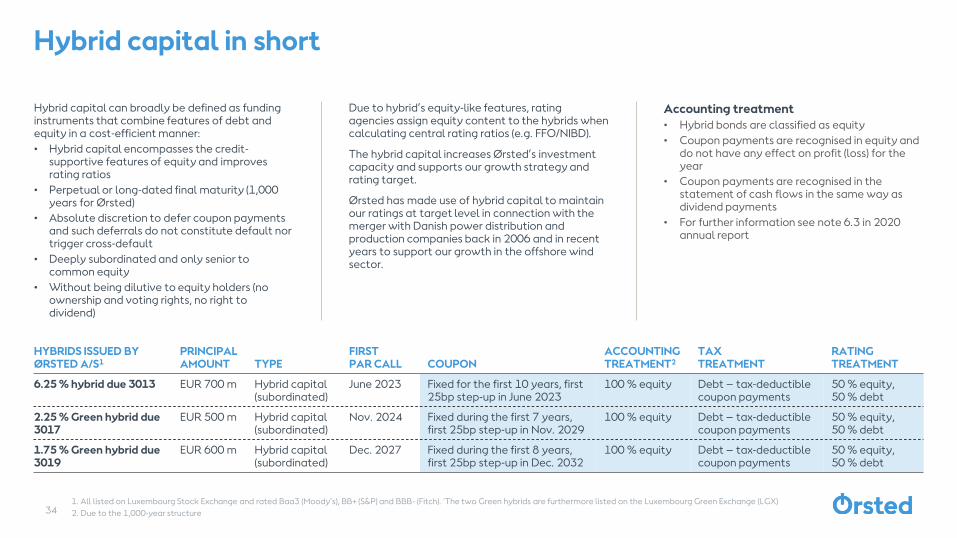
Accounting treatment
• Hybrid bonds are classified as equity
• Coupon payments are recognised in equity and do not have any effect on profit (loss) for the year
• Coupon payments are recognised in the statement of cash flows in the same way as dividend payments
• For further information see note 6.3 in 2020 annual report
Hybrid capital can broadly be defined as funding instruments that combine features of debt and equity in a cost-efficient manner:
• Hybrid capital encompasses the credit-supportive features of equity and improves rating ratios
• Perpetual or long-dated final maturity (1,000 years for Ørsted)
• Absolute discretion to defer coupon payments and such deferrals do not constitute default nor trigger cross-default
• Deeply subordinated and only senior to common equity
• Without being dilutive to equity holders (no ownership and voting rights, no right to dividend)
HYBRIDS ISSUED BY ØRSTED A/S1
PRINCIPALAMOUNT TYPE
FIRST PAR CALL COUPON
ACCOUNTING TREATMENT2
TAX TREATMENT
RATING TREATMENT
6.25 % hybrid due 3013 EUR 700 m Hybrid capital (subordinated)
June 2023 Fixed for the first 10 years, first 25bp step-up in June 2023
100 % equity Debt – tax-deductible coupon payments
50 % equity, 50 % debt
2.25 % Green hybrid due 3017
EUR 500 m Hybrid capital (subordinated)
Nov. 2024 Fixed during the first 7 years, first 25bp step-up in Nov. 2029
100 % equity Debt – tax-deductible coupon payments
50 % equity, 50 % debt
1.75 % Green hybrid due 3019
EUR 600 m Hybrid capital (subordinated)
Dec. 2027 Fixed during the first 8 years, first 25bp step-up in Dec. 2032
100 % equity Debt – tax-deductible coupon payments
50 % equity, 50 % debt
1. All listed on Luxembourg Stock Exchange and rated Baa3 (Moody’s), BB+ (S&P) and BBB- (Fitch). ´The two Green hybrids are furthermore listed on the Luxembourg Green Exchange (LGX)
2. Due to the 1,000-year structure
Hybrid capital in short
Due to hybrid’s equity-like features, rating agencies assign equity content to the hybrids when calculating central rating ratios (e.g. FFO/NIBD).
The hybrid capital increases Ørsted’s investment capacity and supports our growth strategy and rating target.
Ørsted has made use of hybrid capital to maintain our ratings at target level in connection with the merger with Danish power distribution and production companies back in 2006 and in recent years to support our growth in the offshore wind sector.
34
Bond Type Issue date Maturity Face ValueRemaining amount
Coupon Coupon payments*Green bond
Allocated to green projects (DKKm)
Avoided emissions (t CO2/year) attributable to the bonds
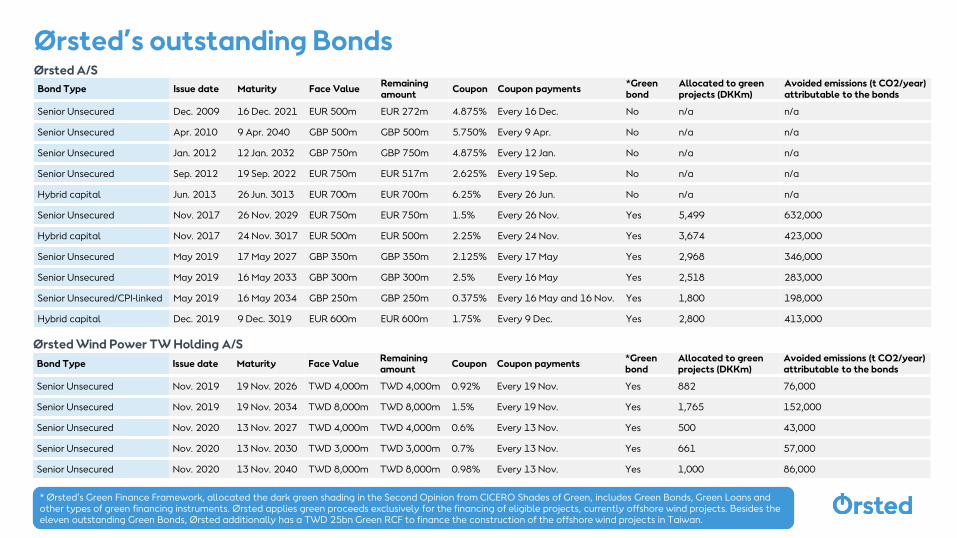
Senior Unsecured Dec. 2009 16 Dec. 2021 EUR 500m EUR 272m 4.875% Every 16 Dec. No n/a n/a
Senior Unsecured Apr. 2010 9 Apr. 2040 GBP 500m GBP 500m 5.750% Every 9 Apr. No n/a n/a
Senior Unsecured Jan. 2012 12 Jan. 2032 GBP 750m GBP 750m 4.875% Every 12 Jan. No n/a n/a
Senior Unsecured Sep. 2012 19 Sep. 2022 EUR 750m EUR 517m 2.625% Every 19 Sep. No n/a n/a
Hybrid capital Jun. 2013 26 Jun. 3013 EUR 700m EUR 700m 6.25% Every 26 Jun. No n/a n/a
Senior Unsecured Nov. 2017 26 Nov. 2029 EUR 750m EUR 750m 1.5% Every 26 Nov. Yes 5,499 632,000
Hybrid capital Nov. 2017 24 Nov. 3017 EUR 500m EUR 500m 2.25% Every 24 Nov. Yes 3,674 423,000
Senior Unsecured May 2019 17 May 2027 GBP 350m GBP 350m 2.125% Every 17 May Yes 2,968 346,000
Senior Unsecured May 2019 16 May 2033 GBP 300m GBP 300m 2.5% Every 16 May Yes 2,518 283,000
Senior Unsecured/CPI-linked May 2019 16 May 2034 GBP 250m GBP 250m 0.375% Every 16 May and 16 Nov. Yes 1,800 198,000
Hybrid capital Dec. 2019 9 Dec. 3019 EUR 600m EUR 600m 1.75% Every 9 Dec. Yes 2,800 413,000
35
Ørsted A/S
Bond Type Issue date Maturity Face ValueRemaining amount
Coupon Coupon payments*Green bond
Allocated to green projects (DKKm)
Avoided emissions (t CO2/year) attributable to the bonds
Senior Unsecured Nov. 2019 19 Nov. 2026 TWD 4,000m TWD 4,000m 0.92% Every 19 Nov. Yes 882 76,000
Senior Unsecured Nov. 2019 19 Nov. 2034 TWD 8,000m TWD 8,000m 1.5% Every 19 Nov. Yes 1,765 152,000
Senior Unsecured Nov. 2020 13 Nov. 2027 TWD 4,000m TWD 4,000m 0.6% Every 13 Nov. Yes 500 43,000
Senior Unsecured Nov. 2020 13 Nov. 2030 TWD 3,000m TWD 3,000m 0.7% Every 13 Nov. Yes 661 57,000
Senior Unsecured Nov. 2020 13 Nov. 2040 TWD 8,000m TWD 8,000m 0.98% Every 13 Nov. Yes 1,000 86,000
Ørsted Wind Power TW Holding A/S
Ørsted’s outstanding Bonds
* Ørsted’s Green Finance Framework, allocated the dark green shading in the Second Opinion from CICERO Shades of Green, includes Green Bonds, Green Loans and other types of green financing instruments. Ørsted applies green proceeds exclusively for the financing of eligible projects, currently offshore wind projects. Besides the eleven outstanding Green Bonds, Ørsted additionally has a TWD 25bn Green RCF to finance the construction of the offshore wind projects in Taiwan.
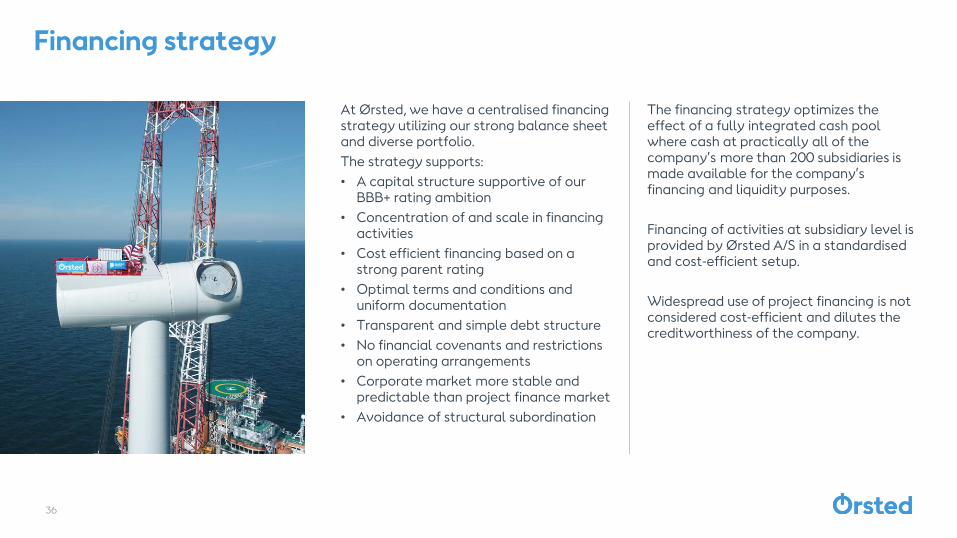
The financing strategy optimizes the effect of a fully integrated cash pool where cash at practically all of the company’s more than 200 subsidiaries is made available for the company’s financing and liquidity purposes.
Financing of activities at subsidiary level is provided by Ørsted A/S in a standardised and cost-efficient setup.
Widespread use of project financing is not considered cost-efficient and dilutes the creditworthiness of the company.
Financing strategy
36
At Ørsted, we have a centralised financing strategy utilizing our strong balance sheet and diverse portfolio.
The strategy supports:
• A capital structure supportive of our BBB+ rating ambition
• Concentration of and scale in financing activities
• Cost efficient financing based on a strong parent rating
• Optimal terms and conditions and uniform documentation
• Transparent and simple debt structure
• No financial covenants and restrictions on operating arrangements
• Corporate market more stable and predictable than project finance market
• Avoidance of structural subordination
37
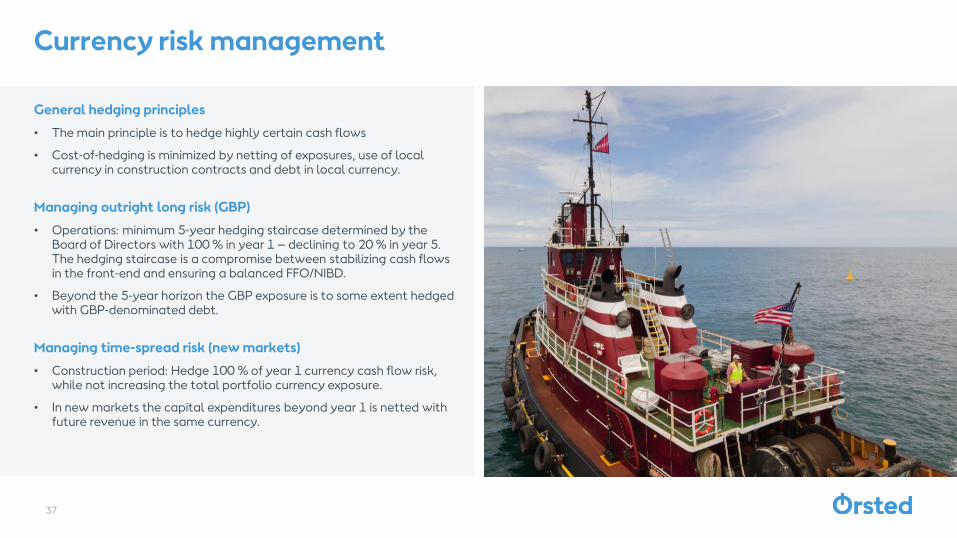
Currency risk management
General hedging principles
• The main principle is to hedge highly certain cash flows
• Cost-of-hedging is minimized by netting of exposures, use of local currency in construction contracts and debt in local currency.
Managing outright long risk (GBP)
• Operations: minimum 5-year hedging staircase determined by the Board of Directors with 100 % in year 1 – declining to 20 % in year 5. The hedging staircase is a compromise between stabilizing cash flows in the front-end and ensuring a balanced FFO/NIBD.
• Beyond the 5-year horizon the GBP exposure is to some extent hedged with GBP-denominated debt.
Managing time-spread risk (new markets)
• Construction period: Hedge 100 % of year 1 currency cash flow risk, while not increasing the total portfolio currency exposure.
• In new markets the capital expenditures beyond year 1 is netted with future revenue in the same currency.
The pie charts represent approximate size of the exposures38
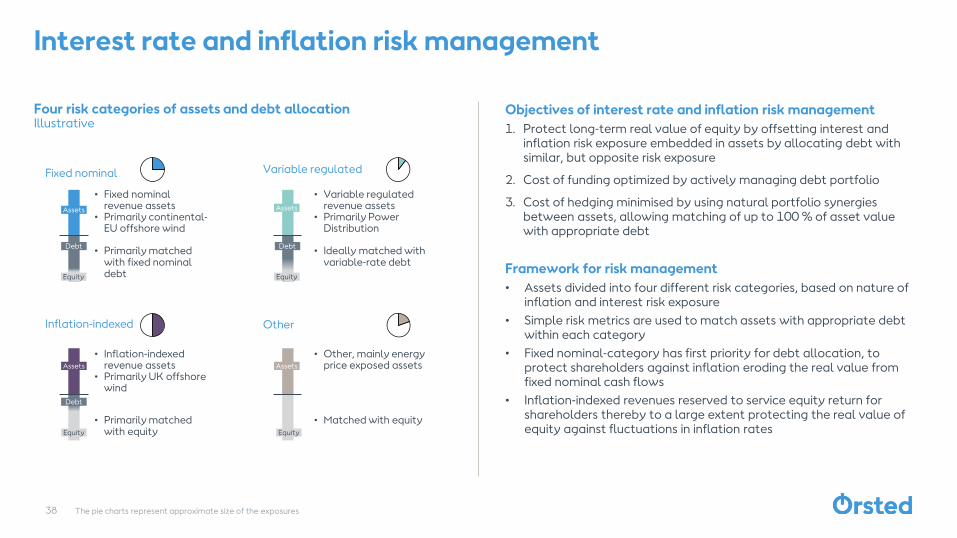
Interest rate and inflation risk management
Objectives of interest rate and inflation risk management
1. Protect long-term real value of equity by offsetting interest and inflation risk exposure embedded in assets by allocating debt with similar, but opposite risk exposure
2. Cost of funding optimized by actively managing debt portfolio
3. Cost of hedging minimised by using natural portfolio synergies between assets, allowing matching of up to 100 % of asset value with appropriate debt
Framework for risk management
• Assets divided into four different risk categories, based on nature of inflation and interest risk exposure
• Simple risk metrics are used to match assets with appropriate debt within each category
• Fixed nominal-category has first priority for debt allocation, to protect shareholders against inflation eroding the real value from fixed nominal cash flows
• Inflation-indexed revenues reserved to service equity return for shareholders thereby to a large extent protecting the real value of equity against fluctuations in inflation rates
Fixed nominal Variable regulated
OtherInflation-indexed
• Fixed nominal revenue assets
• Primarily continental-EU offshore wind
• Variable regulated revenue assets
• Primarily Power Distribution
• Inflation-indexed revenue assets
• Primarily UK offshore wind
• Other, mainly energy price exposed assets
• Primarily matched with fixed nominal debt
• Primarily matched with equity
• Ideally matched with variable-rate debt
Four risk categories of assets and debt allocationIllustrative
• Matched with equity
Assets
Equity
Assets
Equity
Debt
Assets
Debt
Equity
Assets
Debt
Equity
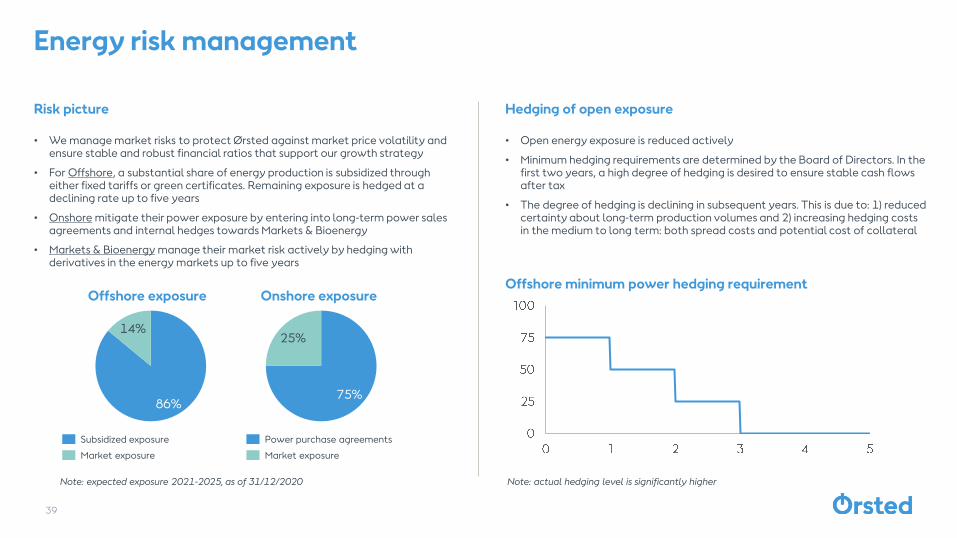
Energy risk management
• We manage market risks to protect Ørsted against market price volatility and ensure stable and robust financial ratios that support our growth strategy
• For Offshore, a substantial share of energy production is subsidized through either fixed tariffs or green certificates. Remaining exposure is hedged at a declining rate up to five years
• Onshore mitigate their power exposure by entering into long-term power sales agreements and internal hedges towards Markets & Bioenergy
• Markets & Bioenergy manage their market risk actively by hedging with derivatives in the energy markets up to five years
Offshore exposure Onshore exposure
Note: expected exposure 2021-2025, as of 31/12/2020
• Open energy exposure is reduced actively
• Minimum hedging requirements are determined by the Board of Directors. In the first two years, a high degree of hedging is desired to ensure stable cash flows after tax
• The degree of hedging is declining in subsequent years. This is due to: 1) reduced certainty about long-term production volumes and 2) increasing hedging costs in the medium to long term: both spread costs and potential cost of collateral
Offshore minimum power hedging requirement
Note: actual hedging level is significantly higher
Risk picture Hedging of open exposure
86%
14%
75%
25%
Power purchase agreements
Market exposure
Subsidized exposure
Market exposure
39
Allan Bødskov Andersen
Head of Investor Relations
Rasmus Hærvig
Manager
Alex Morgan
Lead Investor Relations Officer
Sabine Lohse
Senior Investor Relations Officer
Henriette Stenderup
IR Coordinator