Embed Size (px)
Citation preview
Investor PresentationFebruary 2018
1
About this Presentation
Purpose of this Presentation
We are providing this presentation for informational purposes only. This presentation does not constitute an offer to sell, a solicitation of an offer to buy, or a
recommendation to purchase any securities.
In this presentation:
• the terms “Vista”, “Vista Oil & Gas”, “Issuer”, “Company”, “us”, “we” or “our” refer to Vista Oil & Gas, S.A.B. de C.V., and
• the term “Riverstone” refers to “Riverstone Investment Group LLC”, a limited liability company incorporated under the laws of the State of Delaware, United States of
America, as well as to its affiliate entities and funds.
This presentation is being provided by Vista, and is not being provided by, and shall not constitute a presentation of, Riverstone. An investment in Vista does not
constitute an investment in Riverstone or any of its funds. Riverstone’s historic results or those of its funds are not necessarily indicative of Vista’s future performance.
Proprietary Information
This presentation contains proprietary information. You may not copy it, excerpt it, summarize it or distribute it or any of its contents to any other person or entity, in
whole or in part. Any person receiving this presentation, by the mere fact of such reception, acknowledges and agrees that it shall not copy, excerpt, summarize, or
distribute it or any of its contents.
Other Matters
This presentation does not constitute an agreement of any kind, or as legal, tax or investment advisory advice or of any other kind. You must consult your own advisors
for any such advice.
2
Important Note Regarding Projections and Other Forward-Looking Statements
This presentation contains forward-looking statements, including projections, estimates, targets and goals, information regarding potential operational results and
descriptions of our business strategies, intentions and plans. Forward-looking statements may be identified by such words as “anticipate,” “believe,” “continue,” “could,”
“estimate,” “expect,” “intends,” “may,” “might,” “plan,” “possible,” “potential,” “predict,” “project,” “should,” “would” and other similar terms and expressions. Forward-
looking statements are not historical facts. They are based on expectations, beliefs, forecasts and projections, as well as on beliefs by our management team, that,
while made on a good faith basis, are inherently uncertain and beyond our control. Forward-looking statements that cover multiple future periods are, by their nature,
more uncertain and subject to factors that could cause them to differ materially from actual results. Any such expectations, beliefs, forecasts and projections are made
only as of the date of this presentation. We undertake no obligation to update any such information or any forward-looking statement made in this presentation after the
date hereof.
Forward-looking statements in this presentation may include, for example, statements about our capacity to complete the initial business combination, the benefits from
such initial business combination, our financial performance after the initial business combination, changes in our reserves and operational results and our expansion
opportunities and plans. Factors that could cause actual results to differ from any forward-looking statement include: (1) the occurrence of any event, change or other
circumstances that could delay the business combination; (2) the outcome of any legal proceedings that may be instituted against us following announcement of the
proposed initial business combination and transactions contemplated thereby; (3) the inability to complete the initial business combination due to the failure to obtain
approval of our stockholders; (4) the risk that the proposed initial business combination disrupts our current plans and operations as a result of the announcement and
consummation of the transactions described herein; (5) our ability to recognize the anticipated benefits of the initial business combination, which may be affected by,
among other things, competition and our ability to grow and manage growth profitably following the initial business combination; (6) costs related to the initial business
combination; (7) changes in applicable laws or regulations; (8) the possibility that we may be adversely affected by other economic, business, and/or competitive
factors; and (9) other additional risks and uncertainties, including the risk factors that we disclose in our filings with the CNBV and the Mexican Stock Exchange (Bolsa
Mexicana de Valores, or “BMV”). We encourage you to read all such filings.
Nothing in this presentation, and in particular, no projection or other forward-looking statement, should be construed as a guarantee of future performance,
or as a prediction of actual results. Actual results may differ materially from the projections or other forward-looking statements contained in this
presentation. Due to their inherently uncertain nature, you are cautioned not to rely on any such projections or forward-looking statements. We and our
affiliates, advisors, agents and other representatives expressly disclaim any liability to you in connection with any undue reliance on the information
contained in this presentation, and in particular with respect to any projections or other forward-looking statements.
January 2018 February 2018
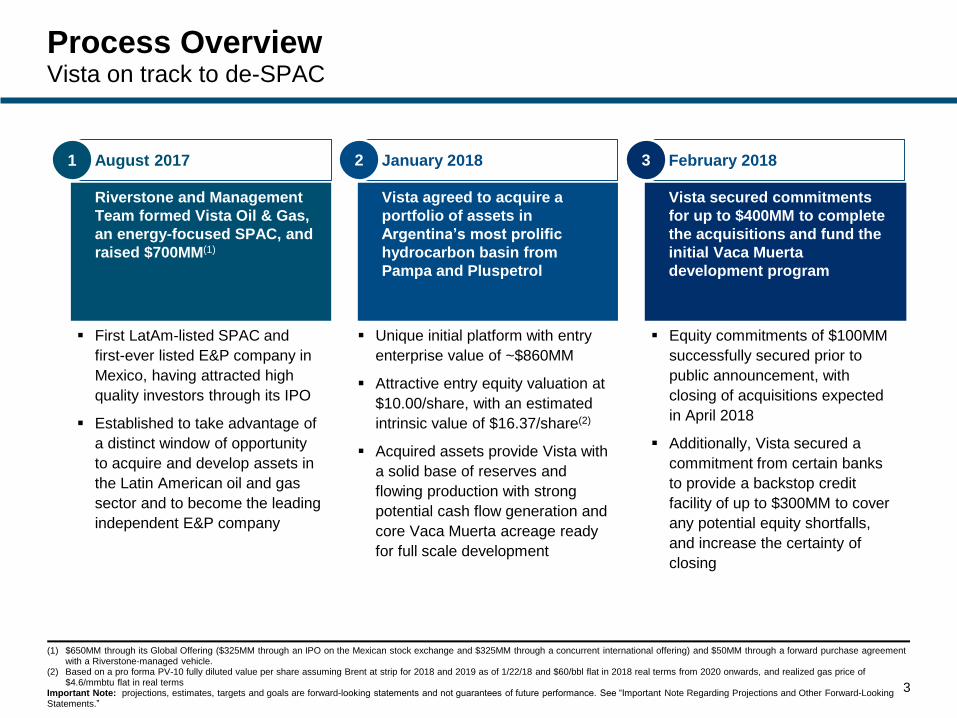
Process OverviewVista on track to de-SPAC
3
(1) $650MM through its Global Offering ($325MM through an IPO on the Mexican stock exchange and $325MM through a concurrent international offering) and $50MM through a forward purchase agreement with a Riverstone-managed vehicle.
(2) Based on a pro forma PV-10 fully diluted value per share assuming Brent at strip for 2018 and 2019 as of 1/22/18 and $60/bbl flat in 2018 real terms from 2020 onwards, and realized gas price of $4.6/mmbtu flat in real terms
Important Note: projections, estimates, targets and goals are forward-looking statements and not guarantees of future performance. See “Important Note Regarding Projections and Other Forward-Looking Statements.”
First LatAm-listed SPAC and
first-ever listed E&P company in
Mexico, having attracted high
quality investors through its IPO
Established to take advantage of
a distinct window of opportunity
to acquire and develop assets in
the Latin American oil and gas
sector and to become the leading
independent E&P company
Unique initial platform with entry
enterprise value of ~$860MM
Attractive entry equity valuation at
$10.00/share, with an estimated
intrinsic value of $16.37/share(2)
Acquired assets provide Vista with
a solid base of reserves and
flowing production with strong
potential cash flow generation and
core Vaca Muerta acreage ready
for full scale development
Equity commitments of $100MM
successfully secured prior to
public announcement, with
closing of acquisitions expected
in April 2018
Additionally, Vista secured a
commitment from certain banks
to provide a backstop credit
facility of up to $300MM to cover
any potential equity shortfalls,
and increase the certainty of
closing
Vista secured commitments
for up to $400MM to complete
the acquisitions and fund the
initial Vaca Muerta
development program
Vista agreed to acquire a
portfolio of assets in
Argentina’s most prolific
hydrocarbon basin from
Pampa and Pluspetrol
Riverstone and Management
Team formed Vista Oil & Gas,
an energy-focused SPAC, and
raised $700MM(1)
2 3August 2017 1
Neuquina Basin Blocks(7)
4
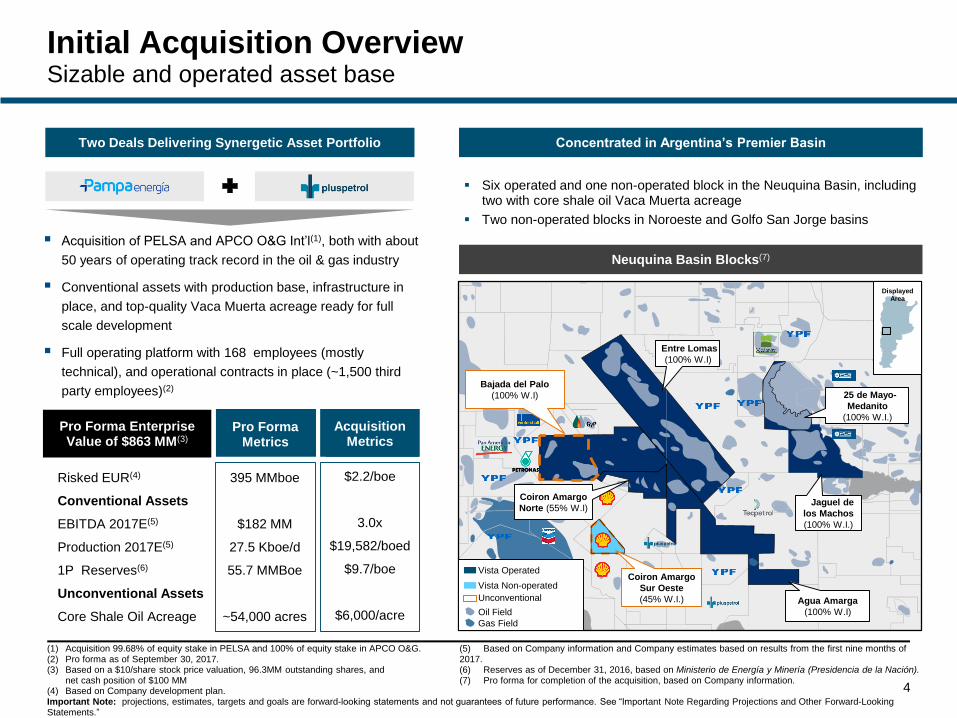
Initial Acquisition OverviewSizable and operated asset base
Two Deals Delivering Synergetic Asset Portfolio
Acquisition of PELSA and APCO O&G Int’l(1), both with about
50 years of operating track record in the oil & gas industry
Conventional assets with production base, infrastructure in
place, and top-quality Vaca Muerta acreage ready for full
scale development
Full operating platform with 168 employees (mostly
technical), and operational contracts in place (~1,500 third
party employees)(2)
(1) Acquisition 99.68% of equity stake in PELSA and 100% of equity stake in APCO O&G. (2) Pro forma as of September 30, 2017.(3) Based on a $10/share stock price valuation, 96.3MM outstanding shares, and
net cash position of $100 MM(4) Based on Company development plan.
Concentrated in Argentina’s Premier Basin
Six operated and one non-operated block in the Neuquina Basin, including two with core shale oil Vaca Muerta acreage
Two non-operated blocks in Noroeste and Golfo San Jorge basins
Entre Lomas
(100% W.I)
25 de Mayo-
Medanito
(100% W.I.)
Jaguel de
los Machos
(100% W.I.)
Agua Amarga
(100% W.I)
Coiron Amargo
Sur Oeste
(45% W.I.)
DisplayedArea
DisplayedArea
Unconventional
Oil Field
Gas Field
Vista Non-operated
Vista Operated
Coiron Amargo
Norte (55% W.I)
Bajada del Palo
(100% W.I)
Pro Forma Metrics
AcquisitionMetric
AcquisitionMetrics
Risked EUR(4)
Conventional Assets
EBITDA 2017E(5)
Production 2017E(5)
1P Reserves(6)
Unconventional Assets
Core Shale Oil Acreage
395 MMboe
$182 MM
27.5 Kboe/d
55.7 MMBoe
~54,000 acres
$2.2/boe
3.0x
$19,582/boed
$9.7/boe
$6,000/acre
Pro Forma Enterprise Value of $863 MM(3)
(5) Based on Company information and Company estimates based on results from the first nine months of 2017.(6) Reserves as of December 31, 2016, based on Ministerio de Energía y Minería (Presidencia de la Nación).(7) Pro forma for completion of the acquisition, based on Company information.
Important Note: projections, estimates, targets and goals are forward-looking statements and not guarantees of future performance. See “Important Note Regarding Projections and Other Forward-Looking Statements.”
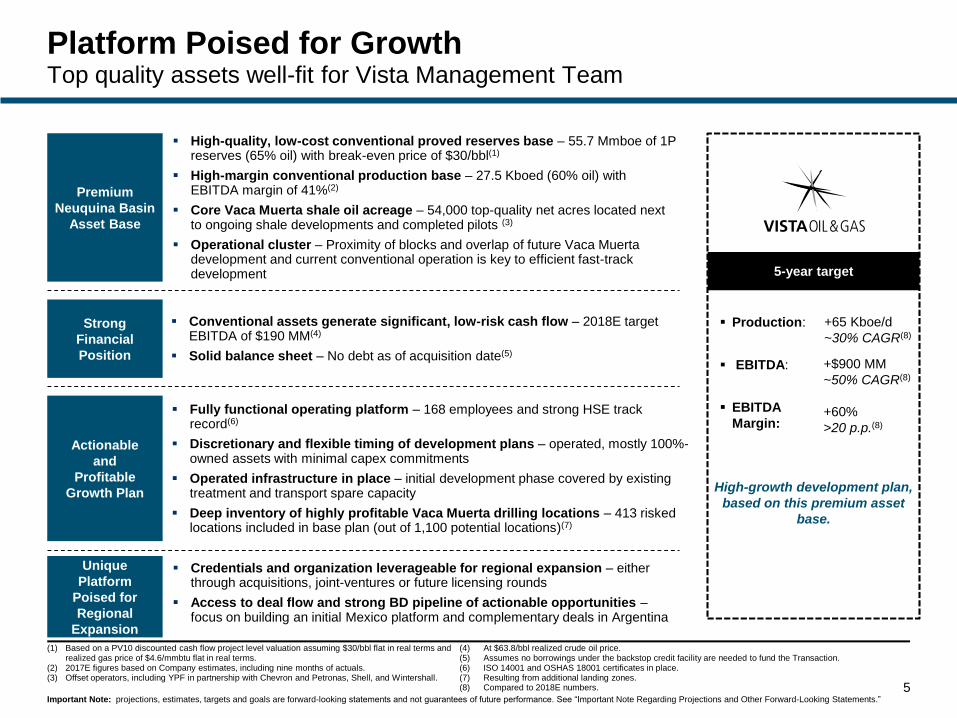
Conventional assets generate significant, low-risk cash flow – 2018E target EBITDA of $190 MM(4)
Solid balance sheet – No debt as of acquisition date(5)
Strong
Financial
Position
Platform Poised for GrowthTop quality assets well-fit for Vista Management Team
Premium
Neuquina Basin
Asset Base
Unique
Platform
Poised for
Regional
Expansion
High-quality, low-cost conventional proved reserves base – 55.7 Mmboe of 1P reserves (65% oil) with break-even price of $30/bbl(1)
High-margin conventional production base – 27.5 Kboed (60% oil) with EBITDA margin of 41%(2)
Core Vaca Muerta shale oil acreage – 54,000 top-quality net acres located next to ongoing shale developments and completed pilots (3)
Operational cluster – Proximity of blocks and overlap of future Vaca Muerta development and current conventional operation is key to efficient fast-track development
Actionable
and
Profitable
Growth Plan
Fully functional operating platform – 168 employees and strong HSE track record(6)
Discretionary and flexible timing of development plans – operated, mostly 100%-owned assets with minimal capex commitments
Operated infrastructure in place – initial development phase covered by existing treatment and transport spare capacity
Deep inventory of highly profitable Vaca Muerta drilling locations – 413 risked locations included in base plan (out of 1,100 potential locations)(7)
Credentials and organization leverageable for regional expansion – either through acquisitions, joint-ventures or future licensing rounds
Access to deal flow and strong BD pipeline of actionable opportunities –focus on building an initial Mexico platform and complementary deals in Argentina
5
(1) Based on a PV10 discounted cash flow project level valuation assuming $30/bbl flat in real terms and realized gas price of $4.6/mmbtu flat in real terms.
(2) 2017E figures based on Company estimates, including nine months of actuals.(3) Offset operators, including YPF in partnership with Chevron and Petronas, Shell, and Wintershall.
(4) At $63.8/bbl realized crude oil price.(5) Assumes no borrowings under the backstop credit facility are needed to fund the Transaction.(6) ISO 14001 and OSHAS 18001 certificates in place.(7) Resulting from additional landing zones. (8) Compared to 2018E numbers.
Important Note: projections, estimates, targets and goals are forward-looking statements and not guarantees of future performance. See “Important Note Regarding Projections and Other Forward-Looking Statements.”
Production:
EBITDA:
EBITDA
Margin:
High-growth development plan,
based on this premium asset
base.
5-year target
+$900 MM
~50% CAGR(8)
+60%
>20 p.p.(8)
+65 Kboe/d
~30% CAGR(8)
6
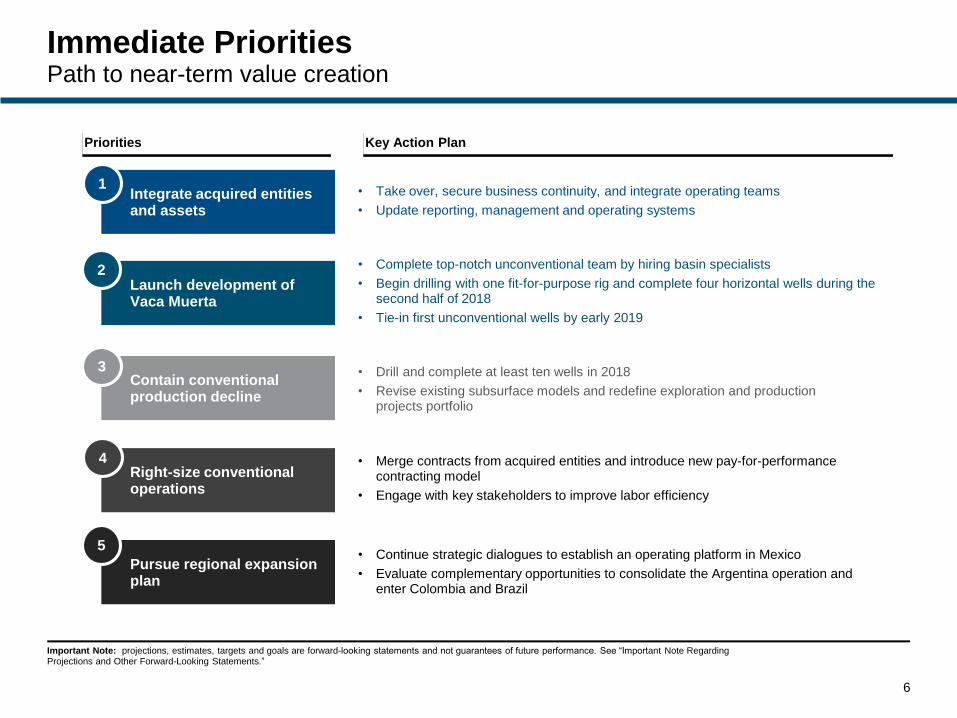
Immediate PrioritiesPath to near-term value creation
Launch development of Vaca Muerta
2 • Complete top-notch unconventional team by hiring basin specialists
• Begin drilling with one fit-for-purpose rig and complete four horizontal wells during the second half of 2018
• Tie-in first unconventional wells by early 2019
Integrate acquired entities and assets
1• Take over, secure business continuity, and integrate operating teams
• Update reporting, management and operating systems
Right-size conventional operations
4 • Merge contracts from acquired entities and introduce new pay-for-performance contracting model
• Engage with key stakeholders to improve labor efficiency
• Drill and complete at least ten wells in 2018
• Revise existing subsurface models and redefine exploration and production projects portfolio
Contain conventional production decline
3
Pursue regional expansion plan
5• Continue strategic dialogues to establish an operating platform in Mexico
• Evaluate complementary opportunities to consolidate the Argentina operation and enter Colombia and Brazil
Priorities Key Action Plan
Important Note: projections, estimates, targets and goals are forward-looking statements and not guarantees of future performance. See “Important Note Regarding Projections and Other Forward-Looking Statements.”

60%
64%
68%
40%
36%
24% 8%
7
Conventional Assets OverviewHigh-quality oil-prone production cluster
Net Metric Entre Lomas Agua Amarga Jagüel Medanito CAN Bajada del Palo CASO Total
W.I. (%)(1) 100% 100% 100% 100% 55% 100% 45% -
1P Reserves(1)
(MMBoe)20.5 2.5 6.9 10.1 1.0 13.5 0.0 55.7(4)
Acreage(1) 183,472 92,415 47,937 31,135 54,797 120,832 7,398 537,986
2017E Production(1)
(kboe/d)10.1 1.4 4.0 5.0 0.3 6.3 0.0 27.5(4)
Concession Term(1)(2) 2026 2034 / 2040 2025 2026 2038 2026(3) 2018(3) -
Blocks withunconventional potential
■ Clustered acreage position in the Neuquina Basin covering ~538k acres in
the Provinces of Neuquén and Río Negro
■ Oil and gas production from well-understood reservoirs through primary
and secondary recovery; ~680 active producing wells and more than 190
injector wells
■ Multiple infill drilling and waterflood projects identified; current recovery
factor below 15%
■ Light crude oil production (Medanito type API >31°); sold to domestic of
takers at ~2% discount to Brent
■ Gas production sold to industrial clients (80%), power plants (15%) and
residential clients (5%) at an average market price of approximately
$4.6/Mmbtu
■ Treatment and evacuation infrastructure in place with spare capacity
■ Exploratory upside in the tight gas reservoirs of the Cuyo, Lotena, and Los
Molles formations
Asset Overview(1)
(1) Based on Company information and Ministerio de Energía y Minería (Presidencia de la Nación).(2) 10-year extension of conventional concessions available under Federal Hydrocarbon Law (with royalties increasing from 15% to 18%).(3) 35-year new unconventional concession available under Federal Hydrocarbon Law (with 12% flat royalties).(4) Includes reserves and production from Acambuco.Important Note: projections, estimates, targets and goals are forward-looking statements and not guarantees of future performance. See “Important Note Regarding Projections and Other Forward-Looking Statements.”
Asset Profile(4)
1P Reserves
55.7 MMboe
3P Reserves
82.6 MMboe
Production
27.5 Kboe/d
P2P1 P3
Oil Gas
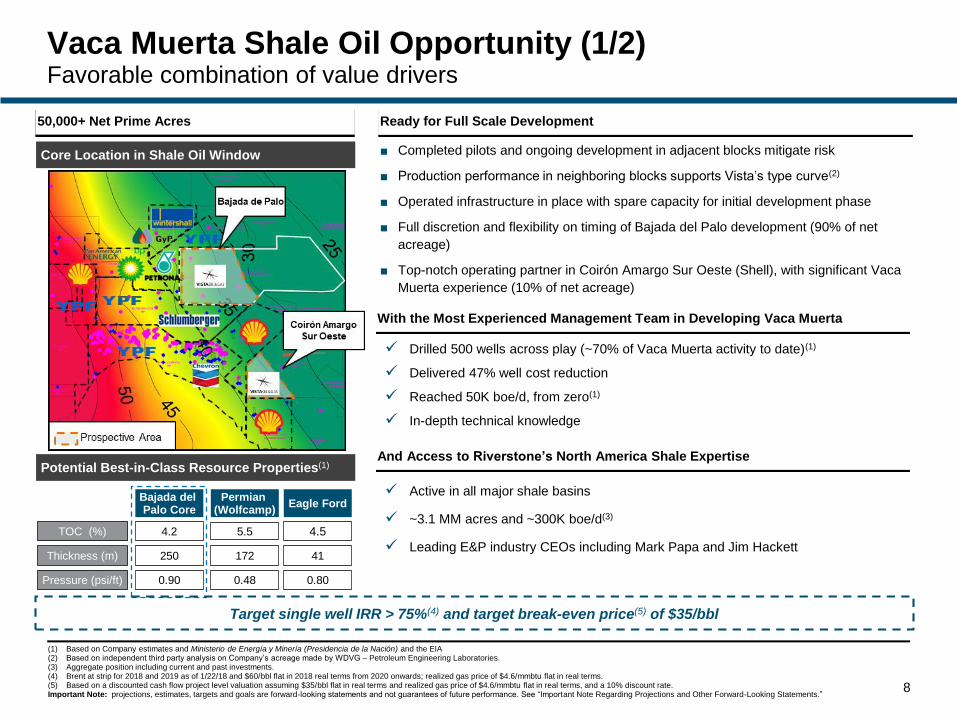
Permian (Wolfcamp)
Eagle FordBajada del Palo Core
TOC (%) 5.5 4.54.2
Thickness (m) 172 41250
Pressure (psi/ft) 0.48 0.800.90
Drilled 500 wells across play (~70% of Vaca Muerta activity to date)(1)
Delivered 47% well cost reduction
Reached 50K boe/d, from zero(1)
In-depth technical knowledge
Vaca Muerta Shale Oil Opportunity (1/2)Favorable combination of value drivers
(1) Based on Company estimates and Ministerio de Energía y Minería (Presidencia de la Nación) and the EIA(2) Based on independent third party analysis on Company’s acreage made by WDVG – Petroleum Engineering Laboratories.(3) Aggregate position including current and past investments.(4) Brent at strip for 2018 and 2019 as of 1/22/18 and $60/bbl flat in 2018 real terms from 2020 onwards; realized gas price of $4.6/mmbtu flat in real terms.(5) Based on a discounted cash flow project level valuation assuming $35/bbl flat in real terms and realized gas price of $4.6/mmbtu flat in real terms, and a 10% discount rate.Important Note: projections, estimates, targets and goals are forward-looking statements and not guarantees of future performance. See “Important Note Regarding Projections and Other Forward-Looking Statements.”
■ Completed pilots and ongoing development in adjacent blocks mitigate risk
■ Production performance in neighboring blocks supports Vista’s type curve(2)
■ Operated infrastructure in place with spare capacity for initial development phase
■ Full discretion and flexibility on timing of Bajada del Palo development (90% of net
acreage)
■ Top-notch operating partner in Coirón Amargo Sur Oeste (Shell), with significant Vaca
Muerta experience (10% of net acreage)
50,000+ Net Prime Acres
8
Target single well IRR > 75%(4) and target break-even price(5) of $35/bbl
And Access to Riverstone’s North America Shale Expertise
Active in all major shale basins
~3.1 MM acres and ~300K boe/d(3)
Leading E&P industry CEOs including Mark Papa and Jim Hackett
With the Most Experienced Management Team in Developing Vaca Muerta
Ready for Full Scale Development
Core Location in Shale Oil Window
Potential Best-in-Class Resource Properties(1)
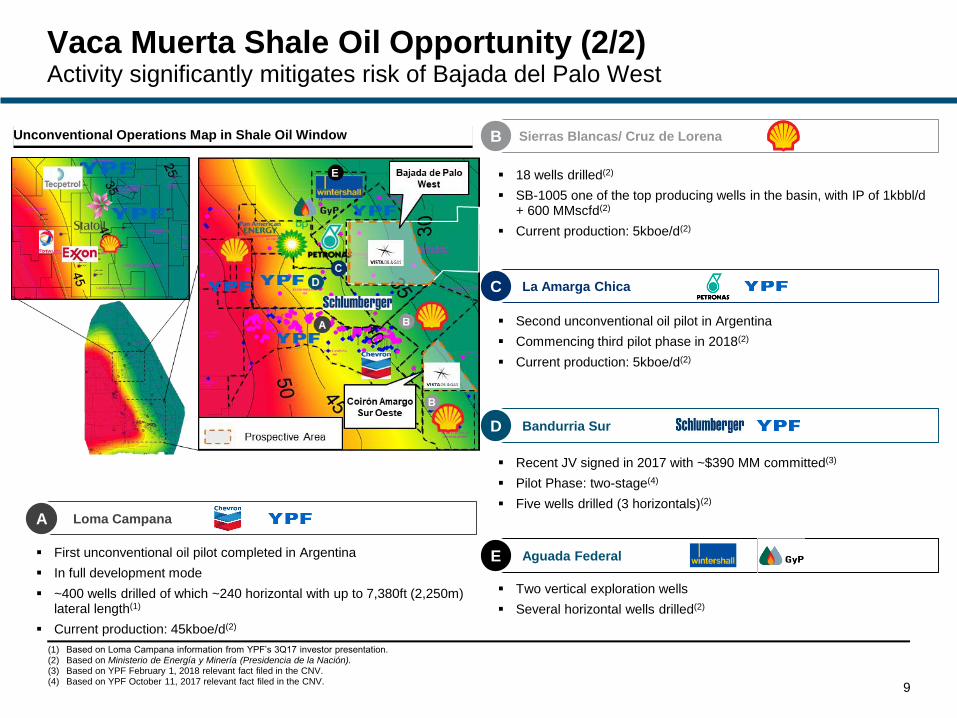
Vaca Muerta Shale Oil Opportunity (2/2)Activity significantly mitigates risk of Bajada del Palo West
9
Loma CampanaA
First unconventional oil pilot completed in Argentina
In full development mode
~400 wells drilled of which ~240 horizontal with up to 7,380ft (2,250m) lateral length(1)
Current production: 45kboe/d(2)
Unconventional Operations Map in Shale Oil Window Sierras Blancas/ Cruz de Lorena de LorenaB
18 wells drilled(2)
SB-1005 one of the top producing wells in the basin, with IP of 1kbbl/d + 600 MMscfd(2)
Current production: 5kboe/d(2)
La Amarga ChicaC
Second unconventional oil pilot in Argentina
Commencing third pilot phase in 2018(2)
Current production: 5kboe/d(2)
Bandurria SurD
Recent JV signed in 2017 with ~$390 MM committed(3)
Pilot Phase: two-stage(4)
Five wells drilled (3 horizontals)(2)
Aguada FederalE
Two vertical exploration wells
Several horizontal wells drilled(2)
(1) Based on Loma Campana information from YPF’s 3Q17 investor presentation.(2) Based on Ministerio de Energía y Minería (Presidencia de la Nación).(3) Based on YPF February 1, 2018 relevant fact filed in the CNV.(4) Based on YPF October 11, 2017 relevant fact filed in the CNV.
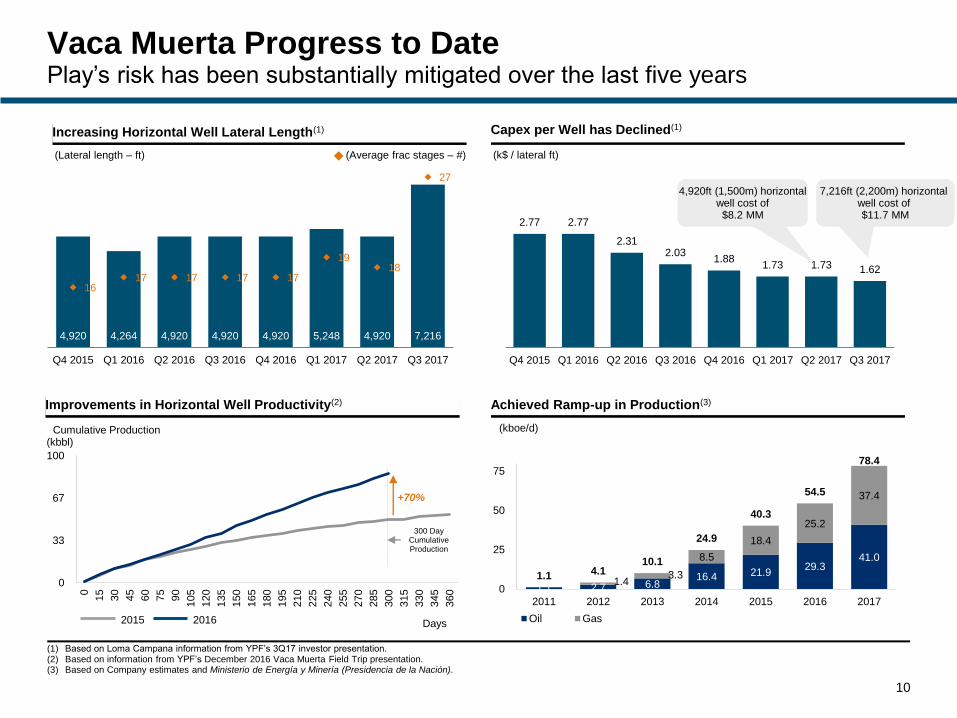
4,920 4,264 4,920 4,920 4,920 5,248 4,920 7,216
1617 17 17 17
1918
27
Q4 2015 Q1 2016 Q2 2016 Q3 2016 Q4 2016 Q1 2017 Q2 2017 Q3 2017
2.77 2.77
2.312.03
1.881.73 1.73 1.62
Q4 2015 Q1 2016 Q2 2016 Q3 2016 Q4 2016 Q1 2017 Q2 2017 Q3 2017
Achieved Ramp-up in Production(3)
10
1.1 2.7 6.816.4 21.9
29.341.0
1.43.3
8.5
18.4
25.2
37.4
1.1 4.110.1
24.9
40.3
54.5
78.4
0
25
50
75
2011 2012 2013 2014 2015 2016 2017
Oil Gas
(kboe/d)
(kbbl)
Days
300 DayCumulative Production
Improvements in Horizontal Well Productivity(2)
0
33
67
100
0
15
30
45
60
75
90
105
120
135
150
165
180
195
210
225
240
255
270
285
300
315
330
345
360
2015 2016
+70%
(1) Based on Loma Campana information from YPF’s 3Q17 investor presentation.(2) Based on information from YPF’s December 2016 Vaca Muerta Field Trip presentation.(3) Based on Company estimates and Ministerio de Energía y Minería (Presidencia de la Nación).
Cumulative Production
Increasing Horizontal Well Lateral Length(1) Capex per Well has Declined(1)
(Lateral length – ft)
Vaca Muerta Progress to DatePlay’s risk has been substantially mitigated over the last five years
4,920ft (1,500m) horizontalwell cost of $8.2 MM
7,216ft (2,200m) horizontal well cost of $11.7 MM
(k$ / lateral ft)(Average frac stages – #)
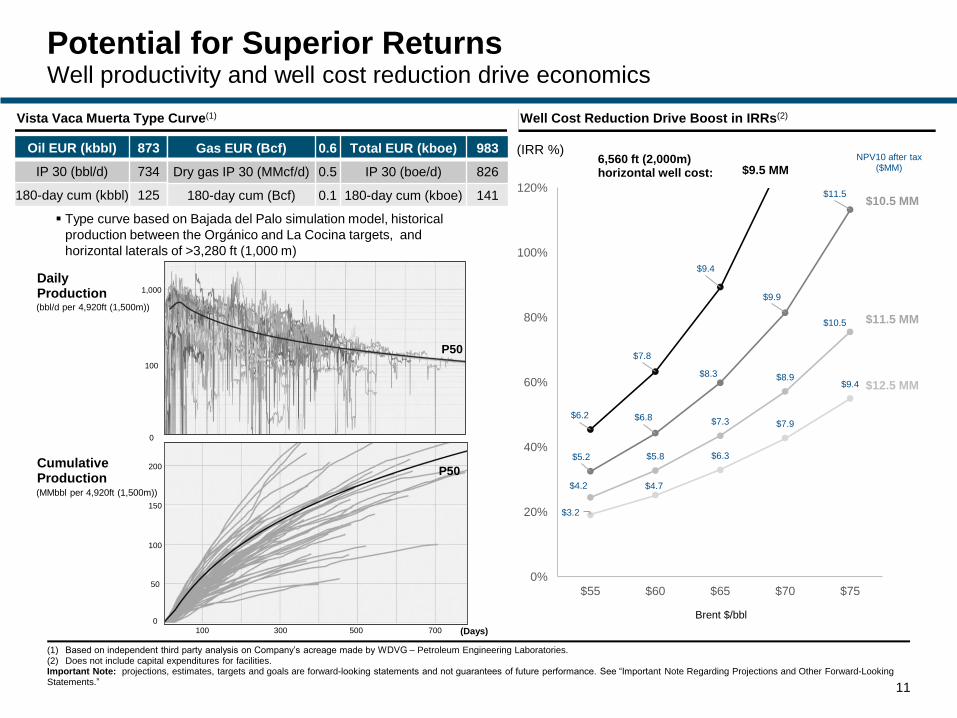
$6.2
$7.8
$9.4
$5.2
$6.8
$8.3
$9.9
$11.5
$4.2
$5.8
$7.3
$8.9
$10.5
$3.2
$4.7
$6.3
$7.9
$9.4
0%
20%
40%
60%
80%
100%
120%
$55 $60 $65 $70 $75
11
Vista Vaca Muerta Type Curve(1)
Oil EUR (kbbl) 873
IP 30 (bbl/d) 734
180-day cum (kbbl) 125
Gas EUR (Bcf) 0.6 Total EUR (kboe) 983
Dry gas IP 30 (MMcf/d) 0.5 IP 30 (boe/d) 826
180-day cum (Bcf) 0.1 180-day cum (kboe) 141
Well Cost Reduction Drive Boost in IRRs(2)
(1) Based on independent third party analysis on Company’s acreage made by WDVG – Petroleum Engineering Laboratories.(2) Does not include capital expenditures for facilities.Important Note: projections, estimates, targets and goals are forward-looking statements and not guarantees of future performance. See “Important Note Regarding Projections and Other Forward-Looking Statements.”
Brent $/bbl
1,000
100
(bbl/d per 4,920ft (1,500m))
0
150
50
100
(MMbbl per 4,920ft (1,500m))
Type curve based on Bajada del Palo simulation model, historical
production between the Orgánico and La Cocina targets, and
horizontal laterals of >3,280 ft (1,000 m)
0
200
100 300 500 700 (Days)
Daily Production
CumulativeProduction
$12.5 MM
$10.5 MM
$9.5 MM
Potential for Superior ReturnsWell productivity and well cost reduction drive economics
$11.5 MM
(IRR %)NPV10 after tax
($MM)
P50
P50
6,560 ft (2,000m) horizontal well cost:
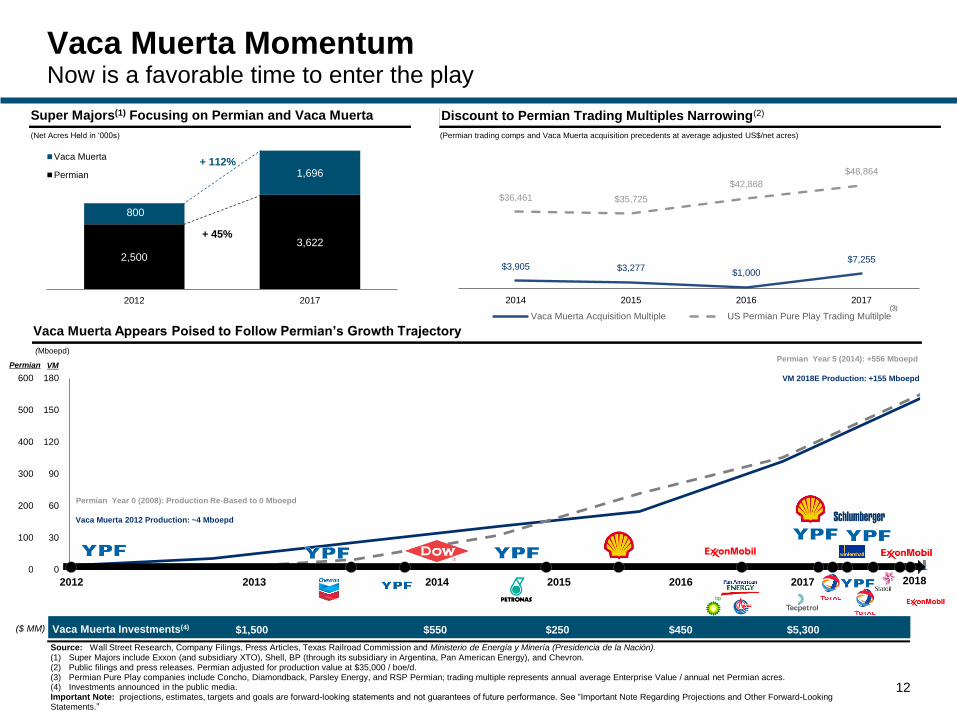
Vaca Muerta Appears Poised to Follow Permian’s Growth Trajectory
$3,905 $3,277$1,000
$7,255
$36,461 $35,725
$42,868
$48,864
2014 2015 2016 2017
Vaca Muerta Acquisition Multiple US Permian Pure Play Trading Multilple
2,500
3,622
800
1,696
2012 2017
Vaca Muerta
Permian
0
100
200
300
400
500
600
0
30
60
90
120
150
180
12
Vaca Muerta MomentumNow is a favorable time to enter the play
2012 20182013 2014 2015 2016 2017
Vaca Muerta 2012 Production: ~4 Mboepd
Permian Year 0 (2008): Production Re-Based to 0 Mboepd
Discount to Permian Trading Multiples Narrowing(2)
(Permian trading comps and Vaca Muerta acquisition precedents at average adjusted US$/net acres)
Super Majors(1) Focusing on Permian and Vaca Muerta
(Mboepd)
(Net Acres Held in ‘000s)
Source: Wall Street Research, Company Filings, Press Articles, Texas Railroad Commission and Ministerio de Energía y Minería (Presidencia de la Nación).(1) Super Majors include Exxon (and subsidiary XTO), Shell, BP (through its subsidiary in Argentina, Pan American Energy), and Chevron.(2) Public filings and press releases. Permian adjusted for production value at $35,000 / boe/d. (3) Permian Pure Play companies include Concho, Diamondback, Parsley Energy, and RSP Permian; trading multiple represents annual average Enterprise Value / annual net Permian acres.(4) Investments announced in the public media.Important Note: projections, estimates, targets and goals are forward-looking statements and not guarantees of future performance. See “Important Note Regarding Projections and Other Forward-Looking Statements.”
($ MM) $1,500 $5,300Vaca Muerta Investments(4) $250$550 $450
+ 112%
+ 45%
(3)
Permian VMPermian Year 5 (2014): +556 Mboepd
VM 2018E Production: +155 Mboepd
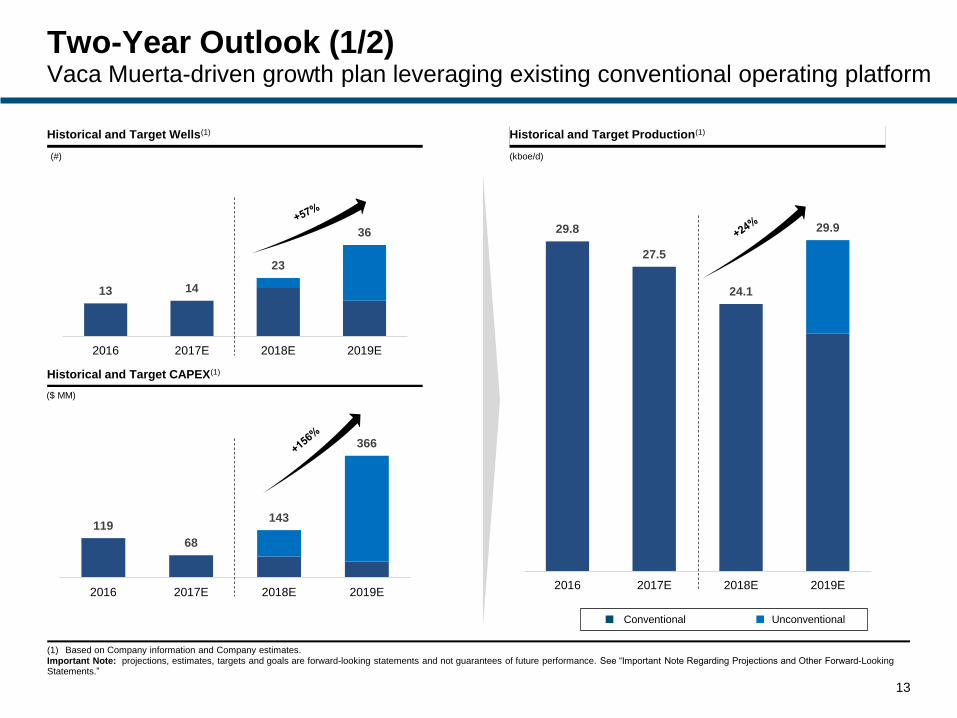
29.8
27.5
24.1
29.9
2016 2017E 2018E 2019E
119
68
143
366
2016 2017E 2018E 2019E
13 14
23
36
2016 2017E 2018E 2019E
Two-Year Outlook (1/2)Vaca Muerta-driven growth plan leveraging existing conventional operating platform
13
UnconventionalConventional
Increased Drilling Activity…Historical and Target Wells(1)
(#)
Historical and Target CAPEX(1)
($ MM)
Historical and Target Production(1)
(kboe/d)
(1) Based on Company information and Company estimates. Important Note: projections, estimates, targets and goals are forward-looking statements and not guarantees of future performance. See “Important Note Regarding Projections and Other Forward-Looking Statements.”
575
445 445
583
2016 2017E 2018E 2019E
111 108
240
182 190
288
42% 41% 43%49%
2016 2017E 2018E 2019E
199
169152
165
18.316.8 17.3
15.1
2016 2017E 2018E 2019E
ConsolidatedUnconventional
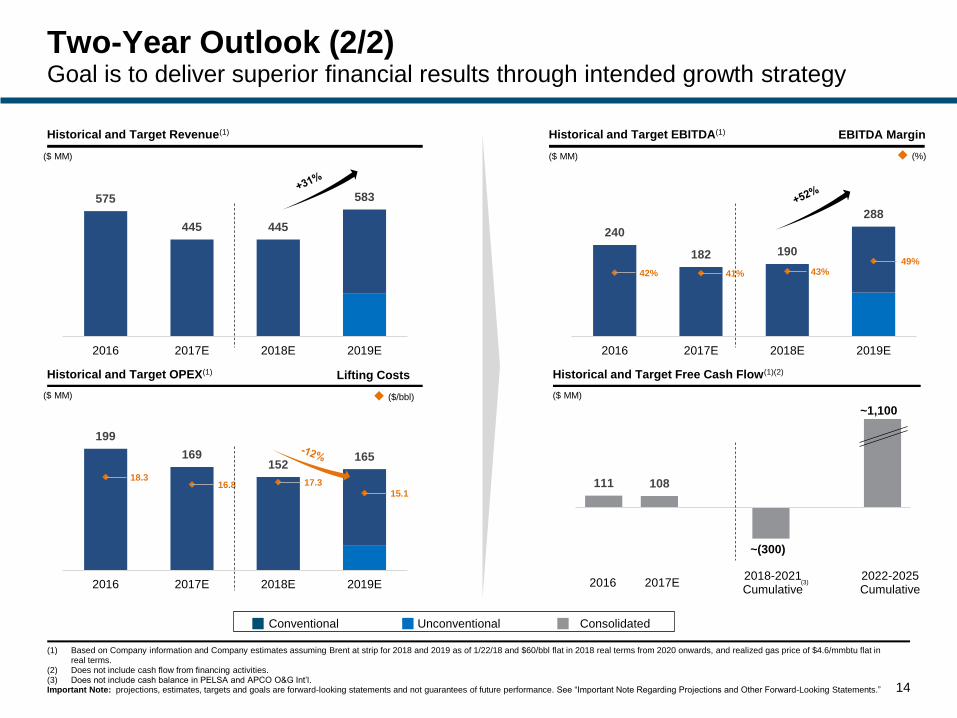
Two-Year Outlook (2/2)Goal is to deliver superior financial results through intended growth strategy
(1) Based on Company information and Company estimates assuming Brent at strip for 2018 and 2019 as of 1/22/18 and $60/bbl flat in 2018 real terms from 2020 onwards, and realized gas price of $4.6/mmbtu flat in real terms.
(2) Does not include cash flow from financing activities.(3) Does not include cash balance in PELSA and APCO O&G Int’l.Important Note: projections, estimates, targets and goals are forward-looking statements and not guarantees of future performance. See “Important Note Regarding Projections and Other Forward-Looking Statements.”
Historical and Target Revenue(1)
($ MM)
Historical and Target Free Cash Flow(1)(2)
($ MM)
Historical and Target EBITDA(1)
Historical and Target OPEX(1)
($ MM)
Conventional
($ MM)
~1,100
20162018-2021Cumulative
2022-2025Cumulative
2017E
($/bbl)
(%)
Lifting Costs
EBITDA Margin
(3)
14
~(300)
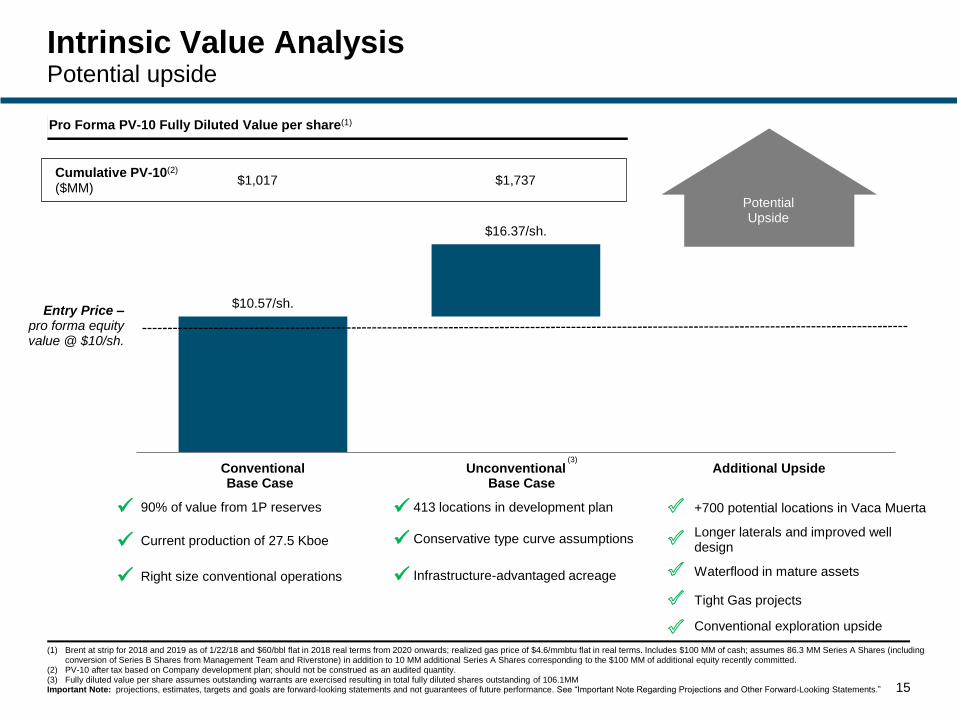
$10.57/sh.
$16.37/sh.
Conventional Unconventional Additional Upside
Intrinsic Value AnalysisPotential upside
15
Pro Forma PV-10 Fully Diluted Value per share(1)
($MM)Cumulative PV-10(2)
$1,017 $1,737
Entry Price –pro forma equity value @ $10/sh.
(1) Brent at strip for 2018 and 2019 as of 1/22/18 and $60/bbl flat in 2018 real terms from 2020 onwards; realized gas price of $4.6/mmbtu flat in real terms. Includes $100 MM of cash; assumes 86.3 MM Series A Shares (including conversion of Series B Shares from Management Team and Riverstone) in addition to 10 MM additional Series A Shares corresponding to the $100 MM of additional equity recently committed.
(2) PV-10 after tax based on Company development plan; should not be construed as an audited quantity.(3) Fully diluted value per share assumes outstanding warrants are exercised resulting in total fully diluted shares outstanding of 106.1MMImportant Note: projections, estimates, targets and goals are forward-looking statements and not guarantees of future performance. See “Important Note Regarding Projections and Other Forward-Looking Statements.”
Base Case
(3)
90% of value from 1P reserves
Current production of 27.5 Kboe
Right size conventional operations
413 locations in development plan
Conservative type curve assumptions
Infrastructure-advantaged acreage
+700 potential locations in Vaca Muerta
Longer laterals and improved well design
Waterflood in mature assets
Upside Potential
Tight Gas projects
Conventional exploration upside
Base Case
Potential Upside
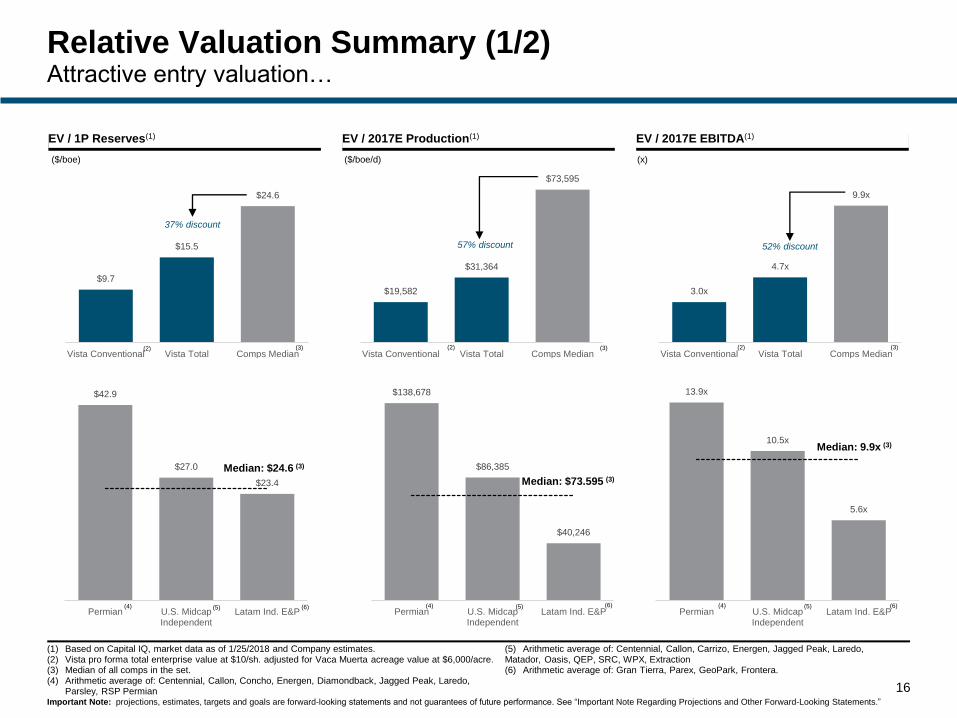
$19,582
$31,364
$73,595
Vista Conventional Vista Total Comps Median
$138,678
$86,385
$40,246
Permian U.S. MidcapIndependent
Latam Ind. E&P
3.0x
4.7x
9.9x
Vista Conventional Vista Total Comps Median
$9.7
$15.5
$24.6
Vista Conventional Vista Total Comps Median
13.9x
10.5x
5.6x
Permian U.S. MidcapIndependent
Latam Ind. E&P
$42.9
$27.0
$23.4
Permian U.S. MidcapIndependent
Latam Ind. E&P
Relative Valuation Summary (1/2)Attractive entry valuation…
16
EV / 1P Reserves(1) EV / 2017E Production(1) EV / 2017E EBITDA(1)
Median: $24.6 (3)
Median: $73.595 (3)
Median: 9.9x (3)
(1) Based on Capital IQ, market data as of 1/25/2018 and Company estimates.(2) Vista pro forma total enterprise value at $10/sh. adjusted for Vaca Muerta acreage value at $6,000/acre.(3) Median of all comps in the set.(4) Arithmetic average of: Centennial, Callon, Concho, Energen, Diamondback, Jagged Peak, Laredo,
Parsley, RSP Permian
(5) Arithmetic average of: Centennial, Callon, Carrizo, Energen, Jagged Peak, Laredo, Matador, Oasis, QEP, SRC, WPX, Extraction(6) Arithmetic average of: Gran Tierra, Parex, GeoPark, Frontera.
37% discount
57% discount 52% discount
(4) (5) (6)
(2) (2) (2)
($/boe) ($/boe/d) (x)
(3) (3) (3)
(4) (5) (6) (4) (5) (6)
Important Note: projections, estimates, targets and goals are forward-looking statements and not guarantees of future performance. See “Important Note Regarding Projections and Other Forward-Looking Statements.”
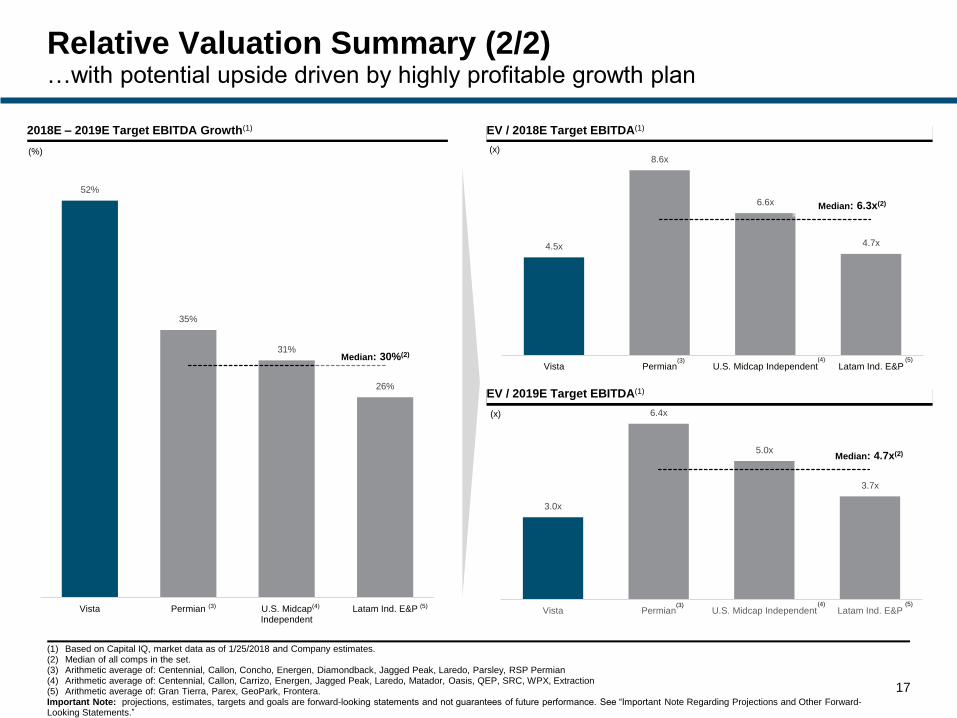
3.0x
6.4x
5.0x
3.7x
Vista Permian U.S. Midcap Independent Latam Ind. E&P
52%
35%
31%
26%
Vista Permian U.S. MidcapIndependent
Latam Ind. E&P
4.5x
8.6x
6.6x
4.7x
Vista Permian U.S. Midcap Independent Latam Ind. E&P
17
Relative Valuation Summary (2/2)…with potential upside driven by highly profitable growth plan
2018E – 2019E Target EBITDA Growth(1)
EV / 2019E Target EBITDA(1)
EV / 2018E Target EBITDA(1)
Median: 30%(2)
(%)
(x)
(x)
(1) Based on Capital IQ, market data as of 1/25/2018 and Company estimates.(2) Median of all comps in the set.(3) Arithmetic average of: Centennial, Callon, Concho, Energen, Diamondback, Jagged Peak, Laredo, Parsley, RSP Permian(4) Arithmetic average of: Centennial, Callon, Carrizo, Energen, Jagged Peak, Laredo, Matador, Oasis, QEP, SRC, WPX, Extraction(5) Arithmetic average of: Gran Tierra, Parex, GeoPark, Frontera.Important Note: projections, estimates, targets and goals are forward-looking statements and not guarantees of future performance. See “Important Note Regarding Projections and Other Forward-Looking Statements.”
Median: 6.3x(2)
Median: 4.7x(2)
(3) (4) (5)
(3) (4) (5)
(3) (4) (5)
18
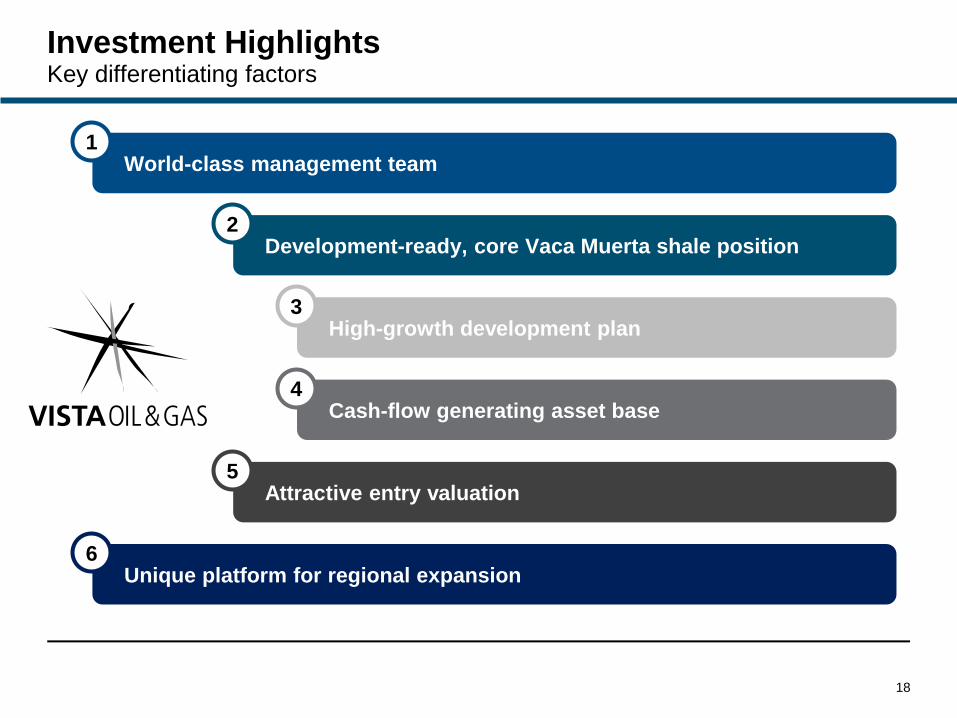
Investment HighlightsKey differentiating factors
World-class management team1
Development-ready, core Vaca Muerta shale position2
High-growth development plan3
Attractive entry valuation 5
Unique platform for regional expansion6
Cash-flow generating asset base4
19
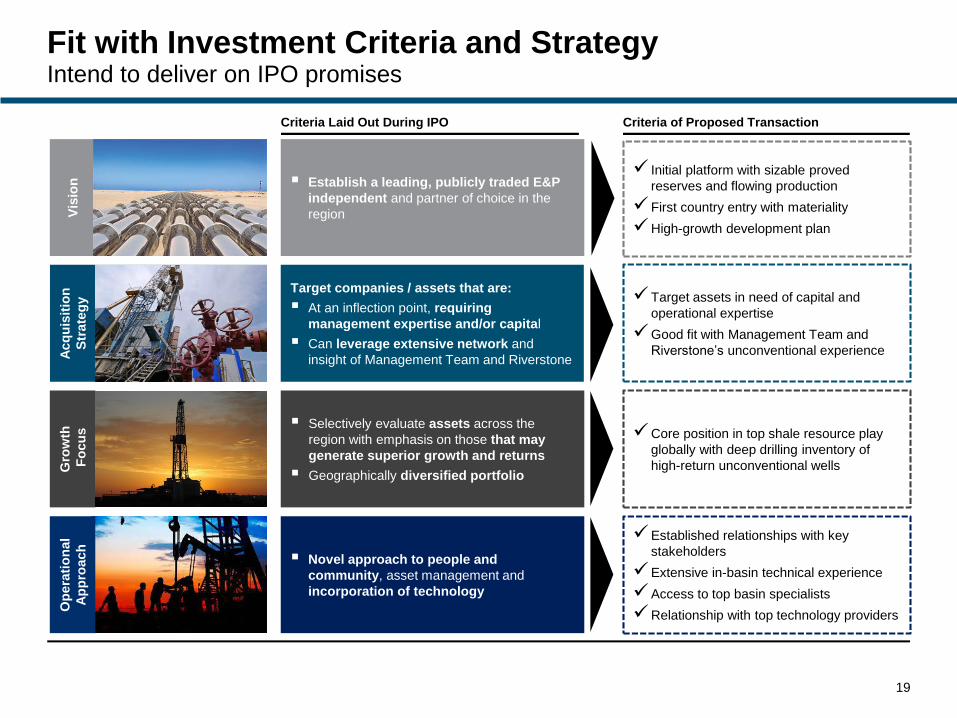
Fit with Investment Criteria and StrategyIntend to deliver on IPO promises
Vis
ion Establish a leading, publicly traded E&P
independent and partner of choice in the
region
Initial platform with sizable proved
reserves and flowing production
First country entry with materiality
High-growth development plan
Acq
uis
itio
n
Str
ate
gy
Target companies / assets that are:
At an inflection point, requiring
management expertise and/or capital
Can leverage extensive network and
insight of Management Team and Riverstone
Target assets in need of capital and
operational expertise
Good fit with Management Team and
Riverstone’s unconventional experience
Criteria Laid Out During IPO Criteria of Proposed Transaction
Selectively evaluate assets across the
region with emphasis on those that may
generate superior growth and returns
Geographically diversified portfolio
Core position in top shale resource play
globally with deep drilling inventory of
high-return unconventional wells
Established relationships with key
stakeholders
Extensive in-basin technical experience
Access to top basin specialists
Relationship with top technology providers
Novel approach to people and
community, asset management and
incorporation of technology
Op
era
tio
nal
Ap
pro
ach
Gro
wth
Fo
cu
s
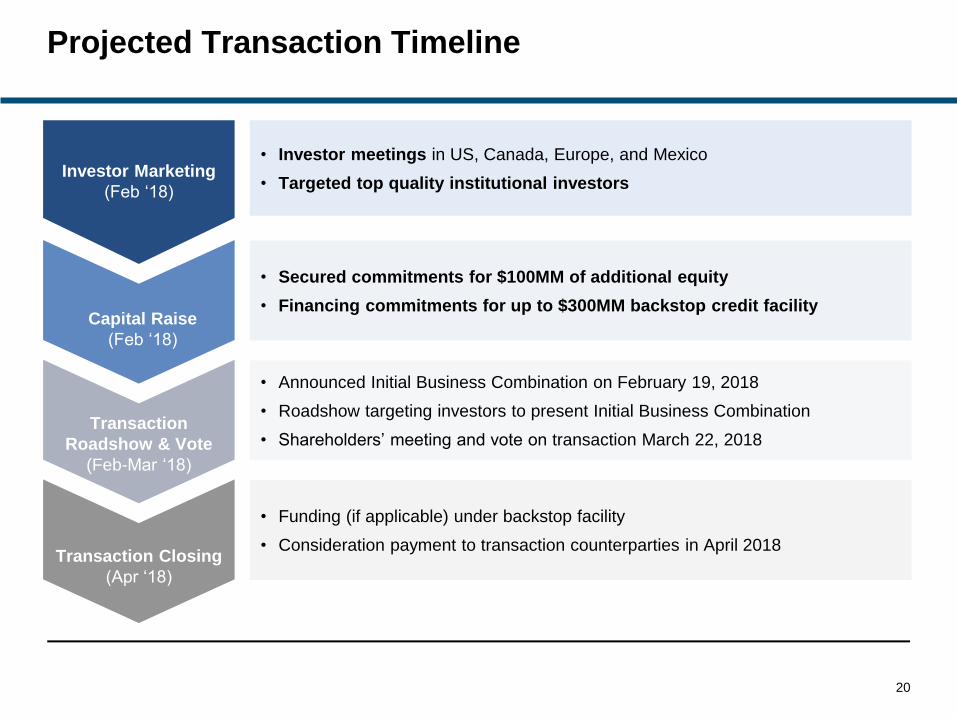
Projected Transaction Timeline
20
• Investor meetings in US, Canada, Europe, and Mexico
• Targeted top quality institutional investors
• Secured commitments for $100MM of additional equity
• Financing commitments for up to $300MM backstop credit facility
• Announced Initial Business Combination on February 19, 2018
• Roadshow targeting investors to present Initial Business Combination
• Shareholders’ meeting and vote on transaction March 22, 2018
• Funding (if applicable) under backstop facility
• Consideration payment to transaction counterparties in April 2018
Investor Marketing
(Feb ‘18)
Capital Raise
(Feb ‘18)
Transaction
Roadshow & Vote
(Feb-Mar ‘18)
Transaction Closing
(Apr ‘18)
21
Appendix Agenda
Portfolio Overview1
Transaction Summary2
Management Team4
Argentina Macro5
Pro Forma Historical Financials3
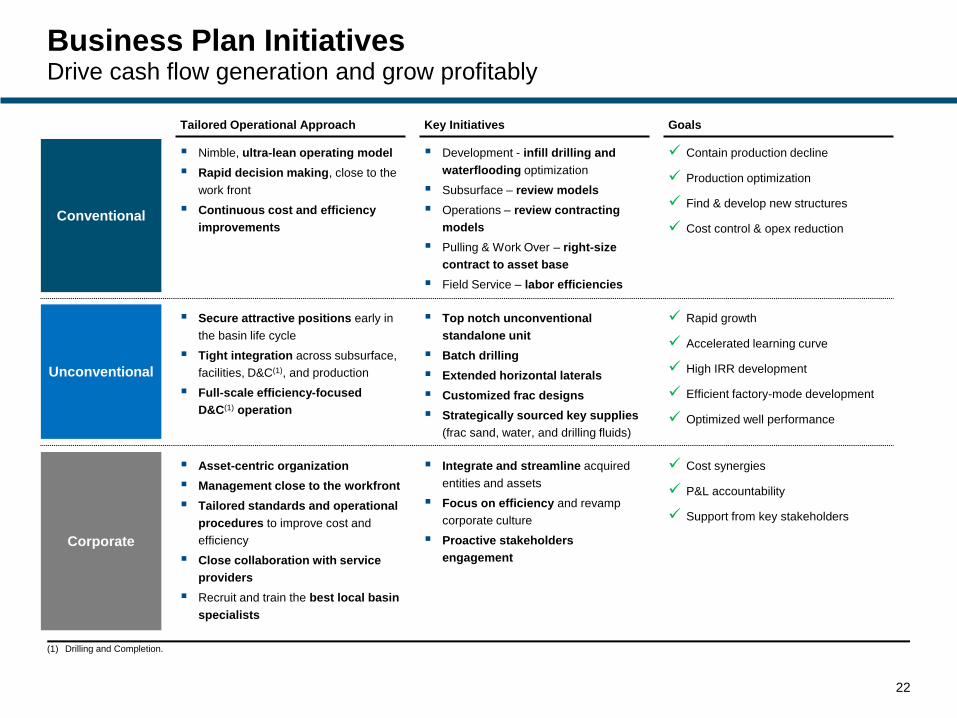
Business Plan InitiativesDrive cash flow generation and grow profitably
22
Nimble, ultra-lean operating model
Rapid decision making, close to the
work front
Continuous cost and efficiency
improvementsConventional
Development - infill drilling and
waterflooding optimization
Subsurface – review models
Operations – review contracting
models
Pulling & Work Over – right-size
contract to asset base
Field Service – labor efficiencies
Contain production decline
Production optimization
Find & develop new structures
Cost control & opex reduction
Tailored Operational Approach Key Initiatives Goals
Secure attractive positions early in
the basin life cycle
Tight integration across subsurface,
facilities, D&C(1), and production
Full-scale efficiency-focused
D&C(1) operation
Unconventional
Top notch unconventional
standalone unit
Batch drilling
Extended horizontal laterals
Customized frac designs
Strategically sourced key supplies
(frac sand, water, and drilling fluids)
Rapid growth
Accelerated learning curve
High IRR development
Efficient factory-mode development
Optimized well performance
Asset-centric organization
Management close to the workfront
Tailored standards and operational
procedures to improve cost and
efficiency
Close collaboration with service
providers
Recruit and train the best local basin
specialists
Corporate
Integrate and streamline acquired
entities and assets
Focus on efficiency and revamp
corporate culture
Proactive stakeholders
engagement
Cost synergies
P&L accountability
Support from key stakeholders
(1) Drilling and Completion.
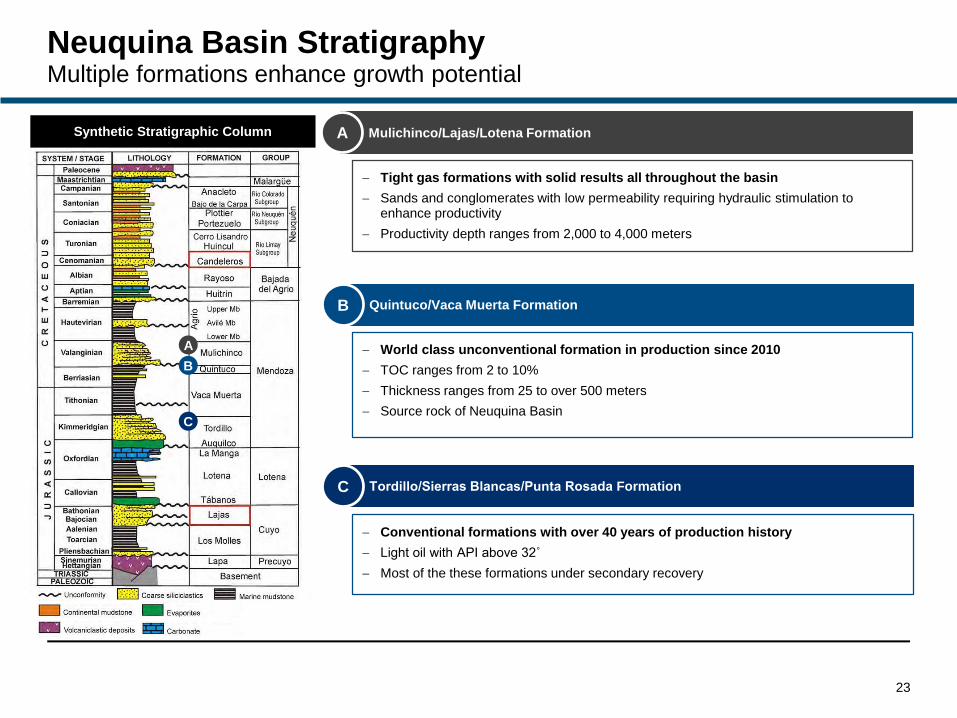
Neuquina Basin StratigraphyMultiple formations enhance growth potential
23
Synthetic Stratigraphic Column Mulichinco/Lajas/Lotena FormationA
Quintuco/Vaca Muerta FormationB
Tordillo/Sierras Blancas/Punta Rosada FormationC
World class unconventional formation in production since 2010
TOC ranges from 2 to 10%
Thickness ranges from 25 to over 500 meters
Source rock of Neuquina Basin
Conventional formations with over 40 years of production history
Light oil with API above 32˚
Most of the these formations under secondary recovery
Tight gas formations with solid results all throughout the basin
Sands and conglomerates with low permeability requiring hydraulic stimulation to enhance productivity
Productivity depth ranges from 2,000 to 4,000 meters
A
C
B
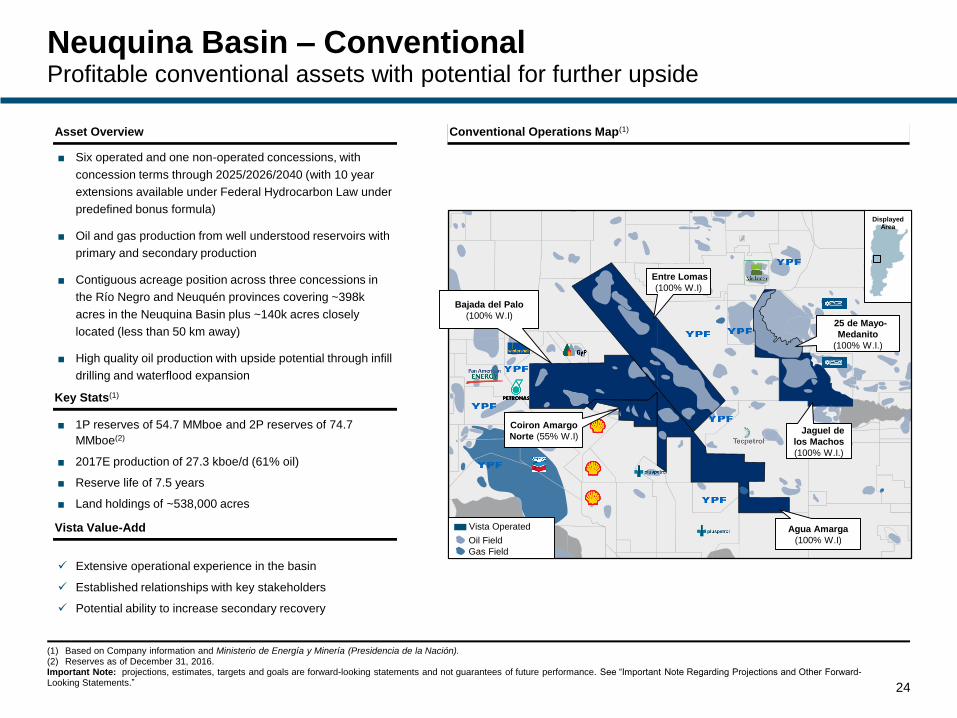
■ Six operated and one non-operated concessions, with
concession terms through 2025/2026/2040 (with 10 year
extensions available under Federal Hydrocarbon Law under
predefined bonus formula)
■ Oil and gas production from well understood reservoirs with
primary and secondary production
■ Contiguous acreage position across three concessions in
the Río Negro and Neuquén provinces covering ~398k
acres in the Neuquina Basin plus ~140k acres closely
located (less than 50 km away)
■ High quality oil production with upside potential through infill
drilling and waterflood expansion
■ 1P reserves of 54.7 MMboe and 2P reserves of 74.7
MMboe(2)
■ 2017E production of 27.3 kboe/d (61% oil)
■ Reserve life of 7.5 years
■ Land holdings of ~538,000 acres
Neuquina Basin – ConventionalProfitable conventional assets with potential for further upside
24
Extensive operational experience in the basin
Established relationships with key stakeholders
Potential ability to increase secondary recovery
Conventional Operations Map(1)Asset Overview
Key Stats(1)
Vista Value-Add
(1) Based on Company information and Ministerio de Energía y Minería (Presidencia de la Nación).(2) Reserves as of December 31, 2016.Important Note: projections, estimates, targets and goals are forward-looking statements and not guarantees of future performance. See “Important Note Regarding Projections and Other Forward-Looking Statements.”
Entre Lomas
(100% W.I)
25 de Mayo-
Medanito
(100% W.I.)
Jaguel de
los Machos
(100% W.I.)
Agua Amarga
(100% W.I)
DisplayedArea
DisplayedArea
Oil Field
Gas Field
Vista Operated
Bajada del Palo
(100% W.I)
Coiron Amargo
Norte (55% W.I)
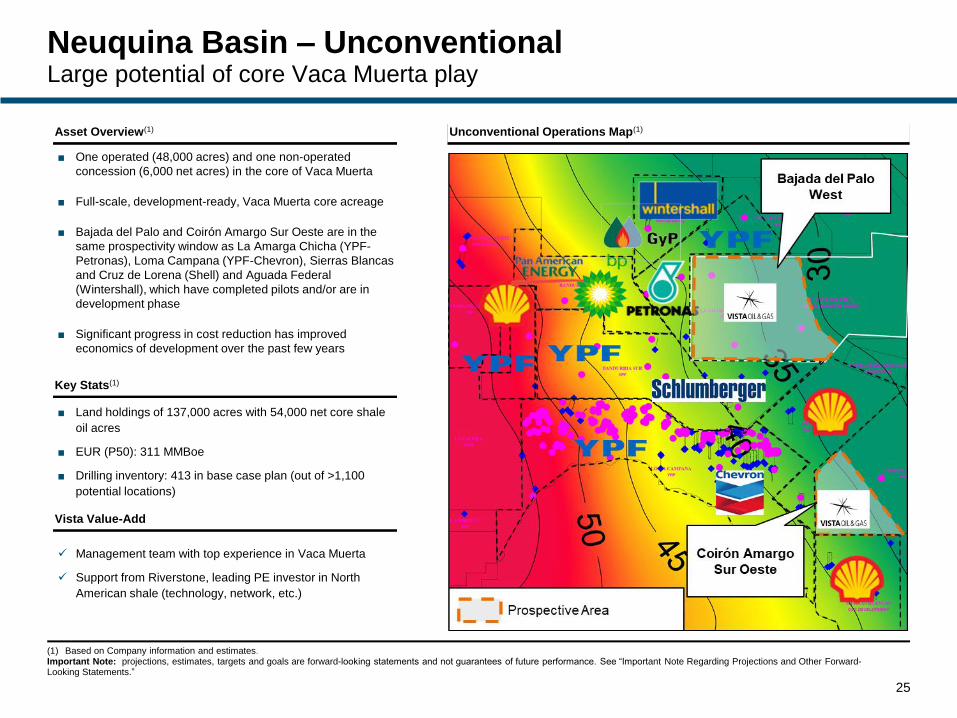
■ One operated (48,000 acres) and one non-operated
concession (6,000 net acres) in the core of Vaca Muerta
■ Full-scale, development-ready, Vaca Muerta core acreage
■ Bajada del Palo and Coirón Amargo Sur Oeste are in the
same prospectivity window as La Amarga Chicha (YPF-
Petronas), Loma Campana (YPF-Chevron), Sierras Blancas
and Cruz de Lorena (Shell) and Aguada Federal
(Wintershall), which have completed pilots and/or are in
development phase
■ Significant progress in cost reduction has improved
economics of development over the past few years
Neuquina Basin – UnconventionalLarge potential of core Vaca Muerta play
25
Management team with top experience in Vaca Muerta
Support from Riverstone, leading PE investor in North
American shale (technology, network, etc.)
Unconventional Operations Map(1)Asset Overview(1)
Key Stats(1)
Vista Value-Add
■ Land holdings of 137,000 acres with 54,000 net core shale
oil acres
■ EUR (P50): 311 MMBoe
■ Drilling inventory: 413 in base case plan (out of >1,100
potential locations)
(1) Based on Company information and estimates.Important Note: projections, estimates, targets and goals are forward-looking statements and not guarantees of future performance. See “Important Note Regarding Projections and Other Forward-Looking Statements.”
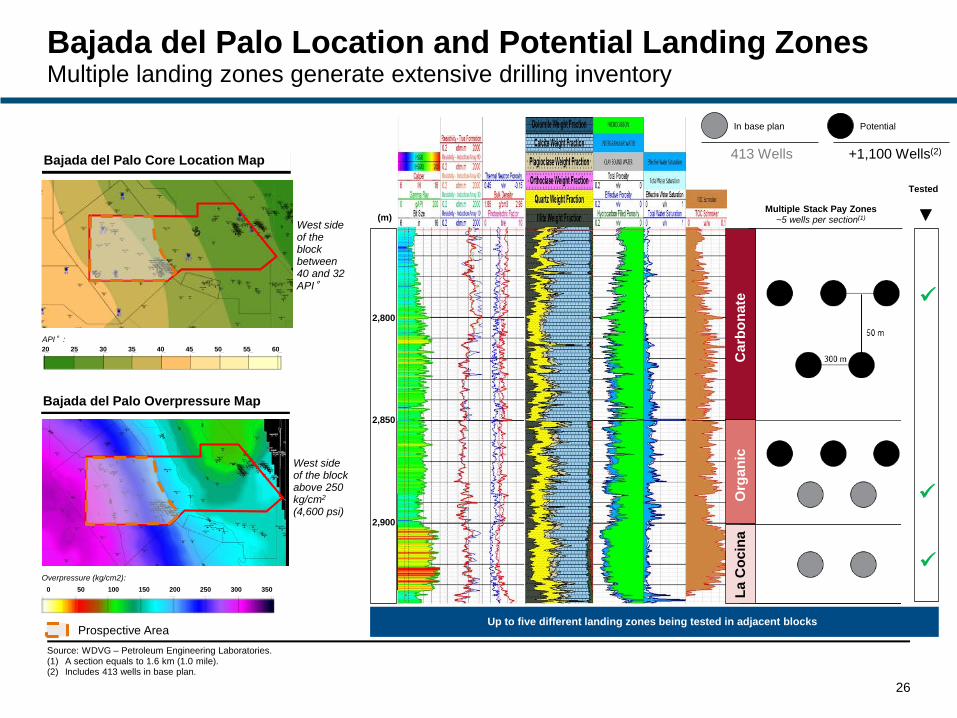
Bajada del Palo Location and Potential Landing ZonesMultiple landing zones generate extensive drilling inventory
26
Bajada del Palo Core Location Map
0 50 100 150 200 250 300 350
Overpressure (kg/cm2):
20 25 30 35 40 45 50 55 60
API°:
West side of the block between 40 and 32 API°
West side of the block above 250 kg/cm2
(4,600 psi)
Multiple Stack Pay Zones~5 wells per section(1)
2,800
2,850
2,900
(m)
Ca
rbo
na
teO
rga
nic
La
Co
cin
a
Up to five different landing zones being tested in adjacent blocksProspective Area
Bajada del Palo Overpressure Map
PotentialIn base plan
Source: WDVG – Petroleum Engineering Laboratories.(1) A section equals to 1.6 km (1.0 mile).(2) Includes 413 wells in base plan.
Tested
413 Wells +1,100 Wells(2)
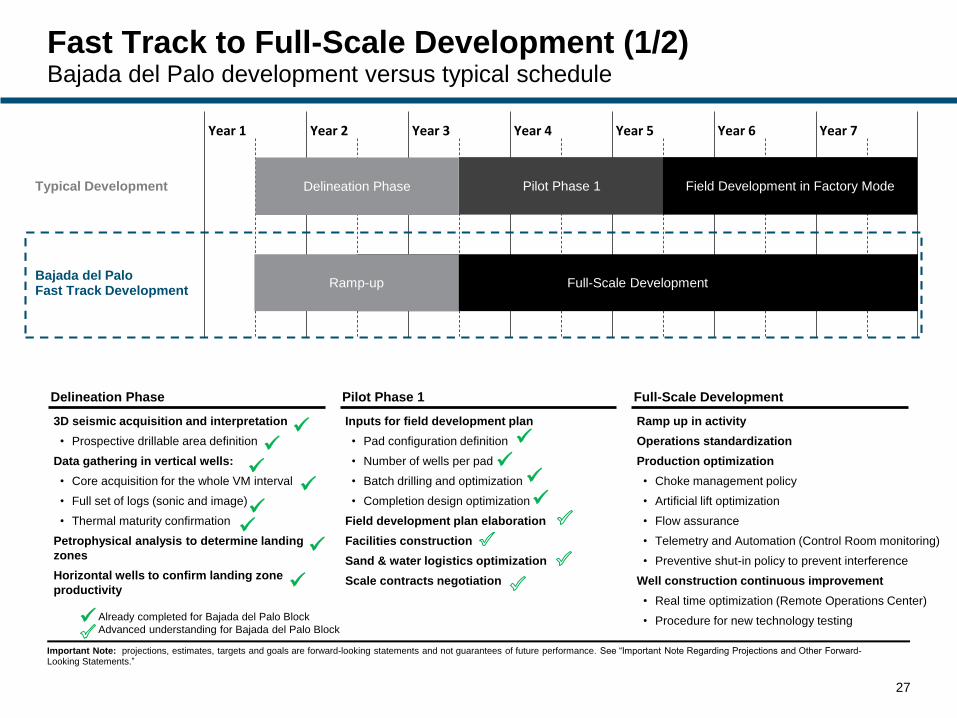
Fast Track to Full-Scale Development (1/2)Bajada del Palo development versus typical schedule
Typical Development
Year 1 Year 2 Year 3 Year 4 Year 5 Year 6 Year 7
Bajada del Palo Fast Track Development
3D seismic acquisition and interpretation
• Prospective drillable area definition
Data gathering in vertical wells:
• Core acquisition for the whole VM interval
• Full set of logs (sonic and image)
• Thermal maturity confirmation
Petrophysical analysis to determine landing
zones
Horizontal wells to confirm landing zone
productivity
Inputs for field development plan
• Pad configuration definition
• Number of wells per pad
• Batch drilling and optimization
• Completion design optimization
Field development plan elaboration
Facilities construction
Sand & water logistics optimization
Scale contracts negotiation
Ramp up in activity
Operations standardization
Production optimization
• Choke management policy
• Artificial lift optimization
• Flow assurance
• Telemetry and Automation (Control Room monitoring)
• Preventive shut-in policy to prevent interference
Well construction continuous improvement
• Real time optimization (Remote Operations Center)
• Procedure for new technology testing
27
Delineation Phase Pilot Phase 1 Full-Scale Development
Full-Scale DevelopmentRamp-up
Delineation Phase Pilot Phase 1 Field Development in Factory Mode
Already completed for Bajada del Palo Block
Advanced understanding for Bajada del Palo Block
Important Note: projections, estimates, targets and goals are forward-looking statements and not guarantees of future performance. See “Important Note Regarding Projections and Other Forward-Looking Statements.”
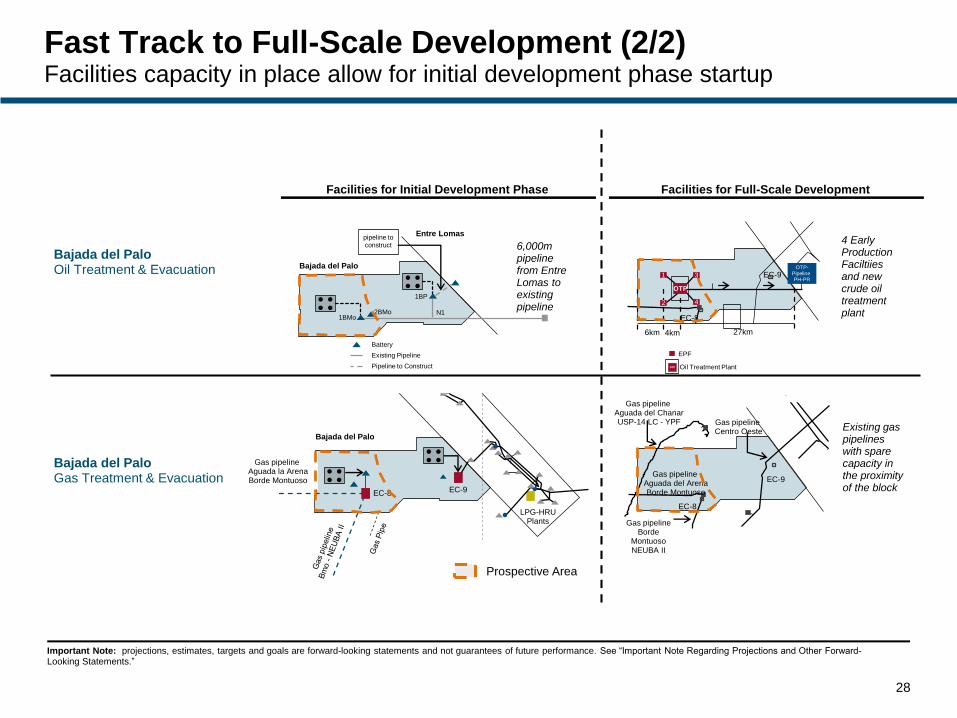
Fast Track to Full-Scale Development (2/2)Facilities capacity in place allow for initial development phase startup
28
Bajada del Palo
EC-8 EC-9
LPG-HRUPlants
Gas pipeline Aguada la ArenaBorde Montuoso
Gas pipeline Centro Oeste
Gas pipeline Aguada del ChanarUSP-14 LC - YPF
Gas pipeline Aguada del ArenaBorde Montuoso
Gas pipeline Borde
MontuosoNEUBA II
EC-8
EC-9
Entre Lomas
Bajada del Palo
1BMo2BMo
1BP
N1
pipeline to construct
Battery
Existing Pipeline
Pipeline to Construct
Bajada del PaloOil Treatment & Evacuation
Bajada del PaloGas Treatment & Evacuation
6km 4km 27km
OTP-Pipeline PH-PR
EC-8
EC-91
2
3
OTP
4
EPF
Oil Treatment PlantOTP
Prospective Area
Facilities for Full-Scale DevelopmentFacilities for Initial Development Phase
6,000m pipeline from Entre Lomas toexistingpipeline
4 Early Production Faciltiiesand new crude oil treatment plant
Existing gas pipelines with spare capacity in the proximity of the block
Important Note: projections, estimates, targets and goals are forward-looking statements and not guarantees of future performance. See “Important Note Regarding Projections and Other Forward-Looking Statements.”
29
Appendix Agenda
Portfolio Overview1
Transaction Summary2
Management Team4
Argentina Macro5
Pro Forma Historical Financials3
30
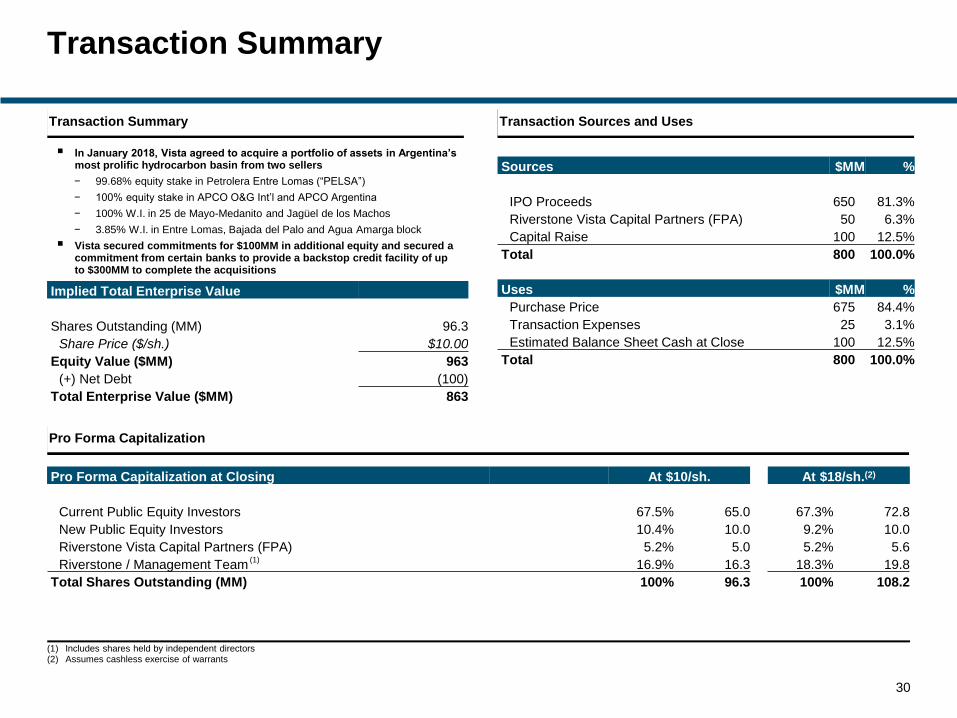
Transaction Summary
(1) Includes shares held by independent directors(2) Assumes cashless exercise of warrants
Pro Forma Capitalization
Transaction Sources and Uses
Pro Forma Capitalization at Closing At $10/sh. At $18/sh.(2)
Current Public Equity Investors 67.5% 65.0 67.3% 72.8
New Public Equity Investors 10.4% 10.0 9.2% 10.0
Riverstone Vista Capital Partners (FPA) 5.2% 5.0 5.2% 5.6
Riverstone / Management Team 16.9% 16.3 18.3% 19.8
Total Shares Outstanding (MM) 100% 96.3 100% 108.2
(1)
Sources $MM %
IPO Proceeds 650 81.3%
Riverstone Vista Capital Partners (FPA) 50 6.3%
Capital Raise 100 12.5%
Total 800 100.0%
Uses $MM %
Purchase Price 675 84.4%
Transaction Expenses 25 3.1%
Estimated Balance Sheet Cash at Close 100 12.5%
Total 800 100.0%
In January 2018, Vista agreed to acquire a portfolio of assets in Argentina’s most prolific hydrocarbon basin from two sellers
− 99.68% equity stake in Petrolera Entre Lomas (“PELSA”)
− 100% equity stake in APCO O&G Int’l and APCO Argentina
− 100% W.I. in 25 de Mayo-Medanito and Jagüel de los Machos
− 3.85% W.I. in Entre Lomas, Bajada del Palo and Agua Amarga block
Vista secured commitments for $100MM in additional equity and secured a commitment from certain banks to provide a backstop credit facility of up to $300MM to complete the acquisitions
Implied Total Enterprise Value
Shares Outstanding (MM) 96.3
Share Price ($/sh.) $10.00
Equity Value ($MM) 963
(+) Net Debt (100)
Total Enterprise Value ($MM) 863
Transaction Summary
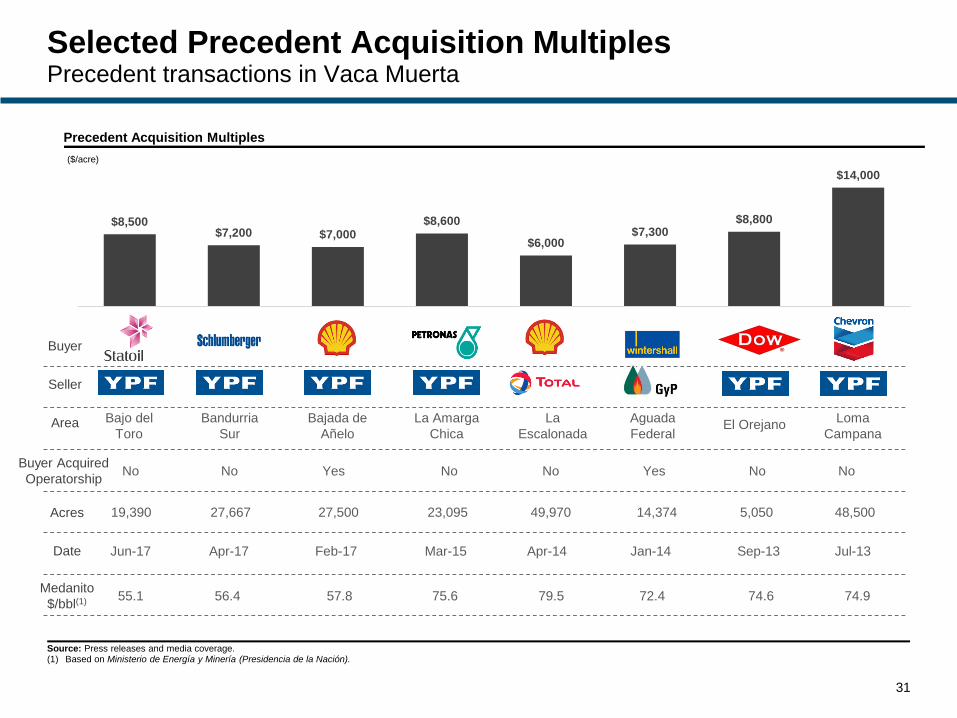
Selected Precedent Acquisition MultiplesPrecedent transactions in Vaca Muerta
Precedent Acquisition Multiples
($/acre)
Buyer
Seller
Acres
Area
Date
27,667
Bandurria
Sur
Apr-17
27,500
Bajada de
Añelo
Feb-17
23,095
La Amarga
Chica
Mar-15
49,970
La
Escalonada
Apr-14
14,374
Aguada
Federal
Jan-14
48,500
Loma
Campana
Jul-13
5,050
El Orejano
Sep-13
Bajo del
Toro
19,390
Jun-17
5,850
$8,500$7,200 $7,000
$8,600
$6,000$7,300
$8,800
$14,000
31
Medanito
$/bbl(1)
Source: Press releases and media coverage.(1) Based on Ministerio de Energía y Minería (Presidencia de la Nación).
55.1 56.4 57.8 75.6 79.5 72.4 74.6 74.9
Buyer Acquired
OperatorshipNo No Yes No Yes No NoNo
32
Appendix Agenda
Portfolio Overview1
Transaction Summary2
Management Team4
Argentina Macro5
Pro Forma Historical Financials3
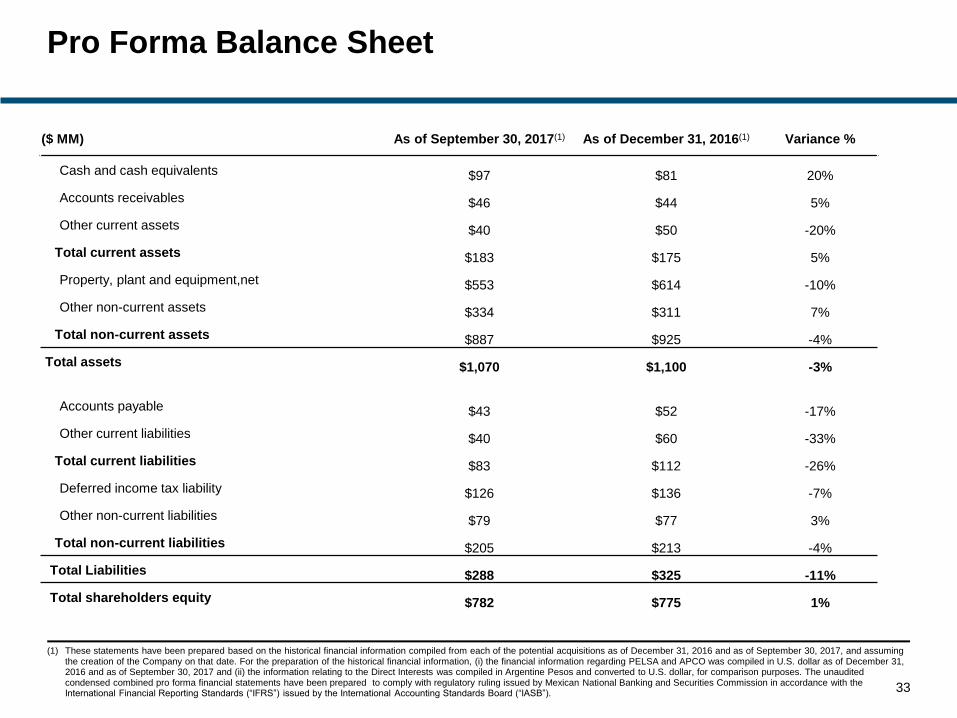
Pro Forma Balance Sheet
($ MM) As of September 30, 2017(1) As of December 31, 2016(1) Variance %
Cash and cash equivalents $97 $81 20%
Accounts receivables $46 $44 5%
Other current assets $40 $50 -20%
Total current assets $183 $175 5%
Property, plant and equipment,net $553 $614 -10%
Other non-current assets $334 $311 7%
Total non-current assets $887 $925 -4%
Total assets $1,070 $1,100 -3%
Accounts payable $43 $52 -17%
Other current liabilities $40 $60 -33%
Total current liabilities $83 $112 -26%
Deferred income tax liability $126 $136 -7%
Other non-current liabilities $79 $77 3%
Total non-current liabilities $205 $213 -4%
Total Liabilities $288 $325 -11%
Total shareholders equity $782 $775 1%
(1) These statements have been prepared based on the historical financial information compiled from each of the potential acquisitions as of December 31, 2016 and as of September 30, 2017, and assuming the creation of the Company on that date. For the preparation of the historical financial information, (i) the financial information regarding PELSA and APCO was compiled in U.S. dollar as of December 31, 2016 and as of September 30, 2017 and (ii) the information relating to the Direct Interests was compiled in Argentine Pesos and converted to U.S. dollar, for comparison purposes. The unaudited condensed combined pro forma financial statements have been prepared to comply with regulatory ruling issued by Mexican National Banking and Securities Commission in accordance with the International Financial Reporting Standards (“IFRS”) issued by the International Accounting Standards Board (“IASB”).
33
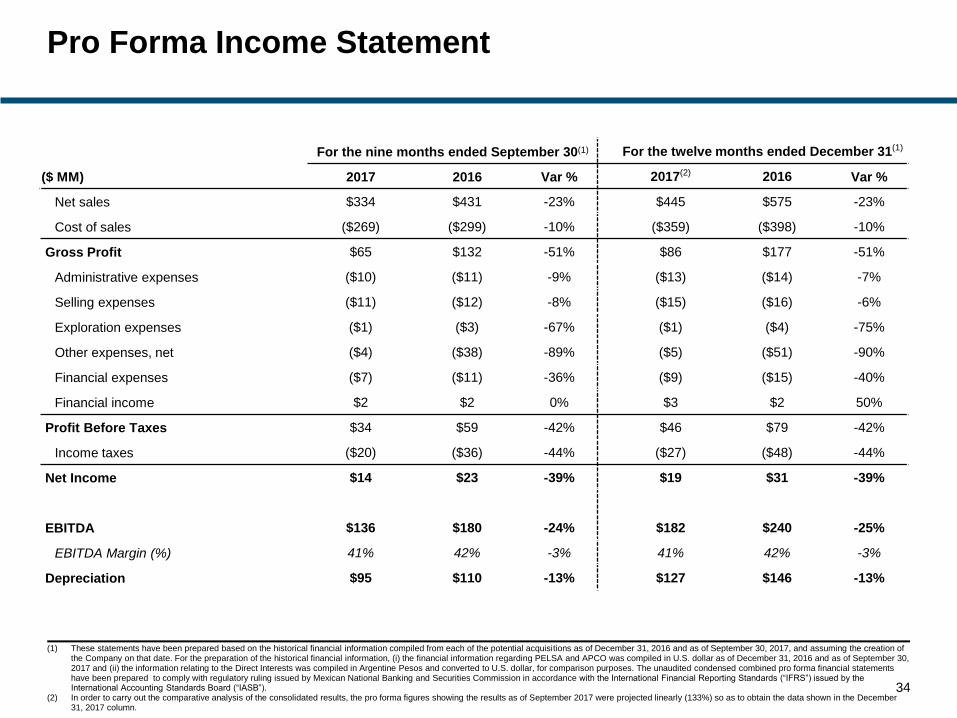
Pro Forma Income Statement
(1) These statements have been prepared based on the historical financial information compiled from each of the potential acquisitions as of December 31, 2016 and as of September 30, 2017, and assuming the creation of the Company on that date. For the preparation of the historical financial information, (i) the financial information regarding PELSA and APCO was compiled in U.S. dollar as of December 31, 2016 and as of September 30, 2017 and (ii) the information relating to the Direct Interests was compiled in Argentine Pesos and converted to U.S. dollar, for comparison purposes. The unaudited condensed combined pro forma financial statements have been prepared to comply with regulatory ruling issued by Mexican National Banking and Securities Commission in accordance with the International Financial Reporting Standards (“IFRS”) issued by the International Accounting Standards Board (“IASB”).
(2) In order to carry out the comparative analysis of the consolidated results, the pro forma figures showing the results as of September 2017 were projected linearly (133%) so as to obtain the data shown in the December 31, 2017 column.
34
For the nine months ended September 30(1) For the twelve months ended December 31(1)
($ MM) 2017 2016 Var % 2017(2) 2016 Var %
Net sales $334 $431 -23% $445 $575 -23%
Cost of sales ($269) ($299) -10% ($359) ($398) -10%
Gross Profit $65 $132 -51% $86 $177 -51%
Administrative expenses ($10) ($11) -9% ($13) ($14) -7%
Selling expenses ($11) ($12) -8% ($15) ($16) -6%
Exploration expenses ($1) ($3) -67% ($1) ($4) -75%
Other expenses, net ($4) ($38) -89% ($5) ($51) -90%
Financial expenses ($7) ($11) -36% ($9) ($15) -40%
Financial income $2 $2 0% $3 $2 50%
Profit Before Taxes $34 $59 -42% $46 $79 -42%
Income taxes ($20) ($36) -44% ($27) ($48) -44%
Net Income $14 $23 -39% $19 $31 -39%
EBITDA $136 $180 -24% $182 $240 -25%
EBITDA Margin (%) 41% 42% -3% 41% 42% -3%
Depreciation $95 $110 -13% $127 $146 -13%
35
Appendix Agenda
Portfolio Overview1
Transaction Summary2
Management Team4
Argentina Macro5
Pro Forma Historical Financials3
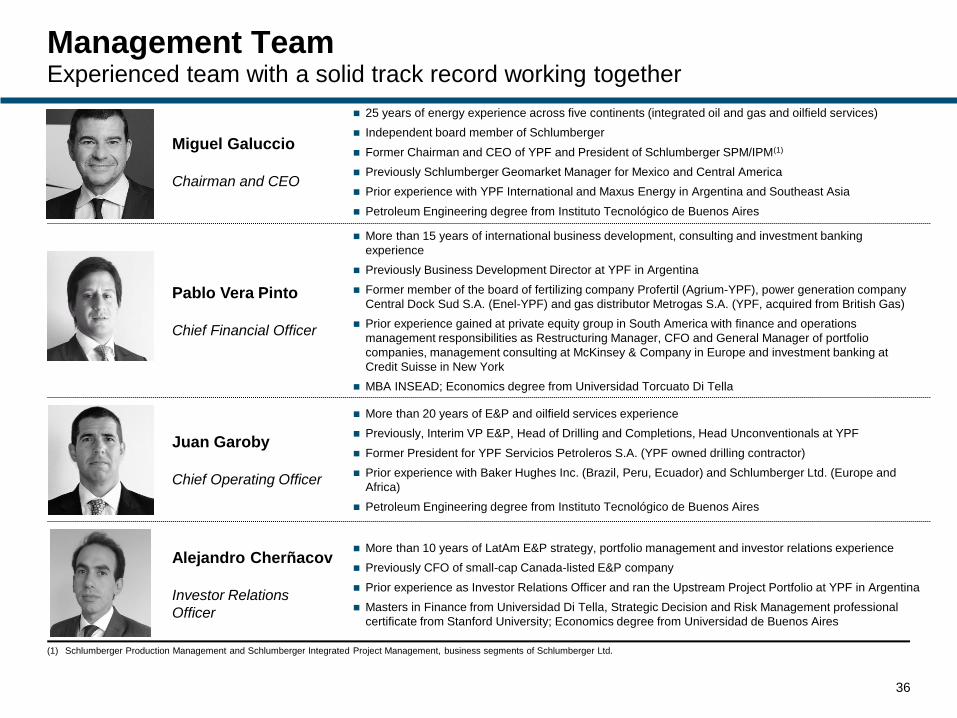
Miguel Galuccio
Chairman and CEO
25 years of energy experience across five continents (integrated oil and gas and oilfield services)
Independent board member of Schlumberger
Former Chairman and CEO of YPF and President of Schlumberger SPM/IPM(1)
Previously Schlumberger Geomarket Manager for Mexico and Central America
Prior experience with YPF International and Maxus Energy in Argentina and Southeast Asia
Petroleum Engineering degree from Instituto Tecnológico de Buenos Aires
Pablo Vera Pinto
Chief Financial Officer
More than 15 years of international business development, consulting and investment banking
experience
Previously Business Development Director at YPF in Argentina
Former member of the board of fertilizing company Profertil (Agrium-YPF), power generation company
Central Dock Sud S.A. (Enel-YPF) and gas distributor Metrogas S.A. (YPF, acquired from British Gas)
Prior experience gained at private equity group in South America with finance and operations
management responsibilities as Restructuring Manager, CFO and General Manager of portfolio
companies, management consulting at McKinsey & Company in Europe and investment banking at
Credit Suisse in New York
MBA INSEAD; Economics degree from Universidad Torcuato Di Tella
Juan Garoby
Chief Operating Officer
More than 20 years of E&P and oilfield services experience
Previously, Interim VP E&P, Head of Drilling and Completions, Head Unconventionals at YPF
Former President for YPF Servicios Petroleros S.A. (YPF owned drilling contractor)
Prior experience with Baker Hughes Inc. (Brazil, Peru, Ecuador) and Schlumberger Ltd. (Europe and
Africa)
Petroleum Engineering degree from Instituto Tecnológico de Buenos Aires
Alejandro Cherñacov
Investor Relations
Officer
More than 10 years of LatAm E&P strategy, portfolio management and investor relations experience
Previously CFO of small-cap Canada-listed E&P company
Prior experience as Investor Relations Officer and ran the Upstream Project Portfolio at YPF in Argentina
Masters in Finance from Universidad Di Tella, Strategic Decision and Risk Management professional
certificate from Stanford University; Economics degree from Universidad de Buenos Aires
Management TeamExperienced team with a solid track record working together
36
(1) Schlumberger Production Management and Schlumberger Integrated Project Management, business segments of Schlumberger Ltd.
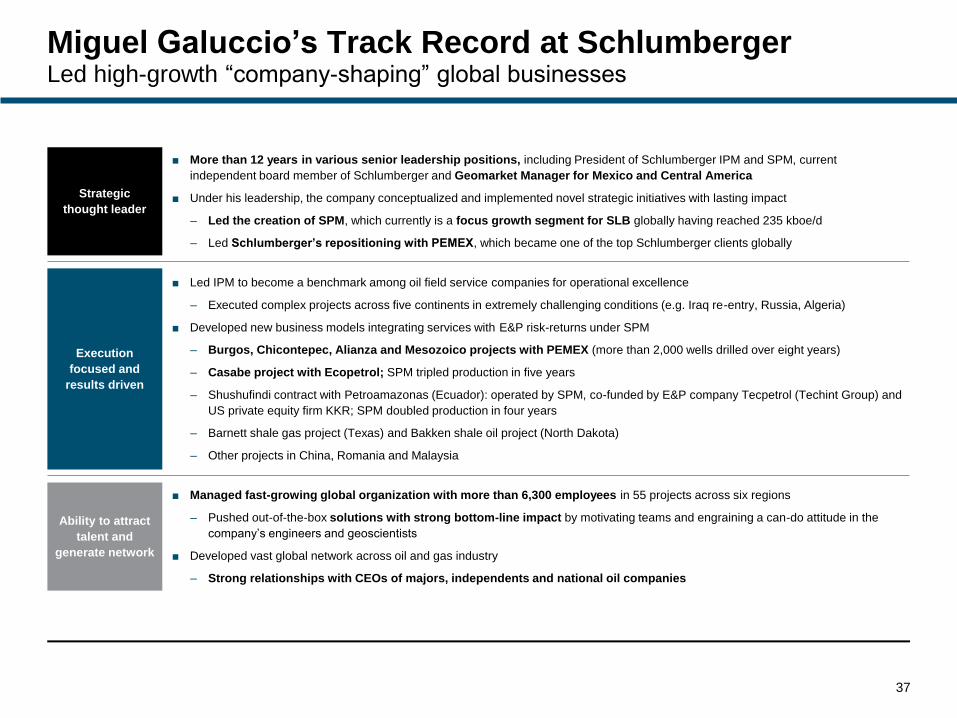
Miguel Galuccio’s Track Record at SchlumbergerLed high-growth “company-shaping” global businesses
37
Strategic
thought leader
■ More than 12 years in various senior leadership positions, including President of Schlumberger IPM and SPM, current
independent board member of Schlumberger and Geomarket Manager for Mexico and Central America
■ Under his leadership, the company conceptualized and implemented novel strategic initiatives with lasting impact
– Led the creation of SPM, which currently is a focus growth segment for SLB globally having reached 235 kboe/d
– Led Schlumberger’s repositioning with PEMEX, which became one of the top Schlumberger clients globally
Execution
focused and
results driven
■ Led IPM to become a benchmark among oil field service companies for operational excellence
– Executed complex projects across five continents in extremely challenging conditions (e.g. Iraq re-entry, Russia, Algeria)
■ Developed new business models integrating services with E&P risk-returns under SPM
– Burgos, Chicontepec, Alianza and Mesozoico projects with PEMEX (more than 2,000 wells drilled over eight years)
– Casabe project with Ecopetrol; SPM tripled production in five years
– Shushufindi contract with Petroamazonas (Ecuador): operated by SPM, co-funded by E&P company Tecpetrol (Techint Group) and
US private equity firm KKR; SPM doubled production in four years
– Barnett shale gas project (Texas) and Bakken shale oil project (North Dakota)
– Other projects in China, Romania and Malaysia
Ability to attract
talent and
generate network
■ Managed fast-growing global organization with more than 6,300 employees in 55 projects across six regions
– Pushed out-of-the-box solutions with strong bottom-line impact by motivating teams and engraining a can-do attitude in the
company’s engineers and geoscientists
■ Developed vast global network across oil and gas industry
– Strong relationships with CEOs of majors, independents and national oil companies
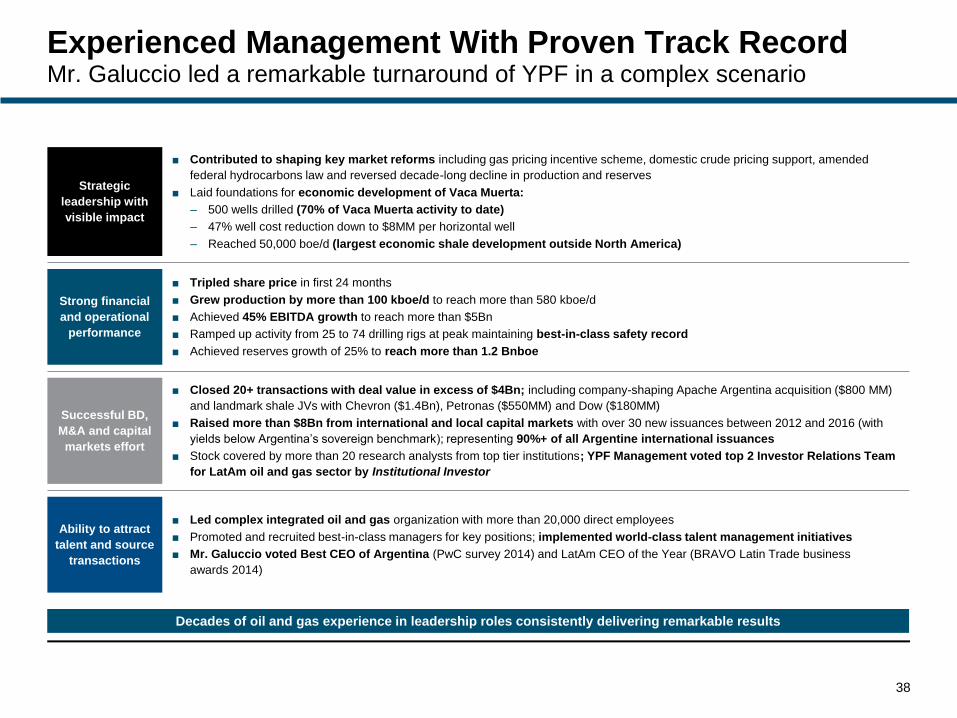
Experienced Management With Proven Track RecordMr. Galuccio led a remarkable turnaround of YPF in a complex scenario
38
Strategic
leadership with
visible impact
■ Contributed to shaping key market reforms including gas pricing incentive scheme, domestic crude pricing support, amended
federal hydrocarbons law and reversed decade-long decline in production and reserves
■ Laid foundations for economic development of Vaca Muerta:
– 500 wells drilled (70% of Vaca Muerta activity to date)
– 47% well cost reduction down to $8MM per horizontal well
– Reached 50,000 boe/d (largest economic shale development outside North America)
Strong financial
and operational
performance
■ Tripled share price in first 24 months
■ Grew production by more than 100 kboe/d to reach more than 580 kboe/d
■ Achieved 45% EBITDA growth to reach more than $5Bn
■ Ramped up activity from 25 to 74 drilling rigs at peak maintaining best-in-class safety record
■ Achieved reserves growth of 25% to reach more than 1.2 Bnboe
Successful BD,
M&A and capital
markets effort
■ Closed 20+ transactions with deal value in excess of $4Bn; including company-shaping Apache Argentina acquisition ($800 MM)
and landmark shale JVs with Chevron ($1.4Bn), Petronas ($550MM) and Dow ($180MM)
■ Raised more than $8Bn from international and local capital markets with over 30 new issuances between 2012 and 2016 (with
yields below Argentina’s sovereign benchmark); representing 90%+ of all Argentine international issuances
■ Stock covered by more than 20 research analysts from top tier institutions; YPF Management voted top 2 Investor Relations Team
for LatAm oil and gas sector by Institutional Investor
Ability to attract
talent and source
transactions
■ Led complex integrated oil and gas organization with more than 20,000 direct employees
■ Promoted and recruited best-in-class managers for key positions; implemented world-class talent management initiatives
■ Mr. Galuccio voted Best CEO of Argentina (PwC survey 2014) and LatAm CEO of the Year (BRAVO Latin Trade business
awards 2014)
Decades of oil and gas experience in leadership roles consistently delivering remarkable results
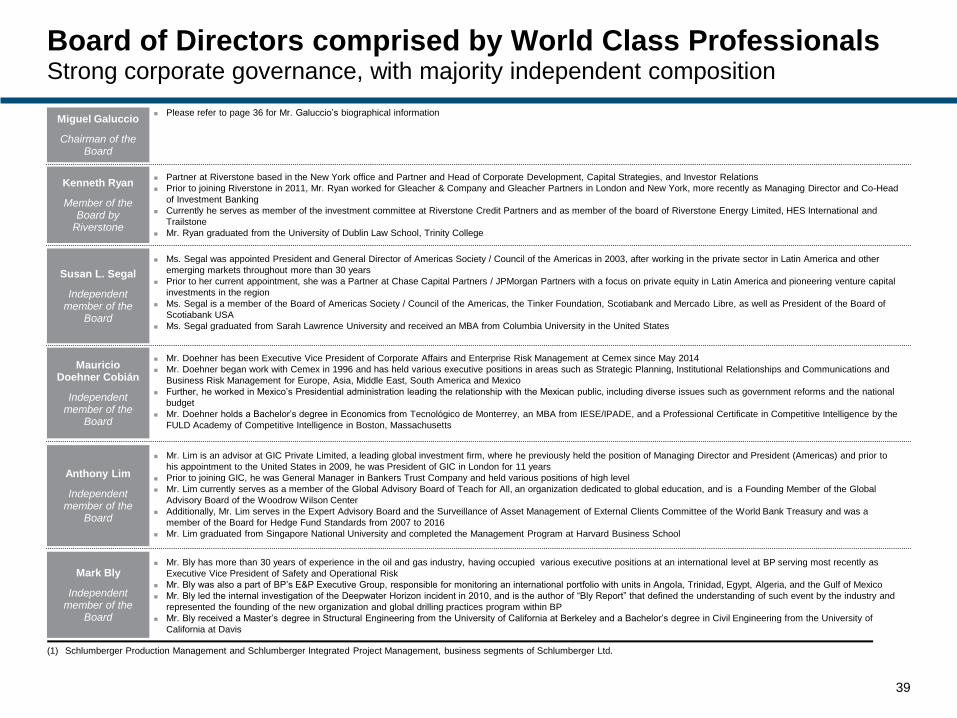
Board of Directors comprised by World Class ProfessionalsStrong corporate governance, with majority independent composition
Kenneth Ryan
Member of the Board by
Riverstone
39
Partner at Riverstone based in the New York office and Partner and Head of Corporate Development, Capital Strategies, and Investor Relations
Prior to joining Riverstone in 2011, Mr. Ryan worked for Gleacher & Company and Gleacher Partners in London and New York, more recently as Managing Director and Co-Head
of Investment Banking
Currently he serves as member of the investment committee at Riverstone Credit Partners and as member of the board of Riverstone Energy Limited, HES International and
Trailstone
Mr. Ryan graduated from the University of Dublin Law School, Trinity College
Susan L. Segal
Independent member of the
Board
Anthony Lim
Independent member of the
Board
Mark Bly
Independent member of the
Board
Ms. Segal was appointed President and General Director of Americas Society / Council of the Americas in 2003, after working in the private sector in Latin America and other
emerging markets throughout more than 30 years
Prior to her current appointment, she was a Partner at Chase Capital Partners / JPMorgan Partners with a focus on private equity in Latin America and pioneering venture capital
investments in the region
Ms. Segal is a member of the Board of Americas Society / Council of the Americas, the Tinker Foundation, Scotiabank and Mercado Libre, as well as President of the Board of
Scotiabank USA
Ms. Segal graduated from Sarah Lawrence University and received an MBA from Columbia University in the United States
Mr. Lim is an advisor at GIC Private Limited, a leading global investment firm, where he previously held the position of Managing Director and President (Americas) and prior to
his appointment to the United States in 2009, he was President of GIC in London for 11 years
Prior to joining GIC, he was General Manager in Bankers Trust Company and held various positions of high level
Mr. Lim currently serves as a member of the Global Advisory Board of Teach for All, an organization dedicated to global education, and is a Founding Member of the Global
Advisory Board of the Woodrow Wilson Center
Additionally, Mr. Lim serves in the Expert Advisory Board and the Surveillance of Asset Management of External Clients Committee of the World Bank Treasury and was a
member of the Board for Hedge Fund Standards from 2007 to 2016
Mr. Lim graduated from Singapore National University and completed the Management Program at Harvard Business School
Mr. Bly has more than 30 years of experience in the oil and gas industry, having occupied various executive positions at an international level at BP serving most recently as
Executive Vice President of Safety and Operational Risk
Mr. Bly was also a part of BP’s E&P Executive Group, responsible for monitoring an international portfolio with units in Angola, Trinidad, Egypt, Algeria, and the Gulf of Mexico
Mr. Bly led the internal investigation of the Deepwater Horizon incident in 2010, and is the author of “Bly Report” that defined the understanding of such event by the industry and
represented the founding of the new organization and global drilling practices program within BP
Mr. Bly received a Master’s degree in Structural Engineering from the University of California at Berkeley and a Bachelor’s degree in Civil Engineering from the University of
California at Davis
Miguel Galuccio
Chairman of the Board
Please refer to page 36 for Mr. Galuccio’s biographical information
Mauricio Doehner Cobián
Independent member of the
Board
Mr. Doehner has been Executive Vice President of Corporate Affairs and Enterprise Risk Management at Cemex since May 2014
Mr. Doehner began work with Cemex in 1996 and has held various executive positions in areas such as Strategic Planning, Institutional Relationships and Communications and
Business Risk Management for Europe, Asia, Middle East, South America and Mexico
Further, he worked in Mexico’s Presidential administration leading the relationship with the Mexican public, including diverse issues such as government reforms and the national
budget
Mr. Doehner holds a Bachelor’s degree in Economics from Tecnológico de Monterrey, an MBA from IESE/IPADE, and a Professional Certificate in Competitive Intelligence by the
FULD Academy of Competitive Intelligence in Boston, Massachusetts
(1) Schlumberger Production Management and Schlumberger Integrated Project Management, business segments of Schlumberger Ltd.
40
Appendix Agenda
Portfolio Overview1
Transaction Summary2
Management Team4
Argentina Macro5
Pro Forma Historical Financials3
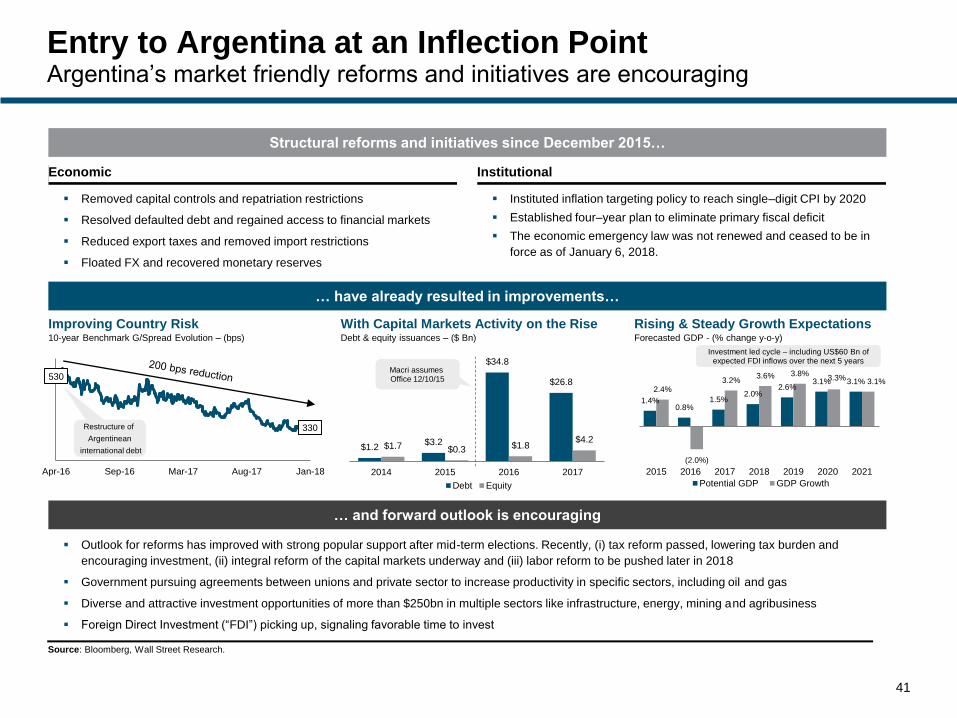
Entry to Argentina at an Inflection PointArgentina’s market friendly reforms and initiatives are encouraging
41
Structural reforms and initiatives since December 2015…
… have already resulted in improvements…
Economic Institutional
Removed capital controls and repatriation restrictions
Resolved defaulted debt and regained access to financial markets
Reduced export taxes and removed import restrictions
Floated FX and recovered monetary reserves
Instituted inflation targeting policy to reach single–digit CPI by 2020
Established four–year plan to eliminate primary fiscal deficit
The economic emergency law was not renewed and ceased to be in
force as of January 6, 2018.
Improving Country RiskDebt & equity issuances – ($ Bn)
With Capital Markets Activity on the RiseForecasted GDP - (% change y-o-y)
Rising & Steady Growth Expectations10-year Benchmark G/Spread Evolution – (bps)
… and forward outlook is encouraging
Outlook for reforms has improved with strong popular support after mid-term elections. Recently, (i) tax reform passed, lowering tax burden and
encouraging investment, (ii) integral reform of the capital markets underway and (iii) labor reform to be pushed later in 2018
Government pursuing agreements between unions and private sector to increase productivity in specific sectors, including oil and gas
Diverse and attractive investment opportunities of more than $250bn in multiple sectors like infrastructure, energy, mining and agribusiness
Foreign Direct Investment (“FDI”) picking up, signaling favorable time to invest
Source: Bloomberg, Wall Street Research.
530
330
Apr-16 Sep-16 Mar-17 Aug-17 Jan-18
Restructure of
Argentinean
international debt $1.2$3.2
$34.8
$26.8
$1.7 $0.3 $1.8$4.2
2014 2015 2016 2017
Debt Equity
Macri assumesOffice 12/10/15
Investment led cycle – including US$60 Bn of expected FDI inflows over the next 5 years
1.4%0.8%
1.5%2.0%
2.6%3.1% 3.1%
2.4%
(2.0%)
3.2%3.6% 3.8%
3.3% 3.1%
2015 2016 2017 2018 2019 2020 2021
Potential GDP GDP Growth
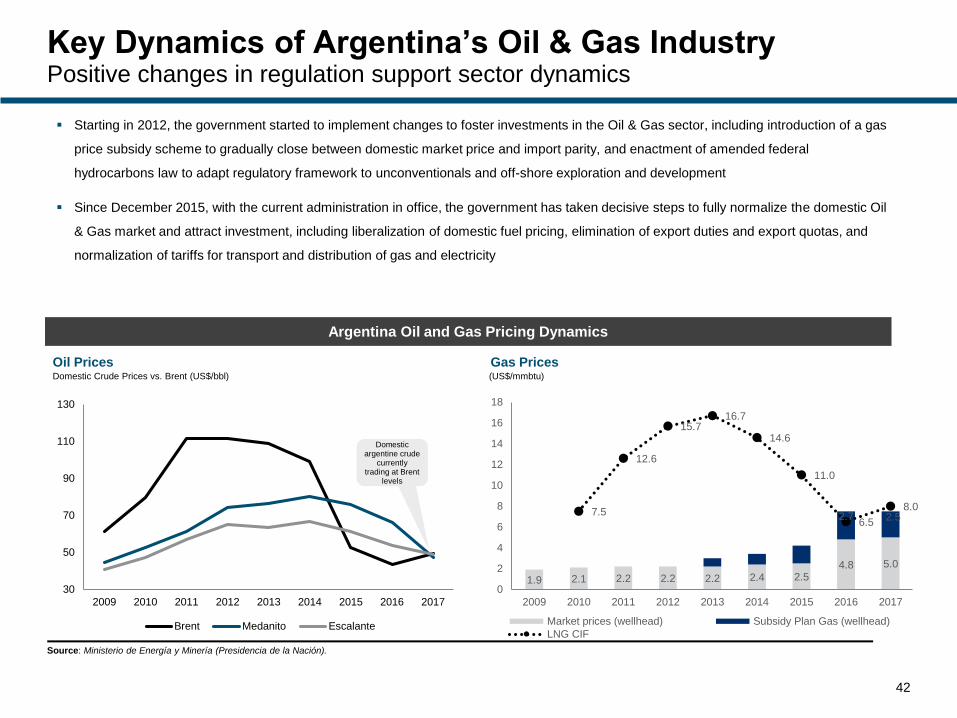
Key Dynamics of Argentina’s Oil & Gas IndustryPositive changes in regulation support sector dynamics
42
Argentina Oil and Gas Pricing Dynamics
Starting in 2012, the government started to implement changes to foster investments in the Oil & Gas sector, including introduction of a gas
price subsidy scheme to gradually close between domestic market price and import parity, and enactment of amended federal
hydrocarbons law to adapt regulatory framework to unconventionals and off-shore exploration and development
Since December 2015, with the current administration in office, the government has taken decisive steps to fully normalize the domestic Oil
& Gas market and attract investment, including liberalization of domestic fuel pricing, elimination of export duties and export quotas, and
normalization of tariffs for transport and distribution of gas and electricity
30
50
70
90
110
130
2009 2010 2011 2012 2013 2014 2015 2016 2017
Brent Medanito Escalante
Domestic argentine crude
currently trading at Brent
levels
Oil PricesDomestic Crude Prices vs. Brent (US$/bbl)
Gas Prices(US$/mmbtu)
Source: Ministerio de Energía y Minería (Presidencia de la Nación).
1.9 2.1 2.2 2.2 2.2 2.4 2.54.8 5.0
2.7 2.57.5
12.6
15.716.7
14.6
11.0
6.5
8.0
0
2
4
6
8
10
12
14
16
18
2009 2010 2011 2012 2013 2014 2015 2016 2017
Market prices (wellhead) Subsidy Plan Gas (wellhead)
LNG CIF