Embed Size (px)
Citation preview
Bharti AirtelManagement Presentation – Feb 2016
Disclaimer
Certain numbers in this presentation have been rounded off for ease of representation
The information contained in this presentation is only current as of its date. All actions and statements made herein or otherwise shall be subject to the applicablelaws and regulations as amended from time to time. There is no representation that all information relating to the context has been taken care off in the presentationand neither we undertake any obligation as to the regular updating of the information as a result of new information, future events or otherwise. We will accept noliability whatsoever for any loss arising directly or indirectly from the use of, reliance of any information contained in this presentation or for any omission of theinformation. The information shall not be distributed or used by any person or entity in any jurisdiction or countries were such distribution or use would be contrary tothe applicable laws or Regulations. It is advised that prior to acting upon this presentation independent consultation / advise may be obtained and necessary duediligence, investigation etc may be done at your end. You may also contact us directly for any questions or clarifications at our end.
This presentation contain certain statements of future expectations and other forward-looking statements, including those relating to our general business plans andstrategy, our future financial condition and growth prospects, and future developments in our industry and our competitive and regulatory environment. In addition tostatements which are forward looking by reason of context, the words ‘may, will, should, expects, plans, intends, anticipates, believes, estimates, predicts, potential orcontinue’ and similar expressions identify forward looking statements.
Actual results, performances or events may differ materially from these forward-looking statements including the plans, objectives, expectations, estimates andintentions expressed in forward looking statements due to a number of factors, including without limitation future changes or developments in our business, ourcompetitive environment, telecommunications technology and application, and political, economic, legal and social conditions in India. It is cautioned that theforegoing list is not exhaustive“The information contained herein does not constitute an offer of securities for sale in the United States. Securities may not be sold in the United States absentregistration or an exemption from registration under the U.S. Securities Act of 1933, as amended. Any public offering of securities to be made in the United Stateswill be made by means of a prospectus and will contain detailed information about the Company and its management, as well as financial statements. No money,securities or other consideration is being solicited, and, if sent in response to the information contained herein, will not be accepted.”
Investor Relations :- http://www.airtel.inFor any queries, write to: [email protected]
2
Agenda• Introduction to Bharti Airtel
• Industry Themes
• Bharti Airtel: Growth Opportunities
• Key Performance Indicators
• Other Businesses
• Financial Overview
• Leadership
3
BHARTI AIRTEL:
WHO WE ARE
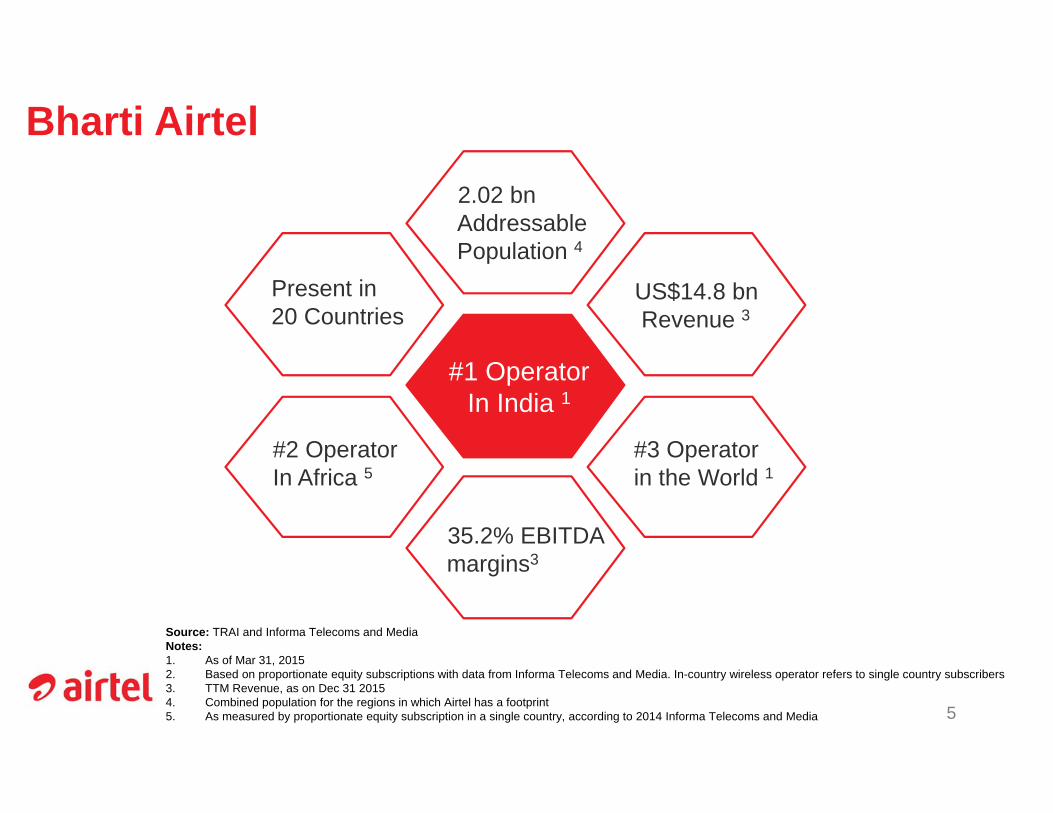
Bharti Airtel2.02 bn Addressable Population 4
US$14.8 bn Revenue 3
Present in20 Countries
#1 OperatorIn India 1
#2 OperatorIn Africa 5
35.2% EBITDA margins3
#3 Operatorin the World 1
Source: TRAI and Informa Telecoms and MediaNotes:1. As of Mar 31, 20152. Based on proportionate equity subscriptions with data from Informa Telecoms and Media. In-country wireless operator refers to single country subscribers 3. TTM Revenue, as on Dec 31 20154. Combined population for the regions in which Airtel has a footprint5. As measured by proportionate equity subscription in a single country, according to 2014 Informa Telecoms and Media 5
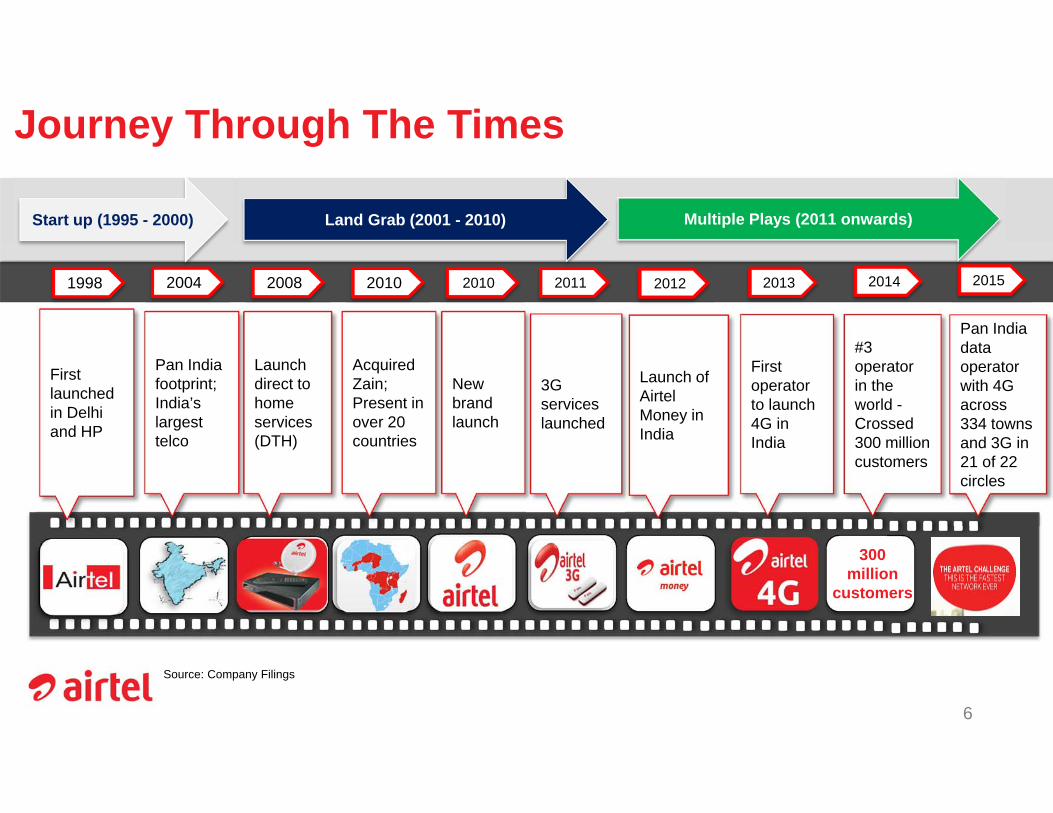
1998 2004
300 million
customers
First launched in Delhi and HP
Pan India footprint; India’s largest telco
2008
Launch direct to home services (DTH)
2010
Acquired Zain; Present in over 20 countries
2010
New brand launch
2011
3G services launched
2013
First operator to launch 4G in India
2014
#3 operator in the world -Crossed 300 million customers
Source: Company Filings
Start up (1995 - 2000) Land Grab (2001 - 2010) Multiple Plays (2011 onwards)
Journey Through The Times
Launch of Airtel Money in India
2012
6
2015
Pan India data operator with 4G across 334 towns and 3G in 21 of 22 circles
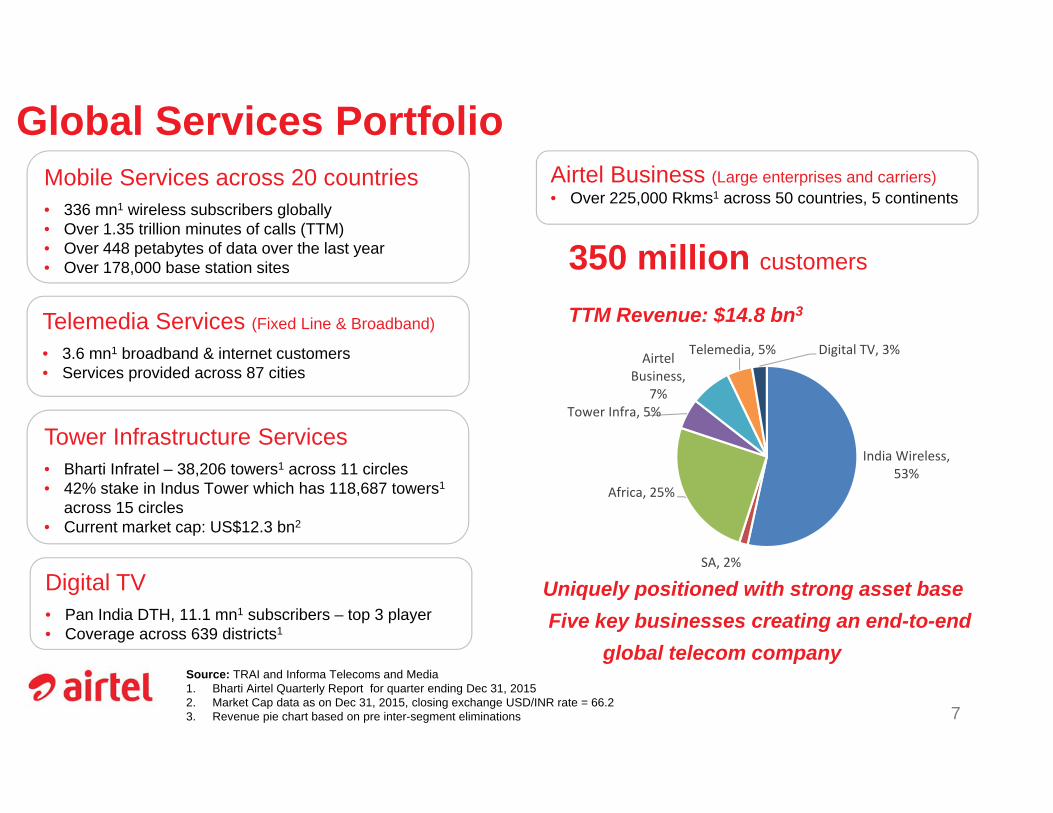
Global Services Portfolio
Source: TRAI and Informa Telecoms and Media1. Bharti Airtel Quarterly Report for quarter ending Dec 31, 20152. Market Cap data as on Dec 31, 2015, closing exchange USD/INR rate = 66.23. Revenue pie chart based on pre inter-segment eliminations 7
Mobile Services across 20 countries• 336 mn1 wireless subscribers globally• Over 1.35 trillion minutes of calls (TTM)• Over 448 petabytes of data over the last year• Over 178,000 base station sites 350 million customers
TTM Revenue: $14.8 bn3Telemedia Services (Fixed Line & Broadband)
• 3.6 mn1 broadband & internet customers• Services provided across 87 cities
Digital TV• Pan India DTH, 11.1 mn1 subscribers – top 3 player• Coverage across 639 districts1
Airtel Business (Large enterprises and carriers)• Over 225,000 Rkms1 across 50 countries, 5 continents
Tower Infrastructure Services• Bharti Infratel – 38,206 towers1 across 11 circles• 42% stake in Indus Tower which has 118,687 towers1
across 15 circles• Current market cap: US$12.3 bn2
India Wireless, 53%
SA, 2%
Africa, 25%
Tower Infra, 5%
Airtel Business,
7%
Telemedia, 5% Digital TV, 3%
Uniquely positioned with strong asset baseFive key businesses creating an end-to-end
global telecom company
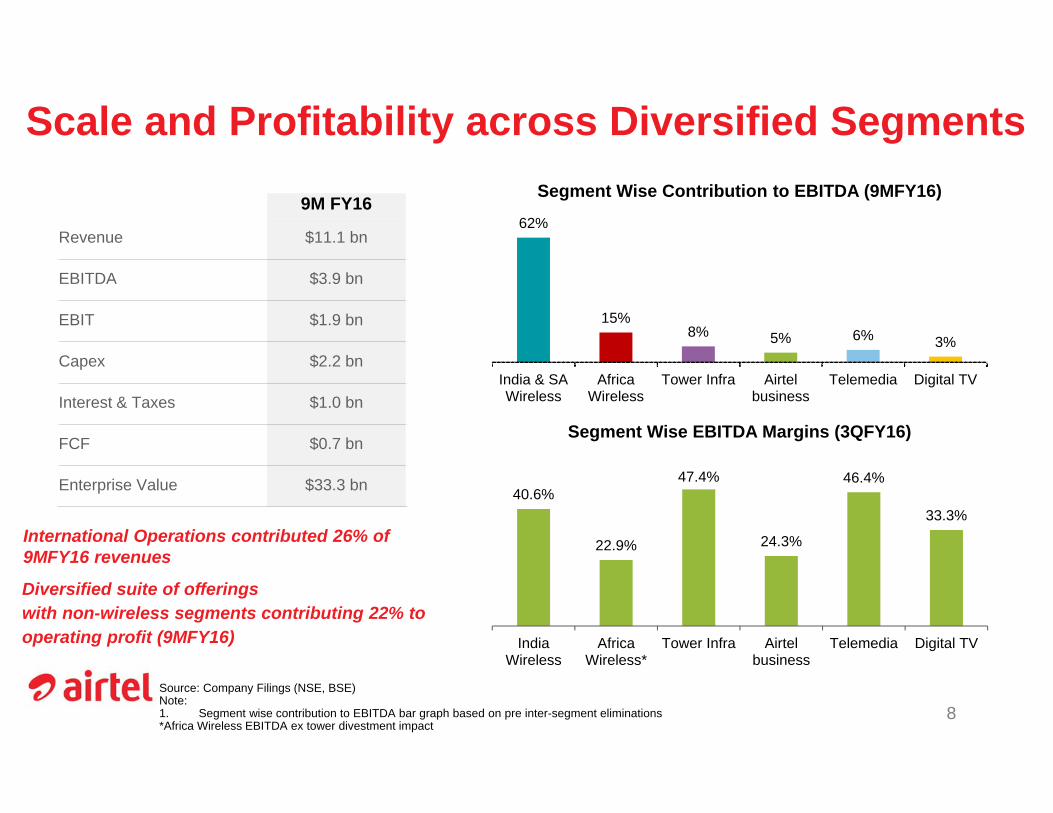
Scale and Profitability across Diversified Segments
Source: Company Filings (NSE, BSE)Note: 1. Segment wise contribution to EBITDA bar graph based on pre inter-segment eliminations*Africa Wireless EBITDA ex tower divestment impact
Diversified suite of offerings with non-wireless segments contributing 22% to operating profit (9MFY16)
8
9M FY16
Revenue $11.1 bn
EBITDA $3.9 bn
EBIT $1.9 bn
Capex $2.2 bn
Interest & Taxes $1.0 bn
FCF $0.7 bn
Enterprise Value $33.3 bn
International Operations contributed 26% of 9MFY16 revenues
Segment Wise Contribution to EBITDA (9MFY16)
Segment Wise EBITDA Margins (3QFY16)
62%
15%8% 5% 6% 3%
India & SAWireless
AfricaWireless
Tower Infra Airtelbusiness
Telemedia Digital TV
40.6%
22.9%
47.4%
24.3%
46.4%
33.3%
IndiaWireless
AfricaWireless*
Tower Infra Airtelbusiness
Telemedia Digital TV

WELL POSITIONED
IN KEY GROWTH
MARKETS
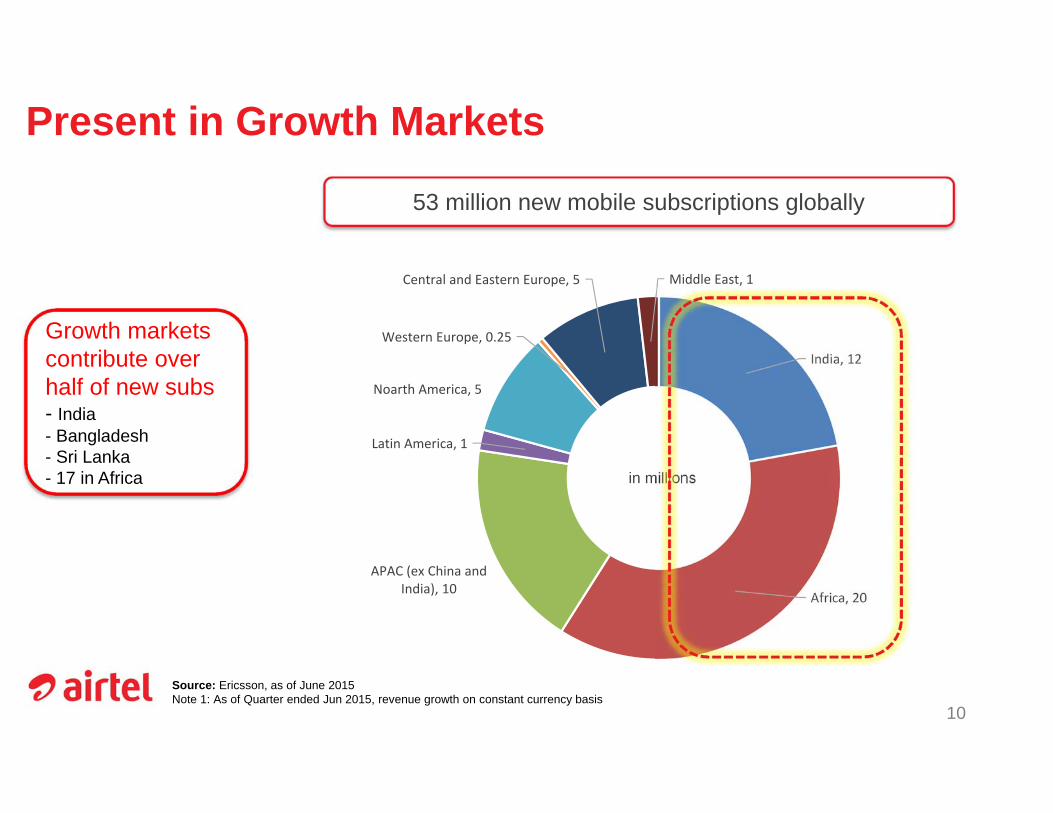
India, 12
Africa, 20
APAC (ex China and India), 10
Latin America, 1
Noarth America, 5
Western Europe, 0.25
Central and Eastern Europe, 5 Middle East, 1
Present in Growth Markets
Source: Ericsson, as of June 2015Note 1: As of Quarter ended Jun 2015, revenue growth on constant currency basis
10
Growth markets contribute over half of new subs- India- Bangladesh- Sri Lanka- 17 in Africa
53 million new mobile subscriptions globally
in millions
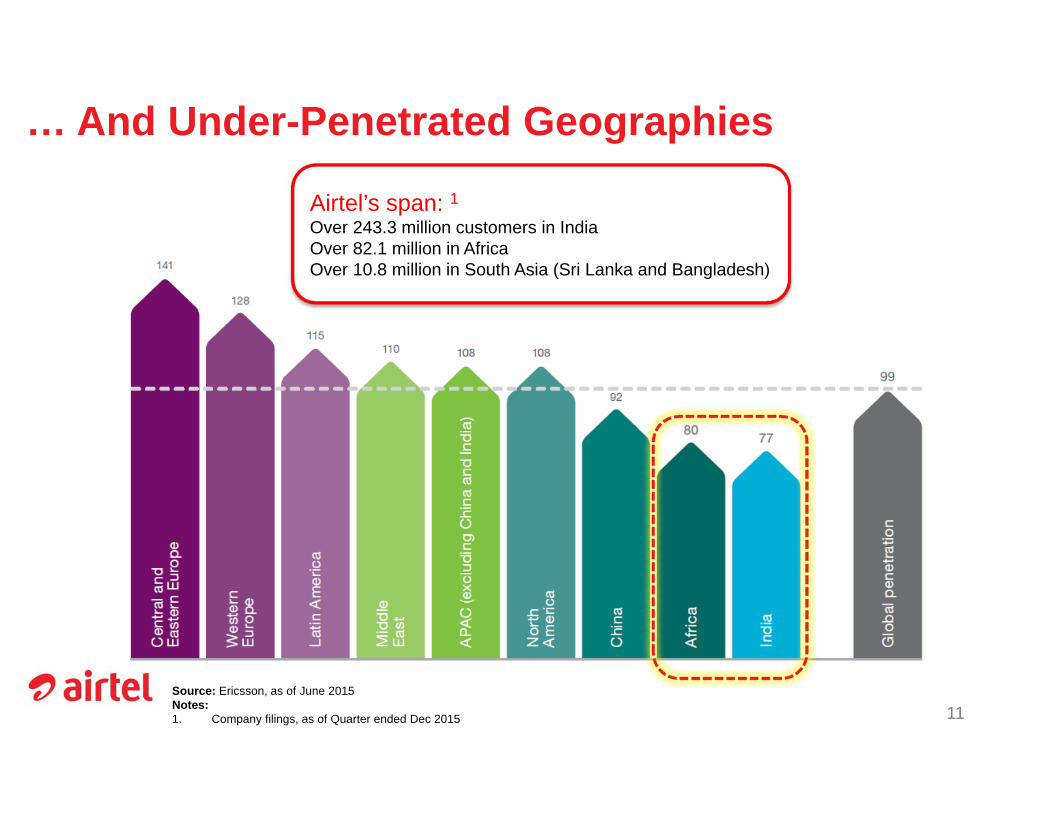
… And Under-Penetrated Geographies
Source: Ericsson, as of June 2015Notes:1. Company filings, as of Quarter ended Dec 2015 11
Airtel’s span: 1Over 243.3 million customers in India Over 82.1 million in AfricaOver 10.8 million in South Asia (Sri Lanka and Bangladesh)
12
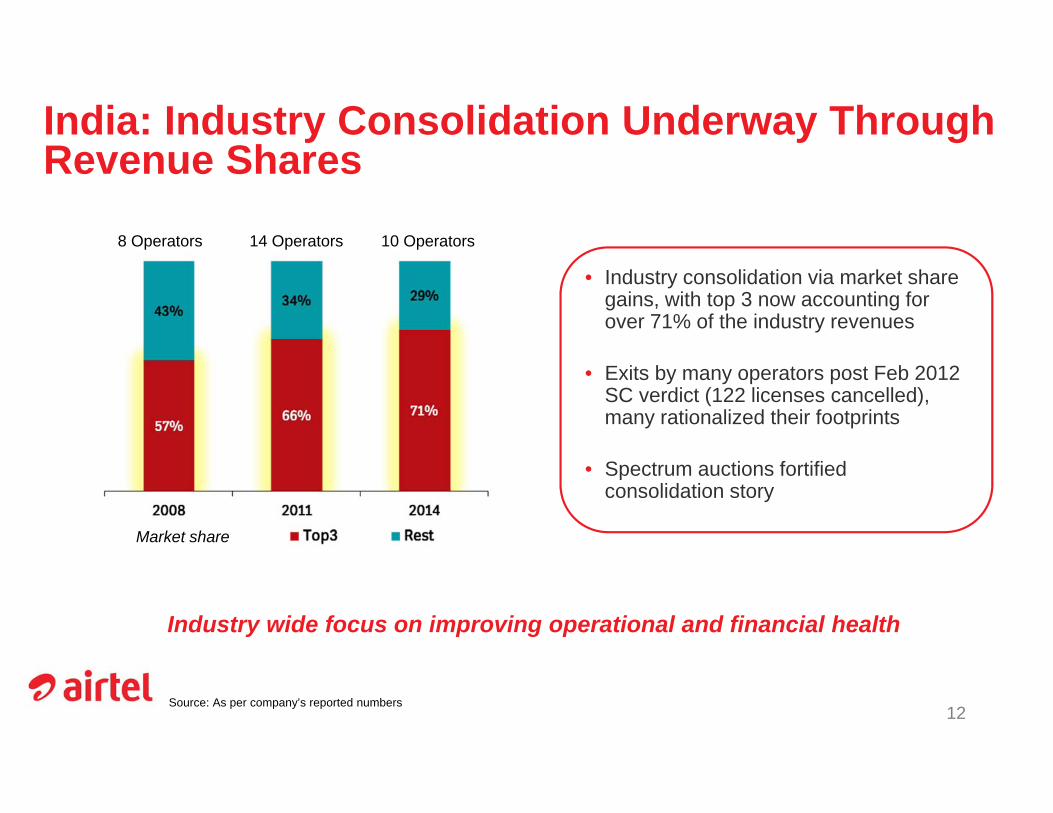
8 Operators 14 Operators 10 Operators
Market share
Industry wide focus on improving operational and financial health
• Industry consolidation via market share gains, with top 3 now accounting for over 71% of the industry revenues
• Exits by many operators post Feb 2012 SC verdict (122 licenses cancelled), many rationalized their footprints
• Spectrum auctions fortified consolidation story
Source: As per company’s reported numbers
India: Industry Consolidation Underway Through Revenue Shares

13 of 44
Africa: Then and Now
Invested for Growth in Africa
20152010
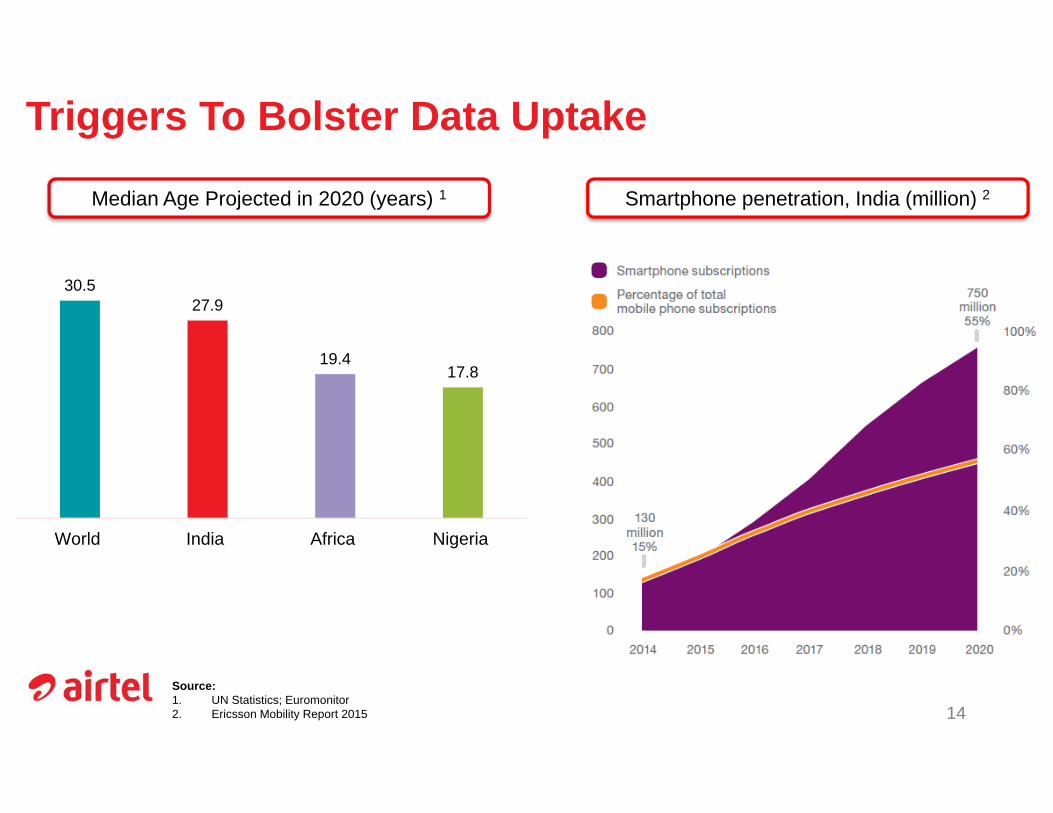
Triggers To Bolster Data Uptake
Source: 1. UN Statistics; Euromonitor 2. Ericsson Mobility Report 2015 14
30.527.9
19.417.8
World India Africa Nigeria
Smartphone penetration, India (million) 2Median Age Projected in 2020 (years) 1
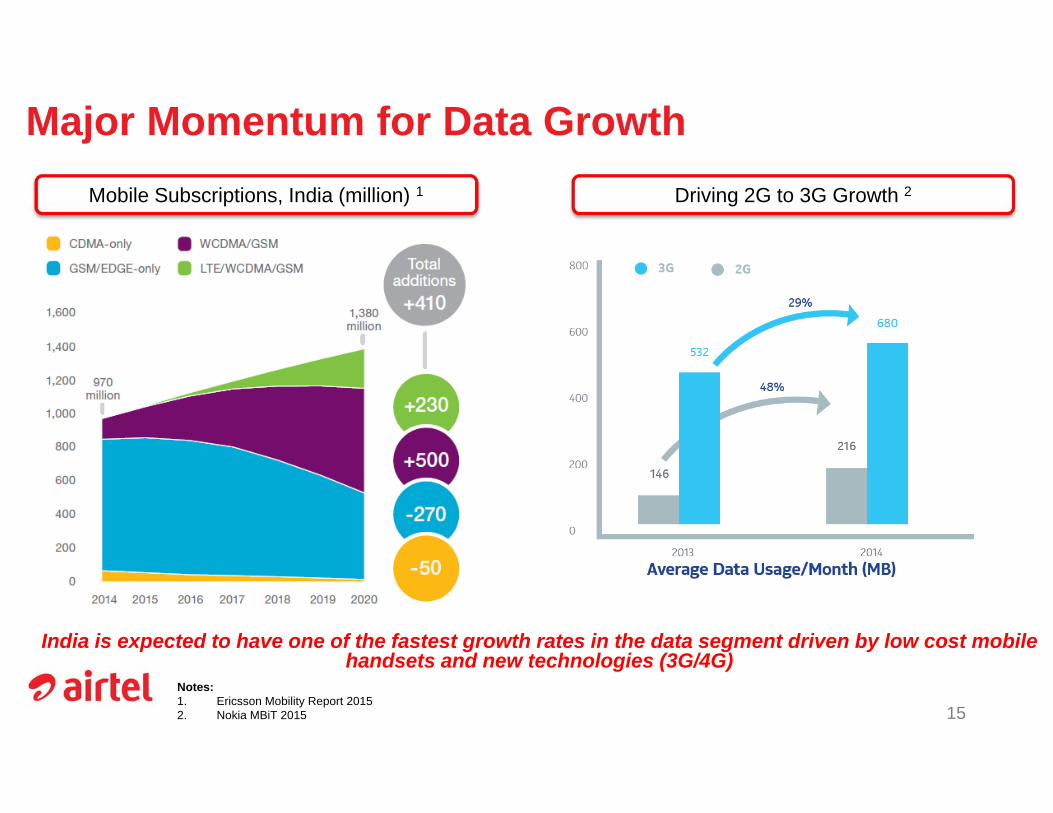
Major Momentum for Data Growth
Notes:1. Ericsson Mobility Report 20152. Nokia MBiT 2015 15
Mobile Subscriptions, India (million) 1
India is expected to have one of the fastest growth rates in the data segment driven by low cost mobile handsets and new technologies (3G/4G)
Driving 2G to 3G Growth 2

AIRTEL: GROWTH
OPPORTUNITIES
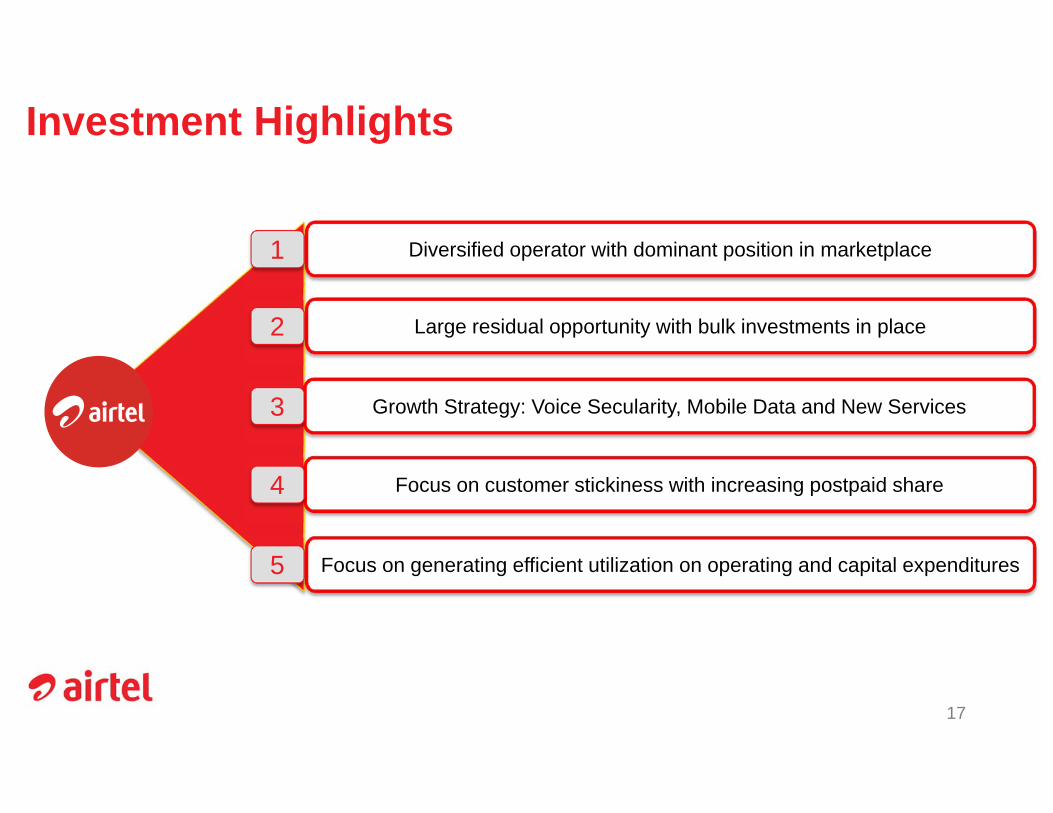
Investment Highlights
17
Diversified operator with dominant position in marketplace
Large residual opportunity with bulk investments in place
Growth Strategy: Voice Secularity, Mobile Data and New Services
Focus on customer stickiness with increasing postpaid share
Focus on generating efficient utilization on operating and capital expenditures
1
2
3
4
5
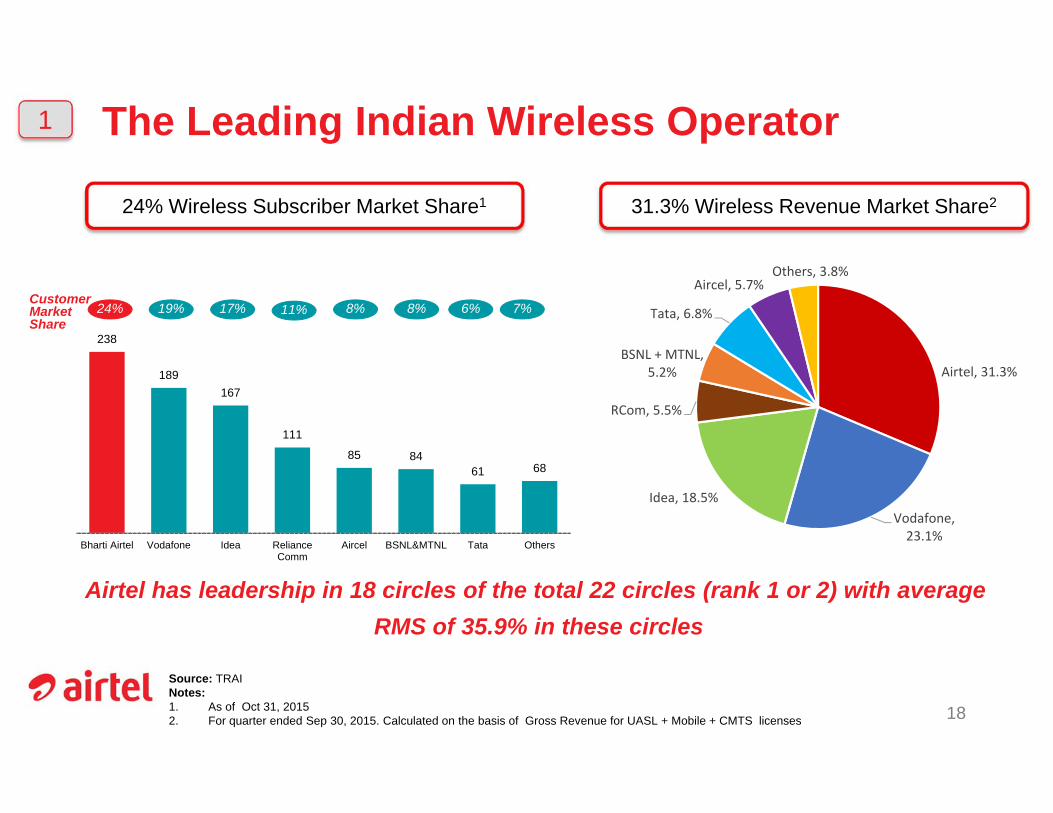
The Leading Indian Wireless Operator
8%Customer Market Share
24% 11%17% 8% 6%19% 7%
Airtel has leadership in 18 circles of the total 22 circles (rank 1 or 2) with averageRMS of 35.9% in these circles
Source: TRAINotes:1. As of Oct 31, 2015 2. For quarter ended Sep 30, 2015. Calculated on the basis of Gross Revenue for UASL + Mobile + CMTS licenses 18
31.3% Wireless Revenue Market Share224% Wireless Subscriber Market Share1
1
238
189167
111
85 8461 68
Bharti Airtel Vodafone Idea RelianceComm
Aircel BSNL&MTNL Tata Others
Airtel, 31.3%
Vodafone, 23.1%
Idea, 18.5%
RCom, 5.5%
BSNL + MTNL, 5.2%
Tata, 6.8%
Aircel, 5.7%Others, 3.8%
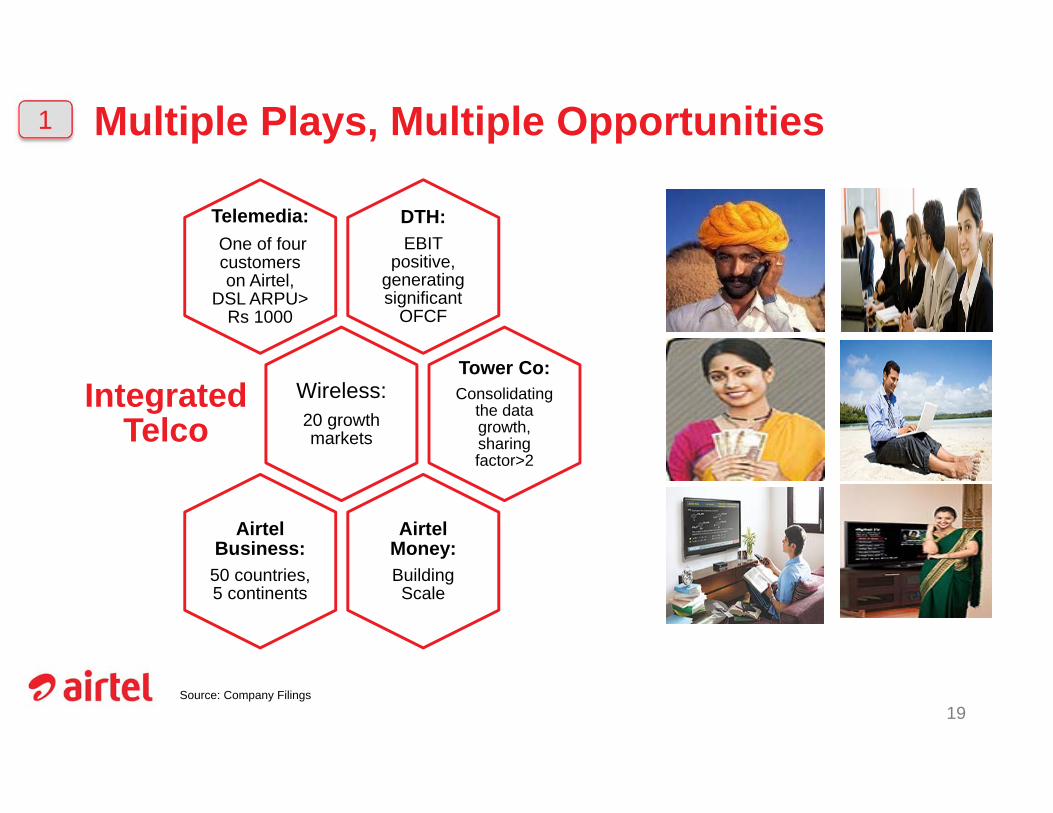
Multiple Plays, Multiple Opportunities
Source: Company Filings
19
DTH:EBIT
positive, generating significant
OFCF
Telemedia:One of four customers on Airtel,
DSL ARPU> Rs 1000
Wireless:20 growth markets
Integrated Telco
Tower Co:Consolidating
the data growth, sharing factor>2
Airtel Money:Building Scale
Airtel Business: 50 countries, 5 continents
1

India: Investments To Yield Results
Source: 1. Including Qualcomm licenses, excluding administered spectrum2. Annualized 9M Revenues for FY15, Utilization based on 2G/3G spectrum3. Ex 20 MHz BWA spectrum holding in 8 circles 20
Nominal Value of
liberalized spectrum at
USD 12 billion1
Industry leading
revenue2
yield/MHz at 2x avg with
same cost/MHz
Wide spectrum presence:
16.1%3
spectrum market share
Largest optical fiber
network amongst private players
Prime spectrum to yield data growth:
Virtually Pan India 3G &
4G
2
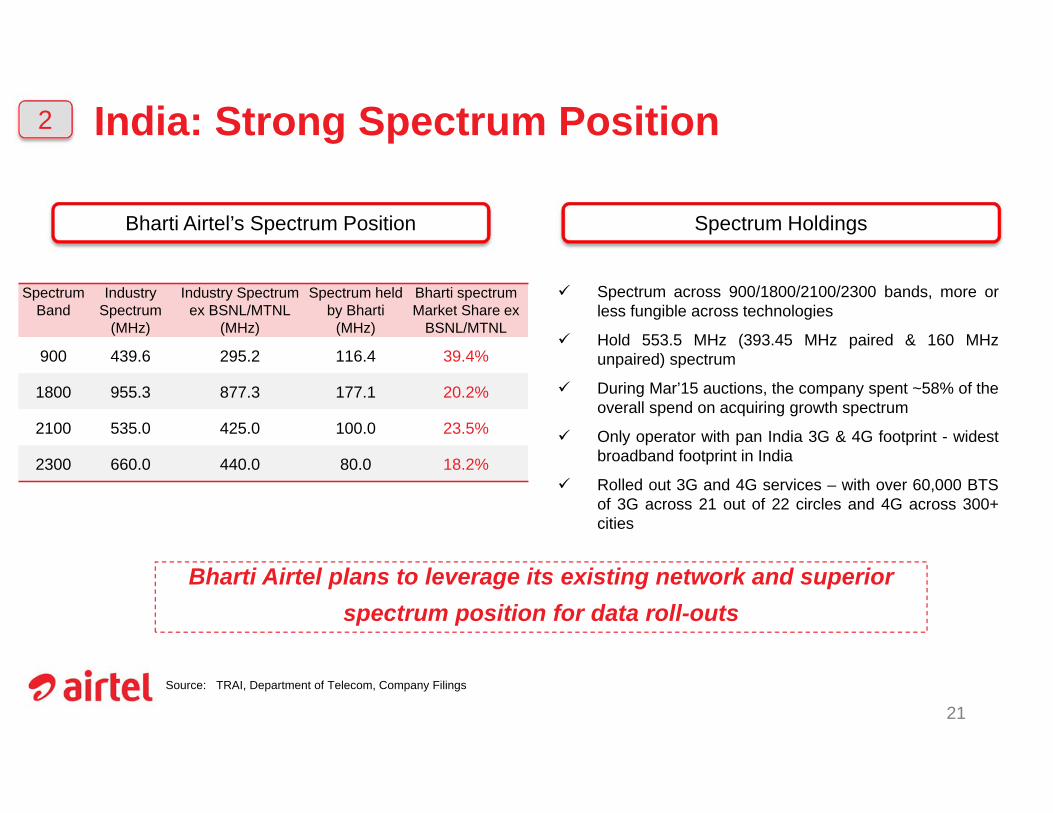
India: Strong Spectrum Position
Spectrum across 900/1800/2100/2300 bands, more orless fungible across technologies
Hold 553.5 MHz (393.45 MHz paired & 160 MHzunpaired) spectrum
During Mar’15 auctions, the company spent ~58% of theoverall spend on acquiring growth spectrum
Only operator with pan India 3G & 4G footprint - widestbroadband footprint in India
Rolled out 3G and 4G services – with over 60,000 BTSof 3G across 21 out of 22 circles and 4G across 300+cities
Source: TRAI, Department of Telecom, Company Filings
Bharti Airtel plans to leverage its existing network and superior spectrum position for data roll-outs
21
Bharti Airtel’s Spectrum Position Spectrum Holdings
Spectrum Band
Industry Spectrum
(MHz)
Industry Spectrum ex BSNL/MTNL
(MHz)
Spectrum held by Bharti
(MHz)
Bharti spectrum Market Share ex
BSNL/MTNL
900 439.6 295.2 116.4 39.4%
1800 955.3 877.3 177.1 20.2%
2100 535.0 425.0 100.0 23.5%
2300 660.0 440.0 80.0 18.2%
2
22
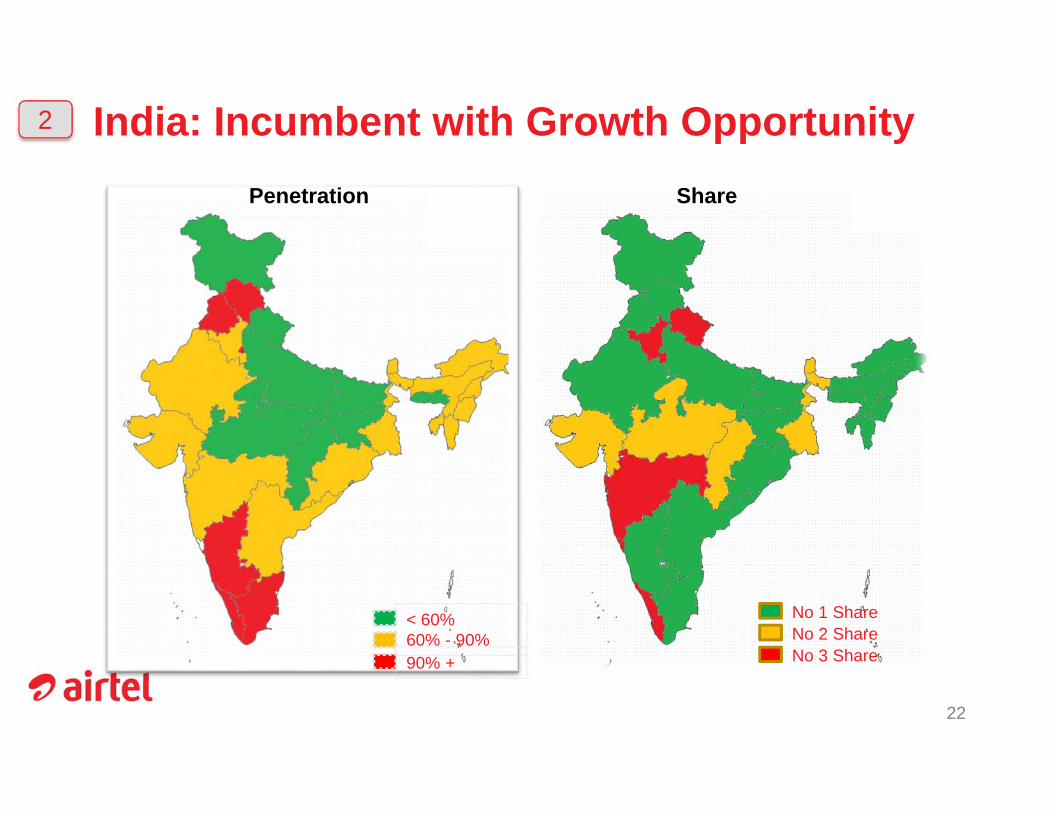
< 60% 60% - 90%90% +
Penetration
No 1 ShareNo 2 ShareNo 3 Share
Share
India: Incumbent with Growth Opportunity2
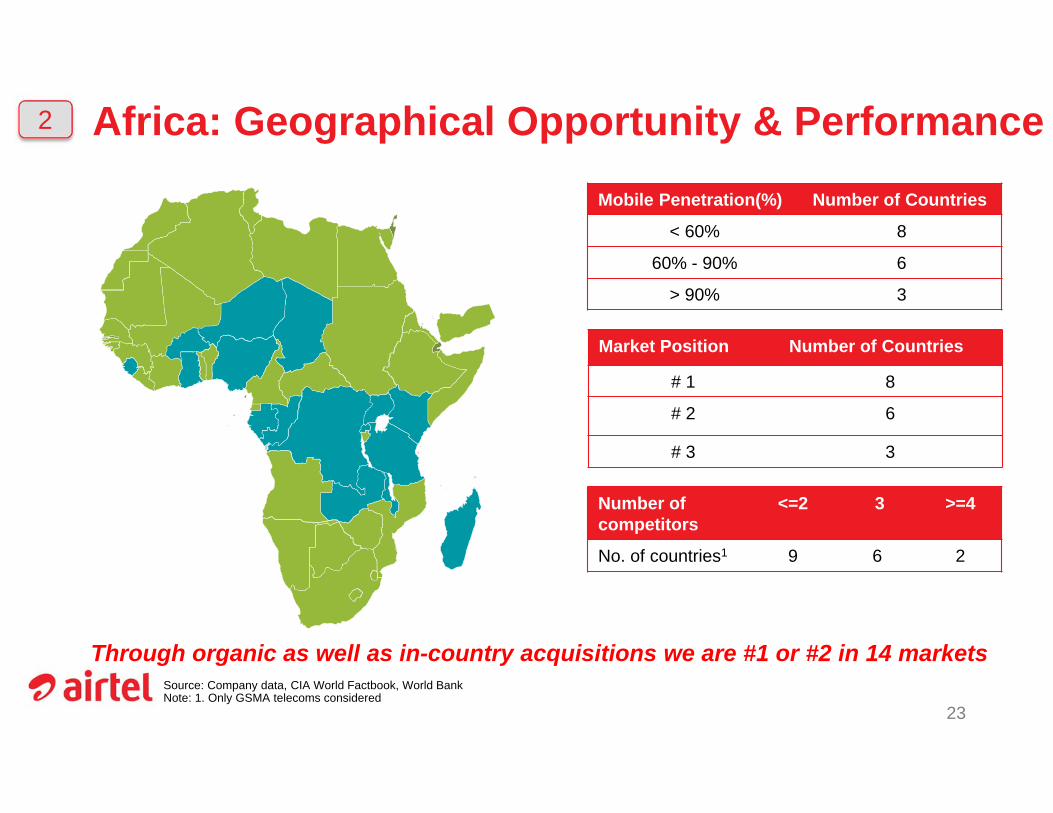
Africa: Geographical Opportunity & PerformanceMobile Penetration(%) Number of Countries
< 60% 8
60% - 90% 6
> 90% 3
Market Position Number of Countries
# 1 8
# 2 6
# 3 3
Source: Company data, CIA World Factbook, World BankNote: 1. Only GSMA telecoms considered
23
Through organic as well as in-country acquisitions we are #1 or #2 in 14 markets
Number ofcompetitors
<=2 3 >=4
No. of countries1 9 6 2
2

Value Growth
Volume Growth
24 of 44
Growth Lever: Voice Secularity
Significant headroom for value as well as volume upside on a secular basis
Carries over 1 trillion minutes
Secular Volume growth Y-o-Y
Significant gap between realized and rack rates
1 paisa upside adds $200 mn to top line
3

25 of 44
Growth Lever: Data Across 2G/3G/4G
Converged opportunity across technologies India’s first 4G network
Industry first initiatives –Infinity Plans, Wynk Music and
Movies
Smartphone Network:Unique alliances with Flipkart
and Samsung, Home delivery of Airtel SIM
Data comes at incrementally higher EBITDA margins as compared to voice
3

26
Largest 3G Network In India
Source:1. Company filings2. Ericsson
3G sites up 85% YoY 1 Expected Population Coverage Growth 2
3
41,850 48,825 52,886 62,447 77,551
29.3%33.3% 35.8%
41.8% 51.3%
0.0%
10.0%
20.0%
30.0%
40.0%
50.0%
60.0%
-
20,000
40,000
60,000
80,000
100,000
120,000
140,000
160,000
Q3'15 Q4'15 Q1'16 Q2'16 Q3'16
Total sites less 3G 3G sites % 3G sites
27
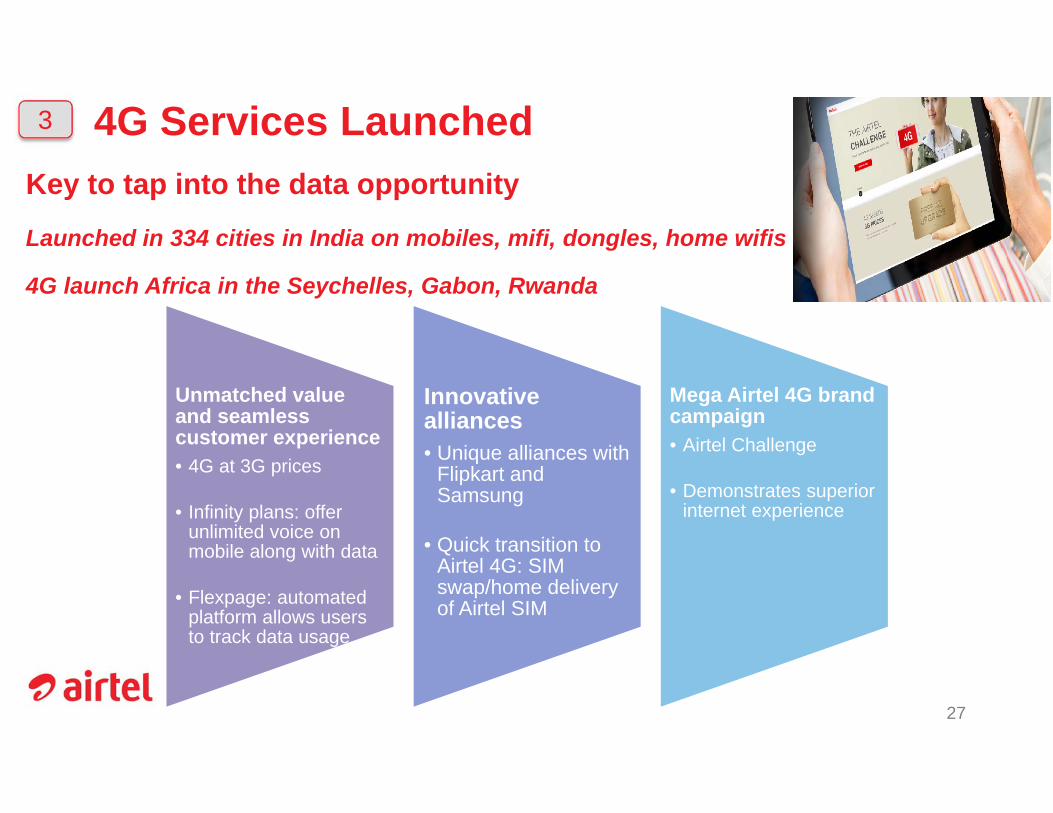
4G Services Launched Key to tap into the data opportunity
Launched in 334 cities in India on mobiles, mifi, dongles, home wifis
4G launch Africa in the Seychelles, Gabon, Rwanda
3
Unmatched value and seamless customer experience• 4G at 3G prices
• Infinity plans: offer unlimited voice on mobile along with data
• Flexpage: automated platform allows users to track data usage
Innovative alliances• Unique alliances with
Flipkart and Samsung
• Quick transition to Airtel 4G: SIM swap/home delivery of Airtel SIM
Mega Airtel 4G brand campaign• Airtel Challenge
• Demonstrates superior internet experience
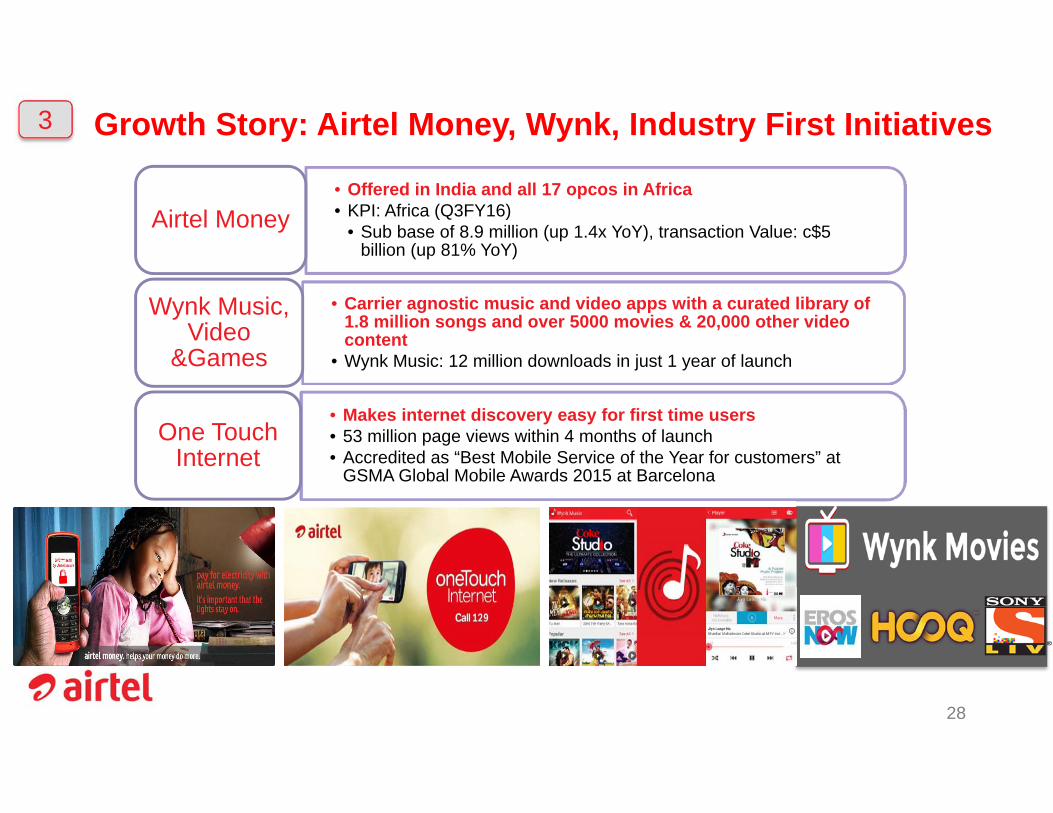
Growth Story: Airtel Money, Wynk, Industry First Initiatives
28
• Offered in India and all 17 opcos in Africa• KPI: Africa (Q3FY16)
• Sub base of 8.9 million (up 1.4x YoY), transaction Value: c$5 billion (up 81% YoY)
Airtel Money
• Carrier agnostic music and video apps with a curated library of 1.8 million songs and over 5000 movies & 20,000 other video content
• Wynk Music: 12 million downloads in just 1 year of launch
Wynk Music, Video
&Games
• Makes internet discovery easy for first time users• 53 million page views within 4 months of launch• Accredited as “Best Mobile Service of the Year for customers” at
GSMA Global Mobile Awards 2015 at Barcelona
One Touch Internet
3

29
• Airtel has industry wide lowest churn at 3.4%
• Led to rationalization of Gross Acquisition Costs driving INR 10bn savings
Source: As per company’s reported numbers
Quality Subscriber AcquisitionsIndia: Churn %
• In Africa, churn decreased from 7% in June 2014 to 5.9% in Dec 2015
Africa: Churn %
4
5.50%
5.80%
5.40%
5.80% 5.90%
Dec-14 Mar-15 Jun-15 Sep-15 Dec-15
2.70%2.50%
3.30%3.50% 3.40%
Dec‐14 Mar‐15 Jun‐15 Sep‐15 Dec‐15
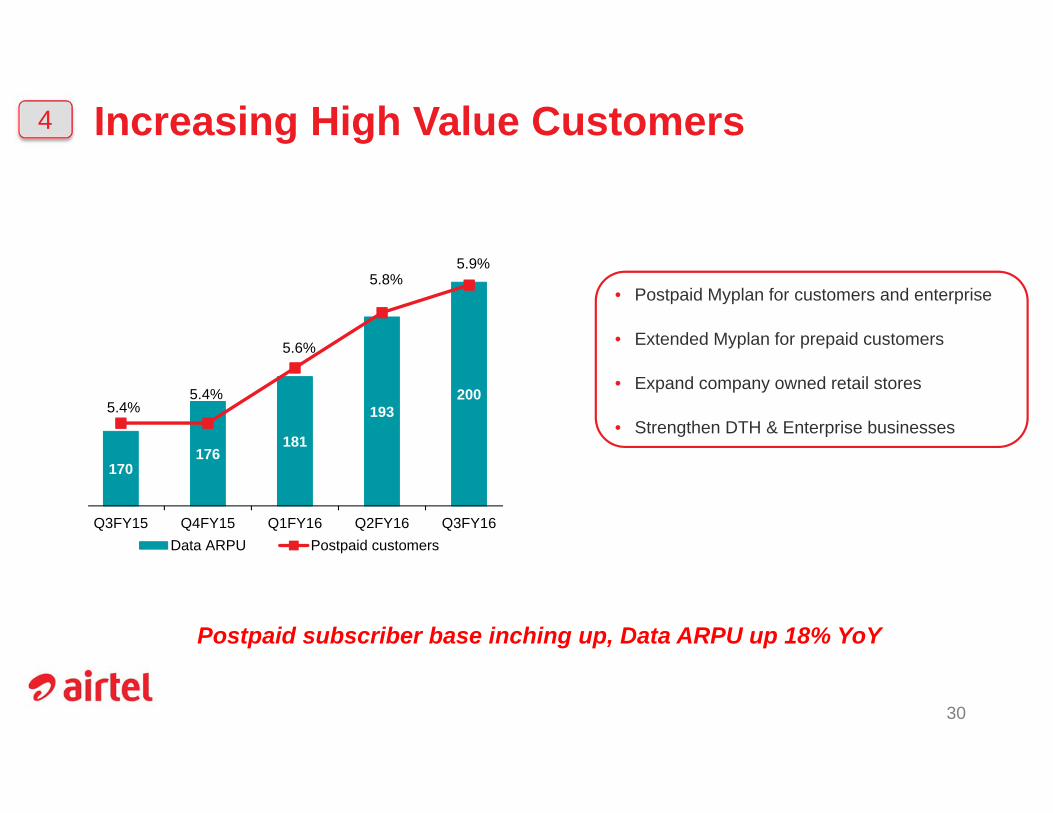
Increasing High Value Customers
30
• Postpaid Myplan for customers and enterprise
• Extended Myplan for prepaid customers
• Expand company owned retail stores
• Strengthen DTH & Enterprise businesses
Postpaid subscriber base inching up, Data ARPU up 18% YoY
4
170176
181
193200
5.4%5.4%
5.6%
5.8%5.9%
5.1%
5.2%
5.3%
5.4%
5.5%
5.6%
5.7%
5.8%
5.9%
6.0%
155
160
165
170
175
180
185
190
195
200
205
Q3FY15 Q4FY15 Q1FY16 Q2FY16 Q3FY16Data ARPU Postpaid customers
31
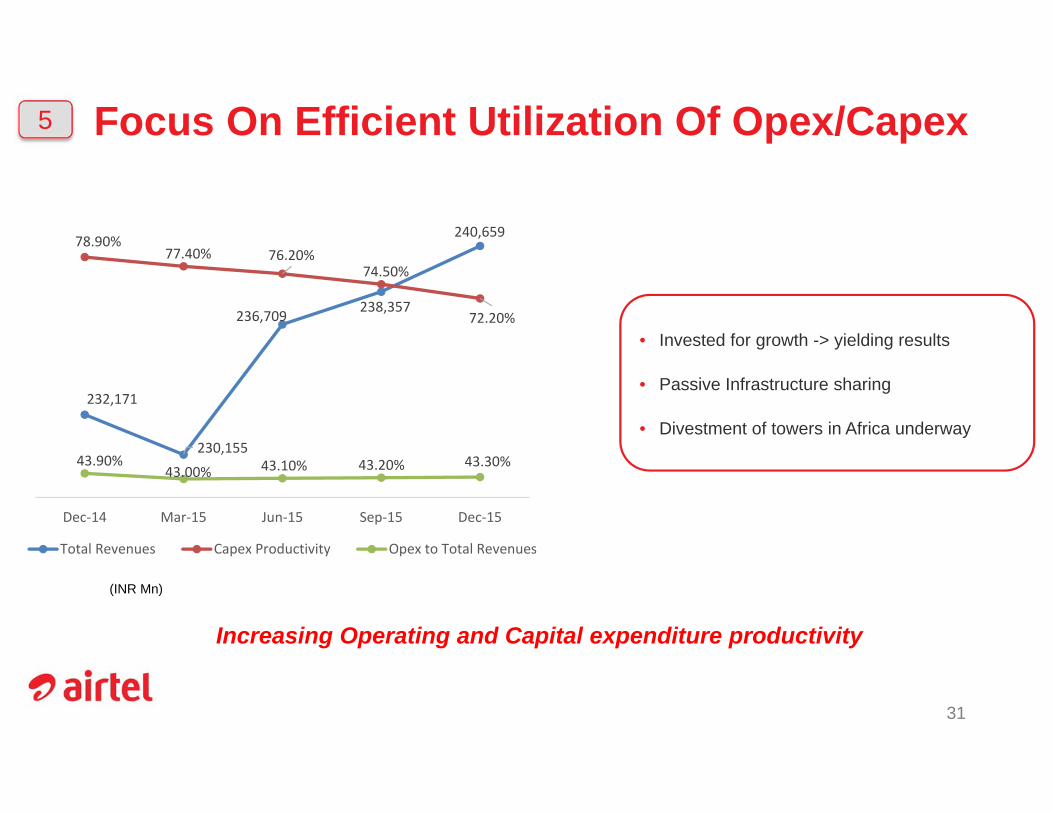
Focus On Efficient Utilization Of Opex/Capex
(INR Mn)
Increasing Operating and Capital expenditure productivity
• Invested for growth -> yielding results
• Passive Infrastructure sharing
• Divestment of towers in Africa underway
5
232,171
230,155
236,709 238,357
240,65978.90%
77.40% 76.20%74.50%
72.20%
43.90%43.00% 43.10% 43.20% 43.30%
40.00%
45.00%
50.00%
55.00%
60.00%
65.00%
70.00%
75.00%
80.00%
85.00%
,000
,000
,000
,000
,000
,000
,000
,000
Dec‐14 Mar‐15 Jun‐15 Sep‐15 Dec‐15
Total Revenues Capex Productivity Opex to Total Revenues
KEY PERFORMANCE
INDICATORS
267,485
277,869
290,802
282,138
290,459
Q3FY15 Q4FY15 Q1FY16 Q2FY16 Q3FY16
217
226231
235
243
Q3FY15 Q4FY15 Q1FY16 Q2FY16 Q3FY16
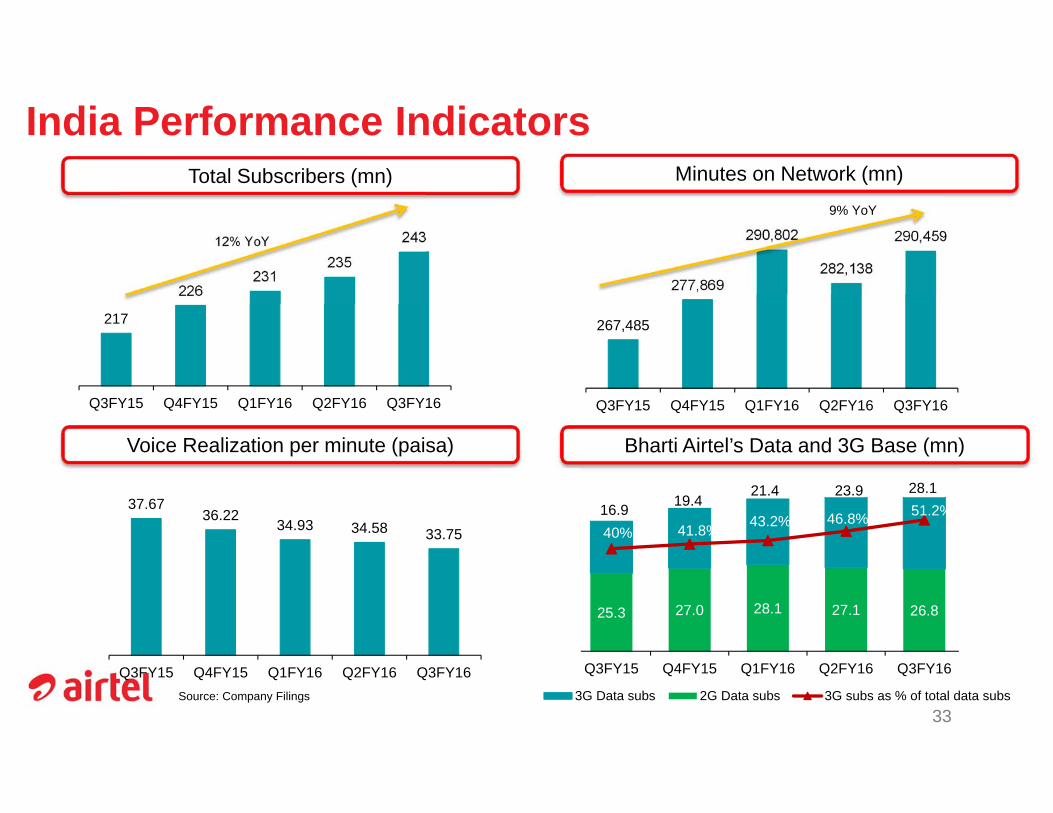
India Performance Indicators
Source: Company Filings
33
Total Subscribers (mn) Minutes on Network (mn)
Voice Realization per minute (paisa)
12% YoY
9% YoY
Bharti Airtel’s Data and 3G Base (mn)
37.6736.22
34.93 34.58 33.75
Q3FY15 Q4FY15 Q1FY16 Q2FY16 Q3FY16
25.3 27.0 28.1 27.1 26.8
16.9 19.421.4 23.9 28.1
40% 41.8% 43.2% 46.8% 51.2%
0.0%
20.0%
40.0%
60.0%
0.0
10.0
20.0
30.0
40.0
50.0
Q3FY15 Q4FY15 Q1FY16 Q2FY16 Q3FY16
3G Data subs 2G Data subs 3G subs as % of total data subs
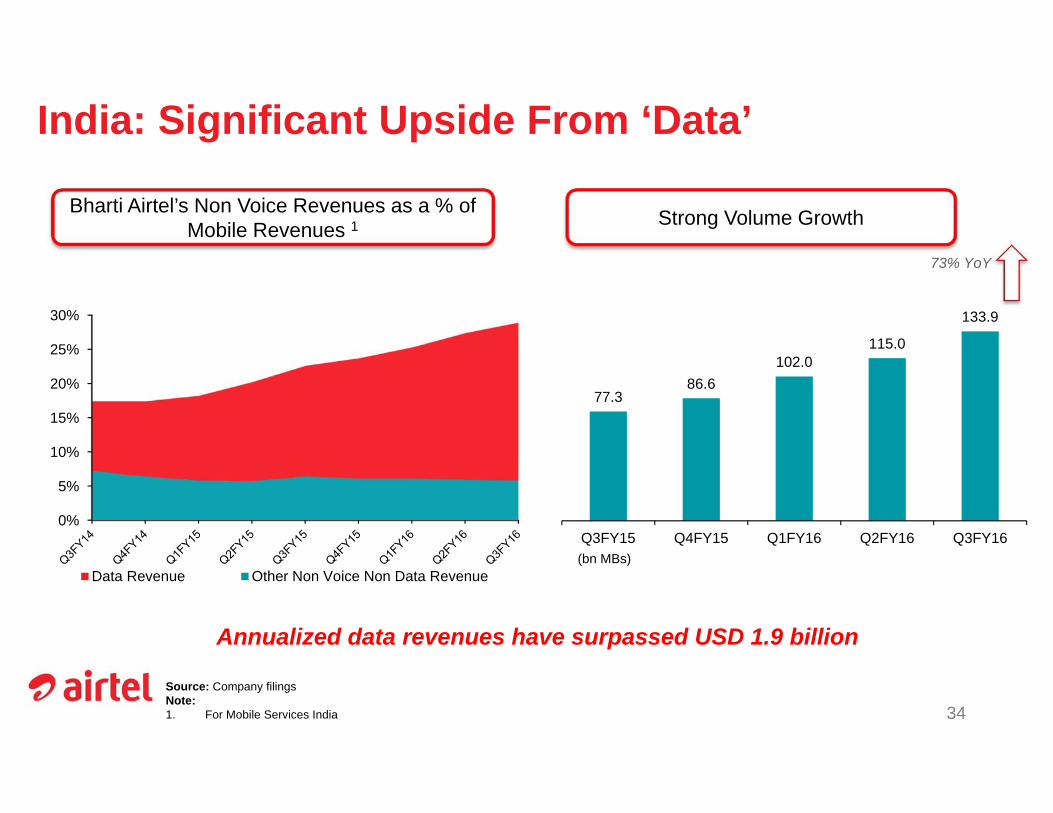
77.386.6
102.0115.0
133.9
Q3FY15 Q4FY15 Q1FY16 Q2FY16 Q3FY16
India: Significant Upside From ‘Data’
Source: Company filingsNote:1. For Mobile Services India 34
Bharti Airtel’s Non Voice Revenues as a % of Mobile Revenues 1
Annualized data revenues have surpassed USD 1.9 billion
73% YoY
Strong Volume Growth
(bn MBs)
0%
5%
10%
15%
20%
25%
30%
Data Revenue Other Non Voice Non Data Revenue

284357
150 162 184
18,347
18,819 19,146 19,33019,712
14,000
16,000
18,000
20,000
050
100150200250300350400
Q3FY15 Q4FY15 Q1FY16 Q2FY16 Q3FY16
Capex (US$m) Number of Sites
140 137 141 145 138
Q3FY15 Q4FY15 Q1FY16 Q2FY16 Q3FY16
MoU per sub. per month
74.6 76.3 78.3 80.8 82.1
30.4 31.0 32.8 34.6 33.7
0.0
5.0
10.0
15.0
20.0
25.0
30.0
35.0
0.0
20.0
40.0
60.0
80.0
100.0
Q3FY15 Q4FY15 Q1FY16 Q2FY16 Q3FY16Subscribers (m) Total Minutes (bn)
Africa Performance Indicators
Source: Company Filings35
Total Subscribers (mn) and Total Minutes (bn) Minutes of Usage per sub
ARPU (USD) Capex (USDm) and Number of Sites
4.6
4.3 4.3 4.34.2
Q3FY15 Q4FY15 Q1FY16 Q2FY16 Q3FY16ARPU (US$)
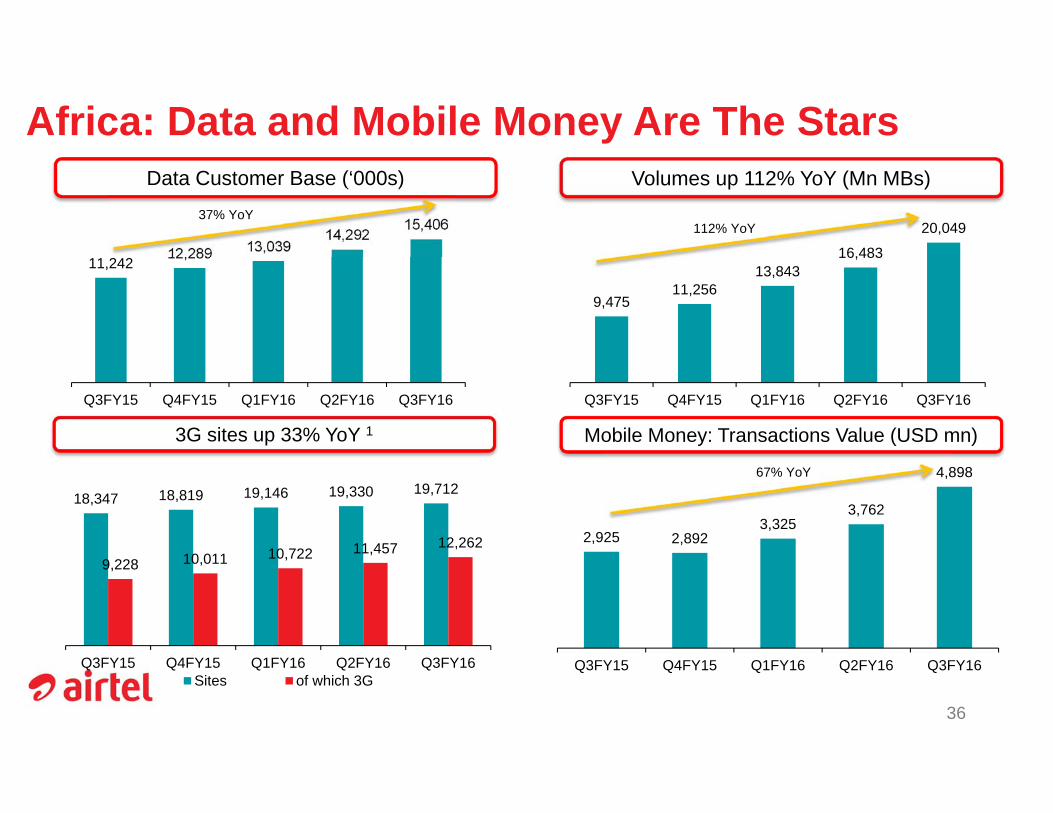
11,24212,289 13,039
14,29215,406
Q3FY15 Q4FY15 Q1FY16 Q2FY16 Q3FY16
Africa: Data and Mobile Money Are The Stars
36
Volumes up 112% YoY (Mn MBs)Data Customer Base (‘000s)
Mobile Money: Transactions Value (USD mn)
37% YoY112% YoY
67% YoY
3G sites up 33% YoY 1
9,47511,256
13,84316,483
20,049
Q3FY15 Q4FY15 Q1FY16 Q2FY16 Q3FY16
18,347 18,819 19,146 19,330 19,712
9,228 10,011 10,722 11,457 12,262
Q3FY15 Q4FY15 Q1FY16 Q2FY16 Q3FY16Sites of which 3G
2,925 2,8923,325
3,762
4,898
Q3FY15 Q4FY15 Q1FY16 Q2FY16 Q3FY16
OTHER
BUSINESSES

Telemedia Services
Leading private operator with market share of 13.43%1
Source: Company FilingsNote 1: As of Aug 2015, TRAI report
• 9MFY16: 6% YoY revenue growth, 24% YoYEBITDA growth
• Pan-India presence of 90 cities
• Operates in the entire broadband continuum -fixed line voice and high speed broadband across Homes and Office segments, broadband (via DSL), IPTV, internet leased line and MPLS services
• Key Performance Indicators – Customer base: 3.6 million– Broadband penetration at 48.1% of customer base– Average ARPU of $16.1 per month for quarter
ended Dec 31, 2015
38
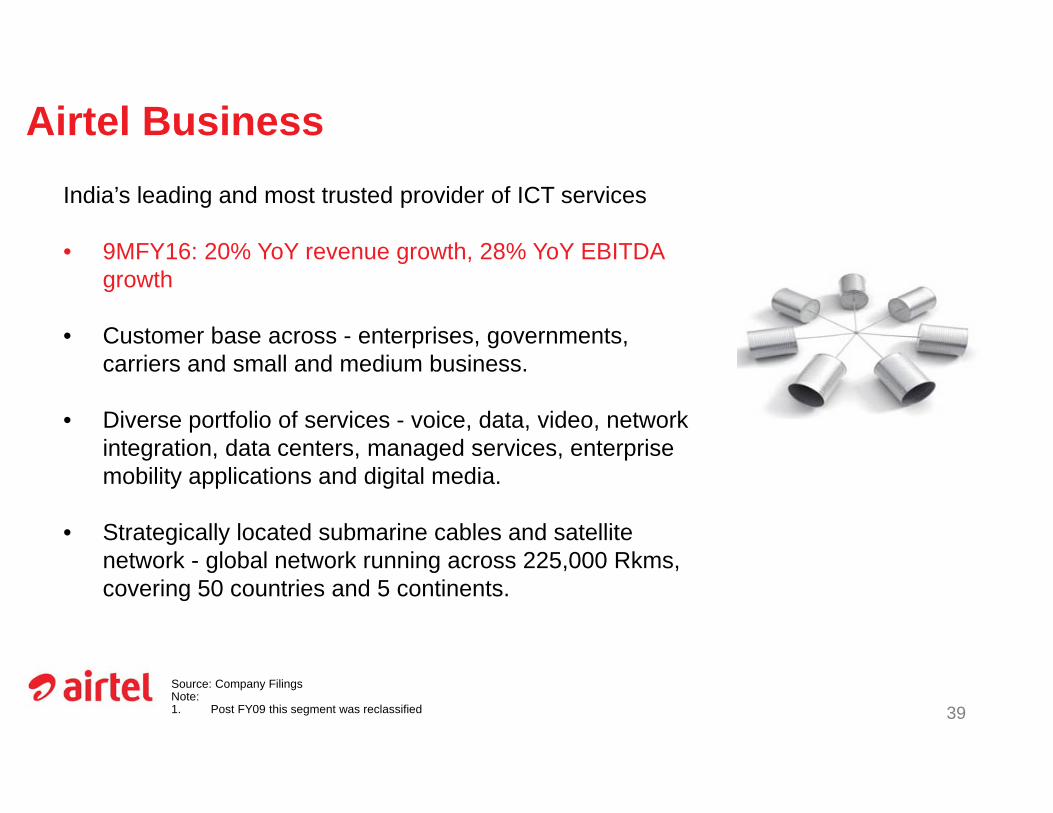
Airtel Business
Source: Company FilingsNote:1. Post FY09 this segment was reclassified
India’s leading and most trusted provider of ICT services
• 9MFY16: 20% YoY revenue growth, 28% YoY EBITDA growth
• Customer base across - enterprises, governments, carriers and small and medium business.
• Diverse portfolio of services - voice, data, video, network integration, data centers, managed services, enterprise mobility applications and digital media.
• Strategically located submarine cables and satellite network - global network running across 225,000 Rkms, covering 50 countries and 5 continents.
39

Digital TV Services• 9MFY16: 16% YoY revenue growth, 55% YoY EBITDA growth
• First Company in India which provides real integration of all the three screens viz. television, mobile and computer enabling our customers to record their favorite TV programs through mobile and web
• Launched “Airtel Digital TV” service in October 2008 as fifth operator providing Direct-to-Home (DTH) services in India
– Subscriber base of ~11.1 million subscribers– Lowest industry churn of 0.7%– Present across 639 districts– Offer 430 channels including 22 HD channels and 4 interactive services– Also offers High Definition (HD) Set Top Boxes and Digital TV Recorders
with 3D capabilities delivering superior customer experience
• Key Performance Indicators (Q3FY16)– Average ARPU of $3.5 per month for quarter ended Dec 31, 2015
40
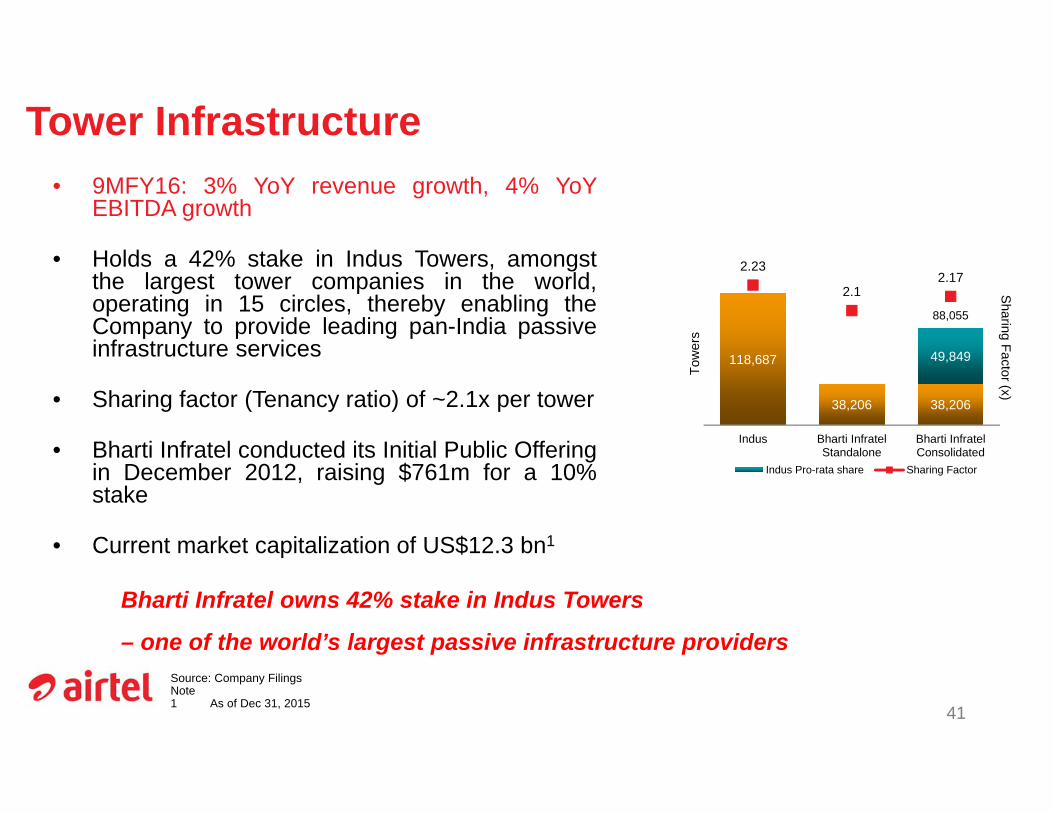
Tower Infrastructure• 9MFY16: 3% YoY revenue growth, 4% YoY
EBITDA growth
• Holds a 42% stake in Indus Towers, amongstthe largest tower companies in the world,operating in 15 circles, thereby enabling theCompany to provide leading pan-India passiveinfrastructure services
• Sharing factor (Tenancy ratio) of ~2.1x per tower
• Bharti Infratel conducted its Initial Public Offeringin December 2012, raising $761m for a 10%stake
• Current market capitalization of US$12.3 bn1
Bharti Infratel owns 42% stake in Indus Towers
– one of the world’s largest passive infrastructure providersSource: Company FilingsNote1 As of Dec 31, 2015
118,687
38,206 38,206
49,849
88,055
2.23
2.12.17
1.00
1.20
1.40
1.60
1.80
2.00
0
20,000
40,000
60,000
80,000
100,000
120,000
Indus Bharti InfratelStandalone
Bharti InfratelConsolidated
Sharing Factor (x)
Tow
ers
Indus Pro-rata share Sharing Factor
41
FINANCIAL
OVERVIEW

Steadily Improving Financials Consolidated revenues grew 6.6% YoY1
• India – Broad based revenue growth across mobile, DTH, enterprise segments– Revenues up 11.6% YoY on underlying basis
» Mobile revenues grew 10.1% YoY» DTH up 19% YoY» Airtel Business grew 19% YoY
• Africa– Revenue growth1 4.6% YoY– Airtel Money has 9.5 mn active customers, up 67% YoY, transacting close to $5 bn / quarter
• Strong operating leverage– EBITDA margin expansion2 of 150 bps YoY– Net Income up2 17.5% YoY
Notes:1. Adjusted for reduction in termination rates and Africa tower divestments.2. TTM
43
44
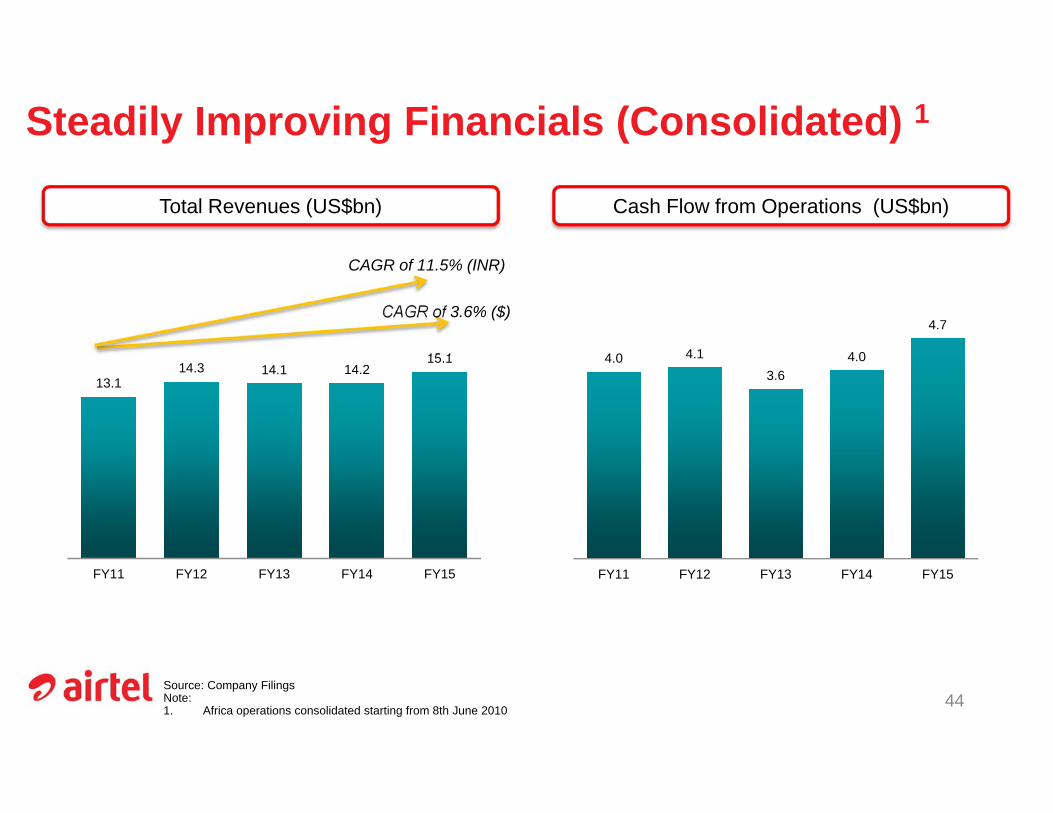
Steadily Improving Financials (Consolidated) 1
Source: Company FilingsNote:1. Africa operations consolidated starting from 8th June 2010
Cash Flow from Operations (US$bn)Total Revenues (US$bn)
13.114.3 14.1 14.2
15.1
FY11 FY12 FY13 FY14 FY15
4.0 4.13.6
4.0
4.7
FY11 FY12 FY13 FY14 FY15
CAGR of 3.6% ($)
CAGR of 11.5% (INR)
Driving increased Profitability
• Incremental EBITDA margins at 76% YoY
• Scale and Profitability across diversified segments• Among Top 3 in every non-mobile segment (TowerCo, DTH, Telemedia, B2B) • 36% of consolidated EBITDA comes from businesses other than India mobility
• 22% from India non-mobile businesses• 15% from International mobility businesses
• Robust growth in Indian non-mobility businesses – 19% YoY in Airtel Business and 19% in Digital TV
• Non wireless segments contribute 24% to operating profit (9M FY16)
• Africa showing signs of growth with bulk operating investments already in place –monetization to catalyze transition to FCF neutrality
45
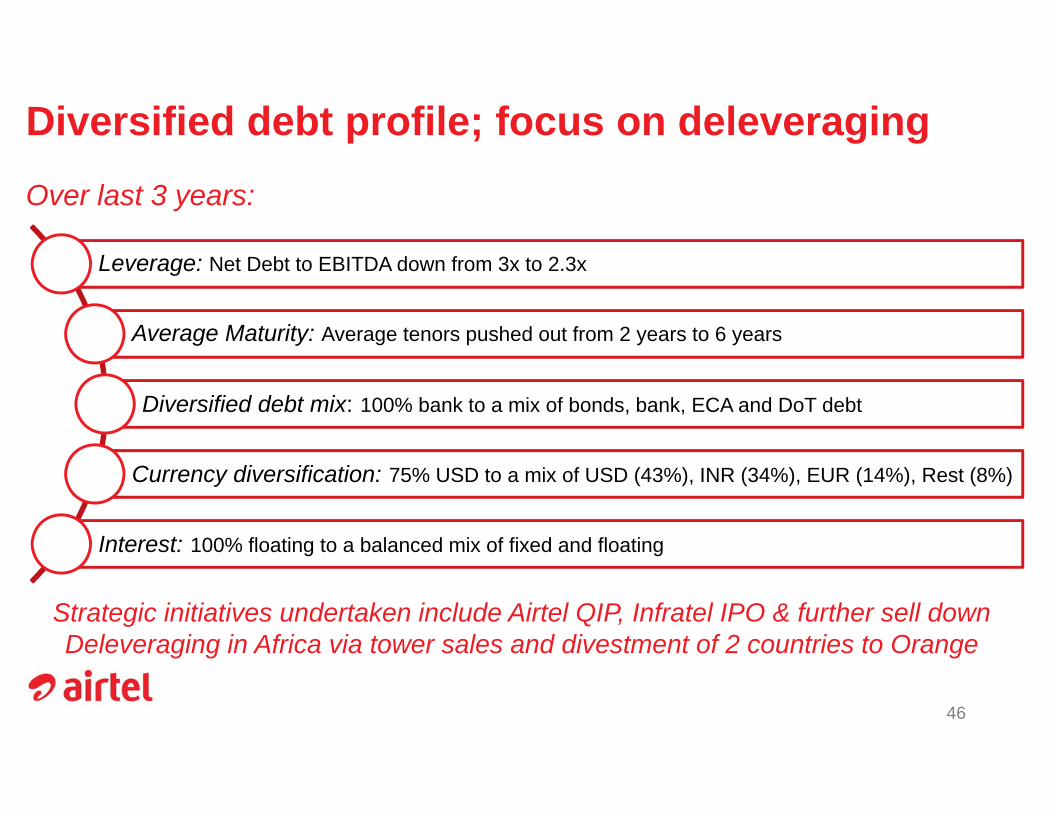
Diversified debt profile; focus on deleveragingOver last 3 years:
Leverage: Net Debt to EBITDA down from 3x to 2.3x
Average Maturity: Average tenors pushed out from 2 years to 6 years
Diversified debt mix: 100% bank to a mix of bonds, bank, ECA and DoT debt
Currency diversification: 75% USD to a mix of USD (43%), INR (34%), EUR (14%), Rest (8%)
Interest: 100% floating to a balanced mix of fixed and floating
46
Strategic initiatives undertaken include Airtel QIP, Infratel IPO & further sell downDeleveraging in Africa via tower sales and divestment of 2 countries to Orange
LEADERSHIP

Leadership in Business
Sunil Bharti Mittal, Chairman Rajan Bharti Mittal• Honorary Degree awarded by
Newcastle University - 2012• ‘Business Leader for the World
Award’ from INSEAD in 2011
• ‘Indian Business Leaders of the Year’ award at the Global India Business Meeting, 2011
48
Akhil Gupta• ‘Outstanding Contribution to the
Sector’ award at the Telecom Operator Awards 2012
• CFO India Hall of Fame by CFO India, 2011
Amongst top 100 most valuable brands globallyStudy by MillwardBrown, May 2012
Estimated brand value of over USD 11 bn, 2012Published in FinancialTimes
“Brand Leadership award in Telecom, 2012”Brand LeadershipAwards
Top TreasuryTeam, Asia; AdamSmith Award,EuroFinance
Bags five awards, tele.net Telecom Operator Awards 2013Including most admired telecom operator
Airtel Nigeria won 3 industry awards at Nigerian Telecom AwardsIncluding telecom brand of the year
Number 1 servicebrand in IndiaBrand Equity’s mosttrusted brands annualsurvey, 2013
One of top tenbrands in AfricaWithin 3 years ofoperations there
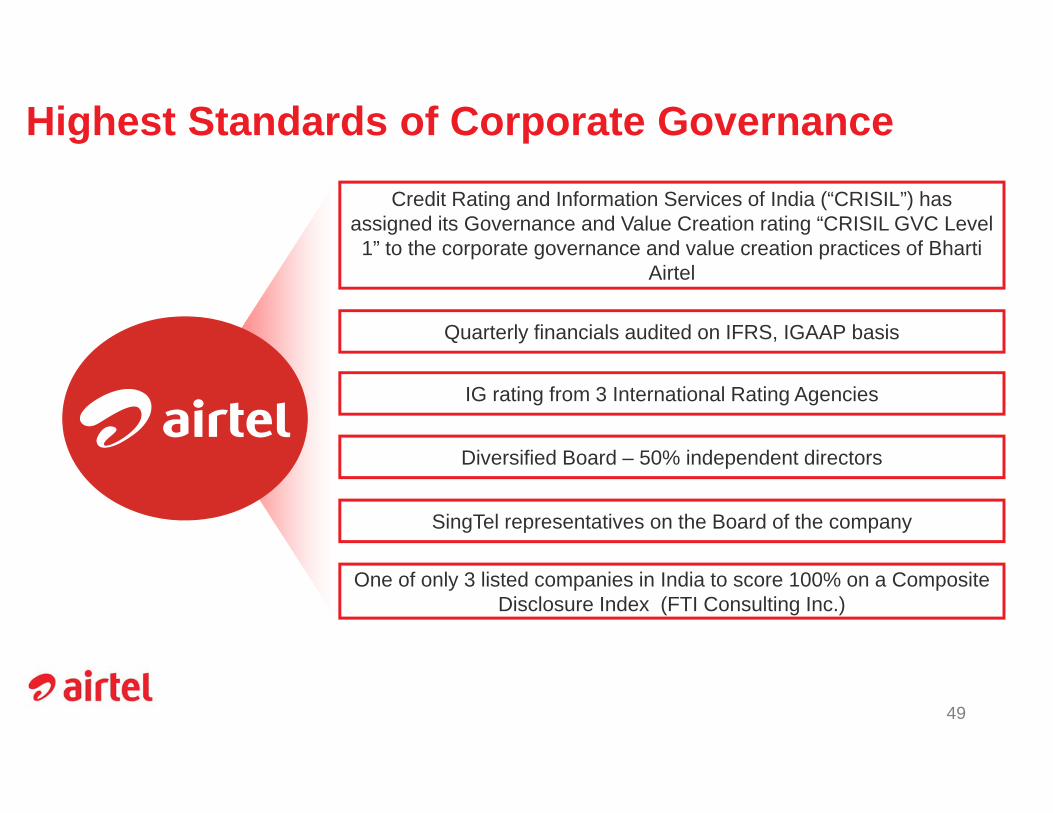
Highest Standards of Corporate GovernanceCredit Rating and Information Services of India (“CRISIL”) has
assigned its Governance and Value Creation rating “CRISIL GVC Level 1” to the corporate governance and value creation practices of Bharti
Airtel
Quarterly financials audited on IFRS, IGAAP basis
Diversified Board – 50% independent directors
SingTel representatives on the Board of the company
One of only 3 listed companies in India to score 100% on a Composite Disclosure Index (FTI Consulting Inc.)
IG rating from 3 International Rating Agencies
49

THANK YOU