Embed Size (px)
Citation preview

INVESTOR RELATIONSPRESENTATION
Q1 2020
Page 2
DISCLAIMER
This document has been prepared and issued by and is the sole responsibility of Aluminium Bahrain B.S.C. (the“Company”). The document is being supplied to you solely for your information and for use at the Company’spresentation. No information made available to you in connection with the presentation may be passed on,copied, reproduced, in whole or in part, or otherwise disseminated, directly or indirectly, to any other person. Thisdocument and its contents are directed only to the intended audience. It is being made on a confidential basis andis furnished to you solely for your information. By accepting this material the recipient confirms that he or she is arelevant person. This document must not be acted on or relied on by persons who are not relevant persons. Anyinvestment activity to which this document relates is available only to relevant persons and will be engaged inonly with relevant persons. If you are not a relevant person you should not attend the presentation and shouldimmediately return any materials relating to it currently in your possession. Forward-looking statements speakonly as at the date of this presentation and Aluminium Bahrain B.S.C. expressly disclaims any obligations orundertaking to release any update of, or revisions to, any forward-looking statements in this presentation. Nostatement in this presentation is intended to be a profit forecast. As a result, you are cautioned not to place anyundue reliance on such forward-looking statements. You should not base any behaviour in relation to financialinstruments related to the Company’s securities or any other securities and investments on such information untilafter it is made publicly available by the Company or any of their respective advisers. Some of the information isstill in draft form and has not been legally verified. The Company, its advisers and each of their respectivemembers, directors, officers and employees are under no obligation to update or keep current informationcontained in this presentation, to correct any inaccuracies which may become apparent, or to publicly announcethe result of any revision to the statements made herein except where they would be required to do so underapplicable law, and any opinions expressed in them are subject to change without notice. No representation orwarranty, express or implied, is given by the Company, its undertakings or affiliates or directors, officers or anyother person as to the fairness, accuracy or completeness of the information or opinions contained in thispresentation and no liability whatsoever for any loss howsoever arising from any use of this presentation or itscontents otherwise arising in connection therewith is accepted by any such person in relation to such information.
Page 3
01IndustryHighlights
CONTENTS
02AlbaHighlights
03Q1 2020Results
04IndustryPerspectivesin 2020
052020Alba Priorities
Page 4
01INDUSTRY HIGHLIGHTS1
1 Industry Highlights are based on CRU Market Analysis
Page 5
Industry Highlights – Q1 2020
The unprecedented stop in the world’s economic activity has sent shockwaves through the entire Aluminium supply-chain. A quarter of the world population live under lockdown. The Aluminium downstream has lowered output levels or has already shutdown. The auto sector has taken the hardest hit from novel COVID-19 outbreak; other sectors have also witnessed a sharp decline thanks to the closure of extruders, rolling-mills and construction facilities
World Consumption down by 8% YoY
Aluminium demand collapse in major markets: a drop of 10% YoY in Europe and China, 8% YoY in MENA and 6% YoY in North America
Global Demand for Aluminium Tumbles
Page 6
Primary Aluminium production in MENA continues - up 12% YoY [mainly on the back of Alba’s Line 6 metal]
Production in North America up by 5% YoY mainly due to higher throughput from Canadian smelters
China production up by 2% YoY [high-cost smelters curtailed their output thanks to drop in SHFE price]. Chinese smelters are preparing for further output cuts
World market in surplus with China (+1,923Kt) and (+299Kt) without China
6
Industry Highlights – Q1 2020
Global Production – Modest Growth at 2% YoY
Page 7
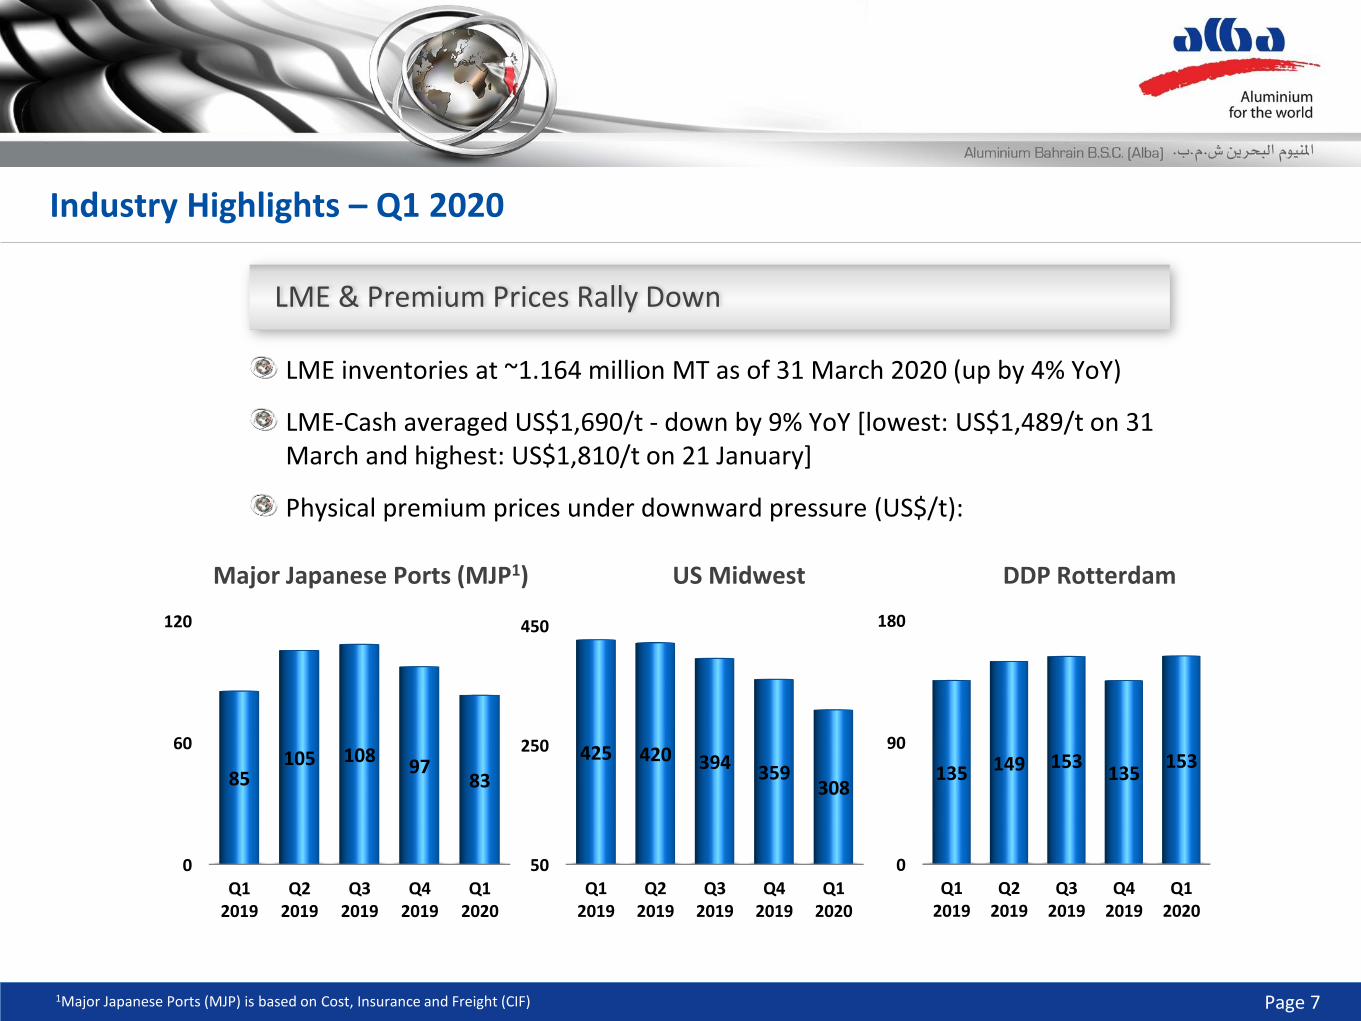
LME inventories at ~1.164 million MT as of 31 March 2020 (up by 4% YoY)
LME-Cash averaged US$1,690/t - down by 9% YoY [lowest: US$1,489/t on 31 March and highest: US$1,810/t on 21 January]
Physical premium prices under downward pressure (US$/t):
Major Japanese Ports (MJP1) US Midwest DDP Rotterdam
0
90
180
Q12019
Q22019
Q32019
Q42019
Q12020
135 149 153135
153
50
250
450
Q12019
Q22019
Q32019
Q42019
Q12020
425 420 394 359308
0
60
120
Q12019
Q22019
Q32019
Q42019
Q12020
85105 108
9783
1Major Japanese Ports (MJP) is based on Cost, Insurance and Freight (CIF)
Industry Highlights – Q1 2020
LME & Premium Prices Rally Down
Page 8
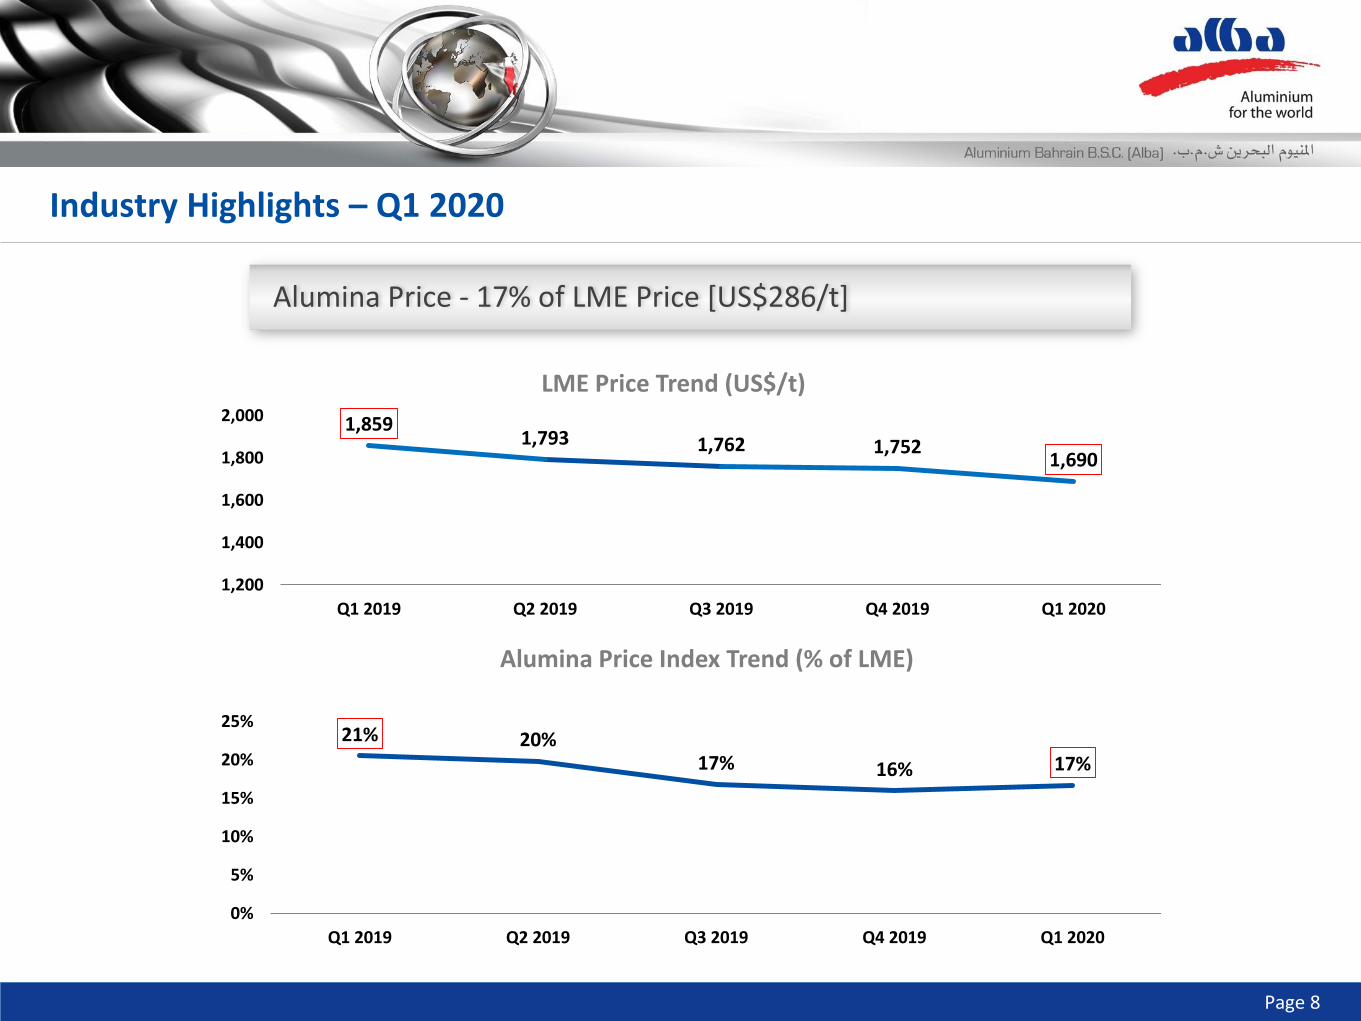
21% 20%17% 16% 17%
0%
5%
10%
15%
20%
25%
Q1 2019 Q2 2019 Q3 2019 Q4 2019 Q1 2020
1,8591,793 1,762 1,752
1,690
1,200
1,400
1,600
1,800
2,000
Q1 2019 Q2 2019 Q3 2019 Q4 2019 Q1 2020
Alumina Price Index Trend (% of LME)
LME Price Trend (US$/t)
Industry Highlights – Q1 2020
Alumina Price - 17% of LME Price [US$286/t]
Page 9
02ALBA HIGHLIGHTS
Page 10
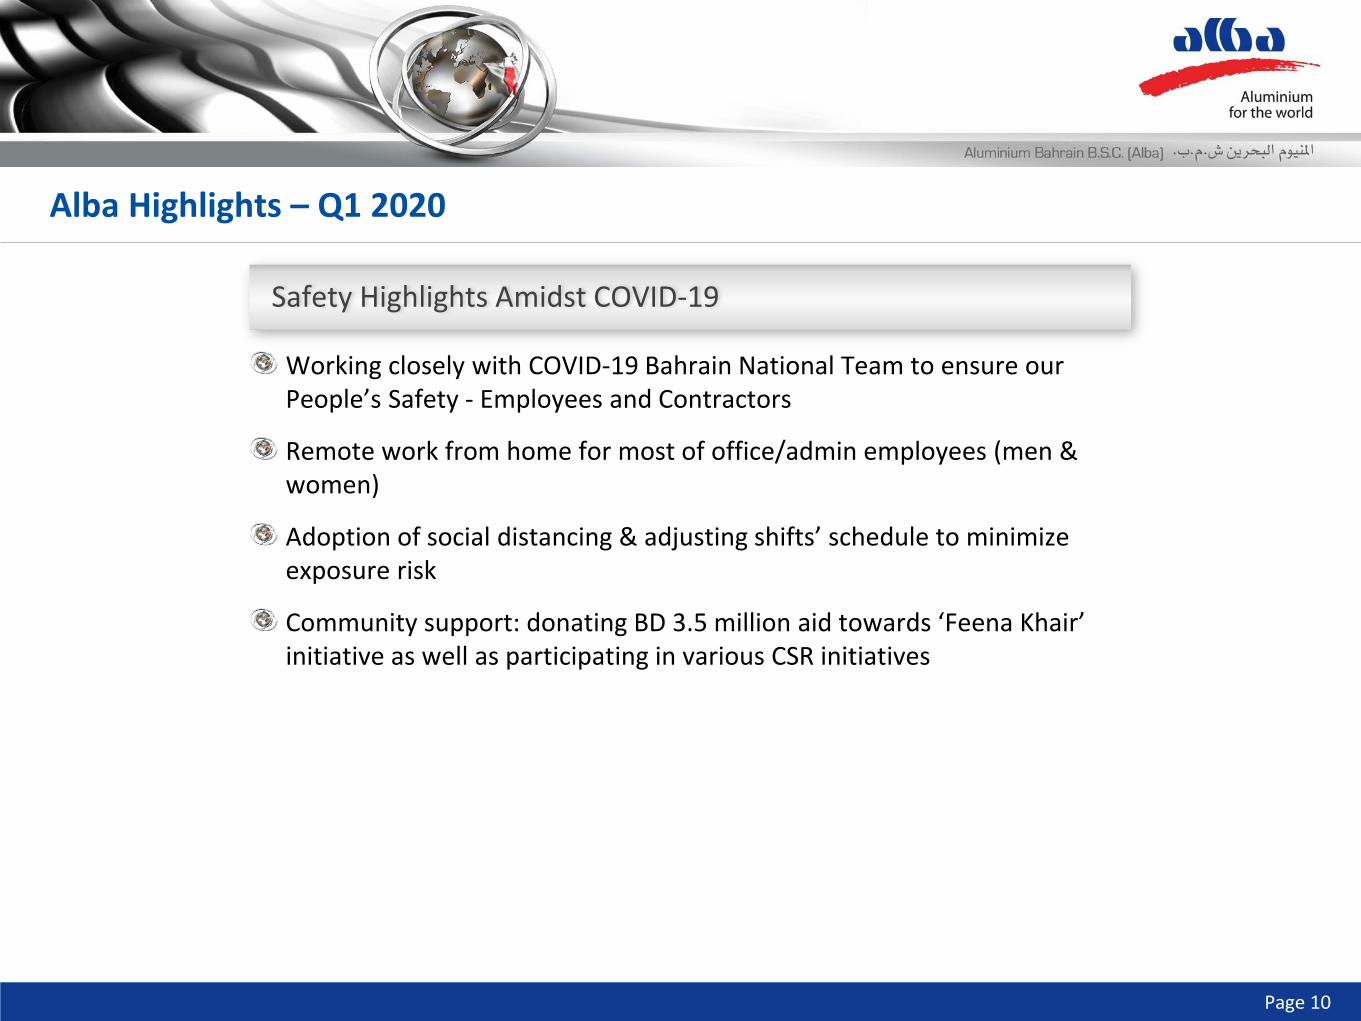
Working closely with COVID-19 Bahrain National Team to ensure our People’s Safety - Employees and Contractors
Remote work from home for most of office/admin employees (men & women)
Adoption of social distancing & adjusting shifts’ schedule to minimize exposure risk
Community support: donating BD 3.5 million aid towards ‘Feena Khair’ initiative as well as participating in various CSR initiatives
Alba Highlights – Q1 2020
Safety Highlights Amidst COVID-19
Page 11
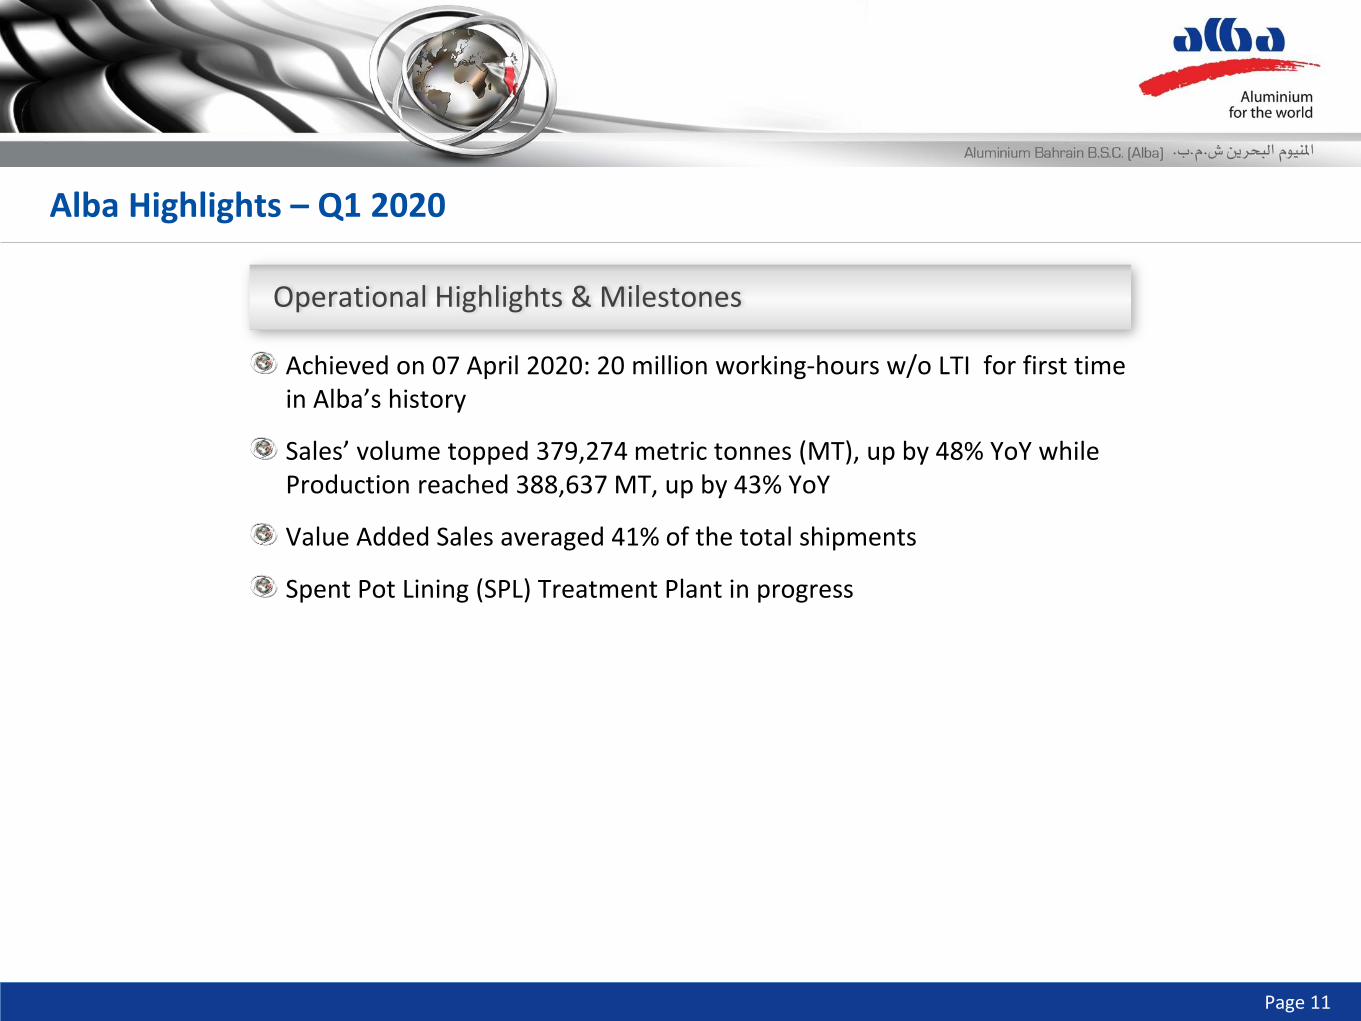
Achieved on 07 April 2020: 20 million working-hours w/o LTI for first time in Alba’s history
Sales’ volume topped 379,274 metric tonnes (MT), up by 48% YoY while Production reached 388,637 MT, up by 43% YoY
Value Added Sales averaged 41% of the total shipments
Spent Pot Lining (SPL) Treatment Plant in progress
Alba Highlights – Q1 2020
Operational Highlights & Milestones
Page 12
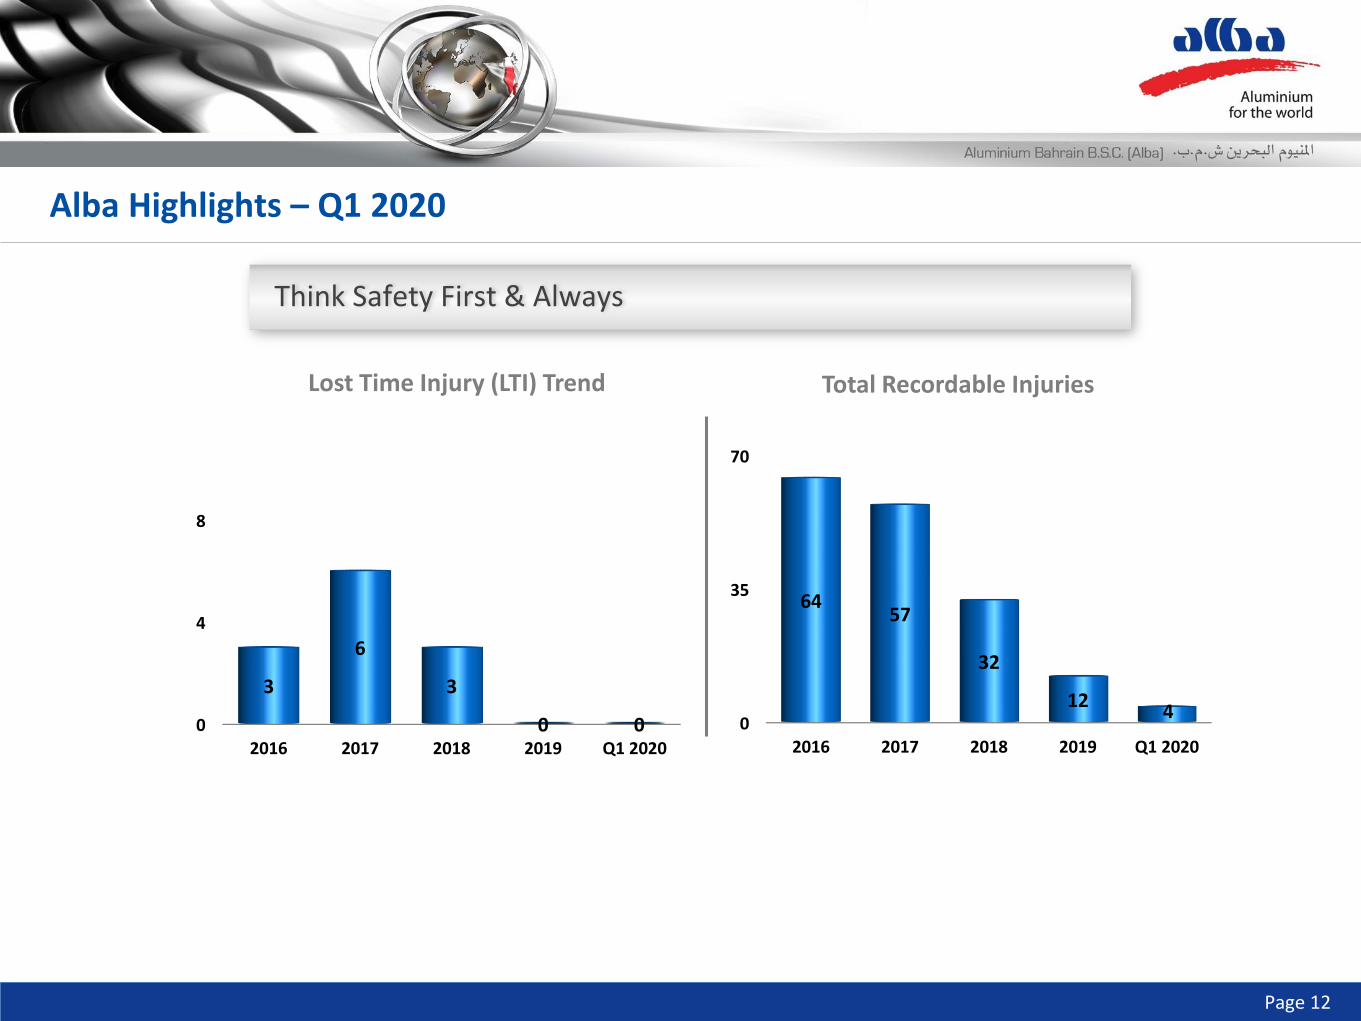
0
4
8
2016 2017 2018 2019 Q1 2020
3
6
3
0 0 0
35
70
2016 2017 2018 2019 Q1 2020
6457
32
124
Lost Time Injury (LTI) Trend Total Recordable Injuries
Alba Highlights – Q1 2020
Think Safety First & Always
Page 13
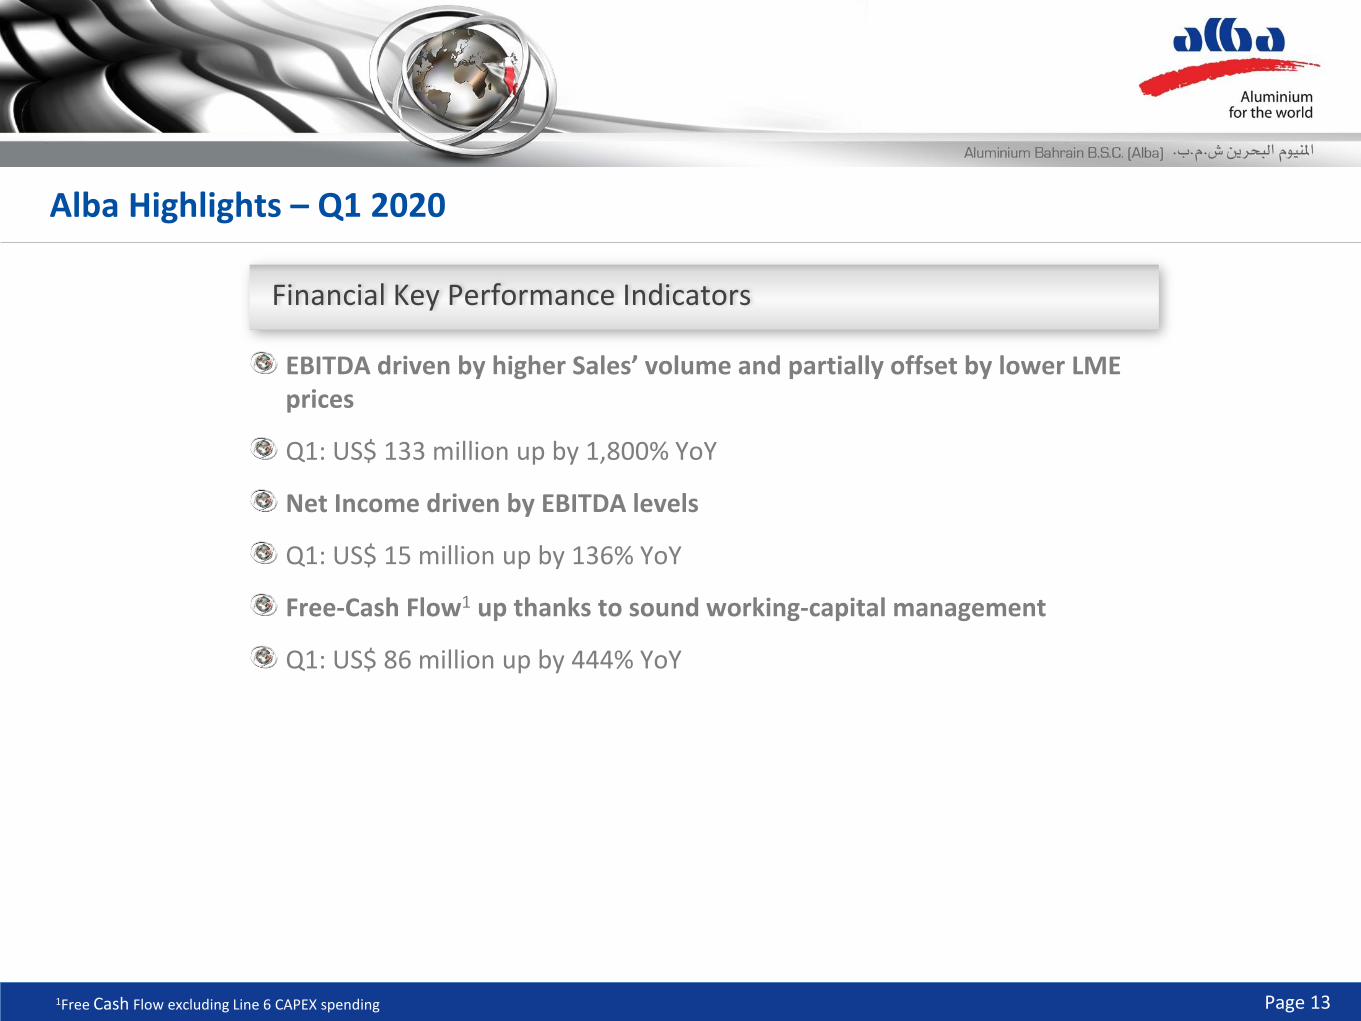
EBITDA driven by higher Sales’ volume and partially offset by lower LME prices
Q1: US$ 133 million up by 1,800% YoY
Net Income driven by EBITDA levels
Q1: US$ 15 million up by 136% YoY
Free-Cash Flow1 up thanks to sound working-capital management
Q1: US$ 86 million up by 444% YoY
1Free Cash Flow excluding Line 6 CAPEX spending
Alba Highlights – Q1 2020
Financial Key Performance Indicators
Page 14
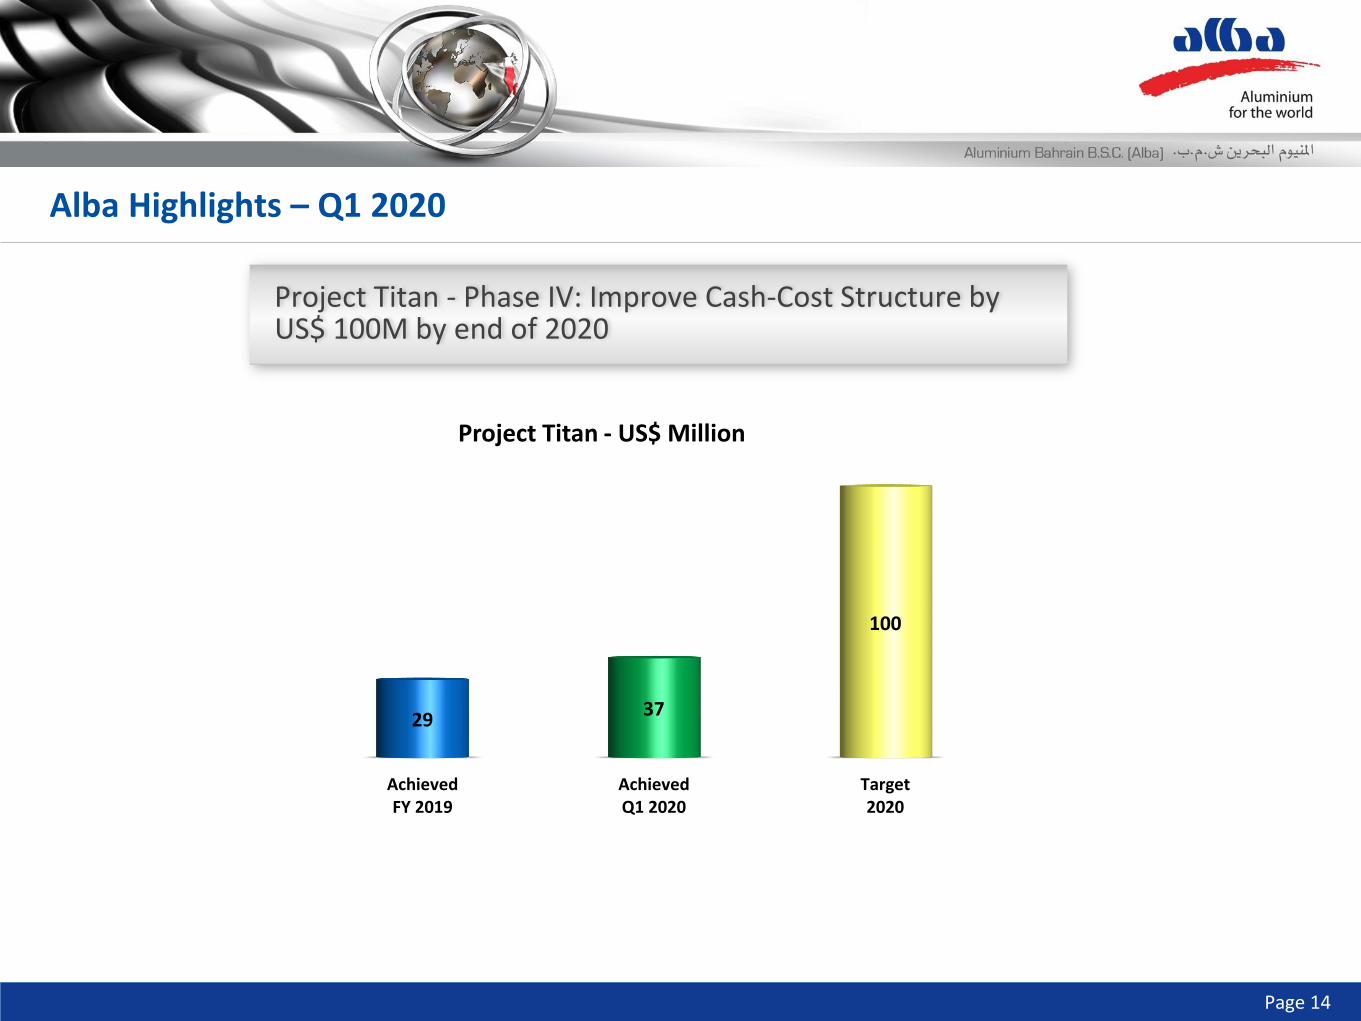
AchievedFY 2019
AchievedQ1 2020
Target2020
2937
100
Project Titan - US$ Million
Alba Highlights – Q1 2020
Project Titan - Phase IV: Improve Cash-Cost Structure by US$ 100M by end of 2020
Page 15
03Q1 2020 RESULTS
Page 16
200
300
400
500
600
700
800
Metal SalesQ1 2019
LME Product Mix Pricing Power Volume Metal SalesQ1 2020
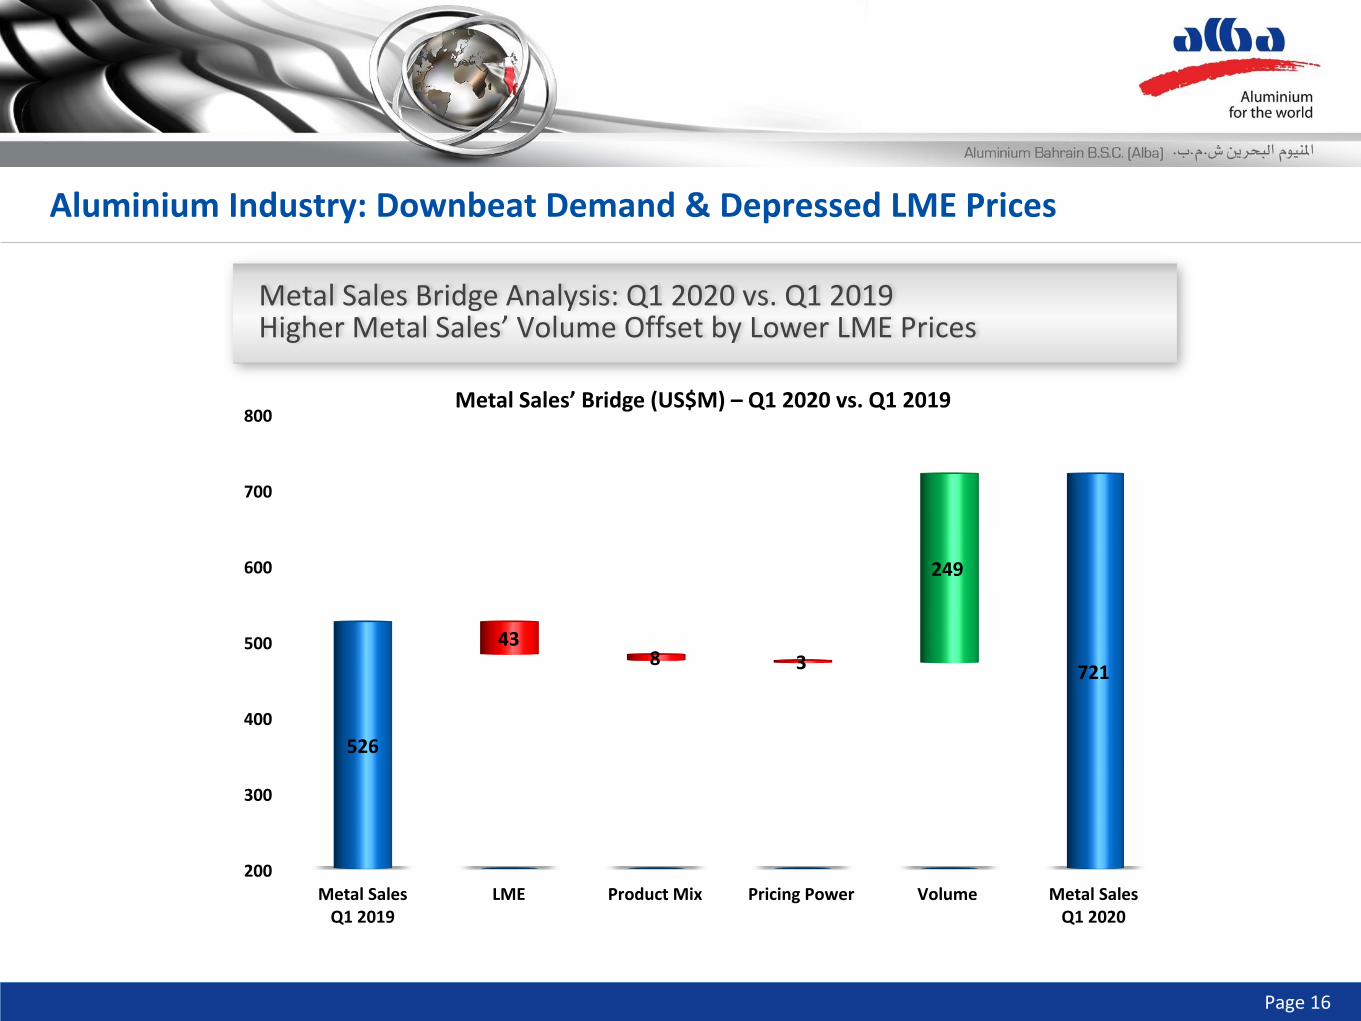
526
721
249
438 3
Metal Sales’ Bridge (US$M) – Q1 2020 vs. Q1 2019
Aluminium Industry: Downbeat Demand & Depressed LME Prices
Metal Sales Bridge Analysis: Q1 2020 vs. Q1 2019 Higher Metal Sales’ Volume Offset by Lower LME Prices
Page 17
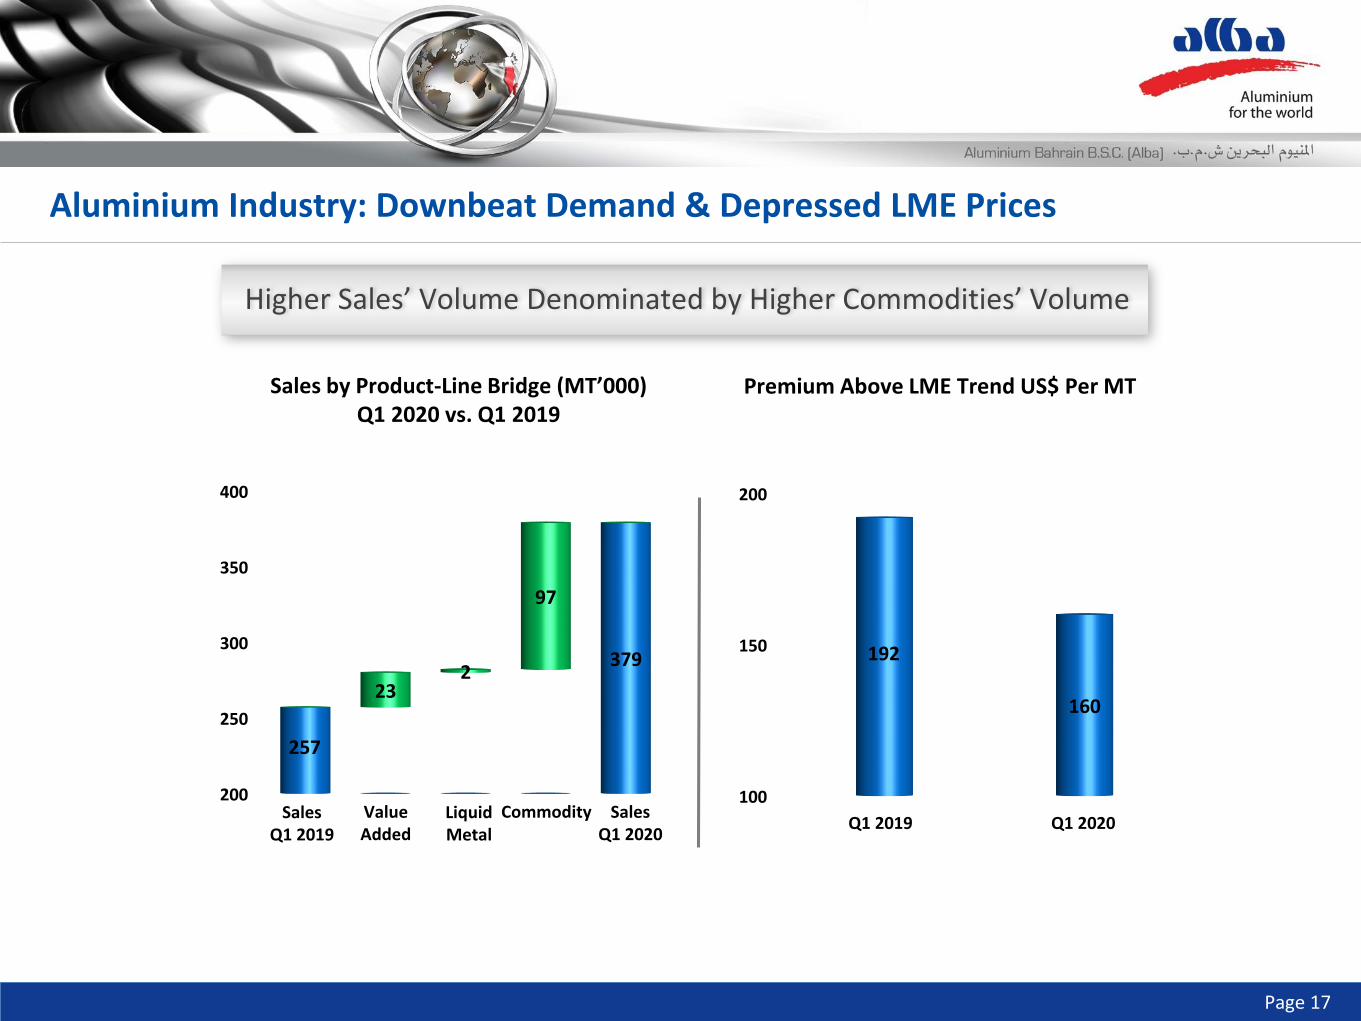
200
250
300
350
400
257
379
97
232
Sales by Product-Line Bridge (MT’000)Q1 2020 vs. Q1 2019
Premium Above LME Trend US$ Per MT
100
150
200
192
160
Sales Q1 2019
ValueAdded
Sales Q1 2020
LiquidMetal
CommodityQ1 2019 Q1 2020
Higher Sales’ Volume Denominated by Higher Commodities’ Volume
Aluminium Industry: Downbeat Demand & Depressed LME Prices
Page 18
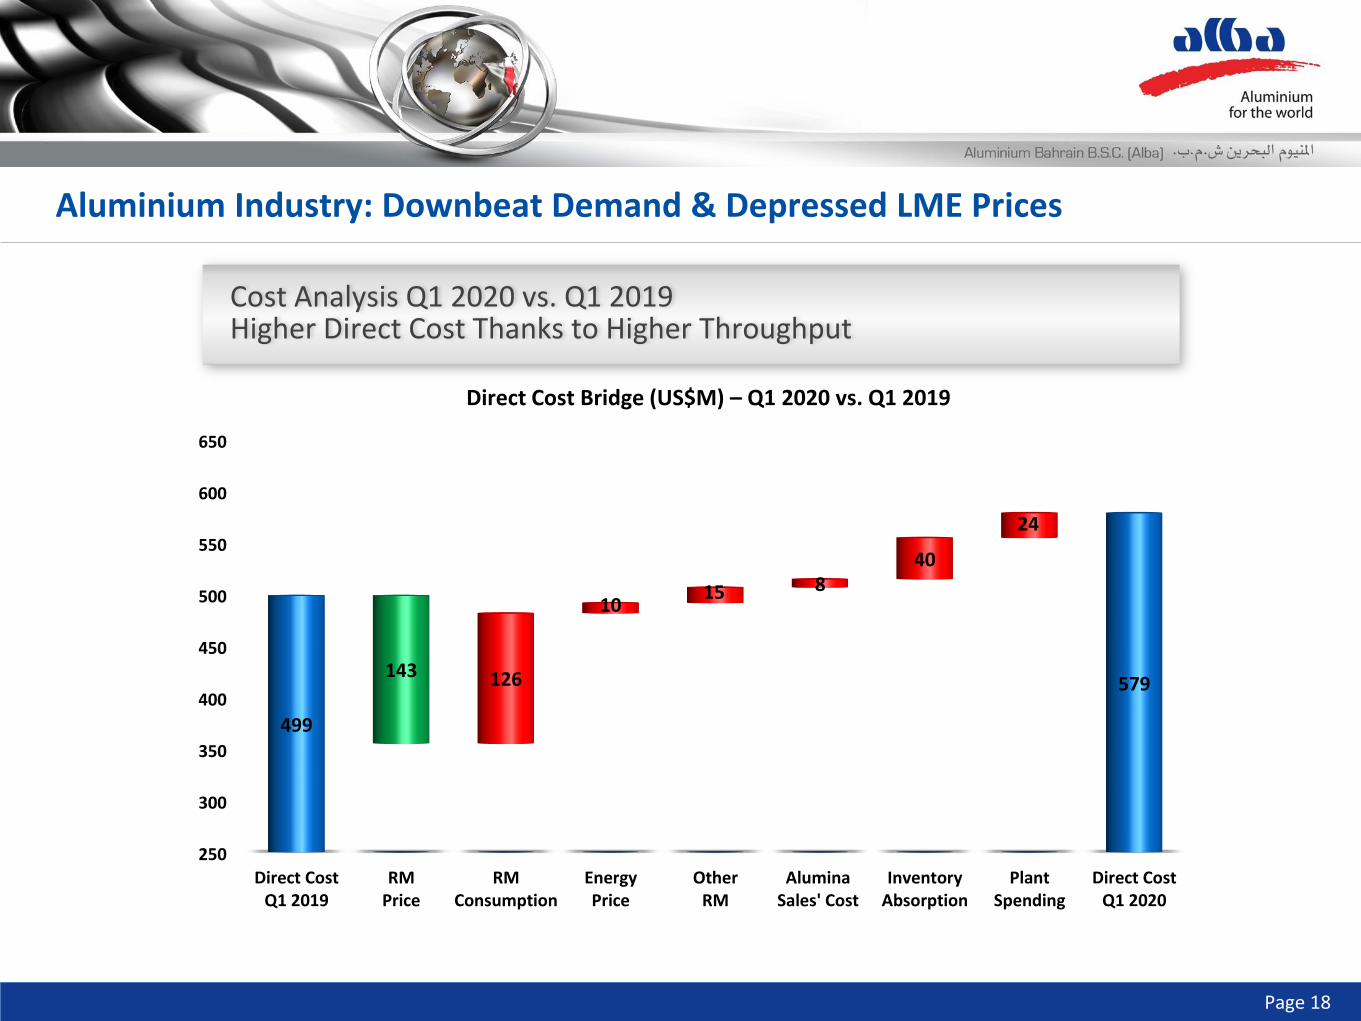
Direct Cost Bridge (US$M) – Q1 2020 vs. Q1 2019
250
300
350
400
450
500
550
600
650
Direct CostQ1 2019
RMPrice
RMConsumption
EnergyPrice
OtherRM
AluminaSales' Cost
InventoryAbsorption
PlantSpending
Direct CostQ1 2020
499
579143 126
1015 8
40
24
Cost Analysis Q1 2020 vs. Q1 2019 Higher Direct Cost Thanks to Higher Throughput
Aluminium Industry: Downbeat Demand & Depressed LME Prices
Page 19
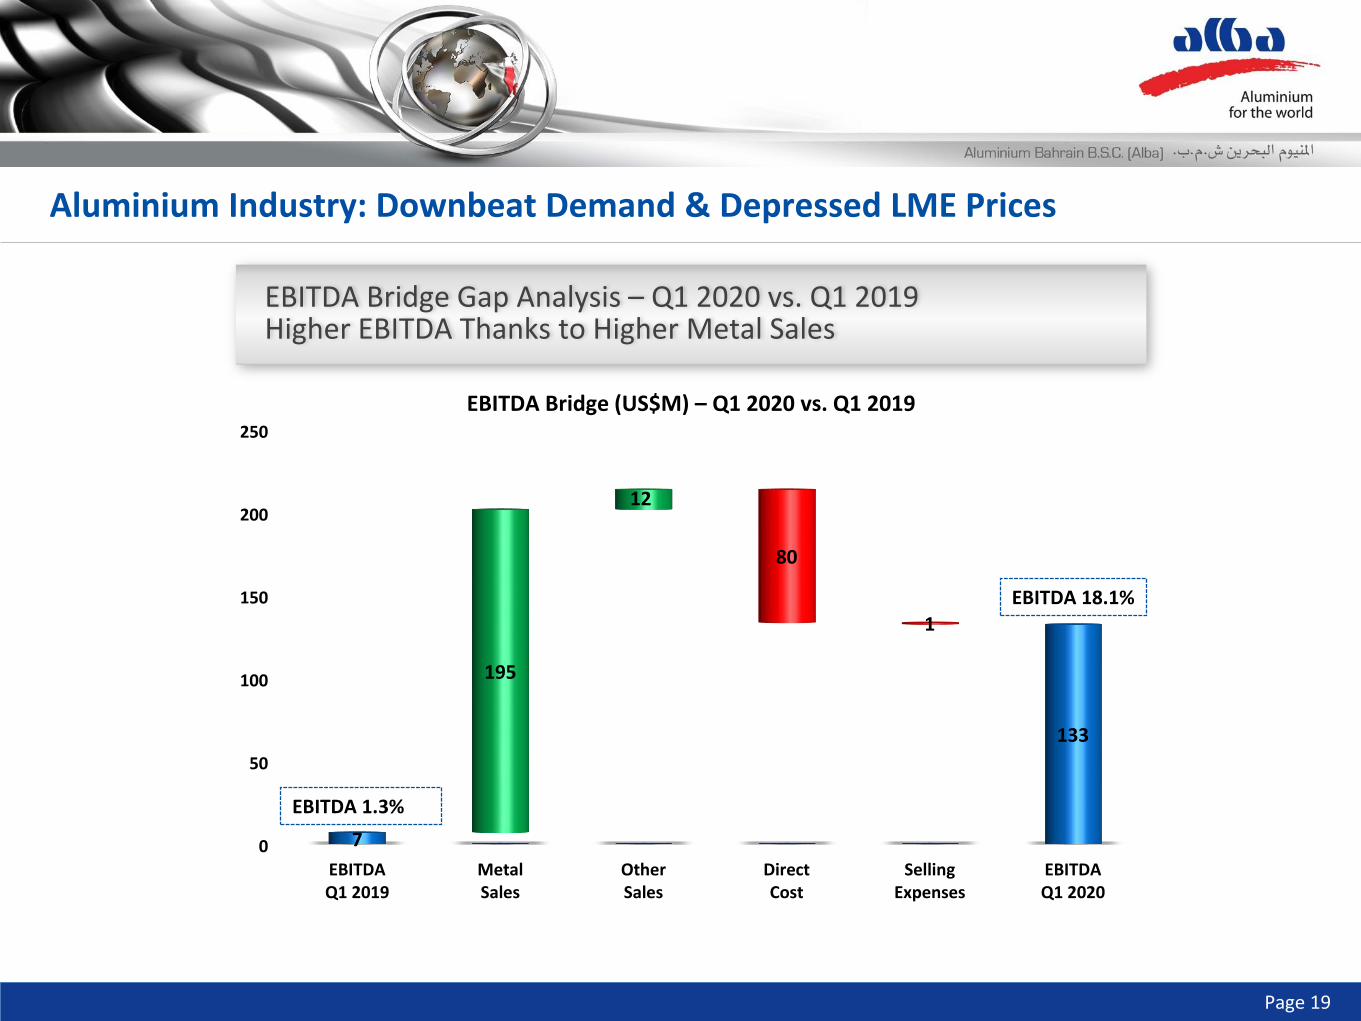
0
50
100
150
200
250
EBITDAQ1 2019
MetalSales
OtherSales
DirectCost
SellingExpenses
EBITDAQ1 2020
7
133
195
12
80
1
EBITDA 1.3%
EBITDA 18.1%
EBITDA Bridge (US$M) – Q1 2020 vs. Q1 2019
EBITDA Bridge Gap Analysis – Q1 2020 vs. Q1 2019 Higher EBITDA Thanks to Higher Metal Sales
Aluminium Industry: Downbeat Demand & Depressed LME Prices
Page 20
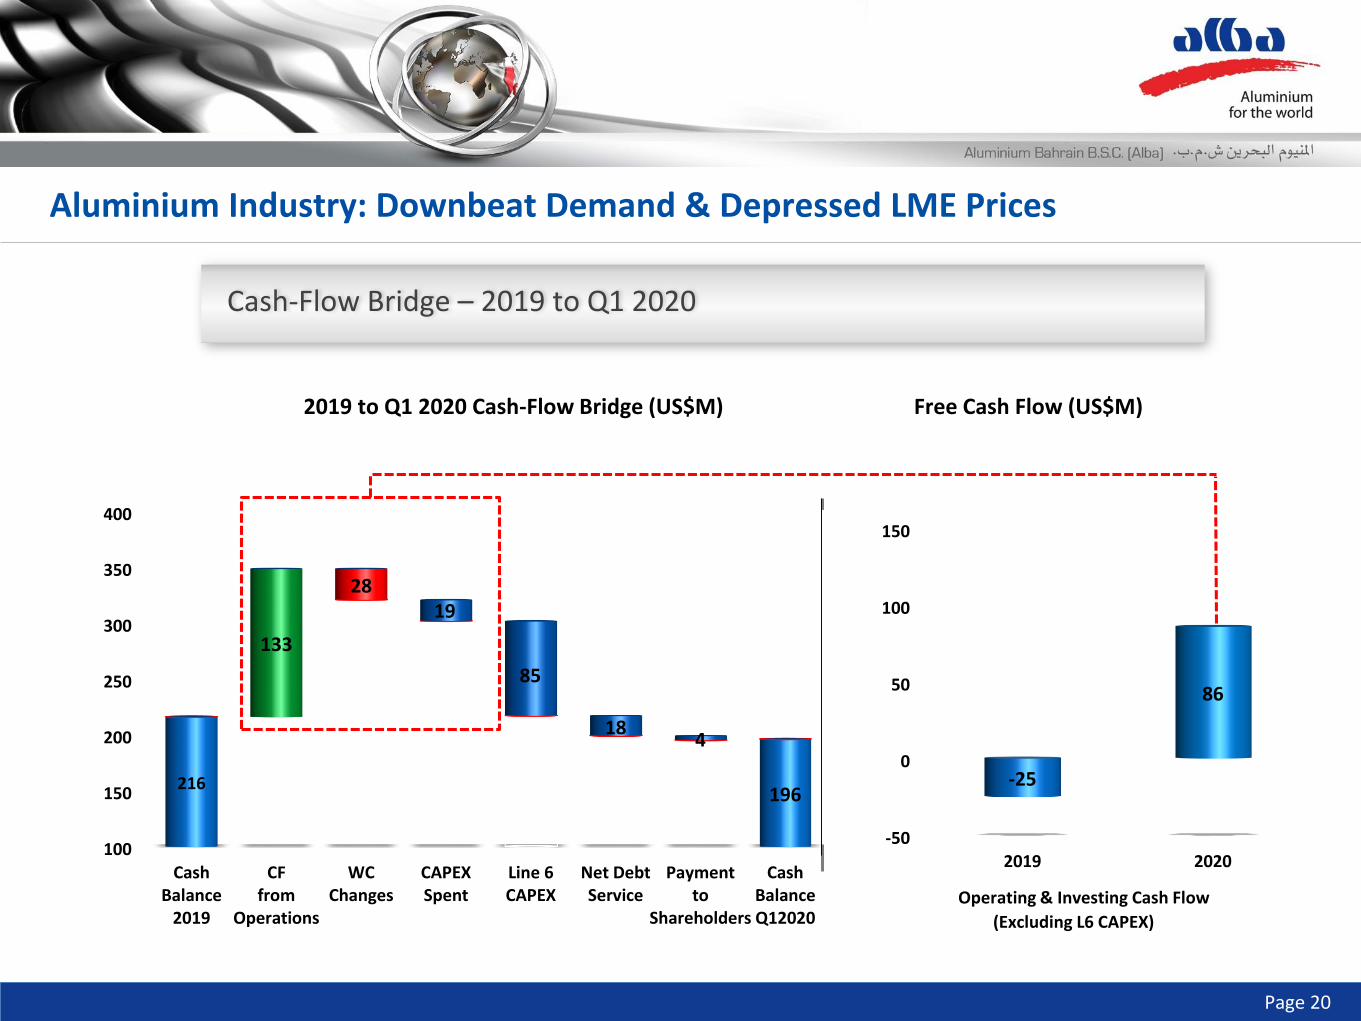
2019 to Q1 2020 Cash-Flow Bridge (US$M) Free Cash Flow (US$M)
Operating & Investing Cash Flow
(Excluding L6 CAPEX)
100
150
200
250
300
350
400
CashBalance
2019
CFfrom
Operations
WCChanges
CAPEXSpent
Line 6CAPEX
Net DebtService
Paymentto
Shareholders
CashBalanceQ12020
216196
133
19
184
28
85
-50
0
50
100
150
2019 2020
-25
86
Cash-Flow Bridge – 2019 to Q1 2020
Aluminium Industry: Downbeat Demand & Depressed LME Prices
Page 21
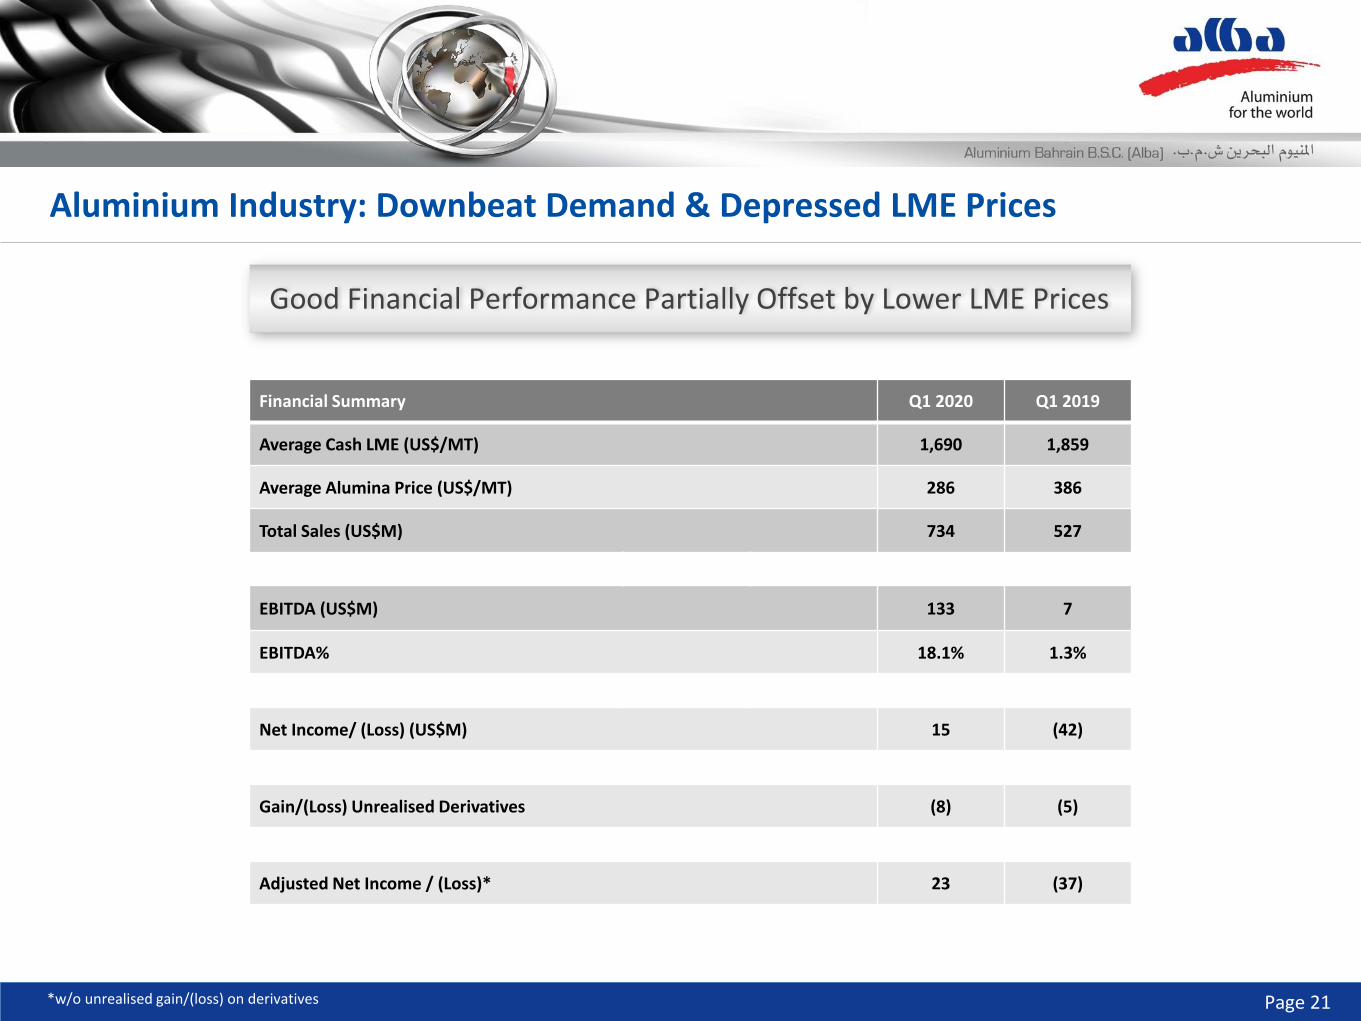
Financial Summary Q1 2020 Q1 2019
Average Cash LME (US$/MT) 1,690 1,859
Average Alumina Price (US$/MT) 286 386
Total Sales (US$M) 734 527
EBITDA (US$M) 133 7
EBITDA% 18.1% 1.3%
Net Income/ (Loss) (US$M) 15 (42)
Gain/(Loss) Unrealised Derivatives (8) (5)
Adjusted Net Income / (Loss)* 23 (37)
Good Financial Performance Partially Offset by Lower LME Prices
Aluminium Industry: Downbeat Demand & Depressed LME Prices
*w/o unrealised gain/(loss) on derivatives
Page 22
04INDUSTRY PERSPECTIVES IN 2020
Page 23
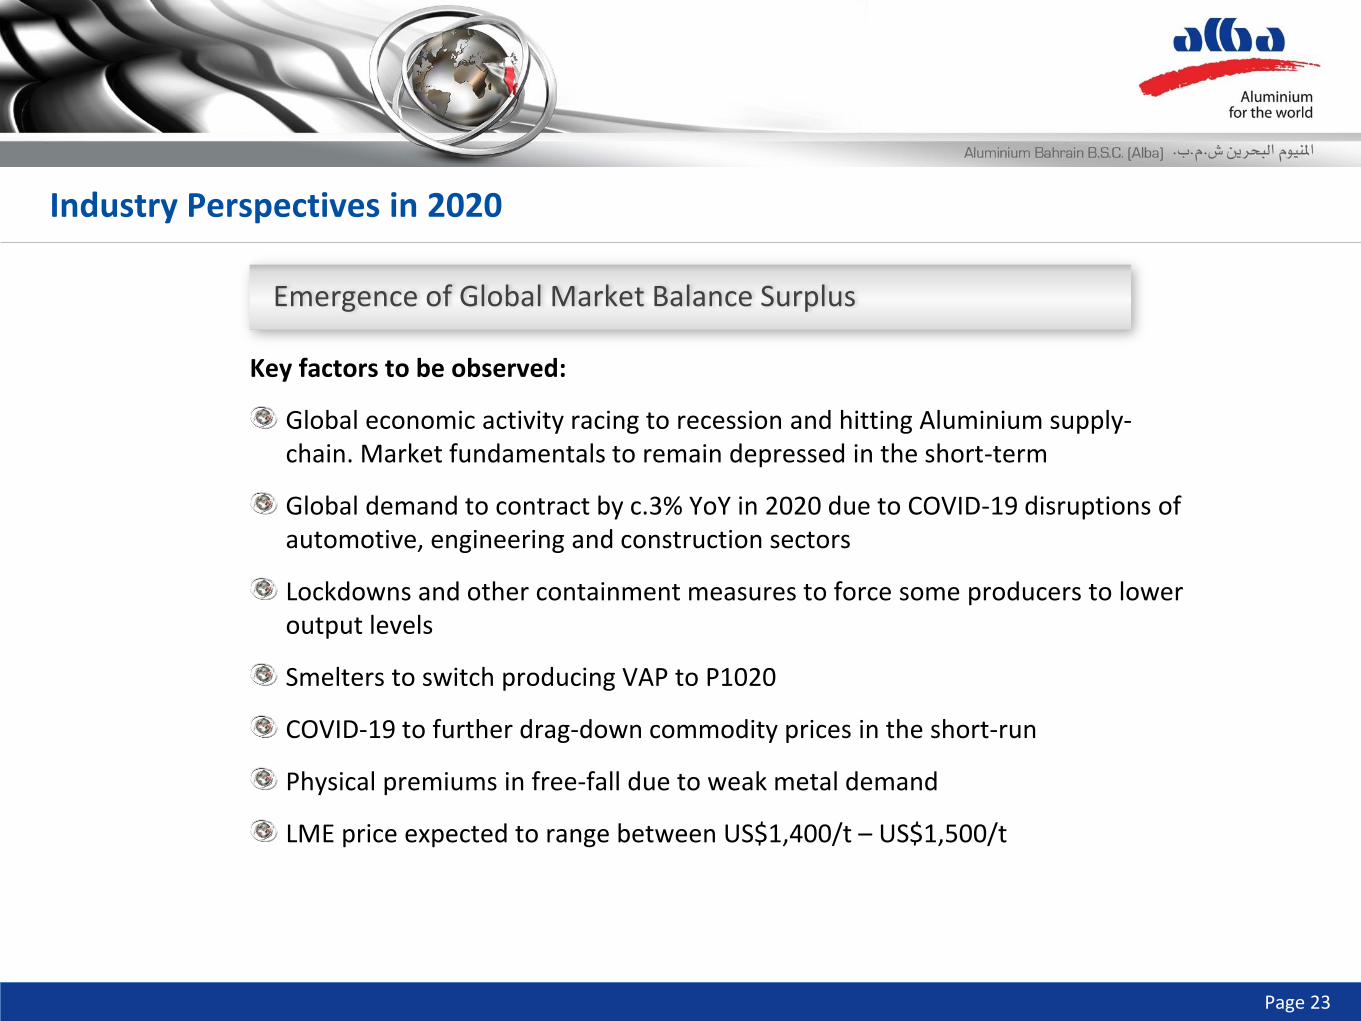
Key factors to be observed:
Global economic activity racing to recession and hitting Aluminium supply-chain. Market fundamentals to remain depressed in the short-term
Global demand to contract by c.3% YoY in 2020 due to COVID-19 disruptions of automotive, engineering and construction sectors
Lockdowns and other containment measures to force some producers to lower output levels
Smelters to switch producing VAP to P1020
COVID-19 to further drag-down commodity prices in the short-run
Physical premiums in free-fall due to weak metal demand
LME price expected to range between US$1,400/t – US$1,500/t
Industry Perspectives in 2020
Emergence of Global Market Balance Surplus
Page 24
Alumina prices to be under downward pressure thanks to lower downstream/Aluminium demand
Green Petroleum Coke (GPC), Liquid Pitch and Aluminium Fluoride (ALF3) Prices to remain at the same levels on the back of weak market sentiment
Industry Perspectives in 2020
Raw Materials Price Trends

Page 25
052020 ALBA PRIORITIES
Page 26
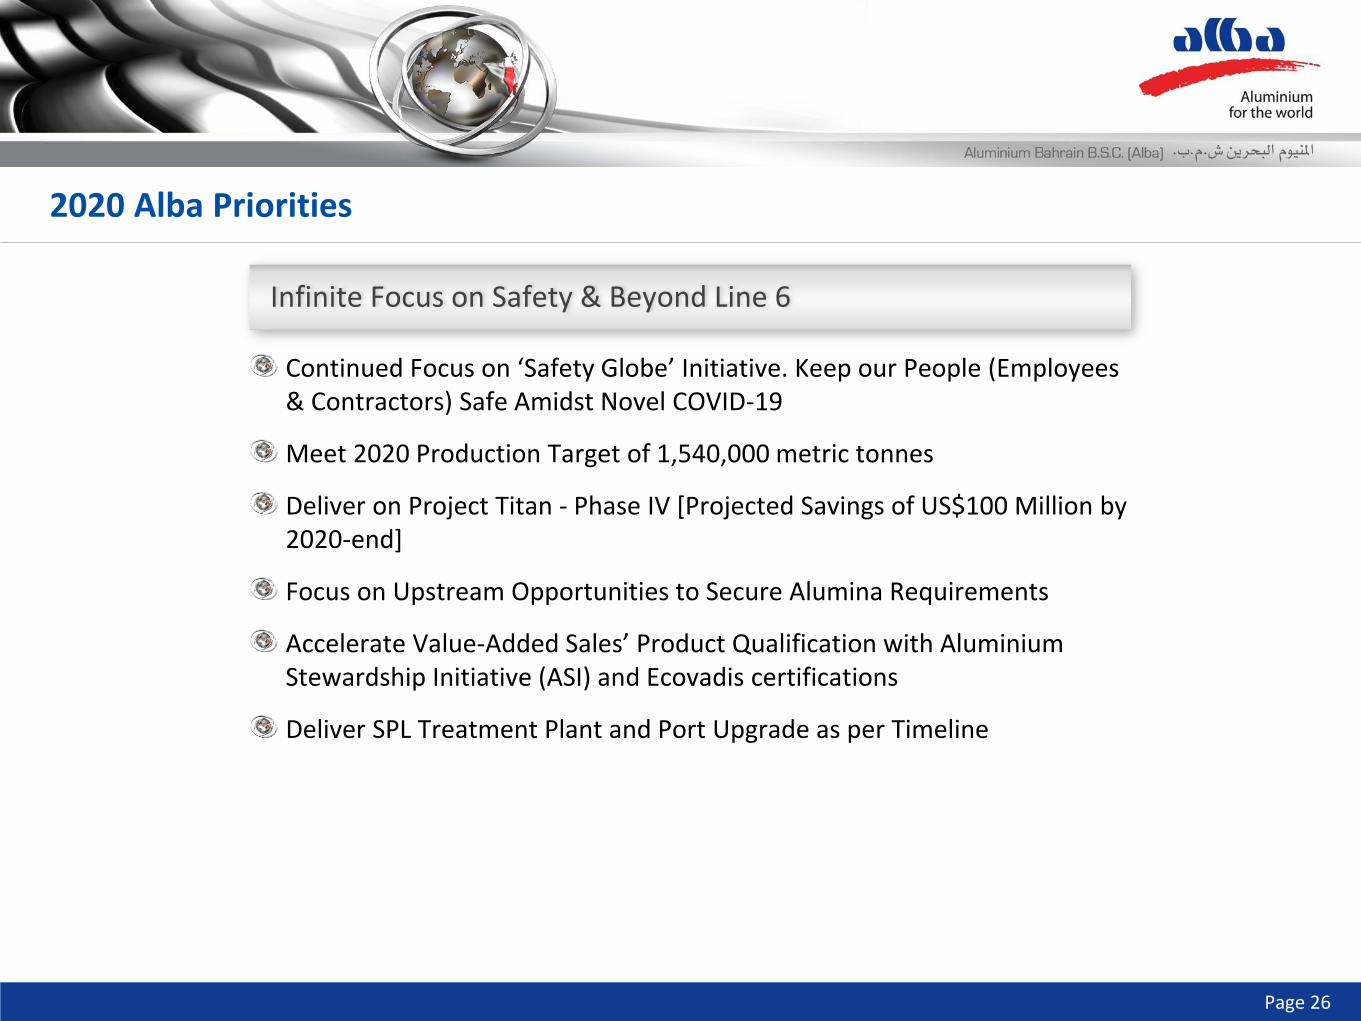
Continued Focus on ‘Safety Globe’ Initiative. Keep our People (Employees & Contractors) Safe Amidst Novel COVID-19
Meet 2020 Production Target of 1,540,000 metric tonnes
Deliver on Project Titan - Phase IV [Projected Savings of US$100 Million by 2020-end]
Focus on Upstream Opportunities to Secure Alumina Requirements
Accelerate Value-Added Sales’ Product Qualification with Aluminium Stewardship Initiative (ASI) and Ecovadis certifications
Deliver SPL Treatment Plant and Port Upgrade as per Timeline
2020 Alba Priorities
Infinite Focus on Safety & Beyond Line 6
Page 27
Alba4World alba4world user/Alba4World photos/alba4world
For more information, please contact us on:
Manama (ALBH)