Embed Size (px)
Citation preview
| Copyright © 2017 Tata Consultancy Services Limited
January 2018
Investor Presentation
Forward Looking Statements
Certain statements in this release concerning our future prospects are forward-looking statements. Forward-looking statements by their nature involve a number of risks and uncertainties that could cause actual results to differ materially from market expectations. These risks and uncertainties include, but are not limited to our ability to manage growth, intense competition among Indian and overseas IT services companies, various factors which may affect our cost advantage, such as wage increases or an appreciating Rupee, our ability to attract and retain highly skilled professionals, time and cost overruns on fixed-price, fixed-time frame contracts, client concentration, restrictions on cross-border movement of skilled personnel, our ability to manage our international operations, reduced demand for technology in our key focus areas, disruptions in telecommunication networks, our ability to successfully complete and integrate potential acquisitions, liability for damages on our service contracts, the success of the companies in which TCS has made strategic investments, withdrawal of governmental fiscal incentives, political instability, legal restrictions on raising capital or acquiring companies outside India, unauthorized use of our intellectual property and general economic conditions affecting our industry. TCS may, from time to time, make additional written and oral forward-looking statements, including our reports to shareholders. These forward-looking statements represent only the Company’s current intentions, beliefs or expectations, and any forward-looking statement speaks only as of the date on which it was made. The Company assumes no obligation to revise or update any forward-looking statements.
2

Tata Consultancy Services
TCS is an IT services, consulting and business solutions company, offering
transformationaland outsourcingservices to global enterprises
FY 2017 (ending March) revenue
US$ 17.58 Bn
Employer of Choice, No. of Employees over
390,880
Global Presence: 227Offices in 49 countries
and 141 Solution
Centers in 19 countries
Amongst the Top 10Global IT Services providers
Started in 1968, TCS is part of the Tata Group, known for its values, integrity and management excellence
3
$0
$10,000
$20,000
FY05
FY07
FY09
FY11
FY13
FY15
FY17R
EV IN
USD
MN
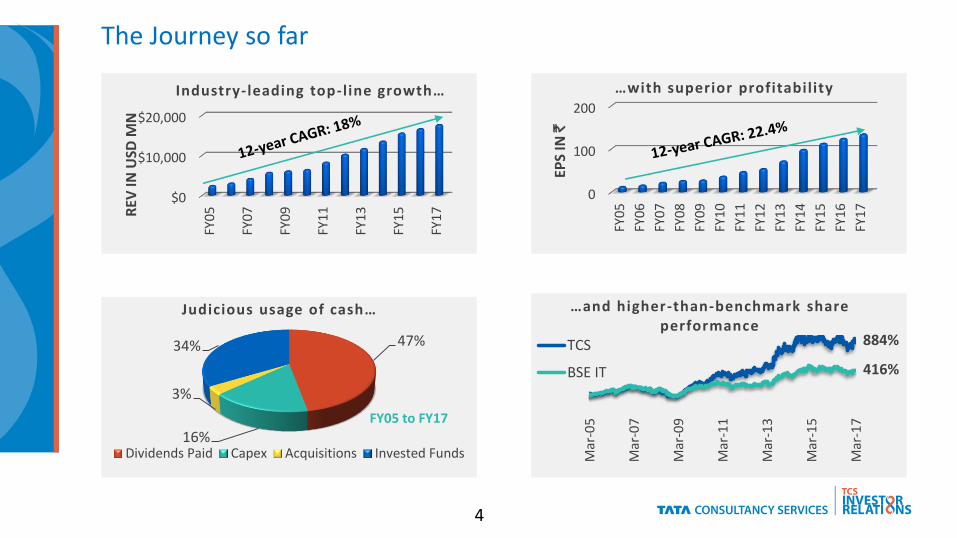
Industry-leading top- l ine growth…
The Journey so far
47%
16%
3%
34%
Judicious usage of cash…
Dividends Paid Capex Acquisitions Invested Funds
FY05 to FY17
0
100
200
FY05
FY06
FY07
FY08
FY09
FY10
FY11
FY12
FY13
FY14
FY15
FY16
FY17
EPS
IN `
…with superior profitability
884%
416%
Mar
-05
Mar
-07
Mar
-09
Mar
-11
Mar
-13
Mar
-15
Mar
-17
…and higher -than-benchmark share performance
TCS
BSE IT
4

Leading Technology Change

6
1970s 1980s 1990s 2000s 2010s
Mainframes, Unix, VAX, AS/400
Material Resource Planning
COBOL, Object Oriented
Data
Compute
Applications Development
Applications
Industry 4.0
IoT, Robotics Drones, Cyber-Physical
Wearables, Bionics
Cyber Sec, Identity, Blockchain
MES, M2M
BYOD
Devices
Security, Privacy
Cypto
APIs, DevOps
Cognitive Automation,AI, Intelligent Agents
Cloud, Edge, Fog, MistGPU, FPGA
Pervasive, Personal
PaaS, BPaaS, Products & Platforms
Big Data, Analytics,Data Monetization
Collaboration, Social, Touch Interaction, Design, AR/VR
RPA
VirtualizationGrids
SaaS
BI, Marts,NoSQL
Groupware, Apps, Smartphone
SoA, Agile
Y2K Factory
Windows 95, Linux
Warehouses
ERP, HRMS, CRM, FS, BPS
Automation
Client/Server, Thin Client
Digital
DBMS, RDBMS
Leading through 50 Years of Enterprise Technology
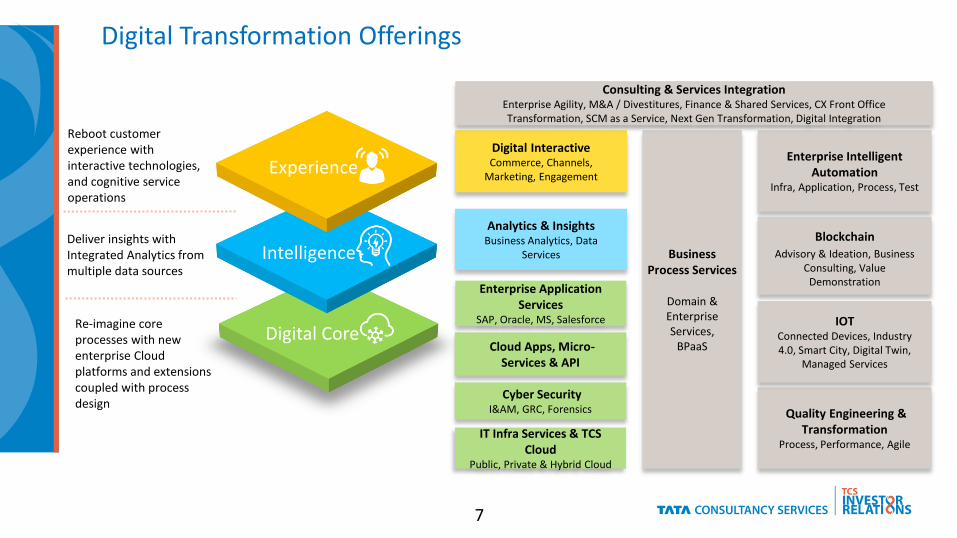
Digital Core
Intelligence
Experience
Reboot customer experience with interactive technologies, and cognitive service operations
Deliver insights with Integrated Analytics from multiple data sources
Re-imagine core processes with new enterprise Cloud platforms and extensions coupled with process design
Analytics & InsightsBusiness Analytics, Data
Services
Digital InteractiveCommerce, Channels,
Marketing, Engagement
Cloud Apps, Micro-Services & API
Enterprise Application Services
SAP, Oracle, MS, Salesforce
IT Infra Services & TCS Cloud
Public, Private & Hybrid Cloud
Cyber SecurityI&AM, GRC, Forensics
Enterprise Intelligent Automation
Infra, Application, Process, Test
Quality Engineering & Transformation
Process, Performance, Agile
Business Process Services
Domain & Enterprise Services,
BPaaS
IOTConnected Devices, Industry 4.0, Smart City, Digital Twin,
Managed Services
Blockchain
Advisory & Ideation, Business Consulting, Value
Demonstration
Consulting & Services IntegrationEnterprise Agility, M&A / Divestitures, Finance & Shared Services, CX Front Office Transformation, SCM as a Service, Next Gen Transformation, Digital Integration
Digital Transformation Offerings
7
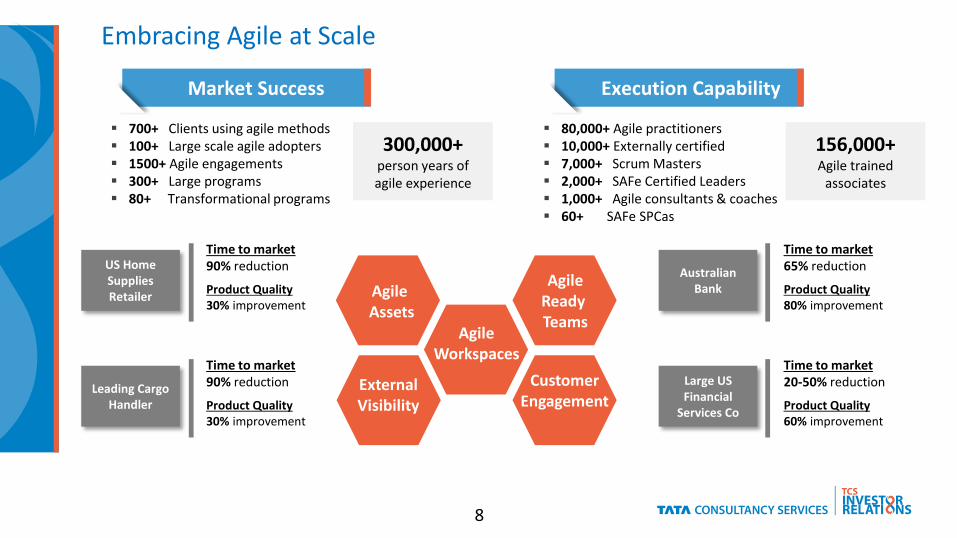
Embracing Agile at Scale
Market Success
700+ Clients using agile methods 100+ Large scale agile adopters 1500+ Agile engagements 300+ Large programs 80+ Transformational programs
300,000+ person years of agile experience
US Home Supplies Retailer
Time to market90% reduction
Product Quality30% improvement
Execution Capability
80,000+ Agile practitioners 10,000+ Externally certified 7,000+ Scrum Masters 2,000+ SAFe Certified Leaders 1,000+ Agile consultants & coaches 60+ SAFe SPCas
156,000+ Agile trained
associates
Australian Bank
Time to market65% reduction
Product Quality80% improvement
Leading Cargo Handler
Time to market90% reduction
Product Quality30% improvement
Large US Financial
Services Co
Time to market20-50% reduction
Product Quality60% improvement
AgileReady Teams
CustomerEngagement
ExternalVisibility
AgileWorkspaces
Agile Assets
8

Scalable Reskilling using the Digital Learning Platform
FY 17: 215k employees trained in Digital598k+ competencies acquired
Anytime, Anyplace, Any device
Analytics and Insights Cloud
Mobility, Digital Marketing IOT & Cyber Security
Rich & ExpandingCrowd sourced “faculty”
Content
Domain-infused, Culture focused, Gamified
Delivery
Cloud based, Immersive and Virtual
Infrastructure
Access
9

Investments in Design Capabilities
10
Physical presence
DESIGN STUDIOS & LABS20INNOVATION CENTERS11DISTRIBUTED AGILE
ENGINEERING CENTERS13
PeopleDesign, content, and technologyIndustry and domainBest-in-class lateral hiresAcademia collaboration
PartnersPartner-led growth strategyJoint go-to-marketMulti-partner ecosystems
35+ Design / Mktg Awards
Unique, immersive, shared spaces thatbring new ideas to the fore
Process & toolchainIdeation-to-consumption Integrated collaborative toolchain bringing together design, strategy, engineering, customers and users
Design Studio, Santa Clara
Executive Briefing Center, Mumbai

Focus Areas for Research & Innovation
BFS
Frictionless Experience Insights & Automation Disintermediation Reg-Tech Security
Retail
Immersive & Connected Customer Engagement
Intelligent Merchandising & Store Operations
Life Sciences
Personalized Medicine Simplification Enterprise Automation
Manufacturing & Industrial
Digital Mfg &Ops Value Chain Re imagination Safety
Image & Speech Recognition NLP/NLG Augmented Reality Speech Biometrics Cognitive Automation
Software Systems, Physical Sciences, Life Sciences, Behavioural-Social-and-Business Systems
Foundational Research
Data and Decision Sciences,Enterprise Intelligent Automation, Cyber Physical Systems
Automation
Compliance, Enterprise Security, Risk, Data PrivacyGovernance
Energy, Agriculture, Urban ChallengesSustainability
AI
11

TCS ADD TCS HOBSAssessment
& more
& more
& more3,359 patent applications to date, 478 patents granted till date
CHROMAIntegrated Urban
ExchangeCustomer
Intelligence & InsightsTAP -
TCS Accounts Payable
Technology Products
Horizontal Products & Platforms
Vertical Products & Platforms
Portfolio of Intellectual Property
12

Co-innovating with the Startup Eco-system
Visibility
Investor Portfolio
Events, Meetups
Demo days
Hackathons
Conferences, Forums
Customer Innovation
Partner Innovation
Publications
TCS BU Requests
2,029
Validation
TCS Horizontals
and Vertical
BUs
Customer BUs
702
Valuation
Joint Go to Market
Strategic Alliances
76
GEOGRAPHY TECHNOLOGY VERTICAL
USA, APAC Robo Advisory BFS
USA Data Streaming BFS
USA FX Payments BFS
USA Visual IVR BFS
USA AI - Data Enrichment BFS, CPG
USA Big Data CPG
USA Home Automation INS
UK Cybersecurity MFG
India AI - Fraud BFS
India ChatBots BFS
India Payments BFS
India Data Digitization MFG
India Big Data Analytics Retail, CPG
Europe DB Devops BFS
Europe NLG INS
Europe Language Translation MFG
Australia Test Automation BFS
APAC Gamification Telecom
13

Alliances and Partnerships
Machine Learning / NLP / NLG
Cognitive Intelligence
Robotic Process Automation
Smart WorkflowAutomation & AI Others
Cloud IoT Big Data Analytics
Digital Interactive
14
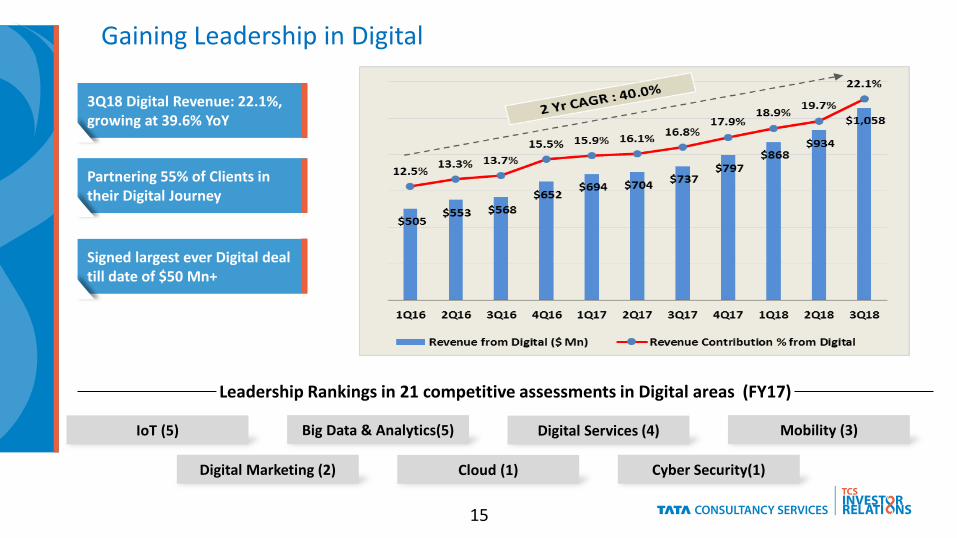
Gaining Leadership in Digital
3Q18 Digital Revenue: 22.1%, growing at 39.6% YoY
Partnering 55% of Clients in their Digital Journey
Signed largest ever Digital deal till date of $50 Mn+
Digital Services (4)Big Data & Analytics(5)IoT (5) Mobility (3)
Leadership Rankings in 21 competitive assessments in Digital areas (FY17)
Cloud (1)Digital Marketing (2) Cyber Security(1)
15

Longer Term Growth Strategy

Customer Centric Model
Relationship Orientation
Innovation focus and IP
Deep domain expertise
Contextual knowledge
Agile, Global Delivery
Full Services Capability
Differentiated, bespoke solutions
Time to Market
Greater predictability
Superior Outcomes
More Repeat Business
Enduring relationships
Wider footprint
17

Going Deeper, Casting Wider
…….BU 1 BU 2 BU 3 BU 4 BU 23 BU 24
Digital Transformation Services
Cognitive Business Operations
Consulting & Service Integration
Digital InteractiveEnterprise AppsCloud & Cloud Apps
IoT, Analytics & InsightsIntelligent AutomationCyber Security
Business Process Services IT Infrastructure Services
No
rth
Am
eri
caU
K &
Eu
rop
eA
PAC
& In
dia
MEA
& L
atA
m
New Industry Vericals
New Service Offerings
New Clients, New Markets
18
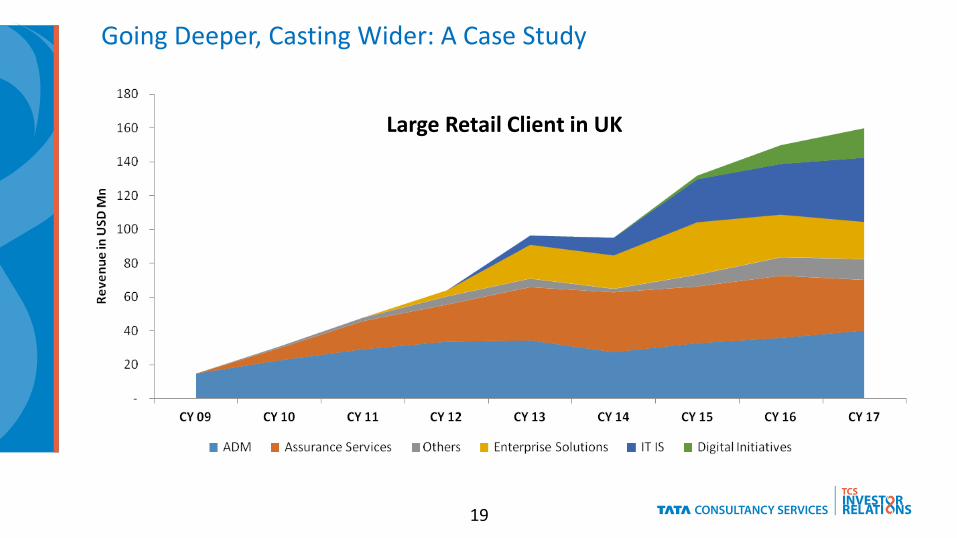
Going Deeper, Casting Wider: A Case Study
Large Retail Client in UK
19

3
1435
43
84
99
190
FY12 FY17
Large Client Metrics
US$ 20 Mn+
US$ 50 Mn+
US$ 100 Mn+
Going Deeper, Casting Wider: Business Outcomes
8
9
FY 11 FY 16
Rev in USD Bn
3
4 New clients
New services
Same clients, same services
20
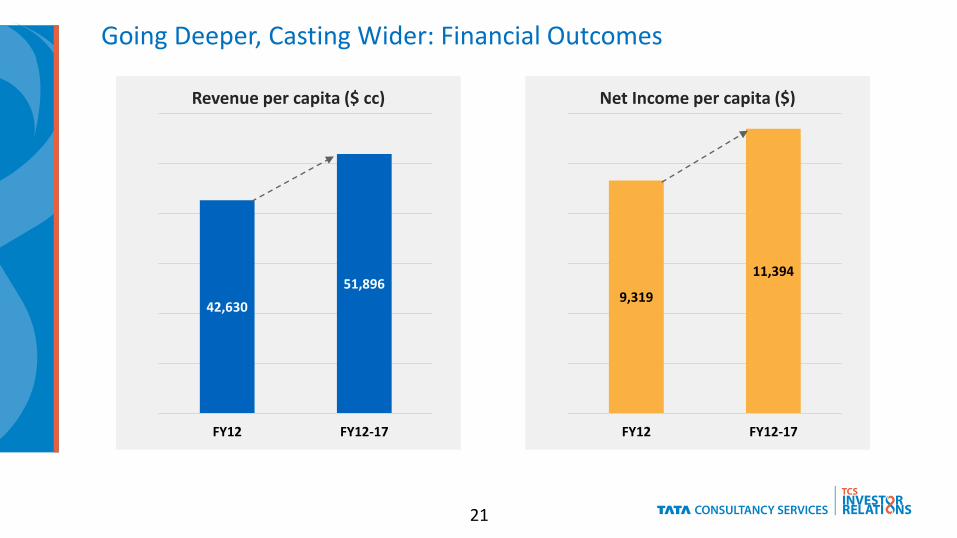
42,630
51,896
FY12 FY12-17
Revenue per capita ($ cc)
Going Deeper, Casting Wider: Financial Outcomes
9,319
11,394
FY12 FY12-17
Net Income per capita ($)
21
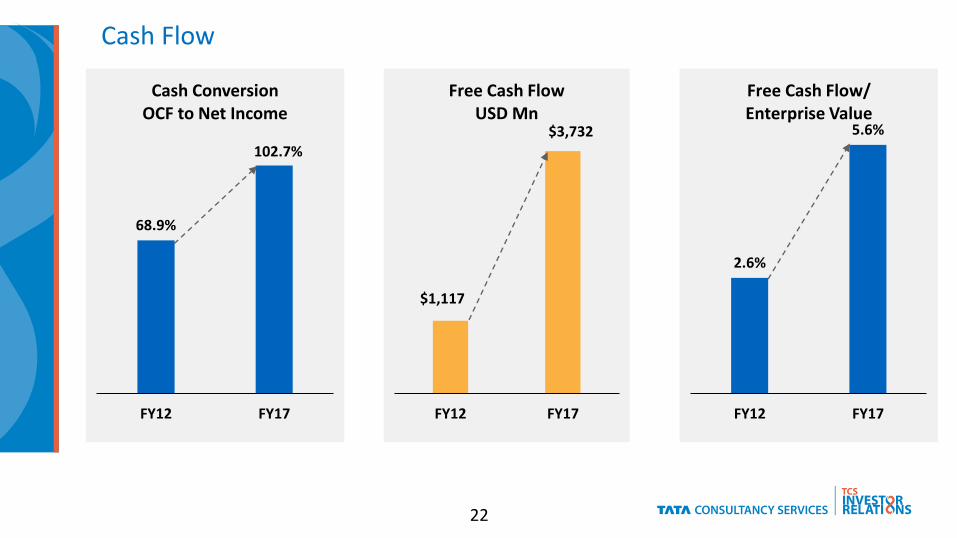
Cash Flow
$1,117
$3,732
FY12 FY17
Free Cash Flow USD Mn
68.9%
102.7%
FY12 FY17
Cash ConversionOCF to Net Income
2.6%
5.6%
FY12 FY17
Free Cash Flow/Enterprise Value
22
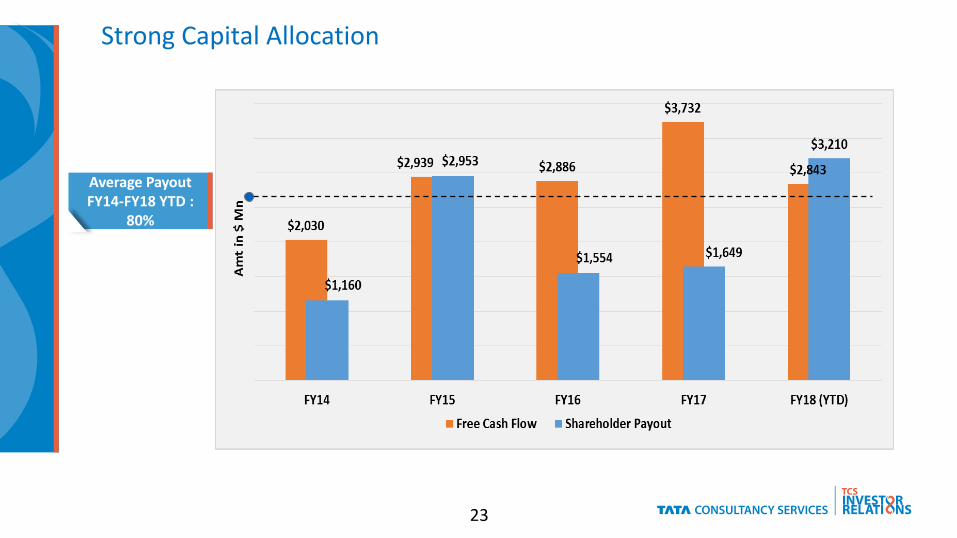
Strong Capital Allocation
Average Payout FY14-FY18 YTD :
80%
23
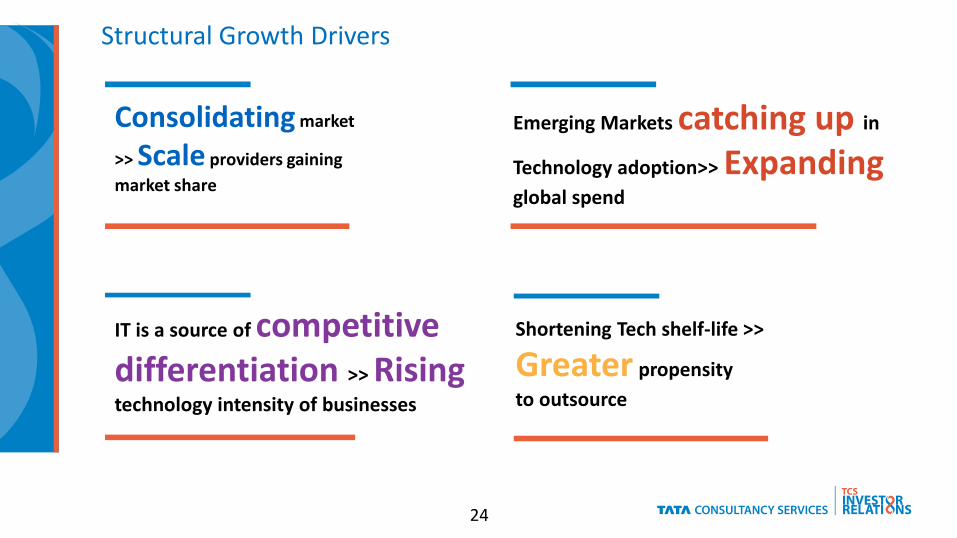
Structural Growth Drivers
Emerging Markets catching up in
Technology adoption>> Expandingglobal spend
Consolidating market
>> Scale providers gaining
market share
IT is a source of competitive differentiation >> Risingtechnology intensity of businesses
Shortening Tech shelf-life >>
Greater propensity
to outsource
24
Annexure
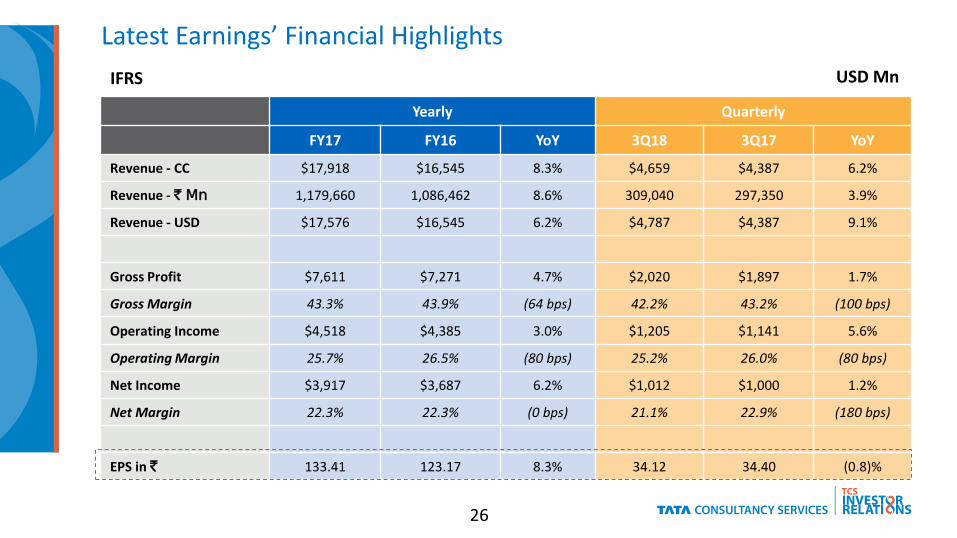
Latest Earnings’ Financial Highlights
USD Mn
Yearly Quarterly
FY17 FY16 YoY 3Q18 3Q17 YoY
Revenue - CC $17,918 $16,545 8.3% $4,659 $4,387 6.2%
Revenue - ` Mn 1,179,660 1,086,462 8.6% 309,040 297,350 3.9%
Revenue - USD $17,576 $16,545 6.2% $4,787 $4,387 9.1%
Gross Profit $7,611 $7,271 4.7% $2,020 $1,897 1.7%
Gross Margin 43.3% 43.9% (64 bps) 42.2% 43.2% (100 bps)
Operating Income $4,518 $4,385 3.0% $1,205 $1,141 5.6%
Operating Margin 25.7% 26.5% (80 bps) 25.2% 26.0% (80 bps)
Net Income $3,917 $3,687 6.2% $1,012 $1,000 1.2%
Net Margin 22.3% 22.3% (0 bps) 21.1% 22.9% (180 bps)
EPS in ` 133.41 123.17 8.3% 34.12 34.40 (0.8)%
IFRS
26

Thank YouThank You


![Investor Relations - hanatourcompany.comhanatour]ir_presentation_june... · Investor Relations 1 Investor Relations Jun. 2009.(Korean) 2 ... (cf. 국내소비0.3% 증가, 자료:한국은행,2006)](https://img.pdfslide.net/doc/110x75/5a881d307f8b9a87368ecd91/investor-relations-hanatourirpresentationjuneinvestor-relations-1-investor.jpg)