Embed Size (px)
Citation preview

Investor Update
August 2019

1
Safe Harbor Statement
This presentation contains forward-looking statements that are subject to a number of risks and uncertainties, many of which are beyond our control. These forward-looking statementswithin the meaning of Section 27A of the Securities Act of 1933, as amended (the “Securities Act”) and Section 21E of the Securities Exchange Act of 1934, as amended (the“Exchange Act”) can be identified by the use of forward-looking terminology including “may,” “should,” “likely,” “will,” “believe,” “expect,” “anticipate,” “estimate,” “continue,” “plan,”“intend,” “projects,” or other similar words. All statements, other than statements of historical fact included in this presentation, regarding strategy, future operations, financial position,estimated revenues and losses, projected costs, prospects, plans, objectives and beliefs of management are forward-looking statements. Forward-looking statements appear in anumber of places in this presentation and may include statements about business strategy and prospects for growth, customer acquisition costs, ability to pay cash dividends, cashflow generation and liquidity, availability of terms of capital, competition and government regulation and general economic conditions. Although we believe that the expectationsreflected in such forward-looking statements are reasonable, we cannot give any assurance that such expectations will prove correct.
The forward-looking statements in this presentation are subject to risks and uncertainties. Important factors that could cause actual results to materially differ from those projected inthe forward-looking statements include, but are not limited to: changes in commodity prices; the sufficiency of risk management and hedging policies and practices; the impact of extreme and unpredictable weather conditions, including hurricanes and other natural disasters; federal, state and local regulation, including the industry's ability to address or adapt to potentially restrictive new regulations that may be enacted by public utility commissions; our ability to borrow funds and access credit markets; restrictions in our debt agreements and collateral requirements; credit risk with respect to suppliers and customers; changes in costs to acquire customers as well as actual attrition rates; accuracy of billing systems; ability to successfully identify, complete, and efficiently integrate acquisitions into our operations; significant changes in, or new charges by, the ISOs in the regions in which we operate; competition; and the “Risk Factors” in our latest Annual Report on Form 10-K for the year ended December 31, 2018, and in our Quarterly Reports on Form 10-Q, and other public filings and
press releases.
All forward-looking statements speak only as of the date of this presentation. Unless required by law, we disclaim any obligation to publicly update or revise these statements whetheras a result of new information, future events or otherwise. It is not possible for us to predict all risks, nor can we assess the impact of all factors on the business or the extent to whichany factor, or combination of factors, may cause actual results to differ materially from those contained in any forward-looking statements.
In this presentation, we refer to EBITDA and Adjusted EBITDA, which are non-GAAP financials measures the Company believes are helpful in evaluating the performance of itsbusiness. Except as otherwise noted, reconciliation of such non-GAAP measures to the relevant GAAP measures can be found at the end of this presentation.
Investors are advised that the Company does not furnish investor presentations on a Current Report on Form 8-K. Investors should consult the Company’s website atir.sparkenergy.com to review subsequent investor presentations.

Spark Energy, Inc. Independent Retail Energy Services Provider
20 Years of Dedicated Service to the Deregulated Energy Markets
Current Price $10.8852-Week Price Range $7.20 - $11.71Shares Outstanding 14.4 MMAvg. Daily Vol. (30 day) 90 KMarket Capitalization $382.8 MMNet Debt* $66.4 MMPreferred Stock $90.6 MMEnterprise Value $539.8 MMAnnual Dividend $0.725Implied Dividend Yield 6.7%
Spark Energy at a Glance
Market Data as of August 6, 2019; Debt as of June 30, 2019 *Net Debt is Debt of $94.0 MM minus Cash of $27.6 MM

3
How Spark Energy Serves its Customers
Delivering Electricity Delivering Natural Gas
GENERATION
SPARK ENERGY SPARK ENERGY
DISTRIBUTION DISTRIBUTION
PRODUCTION TRANSPORTATIONTRANSMISSION
Green and Renewable Products
Stable and Predictable Energy Costs
Potential Cost Savings
Our Value Proposition to the Customer

4
Spark’s Geographical Diversity:19 States and 94 Utility Territories
RCE counts do not include contribution from eREX Spark Marketing joint venture in Japan
Electricity Natural Gas
CA
NV
AZ
TX
COIL IN OH
MI
FL
PA
NY MA
CT
NJ
NH
ME
DCMD
DE
(In thousands) Electricity Percent Natural Gas Percent Total PercentNew England 301 45% 28 19% 329 40%Mid-Atlantic 237 35% 48 33% 285 35%Midwest 68 10% 49 34% 116 14%Southwest 67 10% 20 14% 87 11%Total 673 100% 145 100% 818 100%
Residential Customer Equivalents (RCEs) as of June 30, 2019

5
Spark Energy Recent Developments
Strong second quarter despite mild temperatures Unit margins returning to normal run rates
Nearing completion of our brand and consolidation efforts
Amended and extended Senior Credit Facility and Subordinated Debt Facility
Settled several significant legacy litigation items
Over 70% of all new sales YTD fully renewable electricity or carbon-neutral natural gas
Terminated Tax Receivables Agreement (“TRA”) Will increase stockholders equity Reduction in future cash payments

6
Opportunities for Organic Growth
Natural Gas
Electricity
36MM Eligible RCEs1,2
19% Penetration<1% Spark Share
149MM Eligible RCEs2
37% Penetration<1% Spark Share
Only 19% of eligible natural gas customers and 37% of eligible electricity customers have made a competitive supplier choice2
Source: EIA1Residential customers only2Eligible customers defined as customers in deregulated states
New Channels
Door-to-Door
Direct Mail
Telemarketing
Online
• Multiple brands allow for brand positioning and winback strategies
• Outsourced vendor relationships allow rapid scaling and low fixed costs while driving quality, efficiency and flexibility
• Organic commission structure ensures customer quality and lifetime value

7
Customer Lifetime Value Strategy
Actively Managed Customer Base Drives Profitability
Multi-channel sales
Diverse sales geography
Leverage analytics to
determine market entry and
product tailoring
Contracted revenue model
with subscription-like flow
Sophisticated Customer Acquisition Model
Attractive EBITDA margin
and cash flow conversion
Targeted payback period is
12 months
Long-standing customer
relationships
Create Long-Tenure, High Value Customers
Analyze historical usage and attrition data to optimize customer profitability
Customer retention team focused on product selection, renewal, and cross-sell opportunities
Win-back strategy leverages customers across multiple brands
Provide high-quality service
Increase Lifetime Value

8
Managing Commodity Price Risk
Proven hedging strategy that has been refined over Spark Energy’s 20 year history
Demonstrated ability to manage through up-and-down commodity markets, extreme weather events, and down economies
Disciplined risk management supports business strategy
Virtually all fixed price exposure is hedged
Variable hedging policy based on individual market characteristics
Hedging policy monitored closely by CFO and Risk Committee
Risk management policy approved by syndicate banks and Board of Directors
Over $280MM in available credit with wholesale suppliers1
Seasoned, in-house supply team provides a strong competitive advantage relative to our peers while ensuring risk mitigation
1 As of June 30, 2019
9
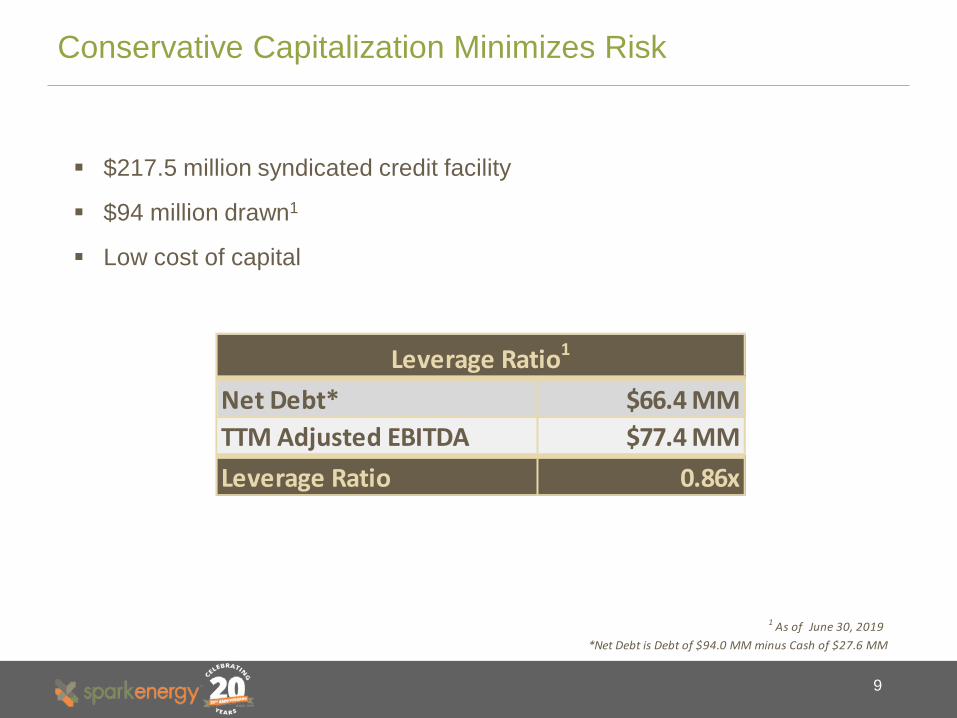
Conservative Capitalization Minimizes Risk
$217.5 million syndicated credit facility
$94 million drawn1
Low cost of capital
Net Debt* $66.4 MMTTM Adjusted EBITDA $77.4 MMLeverage Ratio 0.86x
Leverage Ratio1
1 As of June 30, 2019 *Net Debt is Debt of $94.0 MM minus Cash of $27.6 MM

10
Portfolio Optimization
Spark is focusing on high-value customers to increase cash flow diversification and stability
75%
25%
Commodity Mix
ElectricityNatural Gas
65%
35%
RCE Mix
ResidentialC&I
75%
25%
Credit Mix
PORNon-POR
Electricity Unit Margin
$27.00 -$30.00 /
MWh
Natural Gas Unit Margin
/ MMBtu$3.75 -$4.00 / MMBtu
G&A1 / Gross Margin
54% 40-45%
Future Expectation Future Expectation
1excludes un-capitalized CAC, Non Cash Compensation and Non-Recurring legal Charges
82%
18%
56%44%
60%
40%
As of June 30, 2019 TTM at June 30, 2019
/ MWh$18.06
$3.82

11
Clear line of sight for meaningful uplift to Adjusted EBITDA through mass market focus and unit margin normalization
Full supply desk and risk department work together to hedge portfolio and optimize margins
Highly experienced senior management team
Multiple Accretive
Acquisitions and Integrations
14Transactions
since IPO
Consistent Organic Growth
~20%Organic customer CAGR since IPO
Conservative Capitalization
and Risk Management
Leverage Ratio
Committed tothe Dividend
and Total Shareholder
Return
$0.725Annual Dividend
Customer & Product
Diversification Underpins our
Dividend
19 States94 Utilities
2 Commodities4 Key Brands
Strong Track RecordSustainable Dividends
Key Investment Highlights
~0.86x

Investor Relations Contact Information
Investor RelationsSpark Energy, Inc.12140 Wickchester Lane, Suite 100Houston, TX 77079http://ir.sparkenergy.com/
Contact: Christian [email protected]

Appendix

14
Spark by the Numbers
$70.7
$102.9
$13.6
$16.1
$0.0
$2.0
$4.0
$6.0
$8.0
$10.0
$12.0
$14.0
$16.0
$18.0
$0.0
$20.0
$40.0
$60.0
$80.0
$100.0
$120.0
2018 2017 2Q19 2Q18
Adjusted EBITDA ($MM)
818
1,049
-
200
400
600
800
1,000
1,200
June 30, 2019 June 30, 2018
Residential Customer Equivalents (000s)
($ in millions) 2018 2017 2Q19 2Q18
Revenue $1,001.4 $798.8 $177.8 $232.3
Retail Gross Margin $185.1 $224.5 $41.7 $43.4
Adjusted EBITDA $70.7 $102.9 $13.6 $16.1
Customer Acq. Costs $13.7 $25.9 $3.4 $2.0
2Q2019 2Q2018
RCEs (000s) 818 1,049
RCE Attrition 3.8% 3.7%
Electricity Volume (MWh) 1,516,139 2,100,007
Natural Gas Volume (MMBtu) 2,057,121 2,840,721
Electricity Unit Margin ($/MWh) $22.17 $15.54
Natural Gas Unit Margin ($/MMBtu) $3.94 $3.80

15
Proven Leadership
James G Jones II • Chief Financial Officer Served as Spark Energy, Inc. Independent Director and Chair of Audit and Special Committees
until his appointment as CFO Extensive finance and tax experience, including as partner at Weaver Tidwell, LLP, Padgett
Stratemann & Co, and Ernst & Young LLP
Jason Garrett • Executive Vice President – Retail Served in leadership roles, including M&A, for various deregulated energy companies including
SouthStar Energy, Just Energy, and Continuum Proven success and expertise in sales leadership, call center management,
operational improvements and cost reduction initiatives
C. Alexis Keene • Interim General Counsel and Corporate Secretary Former SVP and General Counsel to EDF Energy Services, LLC Seasoned legal executive with extensive regulatory, compliance, and M&A experience
Nathan Kroeker • Chief Executive Officer and President Veteran leader in sales strategy, global energy supply, and M&A across the upstream,
downstream, and midstream energy sectors Extensive international experience; board member of ESM (a Japanese retail energy company);
previously worked for Macquarie and Centrica Certified Public Accountant and Chartered Accountant
Extensive Experience Across the Team Ensures Value Creation
Senior Management has over 50 Years of Retail Energy Experience

16
Board of DirectorsW. Keith Maxwell III • Chairman of the Board of DirectorsMr. Maxwell serves as non-executive Chairman of the Board of Directors, and was appointed to this position in connection with the IPO in 2014. Mr. Maxwell also serves as Chief ExecutiveOfficer of NuDevco Partners, LLC and National Gas & Electric, LLC, each of which is affiliated with us. Prior to founding the predecessor of Spark Energy in 1999, Mr. Maxwell was afounding partner in Wickford Energy, an oil and natural gas services company, in 1994. Wickford Energy was sold to Black Hills Utilities in 1997. Prior to Wickford Energy, Mr. Maxwell was apartner in Polaris Pipeline, a natural gas producer services and midstream company sold to TECO Pipeline in 1994. In 2010, Mr. Maxwell was named Ernst & Young Entrepreneur of the Yearin the Energy, Chemicals and Mining category. A native of Houston, Texas, Mr. Maxwell earned a Bachelor’s Degree in Economics from the University of Texas at Austin in 1987. Mr. Maxwellhas several philanthropic interests, including the Special Olympics, Child Advocates, Salvation Army, Star of Hope and Helping a Hero. We believe that Mr. Maxwell’s extensive energyindustry background, leadership experience developed while serving in several executive positions and strategic planning and oversight brings important experience and skill to our board ofdirectors.
Nathan Kroeker • Director, President and Chief Executive OfficerMr. Kroeker was appointed President of Spark Energy in April 2012 and Chief Executive Officer in April 2014. He has served as a director since August 2014. Mr. Kroeker is responsible foroverseeing the day-to-day operations and helping shape the overall strategy of the company. Mr. Kroeker is a 15-year industry veteran with diverse experience in public accounting, M&A,and both retail and wholesale energy. Nathan first joined the company in July 2010 as Executive Vice President and Chief Financial Officer of Spark Energy Ventures. Prior to Spark, Nathanheld senior finance and leadership roles with Macquarie and Direct Energy. He began his career in public accounting, including both audit and M&A advisory functions. Nathan holds aBachelor of Commerce (honors) degree from the University of Manitoba, and has both a CPA (Texas) as well as a CA (Canada). Mr. Kroeker was selected to serve as a director because ofhis financial expertise and his extensive background in the retail energy business.
Nick W. Evans, Jr. • Independent DirectorMr. Evans was appointed to our Board of Directors in May 2016. He is currently the majority partner of ECP Benefits after having worked in the broadcast and communication industry forover twenty-five years. He began his broadcast career at WAGT-TV in Augusta, GA. Prior to that he was with the Georgia Railroad Bank. He served as President and CEO of SpartanCommunications Inc., headquartered at the time in Spartanburg, S.C. He was responsible for the operation of thirteen television stations in seven states. He has served on the boards ofmany broadcast industry organizations including the Georgia Association of Broadcasters, South Carolina Broadcasters Association, National Association of Broadcasters, and was Chairmanof the Television Operators Caucus. He, also, served on numerous civic, community, and non-profit boards and organizations. While a Rotarian, he was selected a Paul Harris fellow. He hasserved on advisory boards for Wachovia Bank of SC, Wells Fargo Bank – Augusta, Azalea Capital and currently Coca Cola Bottling Company United. He holds a BBA degree from AugustaUniversity. Mr. Evans was selected to serve as a director because of his leadership and management expertise.
Kenneth M. Hartwick • Independent DirectorMr. Hartwick was appointed to our Board of Directors in August 2014 and re-elected in May 2015 and May 2018. Mr. Hartwick currently serves as President and Chief Executive Officer of Ontario Power Generation, Inc., an electricity producer, a position he has held since April 2019. Previously, Mr. Hartwick served as Senior Vice President and Chief Financial Officer of Ontario Power Generation, Inc. from March 2016 to April 2019. Mr. Hartwick also serves as a director of MYR Group, Inc. Mr. Hartwick served as the Chief Financial Officer of Wellspring Financial Corporation from February 2015 until March 2016. Mr. Hartwick also served as the interim Chief Executive Officer of Atlantic Power Corporation from September 2014 until January 2015 and as a director from October 2004 until March 2016. He has served in various roles for Just Energy Group Inc., most recently serving as President and Chief Executive Officer from 2006 to February 2014. Mr. Hartwick served as the Chief Financial Officer of Hydro One, Inc., an energy distribution company, from 2002 to 2004. Mr. Hartwick holds an Honours of Business Administration degree from Trent University. Mr. Hartwick was selected to serve as a director because of his extensive knowledge of the retail natural gas and electricity business and his leadership and management expertise.

17
Up-C Structure
Public
Spark Energy, Inc.
Sponsor
Spark HoldCo
Operating Subsidiaries
Publicly traded 100% of economic interest in
Spark Energy, Inc.
Not publicly traded No economic rights2
2Sponsor receives distributions through direct interest in Spark HoldCo
20,800,000 Shares 1Class B Common Stock
14,379,553 Shares 1Class A Common Stock
1 Shares as of June 30, 2019

18
Proven Track Record of Acquisitions and Integration
Recent Transactions
~65,000 RCEs13 New Markets
July 2015
~40,000 RCEs7 New Markets
July 2015
~121,000 RCEs9 New Markets
August 2016
~220,000 RCEs15 New Markets
August 2016
~145,000 RCEs3 New Markets
July 2017
~60,000 RCEsMid-Atlantic /
Midwest
October 2018
~60,000 RCEs1 New State &
Market
April 2017
~29,000 RCEsN.E. / Mid-Atlantic /
Midwest
March 2018
~50,000 RCEsN.E. / Mid-Atlantic /
Midwest
April 2018

19
Spark in the Community
Through Spark’s work with the Arbor Day Foundation, Spark is able to extend its environmental efforts far beyond green energy.
Every August Spark Energy employeesget involved as ‘personal shoppers’ alongside a child at a designated Target store during Child Advocates’ annual Childspree, helping children select back-to-school clothes, eat breakfast, and return home with a backpack full of school supplies.
1.6 million people around the world lack proper access to electricity. Through Spark’s relationship with LuminAID, it is developing programs to distribute solar-powered inflatable lights to areas that need it the most.
The Woods Project promotes the importance of getting underserved students outdoors. To help students trade screen time for green time, The Woods Project hosts after-school programs, weekend excursions, and a summer program. Spark participates in the biggest annual fundraiser, the Walk for the Woods Project 5K, and in 2019 took home the Golden Boot award for the most participants.
Empower What Matters MostSpark partners with organizations that:
• Raise the quality of life for children• Make communities better places to live and work• Provide an avenue for employees to get involved in the community
and to support the company’s green values
Spark is directly connected to the Clubs through active Board representation, volunteerism, and in providing critical resources. The Boys & Girls Clubs provides a safe and positive place, particularly in at-risk areas, for youth to go after school and in the summer. Through the Clubs, Spark provides direct support to youth via programs focused on Academic Success, Healthy Lifestyles, and Good Character/Citizenship.

Appendix: Reg. G

21
Reg. G
Appendix Table A-1: Adjusted EBITDA ReconciliationThe following table presents a reconciliation of Adjusted EBITDA to net income for each of the periods indicated.
($ in thousands) 2018 2017 2Q19 2Q18
Net (loss) income (14,392)$ 75,044$ (25,484)$ 23,927$
Depreciation and amortization 52,658 42,341 10,312 12,861
Interest expense 9,410 11,134 1,995 2,316
Income tax (benefit) expense 2,077 38,765 (4,586) 3,251
EBITDA 49,753 167,284 (17,763) 42,355
Less:
Net, (losses) gains on derivative instruments (18,170) 5,008 (35,456) 17,054
Net, Cash settlements on derivative instruments (10,587) 16,309 12,769 8,792
Customer acquisition costs 13,673 25,874 3,396 1,980
Plus:
Non-cash compensation expense 5,879 5,058 1,260 1,555
Change in Tax Receivable Agreement Liability — (22,267) — —
Non-recurring legal and regulatory settlements — — 10,807 —
Adjusted EBITDA $70,716 $102,884 $13,595 $16,084

22
Reg. G
Appendix Table A-2: Adjusted EBITDA ReconciliationThe following table presents a reconciliation of Adjusted EBITDA to net cash provided by operating activities for each of the periods indicated.
($ in thousands) 2018 2017 2Q19 2Q18
Net cash provided by (used in) operating activities 59,763$ 62,131$ 20,976$ 45,950$
Amortization and write off of deferred financing costs (1,291) (1,035) (237) (317)
Allowance for doubtful accounts and bad debt expense (10,135) (6,550) (2,166) (3,302)
Interest expense 9,410 11,134 1,995 2,316
Income tax (benefit) expense 2,077 38,765 (4,586) 3,251
Change in Tax Receivable Agreement Liability — (22,267) — —
Changes in operating working capital
Accounts receivable, prepaids, current assets 10,482 31,905 (41,028) (38,516)
Inventory (674) 718 1,785 1,377
Accounts payable and accrued liabilities (5,093) (13,672) 20,226 7,618
Other 6,177 1,755 16,630 (2,293)
Adjusted EBITDA $70,716 $102,884 $13,595 $16,084
Cash flows provided by (used in) operating activities 59,763$ 62,131$ 20,976$ 45,950$
Cash flows (used in) investing activities (18,981)$ (77,558)$ (246)$ (8,205)$
Cash flows (used in) provided by financing activities (20,563)$ 25,886$ (27,353)$ (23,108)$

23
Reg. G
Appendix Table A-3: Retail Gross Margin ReconciliationThe following table presents a reconciliation of Retail Gross Margin to operating income for each of the periods indicated.
($ in thousands) 2018 2017 2Q19 2Q18
Operating (loss) income (3,654)$ 102,420$ (28,569)$ 28,941$
Depreciation and amortization 52,658 42,341 10,312 12,861
General and administrative 111,431 101,127 37,247 27,780
Less:
Net asset optimization revenue (expense) 4,511 (717) (56) 763
Net, (losses) gains on non-trading derivative instruments (19,571) 5,588 (35,466) 16,601
Net, Cash settlements on non-trading derivative instruments (9,614) 16,508 12,788 8,793
Retail Gross Margin $185,109 $224,509 $41,724 $43,425
Retail Gross Margin – Retail Electricity Segment 124,668$ 158,468$ 33,614$ 32,642$
Retail Gross Margin – Retail Natural Gas Segment 60,441$ 66,041$ 8,110$ 10,783$

24
Reg. GAdjusted EBITDAWe define “Adjusted EBITDA” as EBITDA less (i) customer acquisition costs incurred in the current period, (ii) net gain (loss) on derivative instruments, and (iii) net current periodcash settlements on derivative instruments, plus (iv) non-cash compensation expense, and (v) other non-cash and non-recurring operating items. EBITDA is defined as net income(loss) before provision for income taxes, interest expense and depreciation and amortization. We deduct all current period customer acquisition costs (representing spending fororganic customer acquisitions) in the Adjusted EBITDA calculation because such costs reflect a cash outlay in the period in which they are incurred, even though we capitalizesuch costs and amortize them over two years. We do not deduct the cost of customer acquisitions through acquisitions of business or portfolios of customers in calculated AdjustedEBITDA. We deduct our net gains (losses) on derivative instruments, excluding current period cash settlements, from the Adjusted EBITDA calculation in order to remove the non-cash impact of net gains and losses on derivative instruments. We also deduct non-cash compensation expense as a result of restricted stock units that are issued under our long-term incentive plan. Finally, we also adjust from time to time other non-cash or unusual and / or infrequent charges due to either their non-cash nature or their infrequency.
We believe that the presentation of Adjusted EBITDA provides information useful to investors in assessing our liquidity and financial condition and results of operations and thatAdjusted EBITDA is also useful to investors as a financial indicator of our ability to incur and service debt, pay dividends and fund capital expenditures. Adjusted EBITDA is asupplemental financial measure that management and external users of our combined and consolidated financial statements, such as industry analysts, investors, commercialbanks and rating agencies, use to assess the following:
our operating performance as compared to other publicly traded companies in the retail energy industry, without regard to financing methods, capital structure or historicalcost basis;
the ability of our assets to generate earnings sufficient to support our proposed cash dividends; and our ability to fund capital expenditures (including customer acquisition costs) and incur and service debt.
Retail Gross MarginWe define retail gross margin as operating income plus (i) depreciation and amortization expenses and (ii) general and administrative expenses, less (i) net asset optimizationrevenues, (ii) net gains (losses) on non-trading derivative instruments, and (iii) net current period cash settlements on non-trading derivative instruments. Retail gross margin isincluded as a supplemental disclosure because it is a primary performance measure used by our management to determine the performance of our retail natural gas and electricitybusiness by removing the impacts of our asset optimization activities and net non-cash income (loss) impact of our economic hedging activities. As an indicator of our retail energybusiness’ operating performance, retail gross margin should not be considered an alternative to, or more meaningful than, operating income, its most directly comparable financialmeasure calculated and presented in accordance with GAAP.
The GAAP measures most directly comparable to Adjusted EBITDA are net income and net cash provided by operating activities. The GAAP measure most directly comparable toRetail Gross Margin is operating income (loss). Our non-GAAP financial measures of Adjusted EBITDA and Retail Gross Margin should not be considered as alternatives to netincome (loss), net cash provided by operating activities, or operating income (loss). Adjusted EBITDA and Retail Gross Margin are not presentations made in accordance withGAAP and have important limitations as analytical tools. You should not consider Adjusted EBITDA or Retail Gross Margin in isolation or as a substitute for analysis of our resultsas reported under GAAP. Because Adjusted EBITDA and Retail Gross Margin exclude some, but not all, items that affect net income (loss) net cash provided by operatingactivities, and operating income (loss), and are defined differently by different companies in our industry, our definition of Adjusted EBITDA and Retail Gross Margin may not becomparable to similarly titled measures of other companies.
Management compensates for the limitations of Adjusted EBITDA and Retail Gross Margin as analytical tools by reviewing the comparable GAAP measures, understanding thedifferences between the measures and incorporating these data points into management’s decision-making process.

Thank You!