Embed Size (px)
Citation preview
Investors CommunicationQ4 & 12 months ended 31 March, 201726 May 2017
1
Safe Harbour Statement
“This Presentation, except for the historical information, may contain statements, including the words or
phrases such as ‘expects, anticipates, intends, will, would, undertakes, aims, estimates, contemplates,
seeks to, objective, goal, projects, should’ and similar expressions or variations of these expressions or
negatives of these terms indicating future performance or results, financial or otherwise of Tata
Chemicals Limited, its direct and indirect subsidiaries and its associates. Actual results might differ
substantially or materially from those expressed or implied. Important factors that could make a
difference to the Company’s operations include, among others, economic conditions affecting demand /
supply, price conditions in the domestic and overseas markets in which the Company operates, changes
in Government policies and regulations, tax laws, and other statutes and incidental factors. You are
urged to view all statements contained herein with caution. Tata Chemicals Limited does not undertake
any obligation to update or revise forward look statements, whether as a result of new information,
future events or otherwise”
2
Major events during FY2017
3
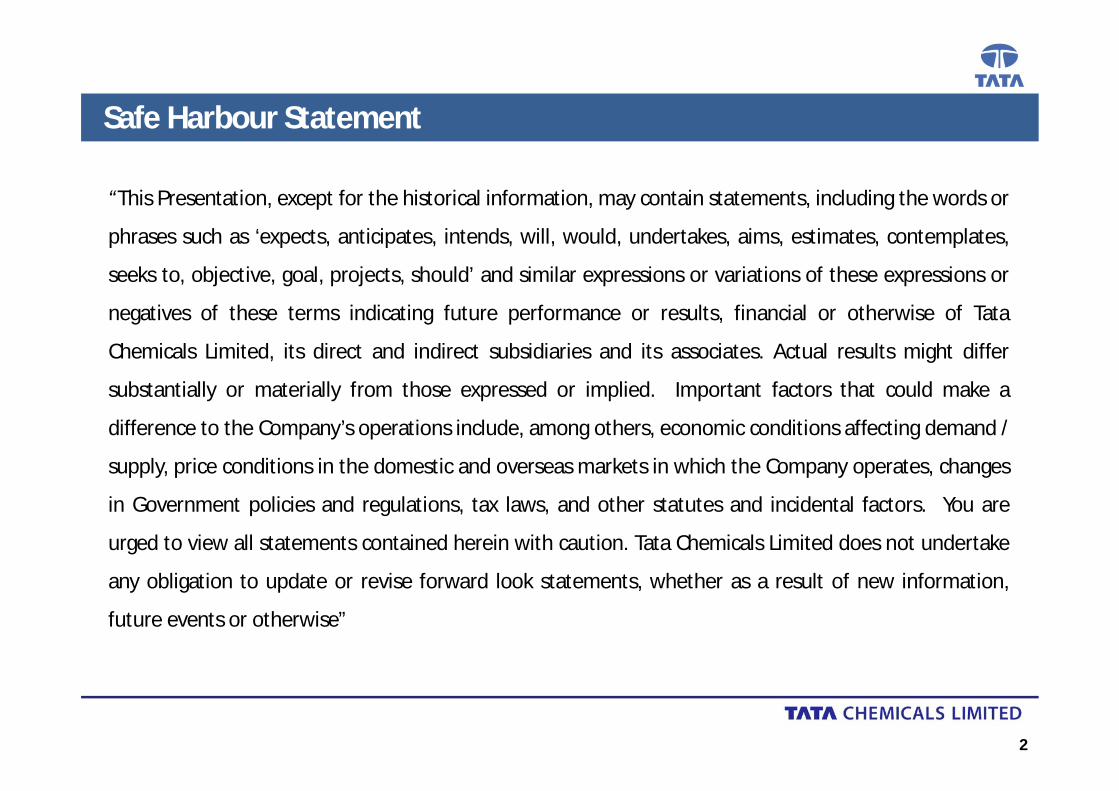
Transfer of ownership rights of assets related to Urea and Customised Fertilizer business situated in Babrala, UP to Yara Fertiliser India Private Limited on a slump sale basis, for Rs 2,670 Crs, subject to adjustments.
Focus on operational efficiencies• Effective working capital management by focus on cash generation in Agri Business• Operating philosophy of Haldia unit is now towards cash generation• Government intervention in pricing / availability of pulses resulted in change in
sourcing cycle
New products launch: • Nutraceuticals segment introduced “TATA Nx” brands (available exclusively on Amazon.com)
Zero Sugar : The 100% Natural Sweetener Lite & Sweet: The 50% less calorie sweetener
• Different variants in pulses /besan and spices.
New green field projects with the total investment of Rs 565 crs • Nutraceuticals project in Nellore, Andhra Pradesh • Highly Disposable Silica (HDS) in Dahej, Gujarat.
Results for Q4 & 12 months ended 31 March, 2017
4
5
Key Highlights
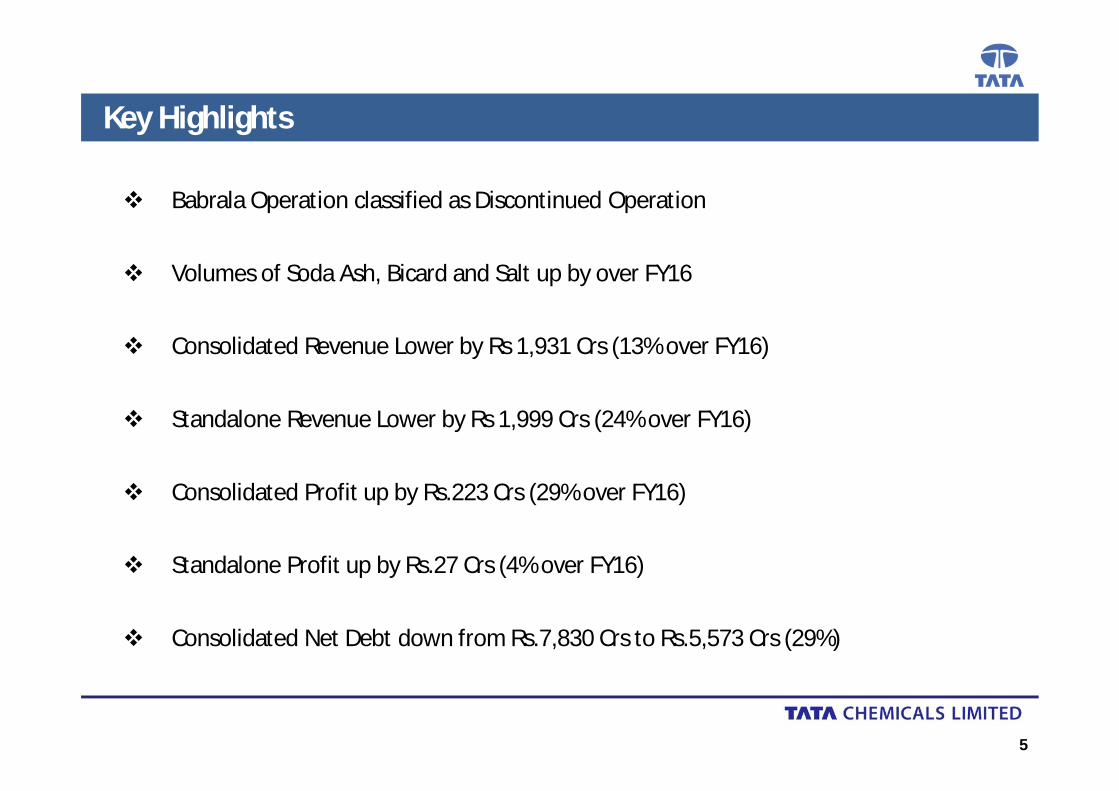
Babrala Operation classified as Discontinued Operation
Volumes of Soda Ash, Bicard and Salt up by over FY16
Consolidated Revenue Lower by Rs 1,931 Crs (13% over FY16)
Standalone Revenue Lower by Rs 1,999 Crs (24% over FY16)
Consolidated Profit up by Rs.223 Crs (29% over FY16)
Standalone Profit up by Rs.27 Crs (4% over FY16)
Consolidated Net Debt down from Rs.7,830 Crs to Rs.5,573 Crs (29%)
Key Highlights – Quarter ended 31 March, 2017
* As per IND AS, dividend can be declared only after shareholders approval
6
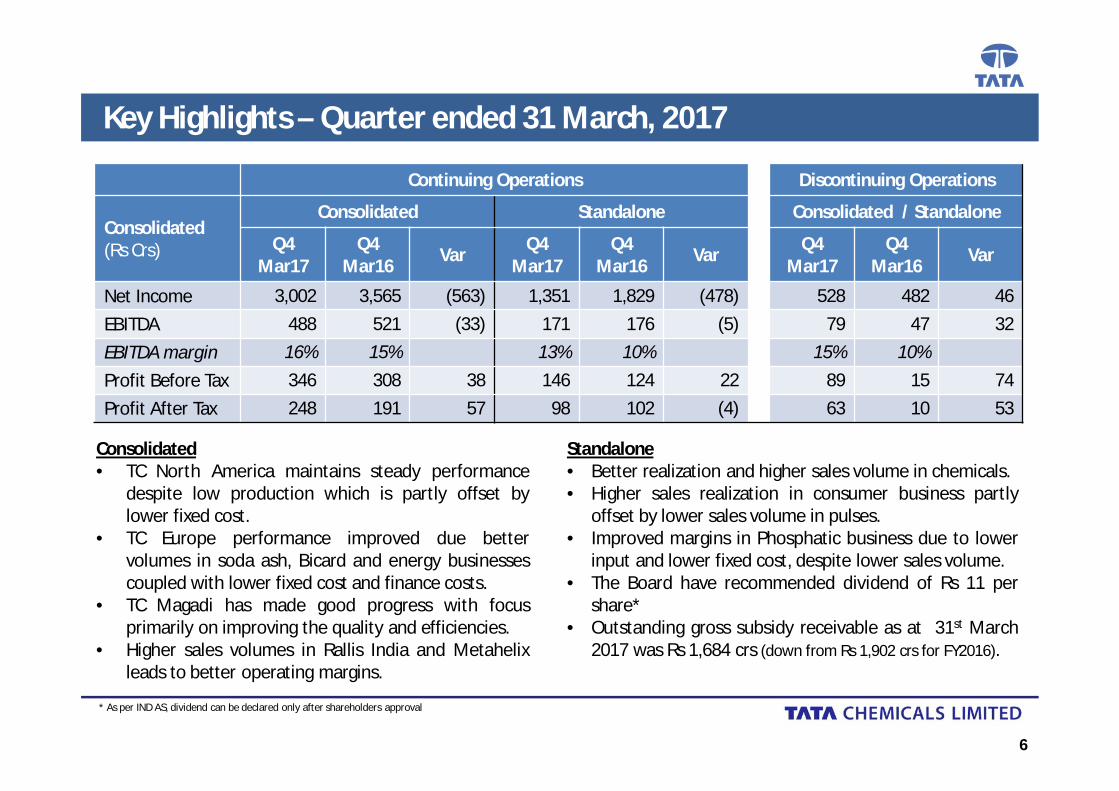
Continuing Operations Discontinuing Operations
Consolidated(Rs Crs)
Consolidated Standalone Consolidated / Standalone
Q4Mar17
Q4 Mar16 Var Q4
Mar17Q4
Mar16 Var Q4Mar17
Q4 Mar16 Var
Net Income 3,002 3,565 (563) 1,351 1,829 (478) 528 482 46 EBITDA 488 521 (33) 171 176 (5) 79 47 32 EBITDA margin 16% 15% 13% 10% 15% 10%Profit Before Tax 346 308 38 146 124 22 89 15 74 Profit After Tax 248 191 57 98 102 (4) 63 10 53
Consolidated• TC North America maintains steady performance
despite low production which is partly offset bylower fixed cost.
• TC Europe performance improved due bettervolumes in soda ash, Bicard and energy businessescoupled with lower fixed cost and finance costs.
• TC Magadi has made good progress with focusprimarily on improving the quality and efficiencies.
• Higher sales volumes in Rallis India and Metahelixleads to better operating margins.
Standalone• Better realization and higher sales volume in chemicals.• Higher sales realization in consumer business partly
offset by lower sales volume in pulses.• Improved margins in Phosphatic business due to lower
input and lower fixed cost, despite lower sales volume.• The Board have recommended dividend of Rs 11 per
share*• Outstanding gross subsidy receivable as at 31st March
2017 was Rs 1,684 crs (down from Rs 1,902 crs for FY2016).
Key Highlights – YTD 31 March, 2017
7
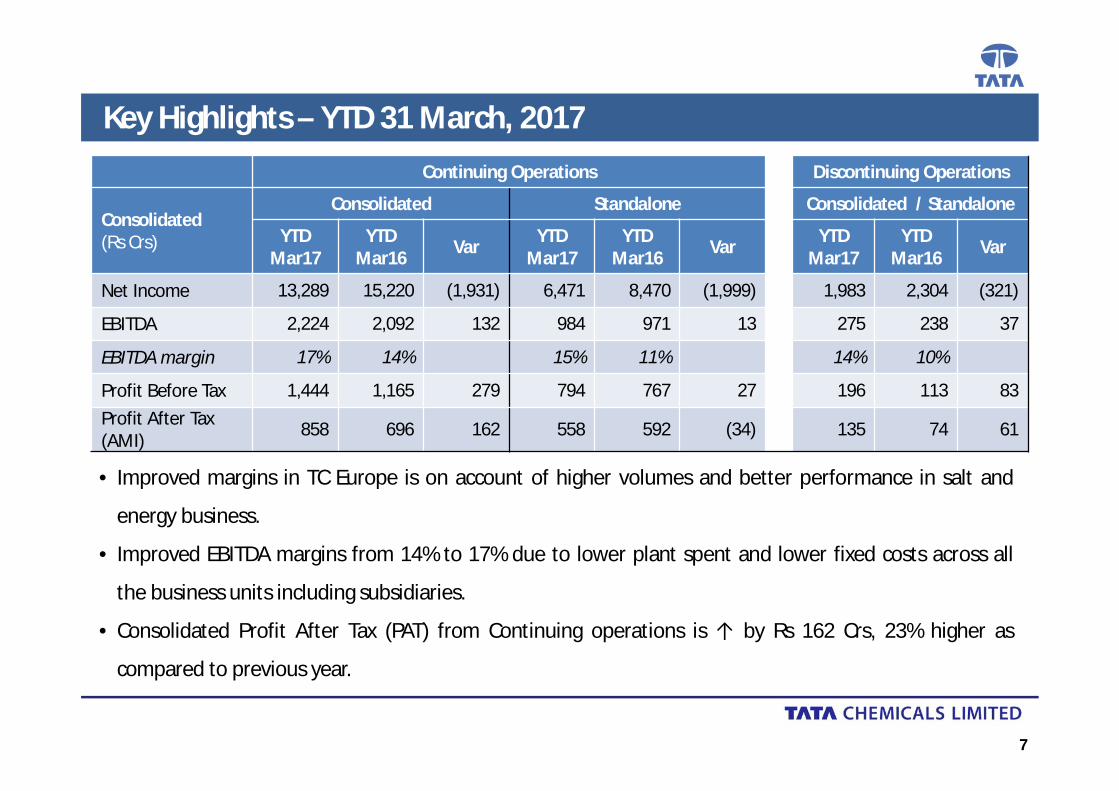
Continuing Operations Discontinuing Operations
Consolidated(Rs Crs)
Consolidated Standalone Consolidated / Standalone
YTDMar17
YTD Mar16 Var YTD
Mar17YTD
Mar16 Var YTDMar17
YTD Mar16 Var
Net Income 13,289 15,220 (1,931) 6,471 8,470 (1,999) 1,983 2,304 (321)
EBITDA 2,224 2,092 132 984 971 13 275 238 37
EBITDA margin 17% 14% 15% 11% 14% 10%
Profit Before Tax 1,444 1,165 279 794 767 27 196 113 83 Profit After Tax (AMI) 858 696 162 558 592 (34) 135 74 61
• Improved margins in TC Europe is on account of higher volumes and better performance in salt and
energy business.
• Improved EBITDA margins from 14% to 17% due to lower plant spent and lower fixed costs across all
the business units including subsidiaries.
• Consolidated Profit After Tax (PAT) from Continuing operations is ↑ by Rs 162 Crs, 23% higher as
compared to previous year.
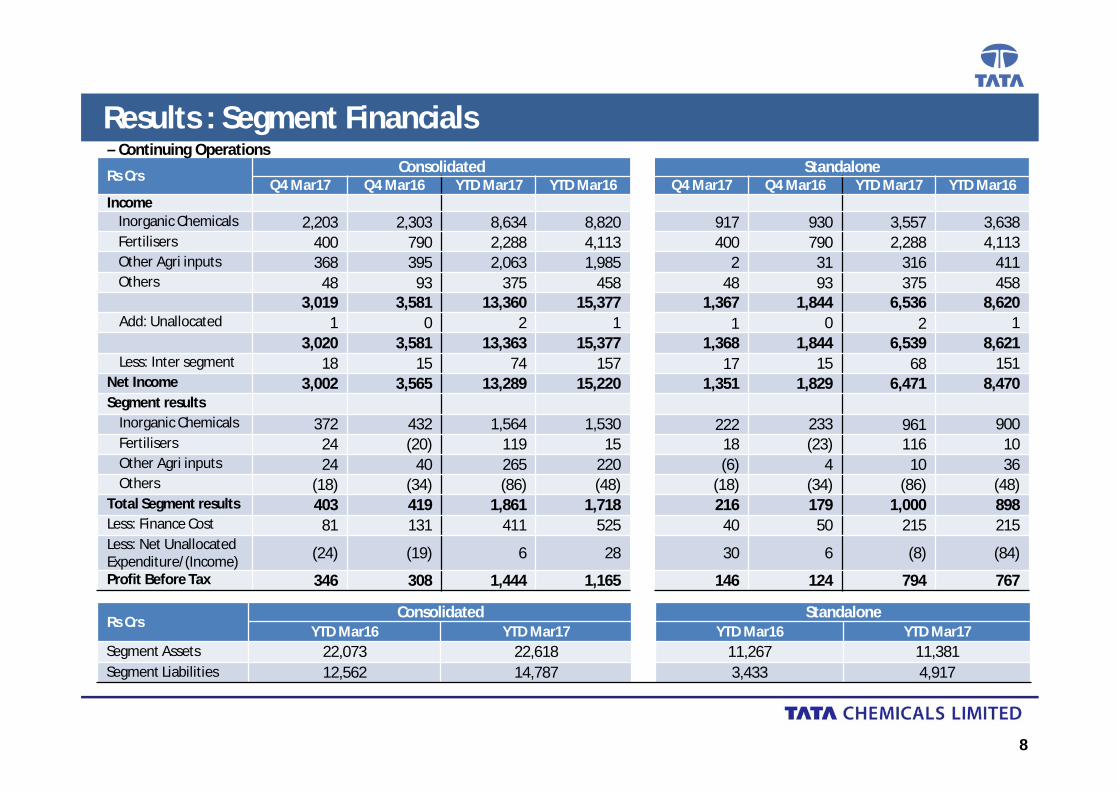
Results : Segment Financials
8
Rs Crs Consolidated StandaloneQ4 Mar17 Q4 Mar16 YTD Mar17 YTD Mar16 Q4 Mar17 Q4 Mar16 YTD Mar17 YTD Mar16
IncomeInorganic Chemicals 2,203 2,303 8,634 8,820 917 930 3,557 3,638 Fertilisers 400 790 2,288 4,113 400 790 2,288 4,113 Other Agri inputs 368 395 2,063 1,985 2 31 316 411 Others 48 93 375 458 48 93 375 458
3,019 3,581 13,360 15,377 1,367 1,844 6,536 8,620 Add: Unallocated 1 0 2 1 1 0 2 1
3,020 3,581 13,363 15,377 1,368 1,844 6,539 8,621 Less: Inter segment 18 15 74 157 17 15 68 151
Net Income 3,002 3,565 13,289 15,220 1,351 1,829 6,471 8,470 Segment results
Inorganic Chemicals 372 432 1,564 1,530 222 233 961 900 Fertilisers 24 (20) 119 15 18 (23) 116 10 Other Agri inputs 24 40 265 220 (6) 4 10 36 Others (18) (34) (86) (48) (18) (34) (86) (48)
Total Segment results 403 419 1,861 1,718 216 179 1,000 898 Less: Finance Cost 81 131 411 525 40 50 215 215 Less: Net UnallocatedExpenditure/(Income) (24) (19) 6 28 30 6 (8) (84)
Profit Before Tax 346 308 1,444 1,165 146 124 794 767
– Continuing Operations
Rs Crs Consolidated Standalone
YTD Mar16 YTD Mar17 YTD Mar16 YTD Mar17Segment Assets 22,073 22,618 11,267 11,381 Segment Liabilities 12,562 14,787 3,433 4,917

Balance Sheet for the period
9
(Rs. Crs) Consolidated Standalone 31-Mar-17 31-Mar-16 31-Mar-17 31-Mar-16
ASSETSNon-current assets 16,241 16,777 8,328 8,373 Current assetsInventories 1,381 1,932 612 1,095 Trade Receivables 2,088 3,566 1,032 2,554 Cash and Bank Balance 1,665 1,265 1,112 600 Others Current Assets 692 812 182 496 Assets classified as held for sale 1,538 3 1,533 0 TOTAL ASSETS 23,605 24,355 12,799 13,118 EQUITY AND LIABILITIESEquity 7,908 6,854 8,855 8,086 Non-controlling interests 2,624 2,598 - -Non-current liabilities 7,470 9,877 1,379 1,807 Current liabilitiesTrade Payables 1,338 1,618 512 686 Others 3,754 3,408 1,542 2,539Liabilities associated with assets classified as held for sale 511 - 511 -TOTAL EQUITIES AND LIABILITIES 23,605 24,355 12,799 13,118
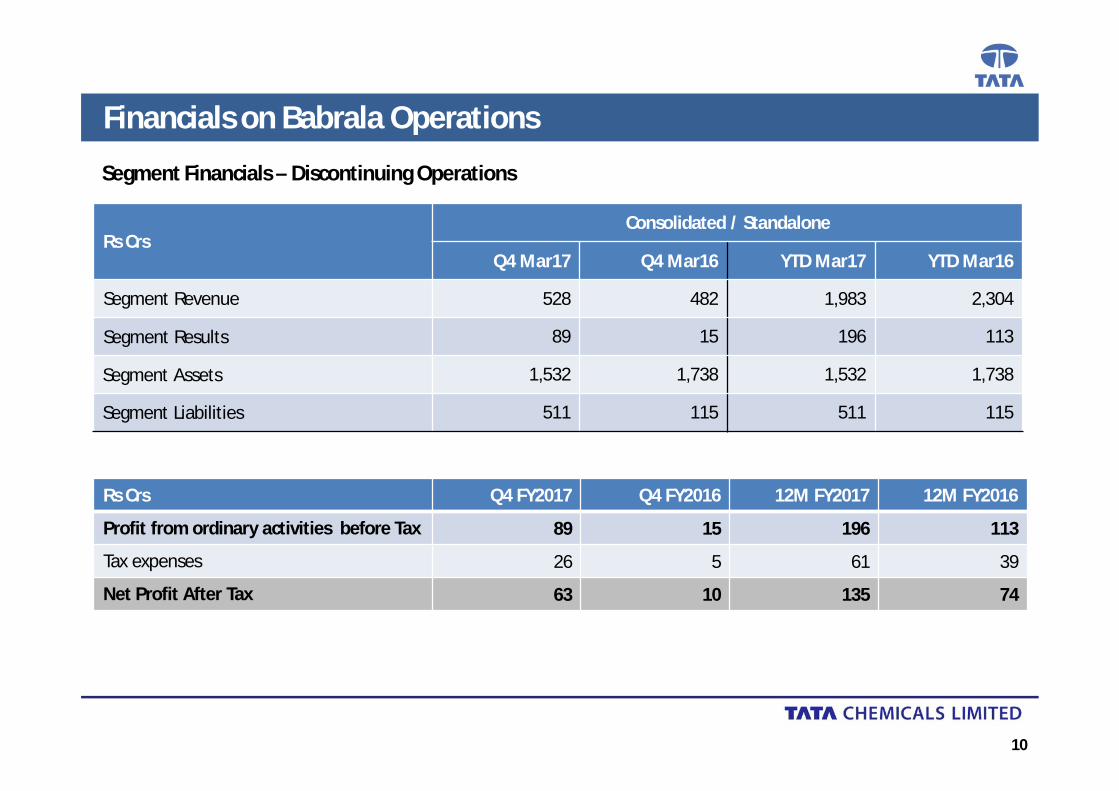
Financials on Babrala Operations
10
Rs Crs Q4 FY2017 Q4 FY2016 12M FY2017 12M FY2016
Profit from ordinary activities before Tax 89 15 196 113
Tax expenses 26 5 61 39
Net Profit After Tax 63 10 135 74
Rs Crs Consolidated / Standalone
Q4 Mar17 Q4 Mar16 YTD Mar17 YTD Mar16
Segment Revenue 528 482 1,983 2,304
Segment Results 89 15 196 113
Segment Assets 1,532 1,738 1,532 1,738
Segment Liabilities 511 115 511 115
Segment Financials – Discontinuing Operations

Update on the Babrala transaction
11
S No Approvals required Current Status
1 Observation /No Objection Letters from NSE / BSE √
2 Approval from Competition Commission of India / Ukraine √
3 Approval of majority Creditors √
4 Approval of majority shareholders of TCL* √
5 Filing of EGM results with NCLT √
6 Sanction of Scheme by NCLT In Progress
* EGM of the equity shareholders of TATA Chemicals Limited was held, pursuant to the directions of the Hon’ble National CompanyLaw Tribunal (“NCLT”), Mumbai bench, on 8th May 2017 in Birla Matushri Sabhagar, Marine lines Mumbai.
Transfer of assets of Urea and Customised Fertilizer business to Yara Fertiliser IndiaPrivate Limited (“Yara”) is expected to be completed during 2nd Quarter of FY2017-18.
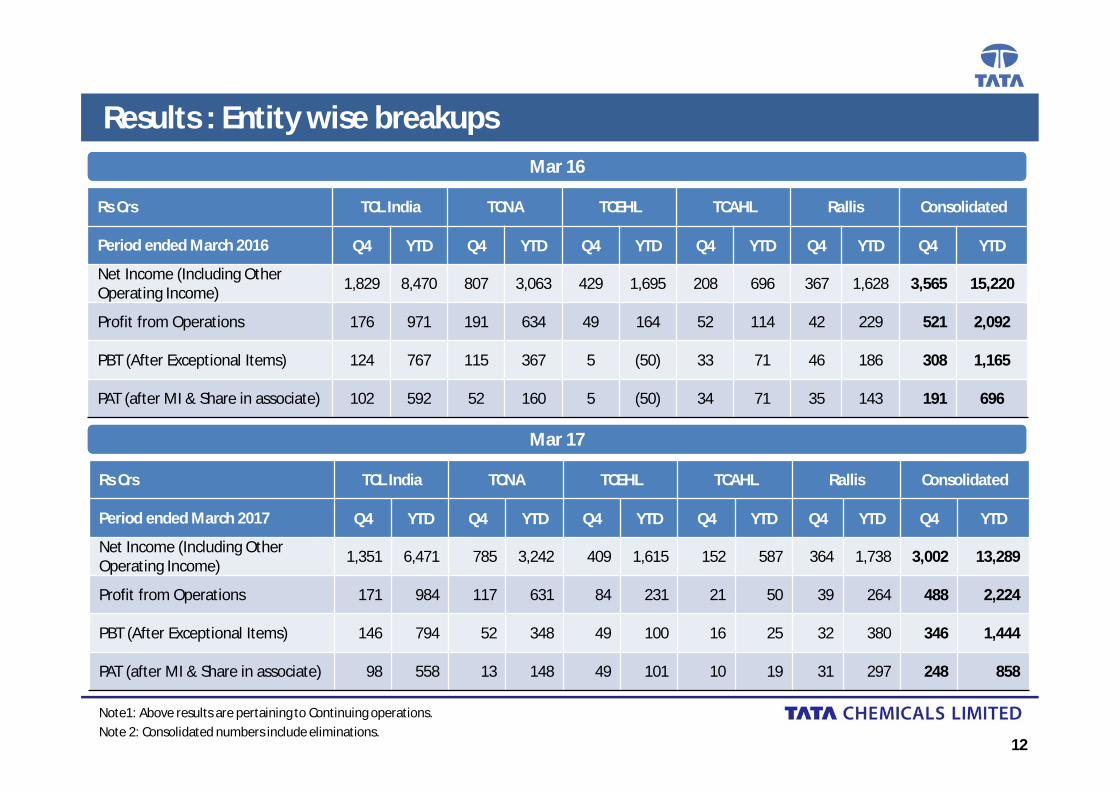
Results : Entity wise breakups
Note1: Above results are pertaining to Continuing operations.Note 2: Consolidated numbers include eliminations.
12
Rs Crs TCL India TCNA TCEHL TCAHL Rallis Consolidated
Period ended March 2016 Q4 YTD Q4 YTD Q4 YTD Q4 YTD Q4 YTD Q4 YTD
Net Income (Including Other Operating Income) 1,829 8,470 807 3,063 429 1,695 208 696 367 1,628 3,565 15,220
Profit from Operations 176 971 191 634 49 164 52 114 42 229 521 2,092
PBT (After Exceptional Items) 124 767 115 367 5 (50) 33 71 46 186 308 1,165
PAT (after MI & Share in associate) 102 592 52 160 5 (50) 34 71 35 143 191 696
Mar 17Mar 17
Mar 16Mar 16
Rs Crs TCL India TCNA TCEHL TCAHL Rallis Consolidated
Period ended March 2017 Q4 YTD Q4 YTD Q4 YTD Q4 YTD Q4 YTD Q4 YTD
Net Income (Including Other Operating Income) 1,351 6,471 785 3,242 409 1,615 152 587 364 1,738 3,002 13,289
Profit from Operations 171 984 117 631 84 231 21 50 39 264 488 2,224
PBT (After Exceptional Items) 146 794 52 348 49 100 16 25 32 380 346 1,444
PAT (after MI & Share in associate) 98 558 13 148 49 101 10 19 31 297 248 858
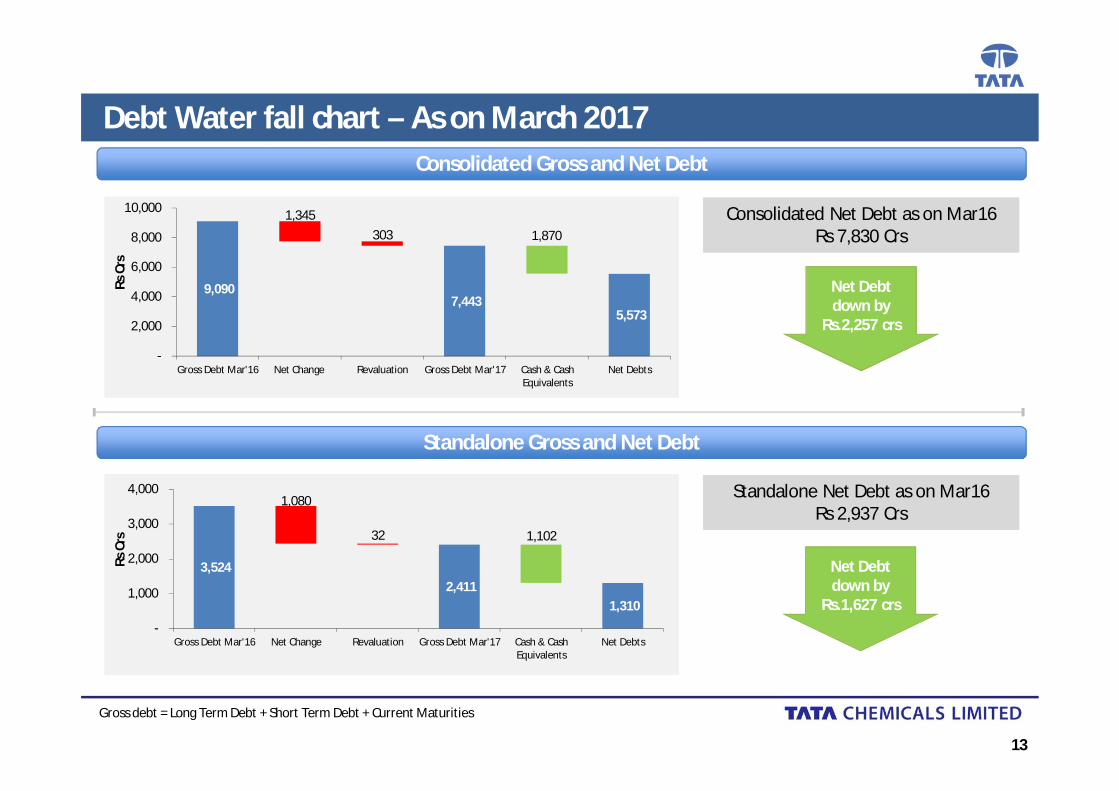
Debt Water fall chart – As on March 2017
Gross debt = Long Term Debt + Short Term Debt + Current Maturities
13
Consolidated Gross and Net Debt
Standalone Gross and Net Debt
9,090 7,443
5,573
1,345303 1,870
-
2,000
4,000
6,000
8,000
10,000
Gross Debt Mar'16 Net Change Revaluation Gross Debt Mar'17 Cash & CashEquivalents
Net Debts
Rs C
rs
3,524 2,411
1,310
1,080
32 1,102
-
1,000
2,000
3,000
4,000
Gross Debt Mar'16 Net Change Revaluation Gross Debt Mar'17 Cash & CashEquivalents
Net Debts
Rs C
rs
Net Debt down by
Rs.2,257 crs
Consolidated Net Debt as on Mar16Rs 7,830 Crs
Consolidated Net Debt as on Mar16Rs 7,830 Crs
Standalone Net Debt as on Mar16Rs 2,937 Crs
Standalone Net Debt as on Mar16Rs 2,937 Crs
Net Debt down by
Rs.1,627 crs
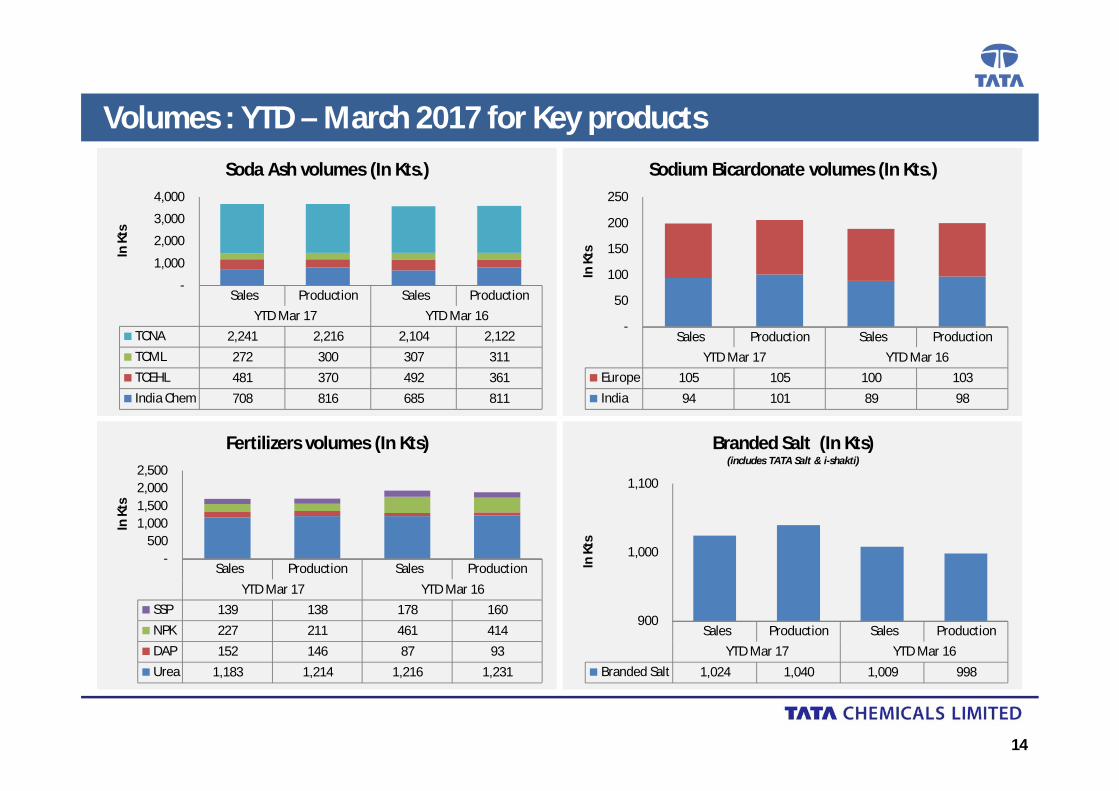
Volumes : YTD – March 2017 for Key products
14
Sales Production Sales ProductionYTD Mar 17 YTD Mar 16
TCNA 2,241 2,216 2,104 2,122TCML 272 300 307 311TCEHL 481 370 492 361India Chem 708 816 685 811
-
1,000
2,000
3,000
4,000
In K
ts
Soda Ash volumes (In Kts.)
Sales Production Sales ProductionYTD Mar 17 YTD Mar 16
Europe 105 105 100 103India 94 101 89 98
-
50
100
150
200
250
In K
ts
Sodium Bicardonate volumes (In Kts.)
Sales Production Sales ProductionYTD Mar 17 YTD Mar 16
SSP 139 138 178 160NPK 227 211 461 414DAP 152 146 87 93Urea 1,183 1,214 1,216 1,231
- 500
1,000 1,500 2,000 2,500
In K
ts
Fertilizers volumes (In Kts)
Sales Production Sales ProductionYTD Mar 17 YTD Mar 16
Branded Salt 1,024 1,040 1,009 998
900
1,000
1,100
In K
ts
Branded Salt (In Kts)(includes TATA Salt & i-shakti)

Volumes : Q4 – March 2017 for Key products
15
Sales Production Sales ProductionQ4 Mar 17 Q4 Mar 16
TCNA 543 509 542 574TCML 76 67 88 69TCEHL 113 96 115 88India Chem 195 211 186 216
- 200 400 600 800
1,000
In K
ts
Soda Ash volumes (In Kts.)
Sales Production Sales ProductionQ4 Mar 17 Q4 Mar 16
Europe 29 29 25 29India 27 26 24 25
-
10
20
30
40
50
60
In K
ts
Sodium Bicardonate volumes (In Kts.)
Sales Production Sales ProductionQ4 Mar 17 Q4 Mar 16
SSP 29 24 39 4NPK 47 36 56 -DAP 60 43 87 93Urea 279 320 278 290
- 100 200 300 400 500
In K
ts
Fertilizers volumes (In Kts)
Sales Production Sales ProductionQ4 Mar 17 Q4 Mar 16
Branded Salt 255 271 251 261
200
250
300
In K
ts
Branded Salt (In Kts)(includes TATA Salt & i-shakti)
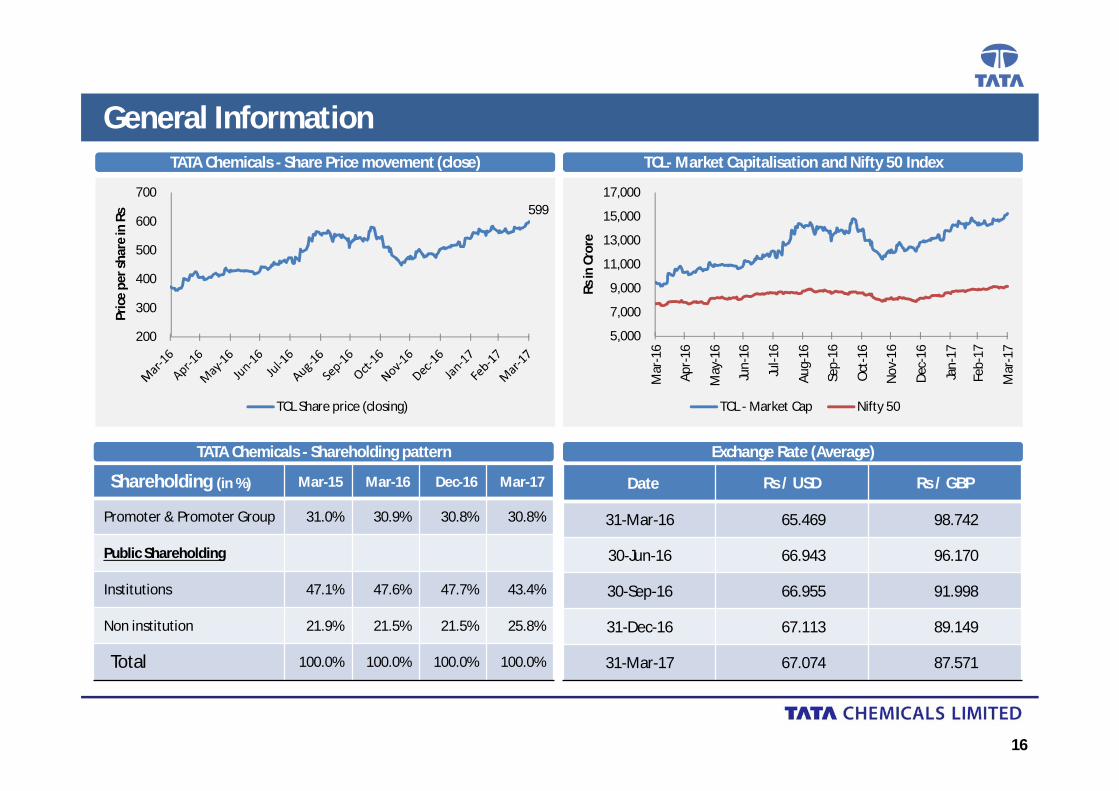
General Information
16
TATA Chemicals - Share Price movement (close)TATA Chemicals - Share Price movement (close) TCL- Market Capitalisation and Nifty 50 Index TCL- Market Capitalisation and Nifty 50 Index
TATA Chemicals - Shareholding pattern TATA Chemicals - Shareholding pattern
Shareholding (in %) Mar-15 Mar-16 Dec-16 Mar-17
Promoter & Promoter Group 31.0% 30.9% 30.8% 30.8%
Public Shareholding
Institutions 47.1% 47.6% 47.7% 43.4%
Non institution 21.9% 21.5% 21.5% 25.8%
Total 100.0% 100.0% 100.0% 100.0%
Exchange Rate (Average) Exchange Rate (Average)
Date Rs / USD Rs / GBP
31-Mar-16 65.469 98.742
30-Jun-16 66.943 96.170
30-Sep-16 66.955 91.998
31-Dec-16 67.113 89.149
31-Mar-17 67.074 87.571
599
200
300
400
500
600
700
Pric
e pe
r sha
re in
Rs
TCL Share price (closing)
5,000
7,000
9,000
11,000
13,000
15,000
17,000
Mar
-16
Apr-
16
May
-16
Jun-
16
Jul-1
6
Aug-
16
Sep-
16
Oct
-16
Nov
-16
Dec-
16
Jan-
17
Feb-
17
Mar
-17
Rs in
Cro
re
TCL - Market Cap Nifty 50
IND-AS transition
17

Significant Accounting policies
18
• The financial results have been prepared in accordance with the recognition and
measurement principles laid down in the Indian Accounting Standards ("Ind AS") as
presented under Section 133 of the Companies Act, 2013 read with the relevant rules
issued thereunder and the other accounting principles generally accepted in India as
applicable.
• Reconciliation between Equity and Statement of Profit and Loss as previously reported
in accordance with the Accounting Standard framework ("Previous IGAAP") are in the
subsequent slides.
• The Financial results for all the periods presented have been prepared in accordance
with the recognition and measurement principles of lnd AS.
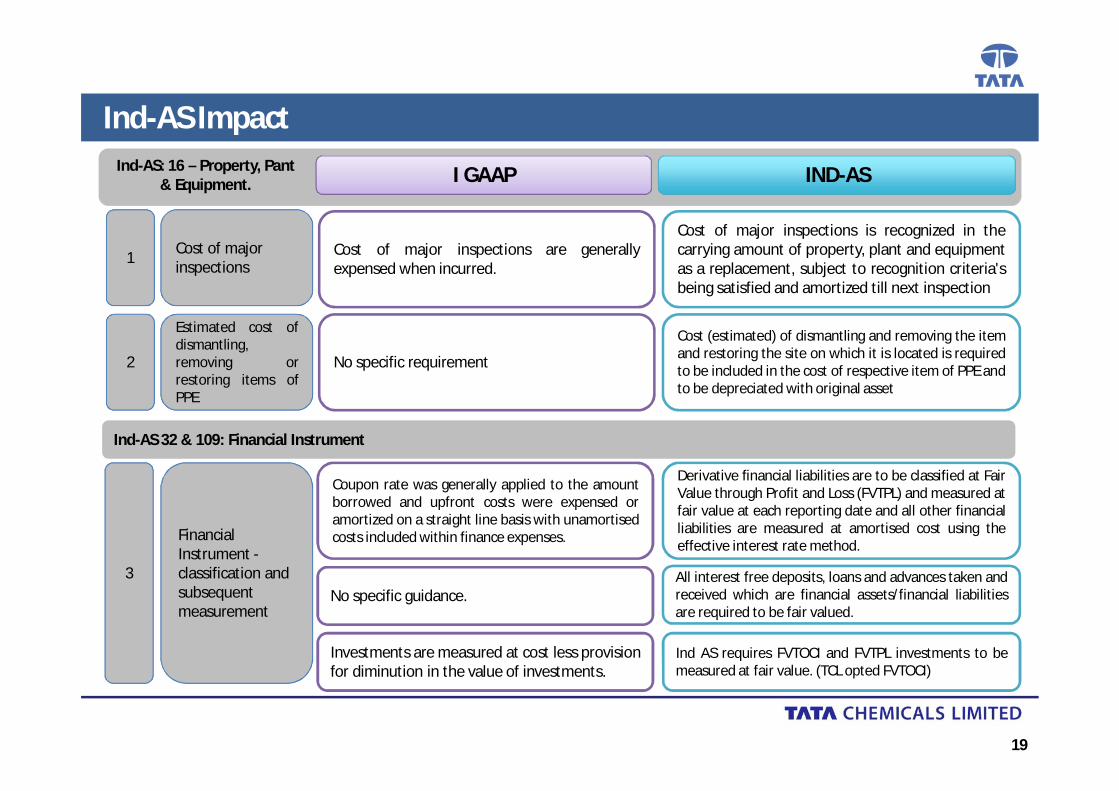
Ind-AS Impact
19
Cost of major inspections
Estimated cost ofdismantling,removing orrestoring items ofPPE
Cost of major inspections are generallyexpensed when incurred.
Cost of major inspections is recognized in thecarrying amount of property, plant and equipmentas a replacement, subject to recognition criteria'sbeing satisfied and amortized till next inspection
I GAAP IND-AS
No specific requirement
Cost (estimated) of dismantling and removing the itemand restoring the site on which it is located is requiredto be included in the cost of respective item of PPE andto be depreciated with original asset
Ind-AS: 16 – Property, Pant & Equipment.
Ind-AS 32 & 109: Financial Instrument
Financial Instrument -classification andsubsequent measurement
Coupon rate was generally applied to the amountborrowed and upfront costs were expensed oramortized on a straight line basis with unamortisedcosts included within finance expenses.
Derivative financial liabilities are to be classified at FairValue through Profit and Loss (FVTPL) and measured atfair value at each reporting date and all other financialliabilities are measured at amortised cost using theeffective interest rate method.
No specific guidance.All interest free deposits, loans and advances taken andreceived which are financial assets/financial liabilitiesare required to be fair valued.
1
2
3
Investments are measured at cost less provisionfor diminution in the value of investments.
Ind AS requires FVTOCI and FVTPL investments to bemeasured at fair value. (TCL opted FVTOCI)
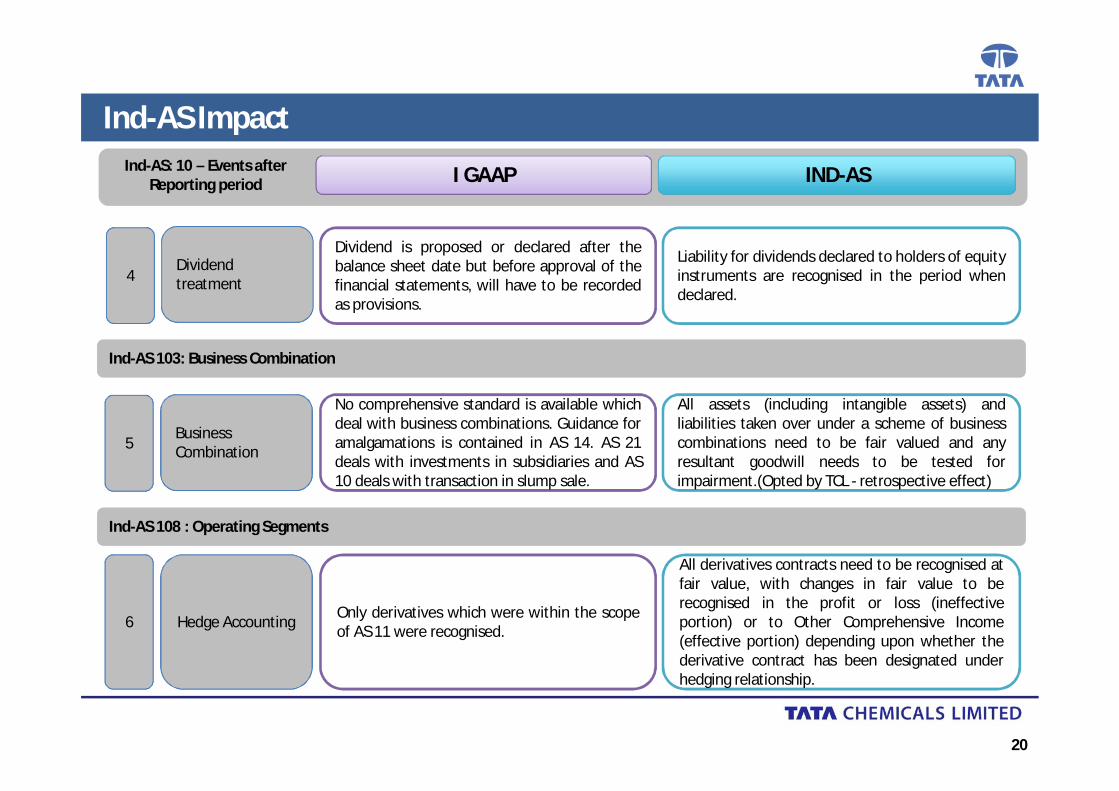
Ind-AS Impact
20
Dividend treatment
Dividend is proposed or declared after thebalance sheet date but before approval of thefinancial statements, will have to be recordedas provisions.
Liability for dividends declared to holders of equityinstruments are recognised in the period whendeclared.
I GAAP IND-ASInd-AS: 10 – Events after Reporting period
Ind-AS 103: Business Combination
No comprehensive standard is available whichdeal with business combinations. Guidance foramalgamations is contained in AS 14. AS 21deals with investments in subsidiaries and AS10 deals with transaction in slump sale.
All assets (including intangible assets) andliabilities taken over under a scheme of businesscombinations need to be fair valued and anyresultant goodwill needs to be tested forimpairment.(Opted by TCL - retrospective effect)
BusinessCombination
Hedge Accounting Only derivatives which were within the scopeof AS 11 were recognised.
All derivatives contracts need to be recognised atfair value, with changes in fair value to berecognised in the profit or loss (ineffectiveportion) or to Other Comprehensive Income(effective portion) depending upon whether thederivative contract has been designated underhedging relationship.
Ind-AS 108 : Operating Segments
4
5
6

Ind-AS Impact
21
Service Service arrangements requiring use of specific assets –Lease accounting
No specific guidance and generally accountedas expenses
Arrangements with embedded lease of assetswould need to be identified and accounted for aslease
I GAAP IND-ASInd-AS 18 : Leases
Ind-AS 18 : Revenues
The Company use to accounts revenue; net oftrade discount, sales taxes and excise duties.Cash discounts were included in ‘Otherexpenses’ under the subheading ‘CashDiscounts’.
• Sales incentive, discounts or rebates in anyform, including cash discounts to customers willbe deducted from the selling price
• Excise duty pertaining to revenue will beseparately shown as part of expenditure.
Revenuerecognition
7
8
Recognition of deferred tax assets for unused tax losses
Deferred tax asset is recognised only to theextent that there is virtual certainty thatsufficient future taxable income will beavailable.
Deferred tax asset is recognised if there isreasonable certainty that future taxable profit willbe available.
9
Ind-AS 12 : Income Taxes

Ind-AS Impact
22
I GAAP IND-ASStructural Impact
ConsolidatedFinancialStatements
Consolidation is based on directly or indirectlythrough subsidiaries, with ownership ofgenerally over 50% stake.
Consolidation is based on control, powers andrights
Joint Arrangement Joint ventures where consolidated based onproportionate share of ownership
Under Ind-AS 111, equity method is used toaccount for joint ventures.
10
11
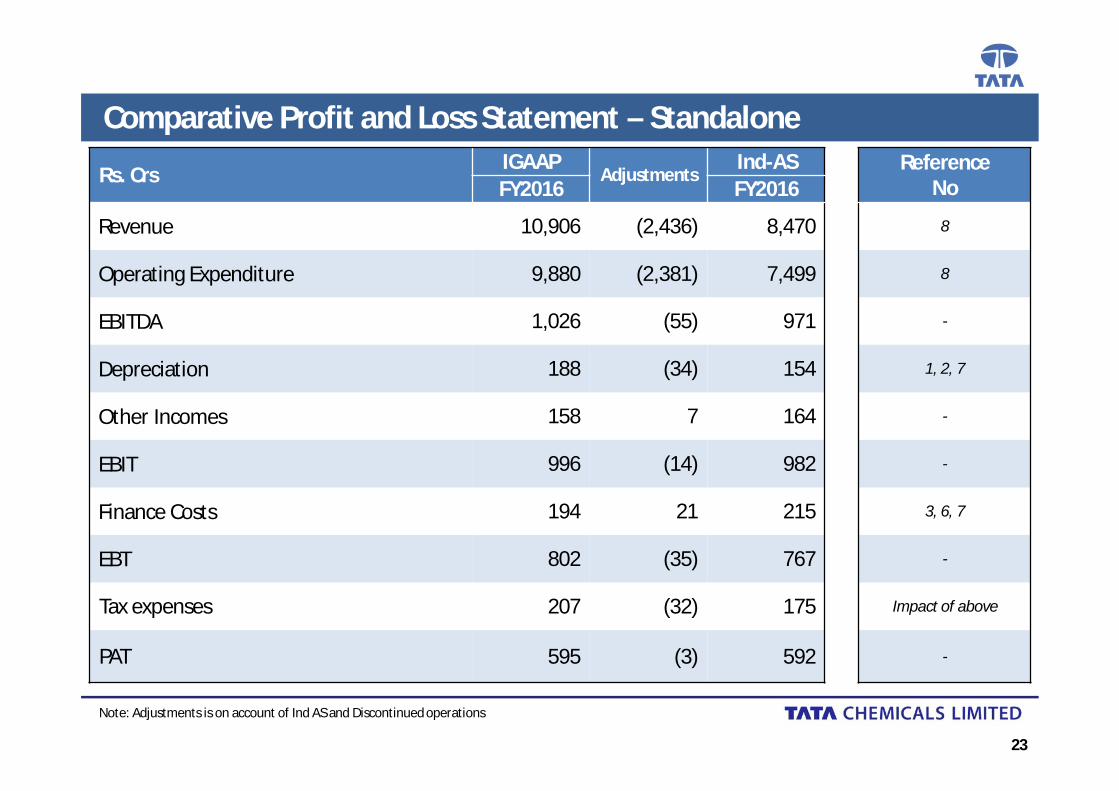
Comparative Profit and Loss Statement – Standalone
23
Note: Adjustments is on account of Ind AS and Discontinued operations
Rs. Crs IGAAPAdjustments
Ind-AS Reference NoFY2016 FY2016
Revenue 10,906 (2,436) 8,470 8
Operating Expenditure 9,880 (2,381) 7,499 8
EBITDA 1,026 (55) 971 -
Depreciation 188 (34) 154 1, 2, 7
Other Incomes 158 7 164 -
EBIT 996 (14) 982 -
Finance Costs 194 21 215 3, 6, 7
EBT 802 (35) 767 -
Tax expenses 207 (32) 175 Impact of above
PAT 595 (3) 592 -
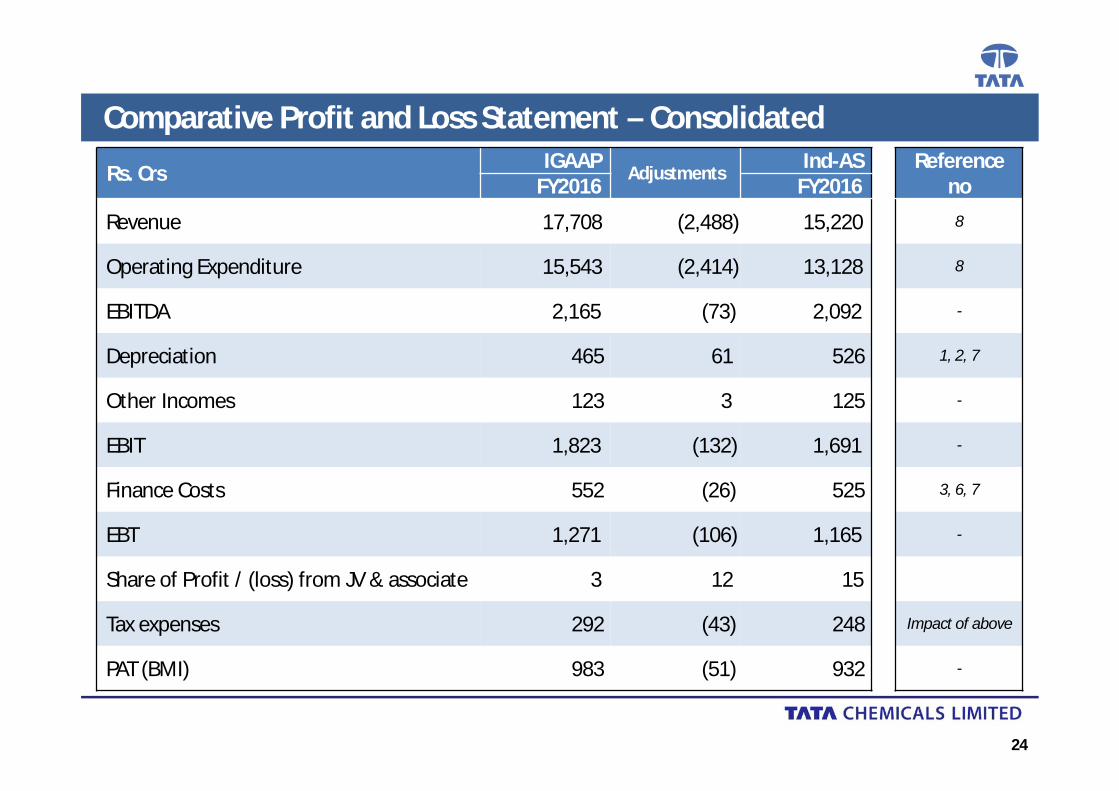
Comparative Profit and Loss Statement – Consolidated
24
Rs. Crs IGAAP Adjustments Ind-AS Reference noFY2016 FY2016
Revenue 17,708 (2,488) 15,220 8
Operating Expenditure 15,543 (2,414) 13,128 8
EBITDA 2,165 (73) 2,092 -
Depreciation 465 61 526 1, 2, 7
Other Incomes 123 3 125 -
EBIT 1,823 (132) 1,691 -
Finance Costs 552 (26) 525 3, 6, 7
EBT 1,271 (106) 1,165 -
Share of Profit / (loss) from JV & associate 3 12 15
Tax expenses 292 (43) 248 Impact of above
PAT (BMI) 983 (51) 932 -
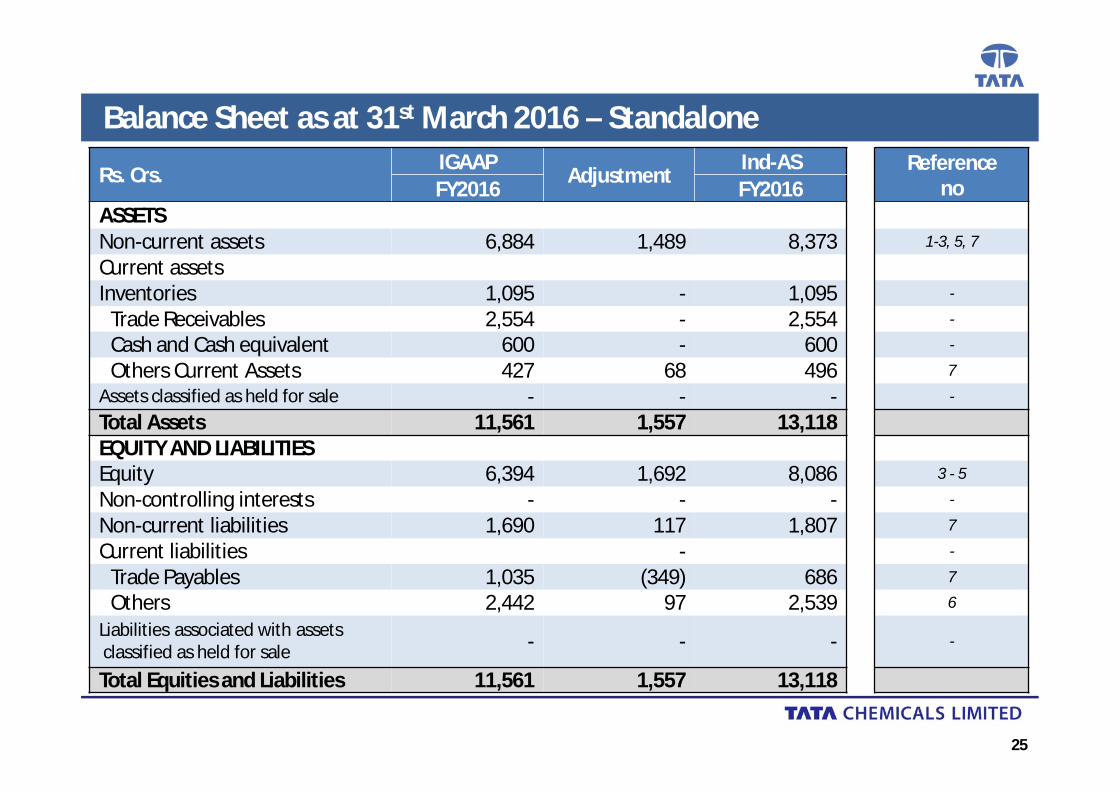
Balance Sheet as at 31st March 2016 – Standalone
25
Rs. Crs. IGAAP Adjustment Ind-AS Reference noFY2016 FY2016
ASSETSNon-current assets 6,884 1,489 8,373 1-3, 5, 7
Current assetsInventories 1,095 - 1,095 -
Trade Receivables 2,554 - 2,554 -
Cash and Cash equivalent 600 - 600 -
Others Current Assets 427 68 496 7
Assets classified as held for sale - - - -
Total Assets 11,561 1,557 13,118 EQUITY AND LIABILITIESEquity 6,394 1,692 8,086 3 - 5
Non-controlling interests - - - -
Non-current liabilities 1,690 117 1,807 7
Current liabilities - -
Trade Payables 1,035 (349) 686 7
Others 2,442 97 2,539 6
Liabilities associated with assetsclassified as held for sale - - - -
Total Equities and Liabilities 11,561 1,557 13,118

Balance Sheet as at 31st March 2016 – Consolidated
26
Rs. Crs. IGAAP Adjustments Ind-AS Reference noFY2016 FY2016
ASSETSNon-current assets 13,424 3,353 16,777 1 - 3, 5, 7Current assets
Inventories 2,002 (70) 1,93210, 11Trade Receivables 3,521 45 3,566
Cash and Cash equivalent 1,371 (106) 1,265Others Current Assets 777 35 812 7, 10, 11
Assets classified as held for sale - 3 3 10, 11Total Assets 21,095 3,260 24,355EQUITY AND LIABILITIESEquity 6,288 566 6,854
5, 10, 11Non-controlling interests 747 1,851 2,598Non-current liabilities 8,802 1,075 9,877 6, 10, 11Current liabilities -
Trade Payables 2,028 (410) 1,61810
Others 3,230 178 3,408Liabilities associated with assets classified as held for sale - - - -
Total Equities and Liabilities 21,095 3,260 24,355

BusinessChemicals Portfolio• Tata Chemicals is the world’s 2nd largest producer of soda ash with
manufacturing facilities in North America, Europe, Asia & Africa.• Key Supplier to all major manufacturers of glass, detergents and
other industrial products.• World’s 3rd largest producer of sodium bicarbonate, with
application range from food to pharmaceuticals to air pollutioncontrol.
Consumer Portfolio• Tata Chemicals is the pioneer & market leader in India’s branded
Iodised salt segment. TATA Salt was rated as one of the top 10brands in Business and Consumer brands category in India bySuper brands.
• Tata Salt reaches more than 130 mn households, with a marketshare of 68.5% in the national branded salt category segment.
• Tata Sampann range of dals, pulses and spices bring natural,unpolished protein-based nutrition to Indian households.
Fertilizer Portfolio• Tata Chemicals offers a complete suite of solutions for the Indian
farmer & touches over 85 percent of India’s arable land,supporting 1.3 million farmers & serving over 20,000+ villages.
27
28


![Comparing First, Second and Third Generation …...[2006], Gorton and Rouwenhorst [2006], Miffre and Rallis [2007], Fuertes, Miffre and Rallis [2010] amongst others). An easy way to](https://img.pdfslide.net/doc/110x75/5e974b9ffaa92454ae3b4dab/comparing-first-second-and-third-generation-2006-gorton-and-rouwenhorst.jpg)