Embed Size (px)
Citation preview

ALIMENTATION COUCHE-TARD INC. ALIMENTATION COUCHE-TARD INC.
Investors Presentation
November 2015

FORWARD-LOOKING INFORMATION AND
CAUTIONARY LANGUAGE
2
This presentation and the accompanying oral presentation contain forward-looking statements within the meaning of applicable securities legislation. Forward-looking statements are typically identified by words such as “projected”, “estimate”, “may”, “anticipate”, “believe”, “expect”, “plan”, “intend” or similar words suggesting future outcomes or statements regarding an outlook. All statements other than statements of historical fact contained in these slides are forward-looking statements.
Forward-looking statements involve numerous assumptions, risks and uncertainties. A variety of factors, many of which are beyond Alimentation Couche-Tard Inc.’s (“Couche-Tard”) control, may cause actual results to differ materially from the expectations expressed in its forward-looking statements. These factors include, but are not limited to, the effects of the integration of acquired businesses and the ability to achieve projected synergies, fluctuations in margins on motor fuel sales, competition in the convenience store and retail motor fuel industries, foreign exchange rate fluctuations, and such other risks as described in detail from time to time in documents filed by Couche-Tard with securities regulatory authorities in Canada, including those risks described in Couche-Tard’s management’s discussion and analysis (MD&A) for the year ended April 26, 2015. Couche-Tard’s MD&A and other publicly filed documents are available on SEDAR at www.sedar.com.
Unless otherwise required by law, Couche-Tard does not undertake to update any forward-looking statement, whether written or oral, that may be made from time to time by it or on its behalf. No financial information presented in this presentation as of a date more recent than April 26, 2015 has been audited.
While the information contained in this presentation is believed to be accurate, Couche-Tard expressly disclaims any and all liability for any losses, claims or damages of whatsoever kind based upon the information contained in, or omissions from, this presentation or any oral communication transmitted in connection therewith. In addition, none of the statements contained in this presentation are intended to be, nor shall be deemed to be, representations or warranties of Couche-Tard and its affiliates. Where the information is from third-party sources, the information is from sources believed to be reliable, but Couche-Tard has not independently verified any of such information contained herein.
This presentation is not, and under no circumstances is to be construed as, a prospectus, an offering memorandum, an advertisement or a public offering of securities. Under no circumstances should the information contained herein be considered an offer to sell or a solicitation of an offer to buy any securities.
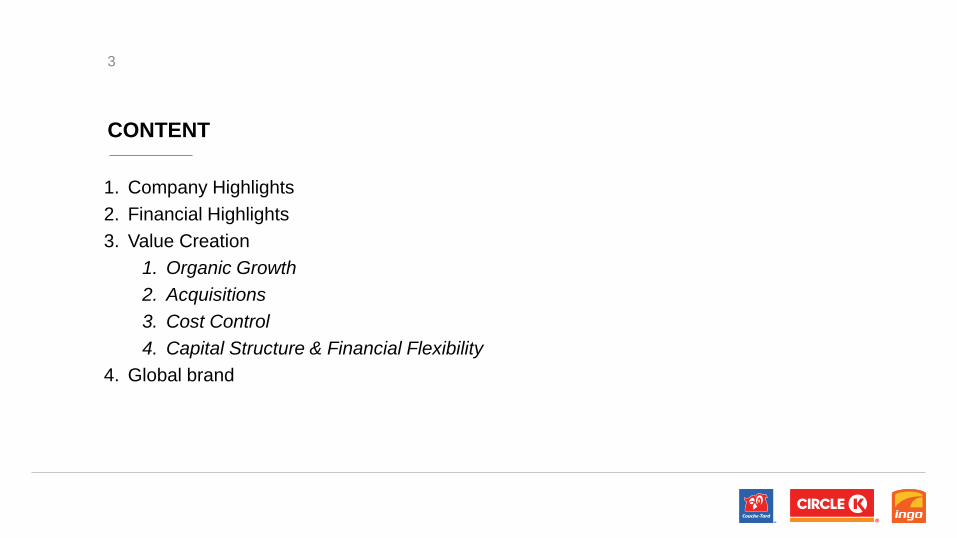
CONTENT
3
1. Company Highlights
2. Financial Highlights
3. Value Creation
1. Organic Growth
2. Acquisitions
3. Cost Control
4. Capital Structure & Financial Flexibility
4. Global brand

ALIMENTATION COUCHE-TARD INC.
COMPANY
HIGHLIGHTS
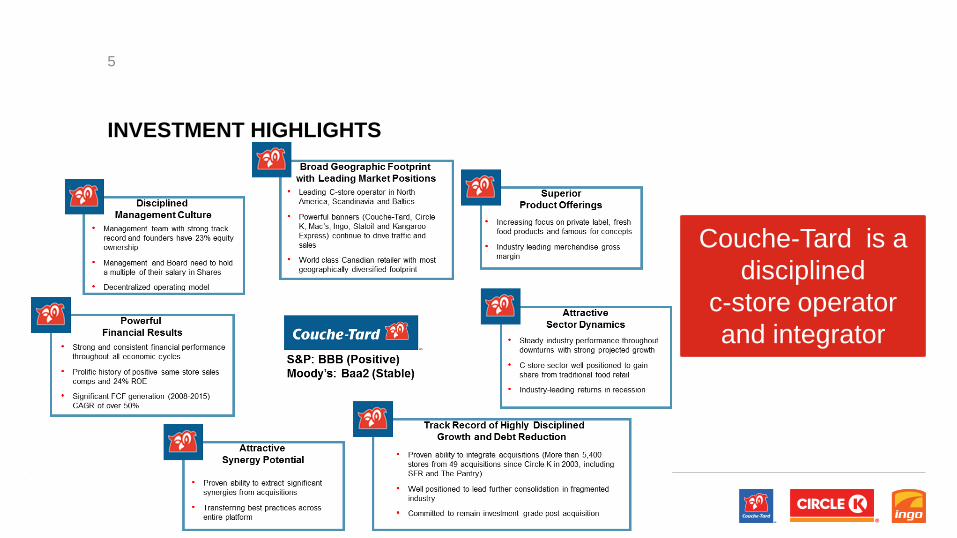
INVESTMENT HIGHLIGHTS
5
Couche-Tard is a
disciplined
c-store operator
and integrator
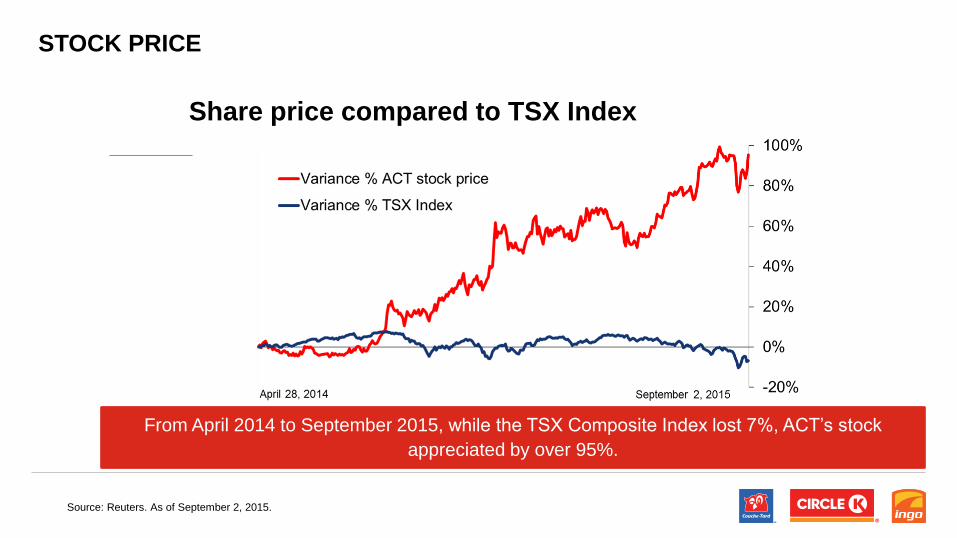
STOCK PRICE
Share price compared to TSX Index
Source: Reuters. As of September 2, 2015.
From April 2014 to September 2015, while the TSX Composite Index lost 7%, ACT’s stock
appreciated by over 95%.

STOCK PRICE
Share price compared to public competitors
Source: Reuters. As of September 2, 2015.
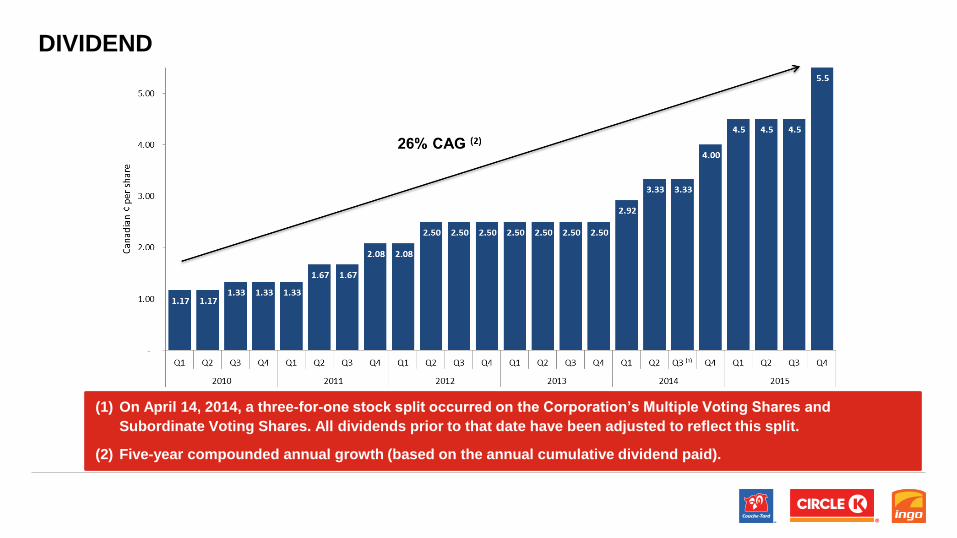
DIVIDEND
(1) On April 14, 2014, a three-for-one stock split occurred on the Corporation’s Multiple Voting Shares and
Subordinate Voting Shares. All dividends prior to that date have been adjusted to reflect this split.
(2) Five-year compounded annual growth (based on the annual cumulative dividend paid).

DIVIDEND VS FREE CASH FLOW
9
Consistent growth
more than doubling
within 5 years.
Q1 2016 dividend of
CA5.5¢, an increase
of 22% compared to
Q1 2015 dividend of
CA4.5¢

NORTH AMERICAN NETWORK
10
Total network
of 7,987 stores
in North
America
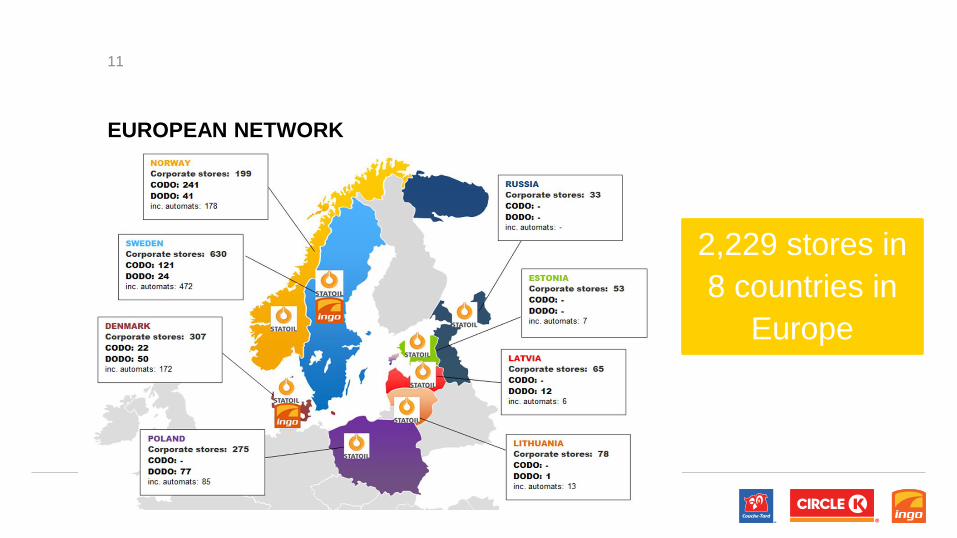
EUROPEAN NETWORK
11
2,229 stores in
8 countries in
Europe

INTERNATIONAL PRESENCE
12
4,697 licensed
Circle K stores in
Asia, Mexico,
Honduras and
U.A.E

COUCHE-TARD – WORLD LEADER
13
(1) The Pantry has been acquired on March 16, 2015.The results of The Pantry have been included in Couche-Tard’s financial results since that date. Therefore, North American financial results include the Pantry from March
16, 2015 to July 19, 2015.
(2) LTM financial results as of July 19, 2015.
(3) Pro forma figures have been adjusted to exclude the results of the Pantry included in the LTM figures
(4) Adjusted for non-recurring restructuring provision, loss on disposal of the aviation fuel business, curtailment gain and negative goodwill.
(5) Includes Couche-Tard’s Company-Owned/Dealer-Operated and Dealer-Owned/Dealer-Operated sites.
Couche-Tard is a
leading global
cstore operator
with EBITDA of
$2.1 billion

ALIMENTATION COUCHE-TARD INC.
FINANCIAL
HIGHLIGHTS

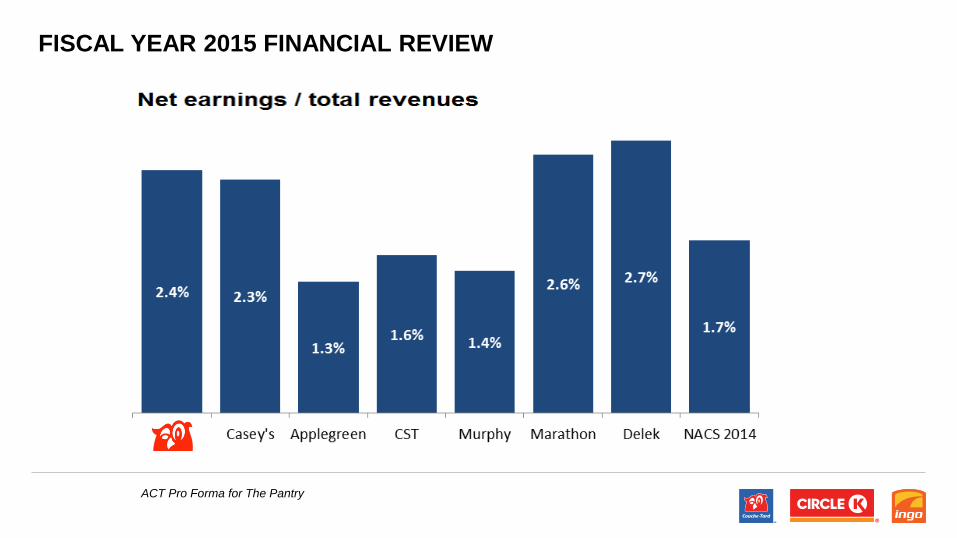
FISCAL YEAR 2015 FINANCIAL REVIEW
CAG: Five-year compounded annual growth.
(1) Excluding The Pantry stores

FISCAL YEAR 2015 FINANCIAL REVIEW
CAG: Five-year compounded annual growth.
(1) Excluding The Pantry stores.

LTM financial results as at April 26, 2015, (including The Pantry LTM).
FISCAL 2015 GROSS PROFIT BREAKDOWN
• Well diversified
• Merchandise and services still represent 55% of gross profits and should
increase with The Pantry
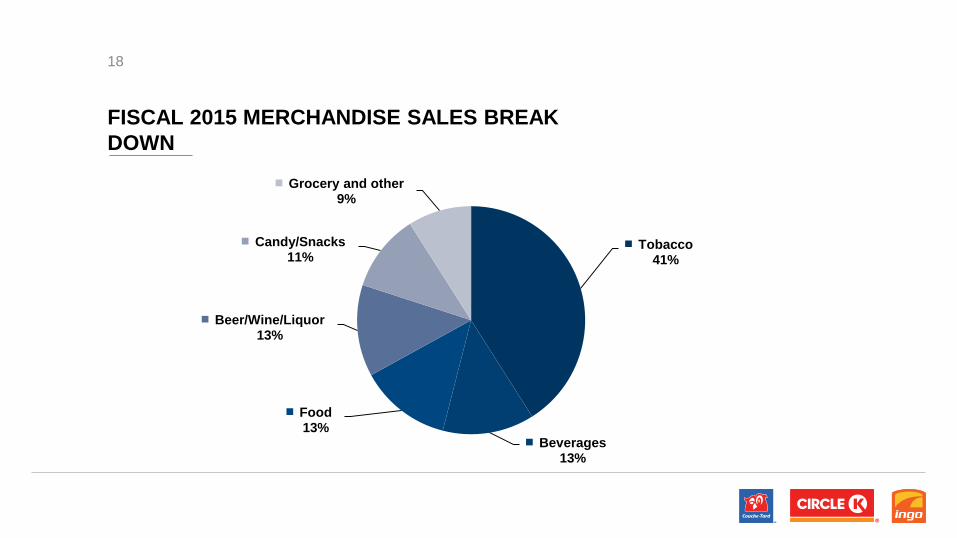
FISCAL 2015 MERCHANDISE SALES BREAK
DOWN
Tobacco 41%
Beverages 13%
Food 13%
Beer/Wine/Liquor 13%
Candy/Snacks 11%
Grocery and other 9%
18
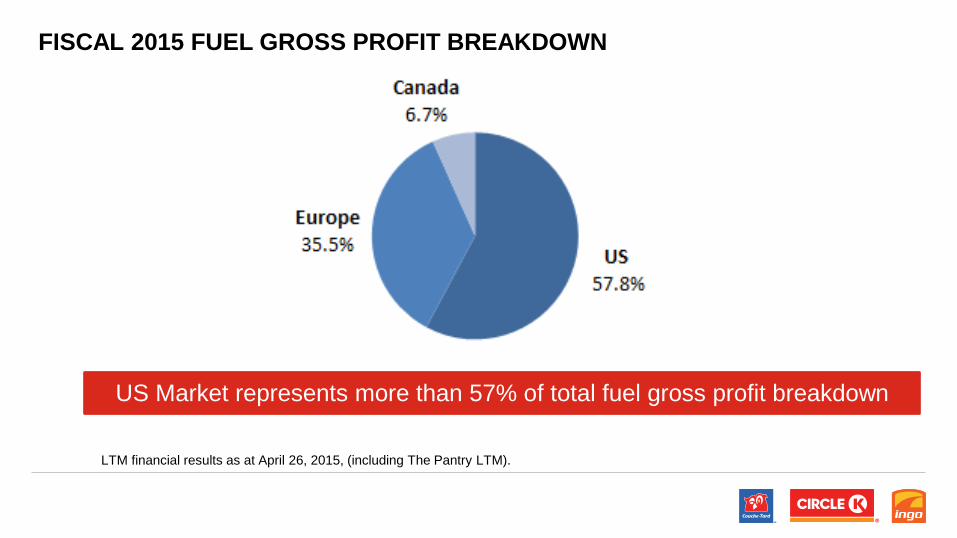
LTM financial results as at April 26, 2015, (including The Pantry LTM).
FISCAL 2015 FUEL GROSS PROFIT BREAKDOWN
US Market represents more than 57% of total fuel gross profit breakdown
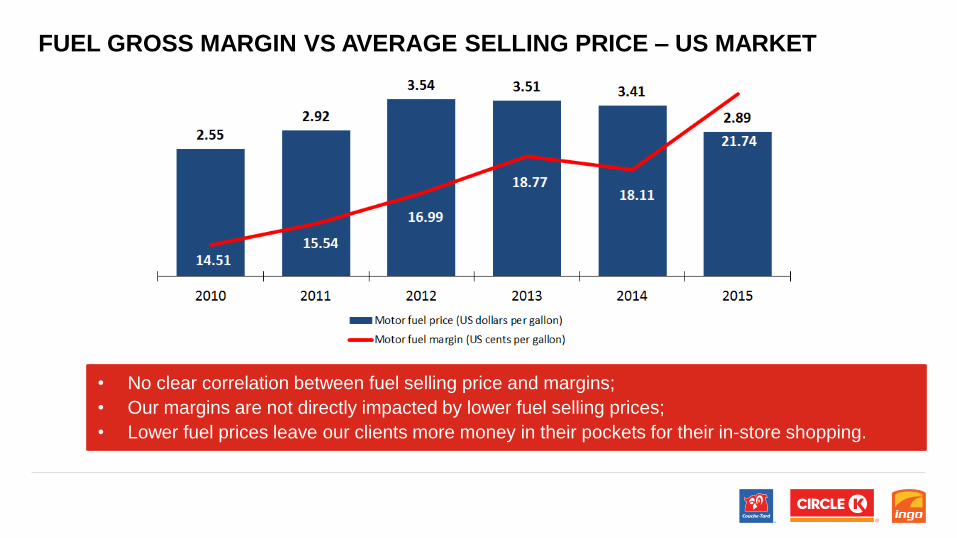
FUEL GROSS MARGIN VS AVERAGE SELLING PRICE – US MARKET
• No clear correlation between fuel selling price and margins;
• Our margins are not directly impacted by lower fuel selling prices;
• Lower fuel prices leave our clients more money in their pockets for their in-store shopping.
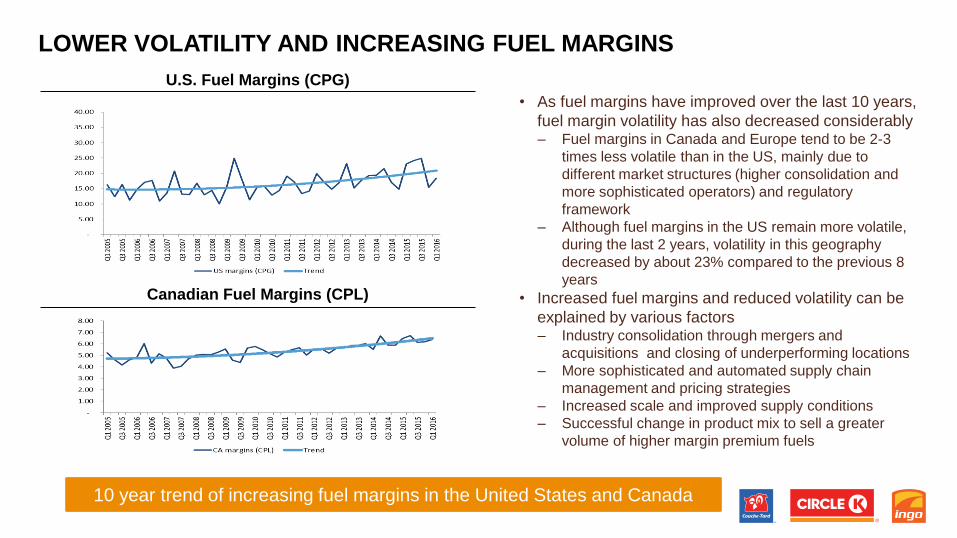
LOWER VOLATILITY AND INCREASING FUEL MARGINS
U.S. Fuel Margins (CPG)
Canadian Fuel Margins (CPL)
• As fuel margins have improved over the last 10 years,
fuel margin volatility has also decreased considerably ‒ Fuel margins in Canada and Europe tend to be 2-3
times less volatile than in the US, mainly due to
different market structures (higher consolidation and
more sophisticated operators) and regulatory
framework
‒ Although fuel margins in the US remain more volatile,
during the last 2 years, volatility in this geography
decreased by about 23% compared to the previous 8
years
• Increased fuel margins and reduced volatility can be
explained by various factors ‒ Industry consolidation through mergers and
acquisitions and closing of underperforming locations
‒ More sophisticated and automated supply chain
management and pricing strategies
‒ Increased scale and improved supply conditions
‒ Successful change in product mix to sell a greater
volume of higher margin premium fuels
10 year trend of increasing fuel margins in the United States and Canada
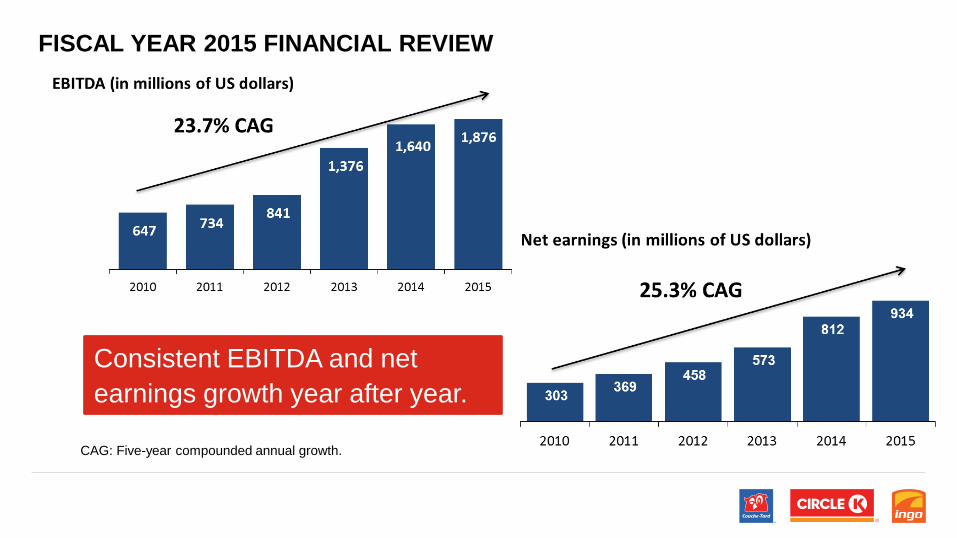
FISCAL YEAR 2015 FINANCIAL REVIEW
CAG: Five-year compounded annual growth.
Consistent EBITDA and net
earnings growth year after year.
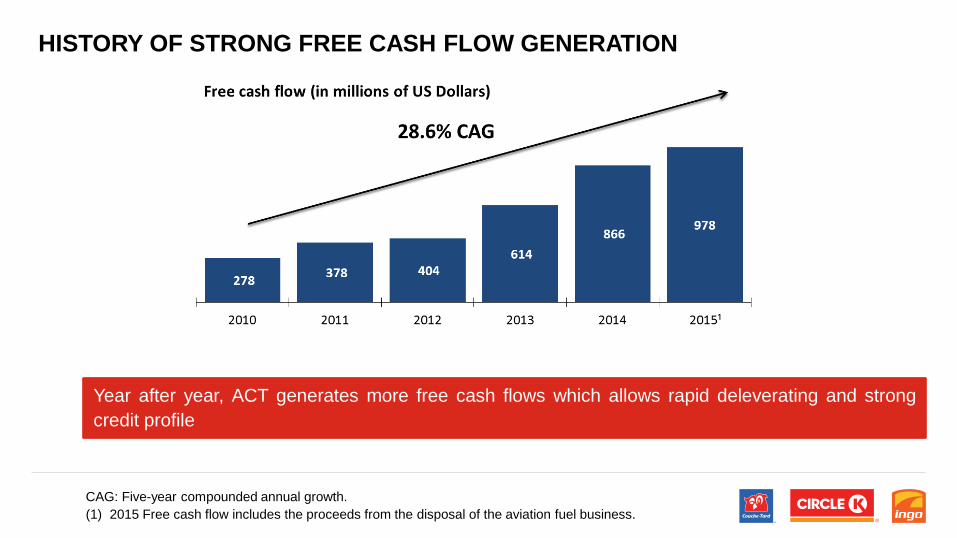
HISTORY OF STRONG FREE CASH FLOW GENERATION
Year after year, ACT generates more free cash flows which allows rapid deleverating and strong
credit profile
CAG: Five-year compounded annual growth.
(1) 2015 Free cash flow includes the proceeds from the disposal of the aviation fuel business.
FISCAL YEAR 2015 FINANCIAL REVIEW
ACT Pro Forma for The Pantry
ALIMENTATION COUCHE-TARD INC.
VALUE CREATION

Organic Growth
• Focus on customers’ needs and respond to market trends
• Focus on key categories – Food, coffee, cold beverages, fuel and car wash
• Innovation and technology
• Execution
• Continuous improvement
• Private label
• Branding
• Construction, relocation or reconstruction of stores
Acquisitions
• Smart, disciplined acquisition strategy – Spotting the right opportunities and striking the right deals at the right price
• Swift and efficient integration
• Realization of available synergies
Cost Control
• Disciplined culture
• Continuous benchmarking
• Exchange of best practices throughout the organization
• Economies of scale – Relationship with local, national and global suppliers
Capital Structure & Financial Flexibility
• Cost of debt at competitive conditions
• Maturity spread
• Access to liquidities – Cash and credit facilities
• Dividend growth
• Disposal of non-core assets
FOUR PILLARS OF VALUE CREATION
ALIMENTATION COUCHE-TARD INC.
ORGANIC GROWTH
Value Creation
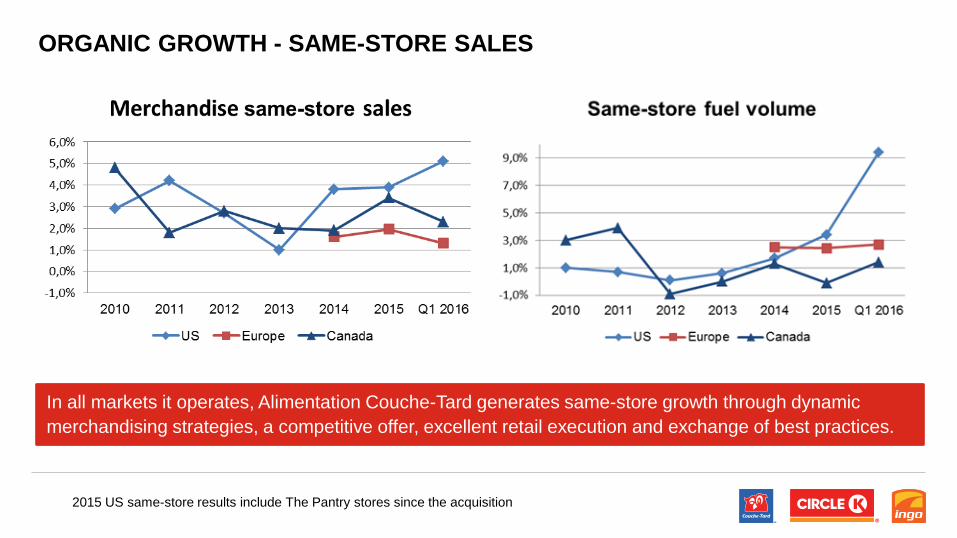
ORGANIC GROWTH - SAME-STORE SALES
In all markets it operates, Alimentation Couche-Tard generates same-store growth through dynamic
merchandising strategies, a competitive offer, excellent retail execution and exchange of best practices.
2015 US same-store results include The Pantry stores since the acquisition
ALIMENTATION COUCHE-TARD INC.
ACQUISITIONS
Value Creation

ACQUISITIONS - HISTORY OF HIGHLY DISCIPLINED M&A APPROACH
(1) Represents Total Debt/EBITDA at fiscal year end and LTM for Q1 2016.
(2) Pro forma the acquisition of SFR.
(3) Adjusted for non-recurring restructuration provision, curtailment gain, loss on aviation fuel business disposal and negative goodwill.
(4) Pro Forma the acquisition of The Pantry.

RECENT ACQUISITIONS

THE PANTRY SNAPSHOT
• Couche-Tard acquired 100% of The Pantry shares on March 16, 2015
• Broad network comprised of more than 1,500 stations covering 13 states in the
US Southeastern
• Total acquisition price of USD$1.7 billion including debt assumed
• Fully-funded transaction with our revolving credit facility and cash on-hand
• Pro Forma Adjusted Leverage Ratio of 2.17x
• Immediately and significantly accretive to earnings with strong free cash flow
generation
• Cost reduction objective of a minimum of USD$85M over the 24-month period
following the acquisition
• Significant in-store sales and fuel volumes growth opportunities through
implementation of our programs, better execution and network improvements
• Significant product supply cost reduction opportunities for both in-store and fuel
purchases

THE PANTRY SNAPSHOT
• Merchandise and service revenues of approx. $1.8 billion
• Fuel volume of approx. 1.7 billion gallons
• EBITDA of approx. $250 million
ALIMENTATION COUCHE-TARD INC.
COST CONTROL
Value Creation

DISCIPLINED AND RIGOROUS COST CONTROL
• For fiscal 2015, operating, selling, administrative and general expenses increased by only 0.8% compared with
fiscal 2014
• Synergies from major acquisitions:
• In connection with The Pantry acquisition, in addition to cost reductions above, we expect:
• Significant savings from improved supply terms for both in-store and fuel purchases
• Strong growth in in-store sales and fuel volume through the improvement of our operations; sharing our
business awareness and each company’s best practices; and better supply conditions
SFRObjective $150-$200M
Realized $172M
The PantryObjective $102M
Identified $67M
Realized $12M

ALIMENTATION COUCHE-TARD INC.
CAPITAL STRUCTURE &
FINANCIAL FLEXIBILITY
Value Creation
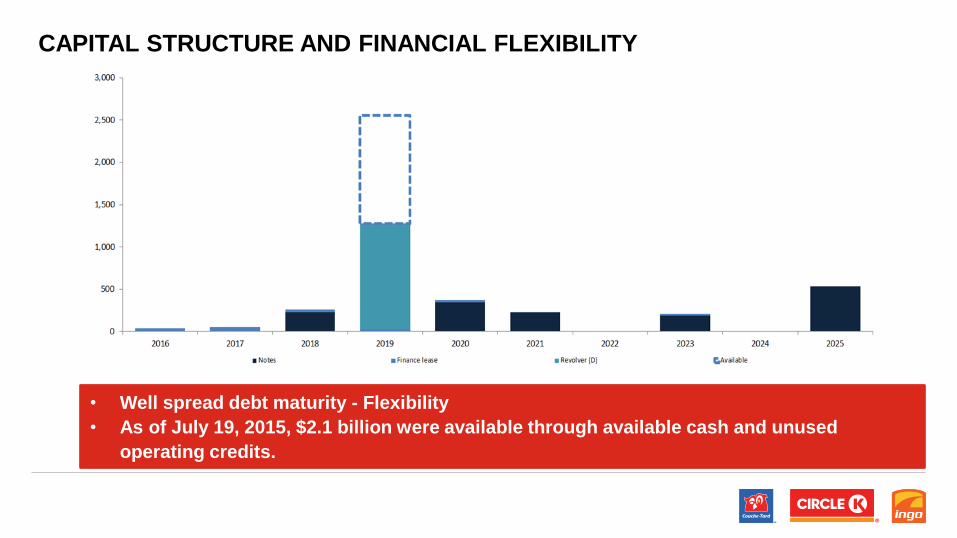
CAPITAL STRUCTURE AND FINANCIAL FLEXIBILITY
• Well spread debt maturity - Flexibility
• As of July 19, 2015, $2.1 billion were available through available cash and unused
operating credits.

AVERAGE INTEREST RATE ON DEBT
Based on latest Q4 information except for ACT which is as per July 19, 2015, to reflect the incidence of
the recently issued Canadian notes
Competitive and attractive cost of debt

LEVERAGE HISTORY
Actual Adjusted net interest-bearing debt / adjusted EBITDAR 2.20x
Objective: rapid deleveraging
(1) Pro Forma The Pantry
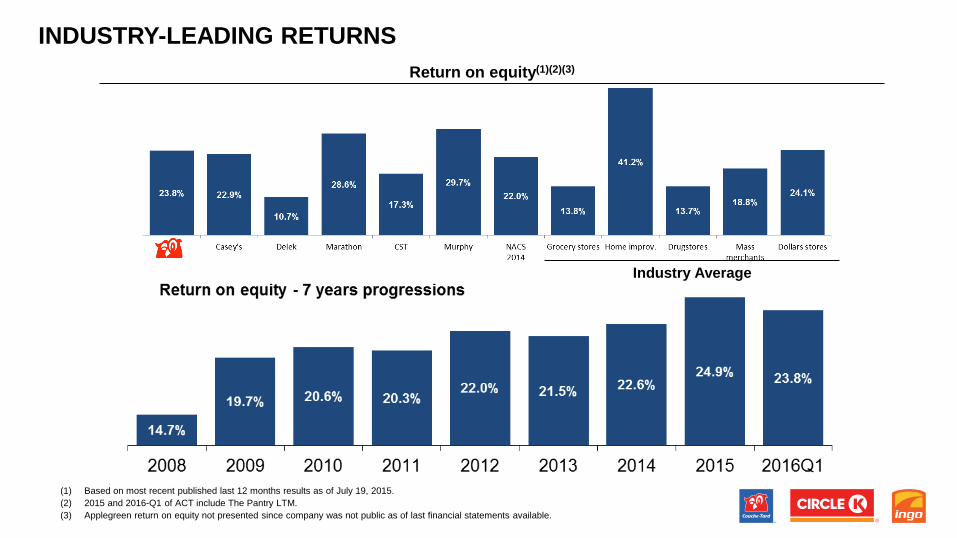
(1) Based on most recent published last 12 months results as of July 19, 2015.
(2) 2015 and 2016-Q1 of ACT include The Pantry LTM.
(3) Applegreen return on equity not presented since company was not public as of last financial statements available.
INDUSTRY-LEADING RETURNS
Return on equity(1)(2)(3)
Industry Average
ALIMENTATION COUCHE-TARD INC.
GLOBAL BRAND
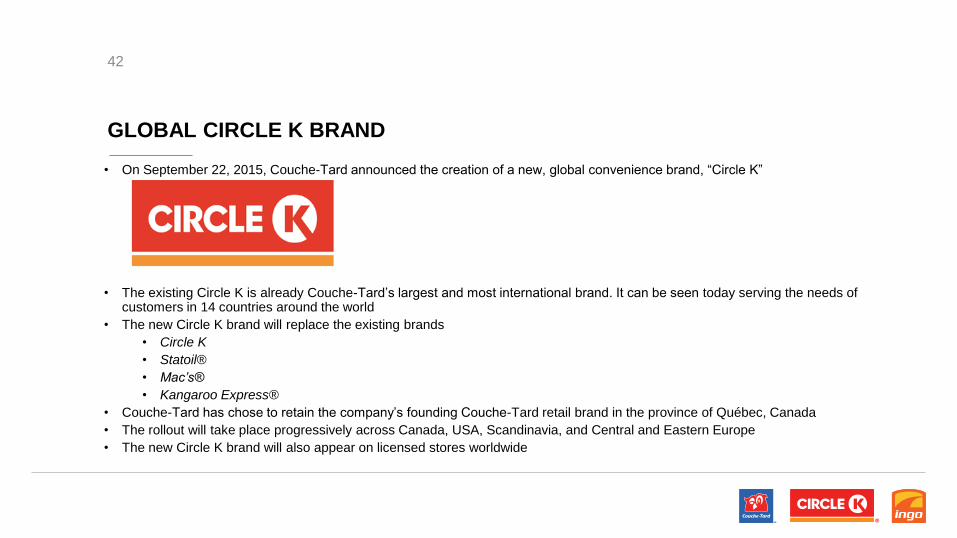
GLOBAL CIRCLE K BRAND
42
• On September 22, 2015, Couche-Tard announced the creation of a new, global convenience brand, “Circle K”
• The existing Circle K is already Couche-Tard’s largest and most international brand. It can be seen today serving the needs of customers in 14 countries around the world
• The new Circle K brand will replace the existing brands
• Circle K
• Statoil®
• Mac’s®
• Kangaroo Express®
• Couche-Tard has chose to retain the company’s founding Couche-Tard retail brand in the province of Québec, Canada
• The rollout will take place progressively across Canada, USA, Scandinavia, and Central and Eastern Europe
• The new Circle K brand will also appear on licensed stores worldwide

GLOBAL CIRCLE K BRAND
43
• The Company’s goal in the coming years is to have a single convenience retail brand across our worldwide network.
• Very pragmatic in our approach: will be rebranding stores as part of our normal cycle of store refreshes.
• Prioritization of recent acquisitions, such as The Pantry, as well as those we are under contractual obligations to rebrand, such our
Statoil sites in Europe.
• This will be in addition to our normal cycle of store refreshes.