Embed Size (px)
Citation preview
A Di ifi d R l E t t C ith P I di PA Diversified Real Estate Company with Pan India Presence
Investors’ UpdateQ2FY11
11

Disclaimer12 11 2010
This presentation has been prepared by Parsvnath Developers Ltd. (the “Company”) solely for providing information about the Company. Thispresentation is confidential and may not be copied or disseminated, in whole or part, in any manner
This presentation has been prepared by the Company based on information and data which the Company considers reliable, but the Company
12.11.2010
p p p y p y p y , p ymakes no representation or warranty or undertaking, express or implied, whatsoever, and no reliance shall be placed on, the truth, accuracy,completeness, fairness, correctness and reasonableness of the contents of this presentation. This presentation has not been approved and willnot be reviewed or approved by any statutory or regulatory authority in India or by any Stock Exchange in India and may not comply with allthe disclosure requirements prescribed thereof. This presentation may not be all inclusive and may not contain all of the information that youmay consider material. Any liability in respect of the contents of, or any omission from, this presentation is expressly excluded
No representation or warranty, express or implied is made as to, and no reliance should be placed on, the fairness, accuracy, completeness orcorrectness of such information or opinions contained herein. Neither the company nor any of its respective affiliates, advisers orrepresentatives, shall have any liability whatsoever (in negligence or otherwise) for any loss howsoever arising from any use of thispresentation or its contents or otherwise arising in connection with this presentation.
The information contained in this presentation is only current as of its date. Certain statements made in this presentation may not be basedon historical information or facts and may be “forward-looking statements”, including those relating to the Company’s general business plansand strategy, its future financial condition and growth prospects, and future developments in its industry and its competitive and regulatoryenvironment. Actual results may differ from these forward-looking statements due to a number of factors, including future changes ordevelopments in the Company’s business, its competitive environment, information technology and political, economic, legal and socialconditions in India and worldwide. The Company undertakes no obligation to update forward looking statements to reflect events orcircumstances after the date thereof.
This presentation and any information presented herein are not intended to be, offers to sell or solicitation of offers to buy the Company’sequity shares or any of its other securities and shall not constitute an offer, solicitation or sale in any jurisdiction in which such offer,
li it ti l i l f lsolicitation or sale is unlawful.
The Company’s equity shares have not been and will not be registered under the U.S. Securities Act 1993, as amended (the Securities Act”)or any securities laws in the United States and, as such, may not be offered or sold in the United States or to, or for the benefit of, U.S.persons (as such term is defined in Regulation S under the Securities Act) absent registration or an exemption from the registrationrequirements of the Securities Act and applicable laws. Any offering of the equity shares made, if any, in the United States (or to U.S.persons) was made by means of a prospectus and private placement memorandum which contained detailed information about the Companyand its management as well as financial statements
22
and its management, as well as financial statements.
The Company may alter, modify or otherwise change in any manner the content of this presentation, without obligation to notify any personof such revision or changes.
Contents
• Real Estate Industry – Emerging Trends
• Overview of Parsvnath Developers Limited
• Key Priorities
• Continued focus on Execution of Existing Projects
• Continued focus on Affordable Housing
• Strengthening the Balance Sheet & Deleveraging
• Overview of Key Business Segments
• Real Estate Development
• Residential
• Commercial
• DMRC Projects
• Hotels
• SEZs
• IT Parks
33
• Third Party Construction

Real Estate Industry – Emerging Trends
44

The Indian Growth Story y
Rapid & Sustainable Economic GrowthThe average growth rate in the period(2004 05 to 2007 08) has been ~
GDP Growth Rate
12(2004 – 05 to 2007 – 08) has been ~8.9%However, growth decelerated in 2008 -09 to 6.7% due to the adverse impact ofthe global financial crisis on the Indian
7.5 6.7
9.09.69.4
7.5
3
6
9
economyDespite the global slowdown, India isexpected to be the second fastest growingeconomy in the Asia Pacific RegionI i h f S i S t i GDP
02005 2006 2007 2008 2009 10 Year
Forecast
Increasing share of Service Sector in GDPThis has resulted in greater demandspace demand for commercial office,retail and hospitality
The Pan India cumulative demand for the 50 5417 18 19 2021
13 14 14 1516
200
250
. ft.
Real Estate Demand Composition
The Pan India cumulative demand for thereal estate across residential, office, retailand hospitality is expected to be ~ 1,098mn sq ft during 2008 - 2012
Residential is expected to drive the
125 132 136 142 152
44 47 48 50
0
50
100
150
1 2 3 4 5
mill
ion
sq.
55
demand and contribute ~ 63% of thetotal space demand between 2008 -2012
1 2 3 4 5
Residential Commercial Retail Hospitality
Source: Cushman & Wakefield, Economic Survey 2007 – 08, RBI
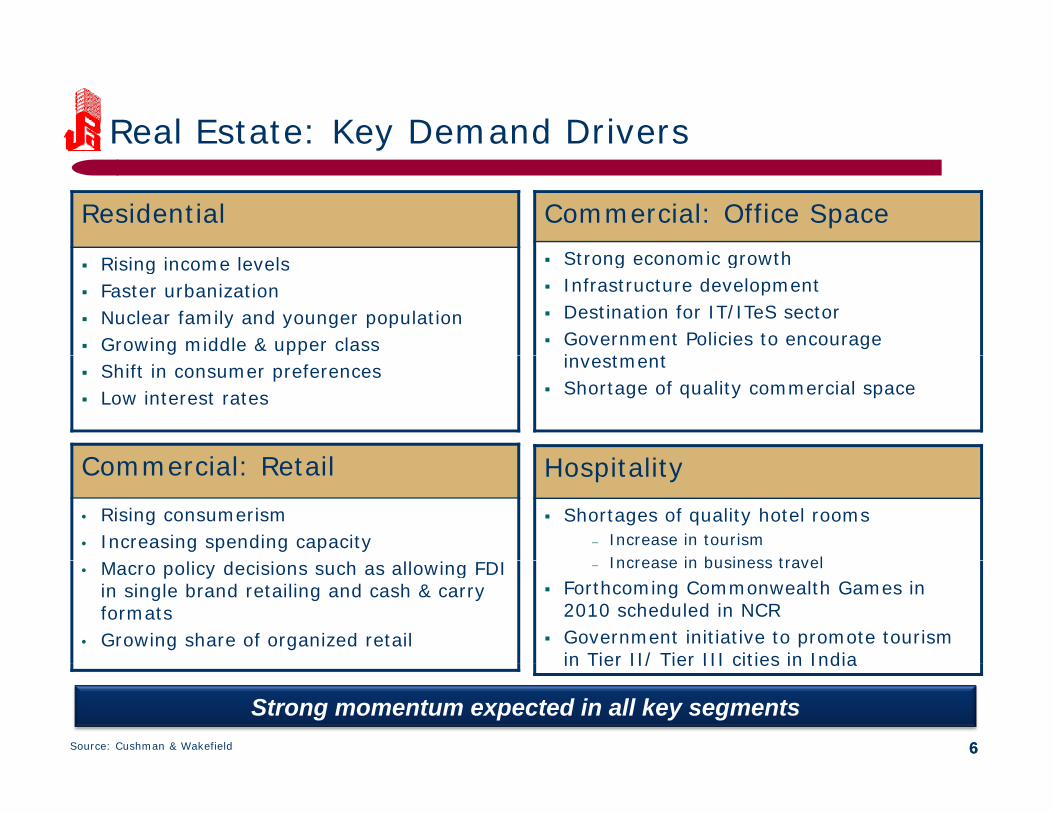
Real Estate: Key Demand Driversy
Residential Commercial: Office SpaceSt i thRising income levels
Faster urbanizationNuclear family and younger populationGrowing middle & upper class
Strong economic growthInfrastructure developmentDestination for IT/ITeS sector Government Policies to encourage i t tShift in consumer preferences
Low interest rates
investmentShortage of quality commercial space
C i l R t il H i liCommercial: Retail
• Rising consumerism• Increasing spending capacity
HospitalityShortages of quality hotel rooms
– Increase in tourismIncrease in business travel• Macro policy decisions such as allowing FDI
in single brand retailing and cash & carry formats
• Growing share of organized retail
– Increase in business travelForthcoming Commonwealth Games in 2010 scheduled in NCRGovernment initiative to promote tourism in Tier II/ Tier III cities in India
66
in Tier II/ Tier III cities in India
Strong momentum expected in all key segmentsSource: Cushman & Wakefield
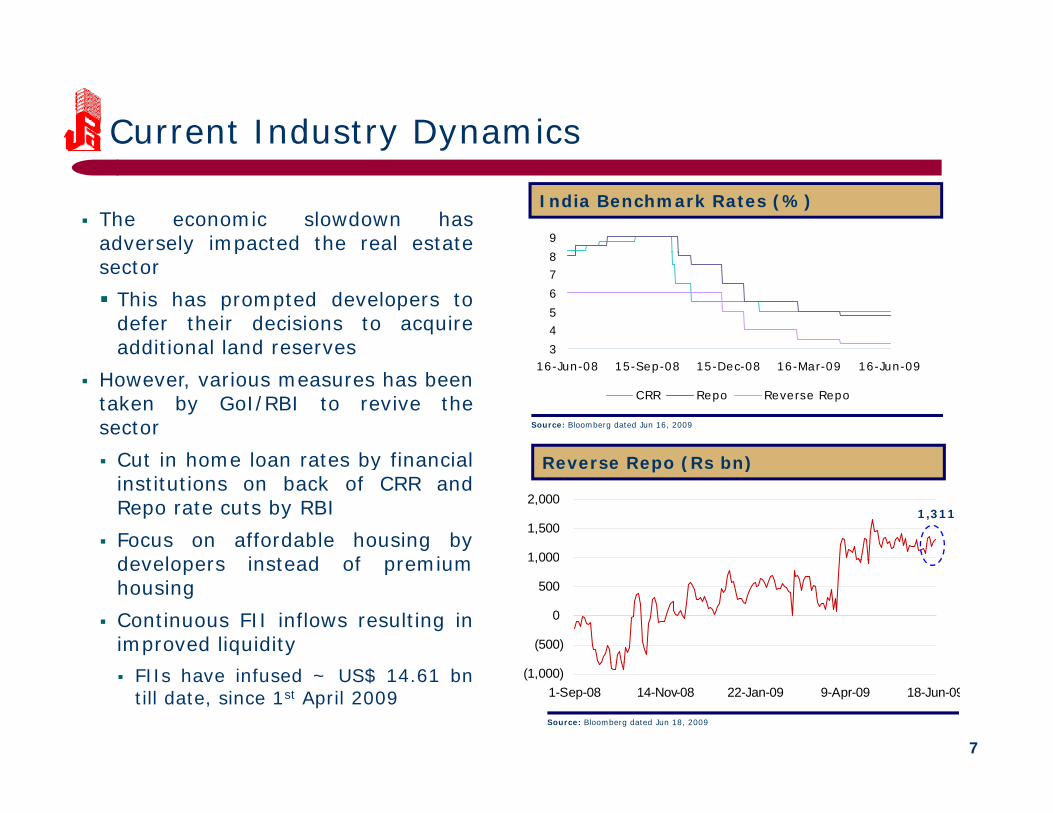
Current Industry Dynamics y y
89
The economic slowdown hasadversely impacted the real estate
India Benchmark Rates (%)
345678
5 004 75
y psector
This has prompted developers todefer their decisions to acquireadditional land reserves
16-Jun-08 15-Sep-08 15-Dec-08 16-Mar-09 16-Jun-09
CRR Repo Reverse Repo
Source: Bloomberg dated Jun 16, 2009
However, various measures has beentaken by GoI/RBI to revive thesector
Cut in home loan rates by financial R R (R b )Cut in home loan rates by financialinstitutions on back of CRR andRepo rate cuts by RBIFocus on affordable housing bydevelopers instead of premium 1,000
1,500
2,000
Reverse Repo (Rs bn)
1,311
developers instead of premiumhousingContinuous FII inflows resulting inimproved liquidity (500)
0
500
1,000
7
FIIs have infused ~ US$ 14.61 bntill date, since 1st April 2009
(1,000)1-Sep-08 14-Nov-08 22-Jan-09 9-Apr-09 18-Jun-09
Source: Bloomberg dated Jun 18, 2009

Overview of Parsvnath Developers Limited
88
Parsvnath Developers Limited: An Overviewp
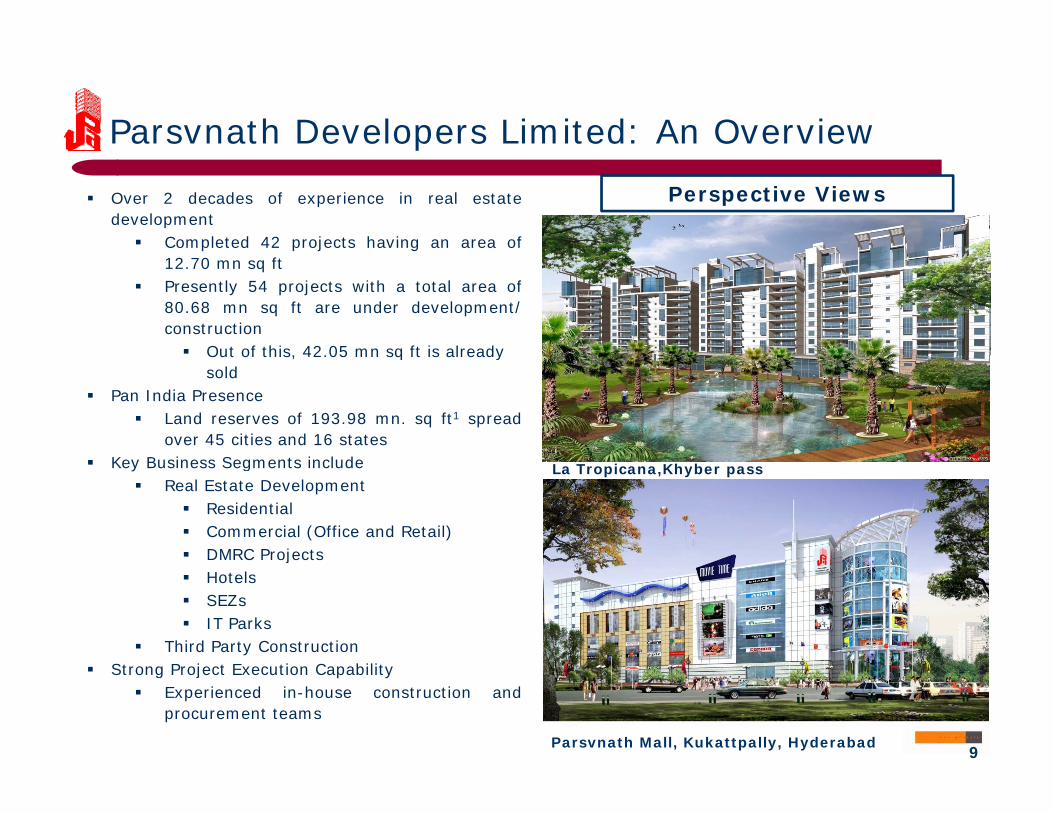
Over 2 decades of experience in real estatedevelopment
Completed 42 projects having an area of
Perspective Views
12.70 mn sq ftPresently 54 projects with a total area of80.68 mn sq ft are under development/construction
Out of this, 42.05 mn sq ft is already Out of this, 42.05 mn sq ft is already sold
Pan India PresenceLand reserves of 193.98 mn. sq ft1 spreadover 45 cities and 16 states
K B i S t i l dKey Business Segments includeReal Estate Development
ResidentialCommercial (Office and Retail)DMRC Projects
La Tropicana,Khyber pass
jHotelsSEZsIT Parks
Third Party ConstructionS C b l
9
Strong Project Execution CapabilityExperienced in-house construction andprocurement teams
Parsvnath Mall, Kukattpally, Hyderabad 9
Diversified Operationsp
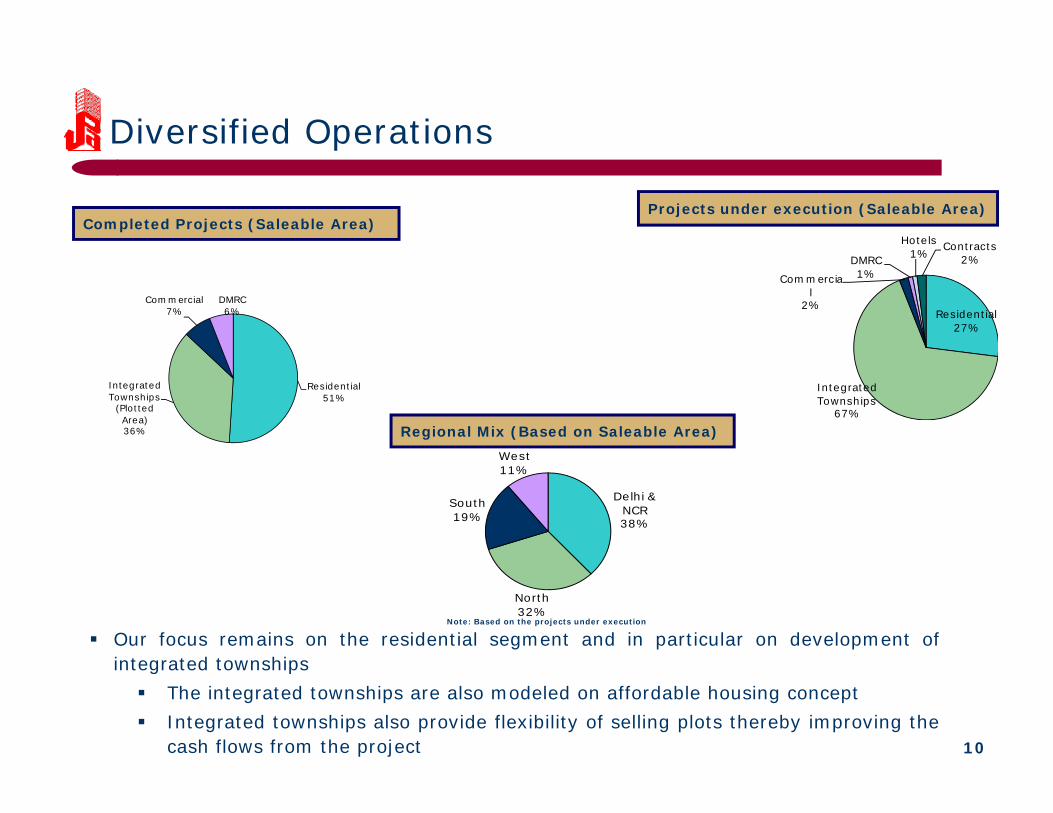
Hotels1%
Contracts
Completed Projects (Saleable Area)Projects under execution (Saleable Area)
Residential27%
Commercial
2%
DMRC 1%
1% 2%
Commercial 7%
DMRC6%
Integrated Townships
67%
Residential51%
Integrated Townships
(Plotted Area)36% Regional Mix (Based on Saleable Area)
West
Delhi & NCR38%
South19%
West11%
Our focus remains on the residential segment and in particular on development ofintegrated townships
North32%
Note: Based on the projects under execution
10
integrated townshipsThe integrated townships are also modeled on affordable housing conceptIntegrated townships also provide flexibility of selling plots thereby improving thecash flows from the project
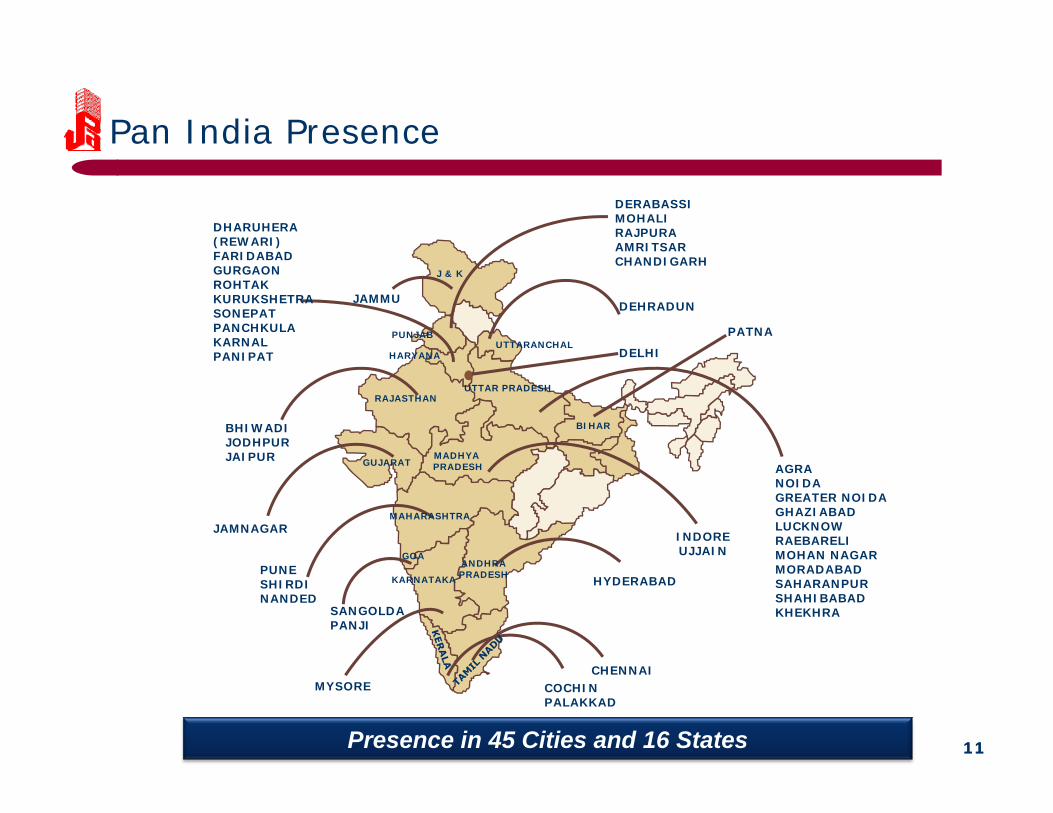
Pan India Presence
DERABASSIMOHALIRAJPURAAMRITSAR
DHARUHERA (REWARI)FARIDABAD CHANDIGARHFARIDABADGURGAONROHTAKKURUKSHETRASONEPATPANCHKULAKARNALPANIPAT
DEHRADUN
DELHIPUNJAB
UTTARANCHALHARYANA
JAMMU
J & K
PATNA
PANIPAT
BHIWADIJODHPURJAIPUR
DELHIHARYANA
UTTAR PRADESHRAJASTHAN
MADHYA
BIHAR
JAIPUR
JAMNAGAR INDOREUJJAIN
AGRANOIDAGREATER NOIDAGHAZIABADLUCKNOWRAEBARELIMOHAN NAGAR
GUJARATMADHYA PRADESH
MAHARASHTRA
GOAANDHRAPUNE
SHIRDINANDED
SANGOLDAPANJI
HYDERABADMORADABADSAHARANPURSHAHIBABADKHEKHRA
KARNATAKA
ANDHRAPRADESH
1111Presence in 45 Cities and 16 States
MYSORE COCHINPALAKKAD
CHENNAI
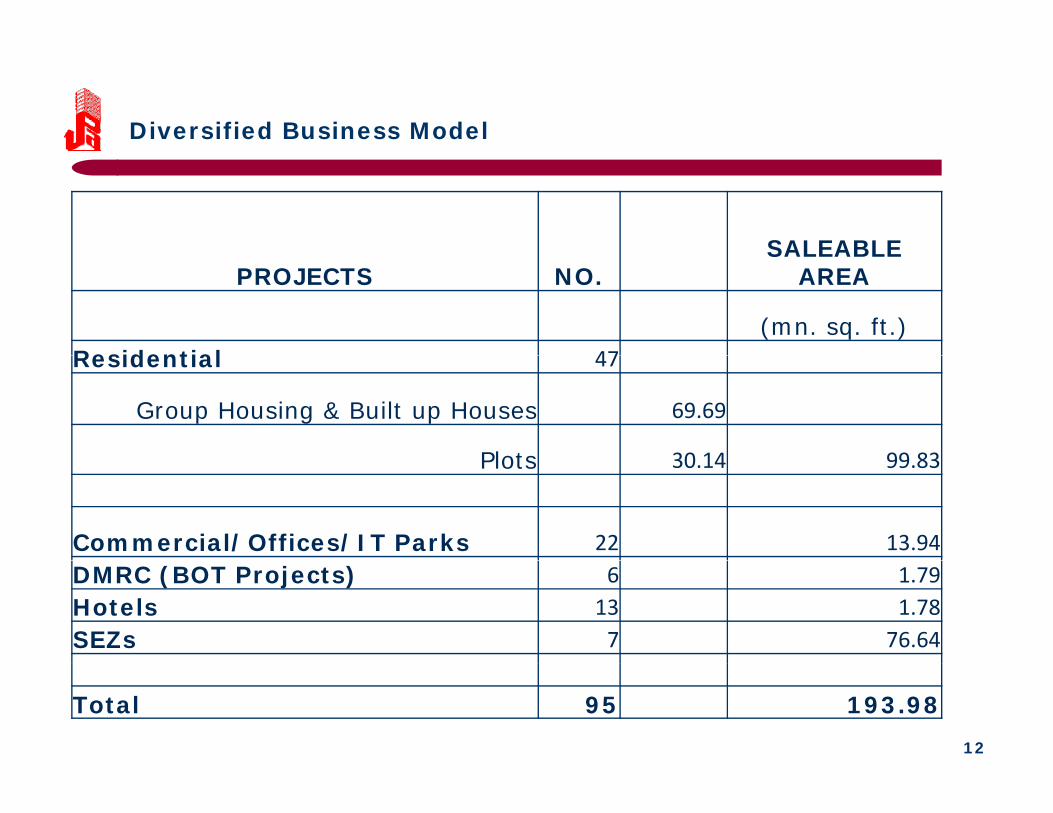
Diversified Business Model
SALEABLE PROJECTS NO.
SALEABLE AREA
(mn. sq. ft.)Residential 47Residential 47
Group Housing & Built up Houses 69.69
Plots 30 14 99 83Plots 30.14 99.83
Commercial/Offices/IT Parks 22 13.94DMRC (BOT Projects) 6 1.79Hotels 13 1.78SEZs 7 76.64
12
Total 95 193.98
Key Priorities
1313
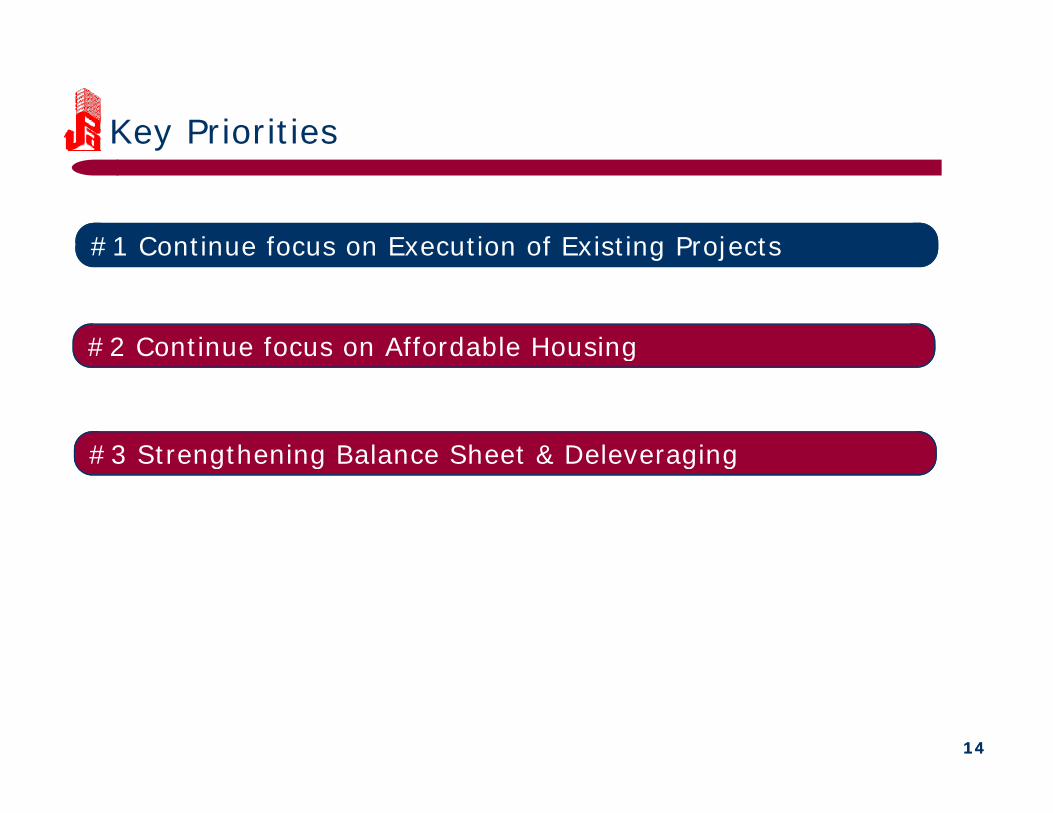
Key Prioritiesy
#1 Continue focus on Execution of Existing Projects#1 Continue focus on Execution of Existing Projects
#2 Continue focus on Affordable Housing#2 Continue focus on Affordable Housing
#3 Strengthening Balance Sheet & Deleveraging#3 Strengthening Balance Sheet & Deleveraging
1414
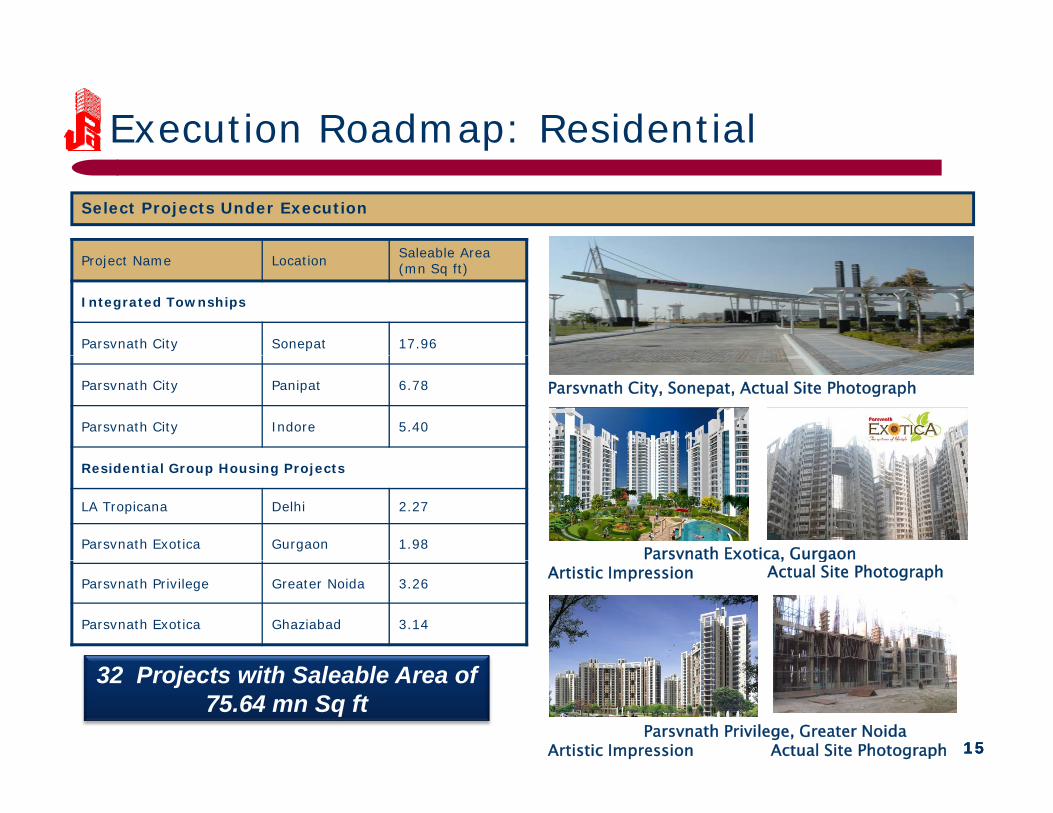
Execution Roadmap: Residentialp
Select Projects Under Execution
Saleable Area Project Name Location Saleable Area (mn Sq ft)
Integrated Townships
Parsvnath City Sonepat 17.96
Parsvnath City Panipat 6.78
Parsvnath City Indore 5.40
Parsvnath City, Sonepat, Actual Site Photograph
Residential Group Housing Projects
LA Tropicana Delhi 2.27
Parsvnath Exotica Gurgaon 1.98 Parsvnath Exotica, Gurgaon
Parsvnath Privilege Greater Noida 3.26
Parsvnath Exotica Ghaziabad 3.14
, gArtistic Impression Actual Site Photograph
151515Parsvnath Privilege, Greater Noida
Artistic Impression Actual Site Photograph
32 Projects with Saleable Area of 75.64 mn Sq ft
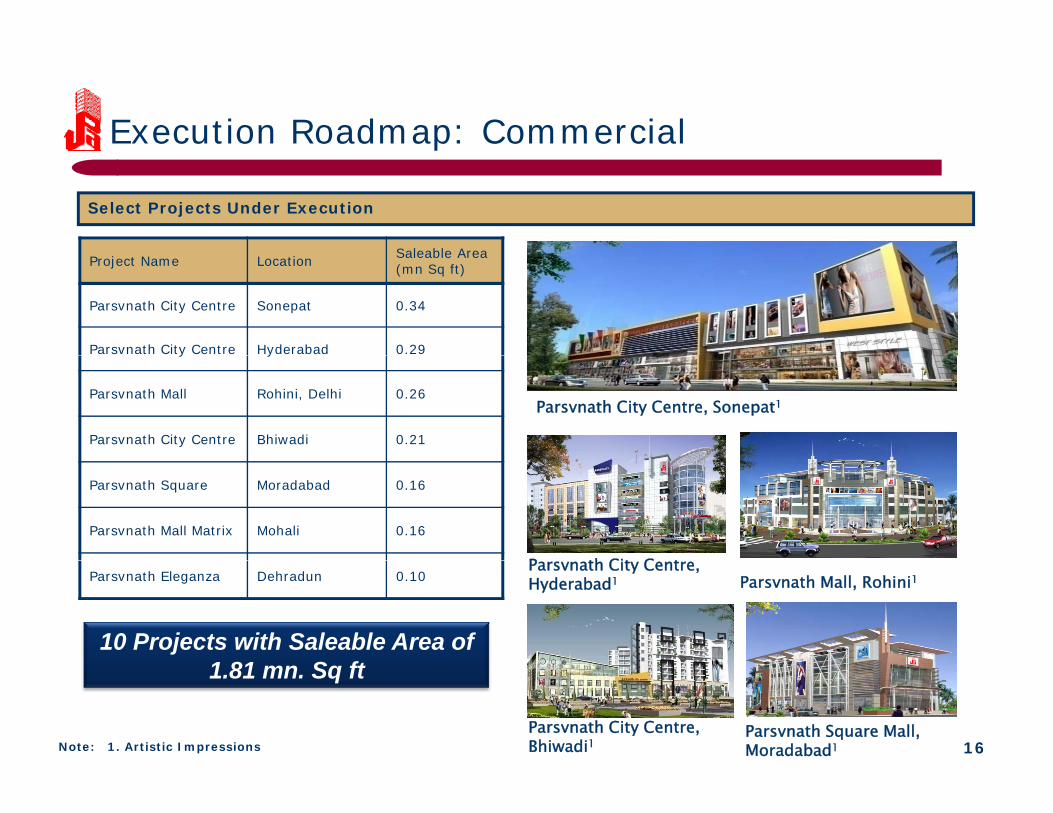
Execution Roadmap: Commercialp
Saleable Area
Select Projects Under Execution
Project Name Location Saleable Area (mn Sq ft)
Parsvnath City Centre Sonepat 0.34
Parsvnath City Centre Hyderabad 0.29y y
Parsvnath Mall Rohini, Delhi 0.26
Parsvnath City Centre Bhiwadi 0.21
Parsvnath City Centre, Sonepat1
Parsvnath Square Moradabad 0.16
Parsvnath Mall Matrix Mohali 0.16
P th Cit C tParsvnath Eleganza Dehradun 0.10
10 Projects with Saleable Area of 1 81 S ft
Parsvnath City Centre, Hyderabad1 Parsvnath Mall, Rohini1
16
1.81 mn. Sq ft
Parsvnath City Centre, Bhiwadi1
Parsvnath Square Mall, Moradabad1Note: 1. Artistic Impressions
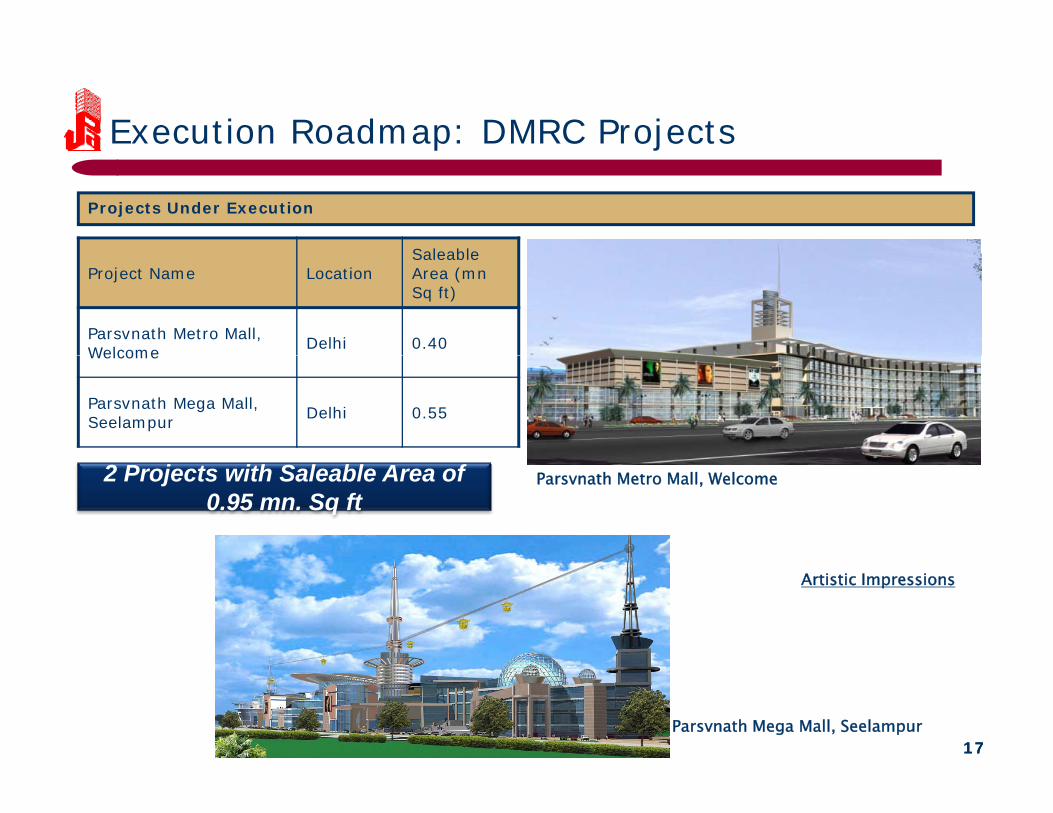
Execution Roadmap: DMRC Projectsp j
Projects Under Execution
Saleable Project Name Location
Saleable Area (mn Sq ft)
Parsvnath Metro Mall, Welcome Delhi 0.40Welcome
Parsvnath Mega Mall, Seelampur Delhi 0.55
Parsvnath Metro Mall, Welcome 2 Projects with Saleable Area of 0.95 mn. Sq ft
Artistic Impressions
1717Parsvnath Mega Mall, Seelampur
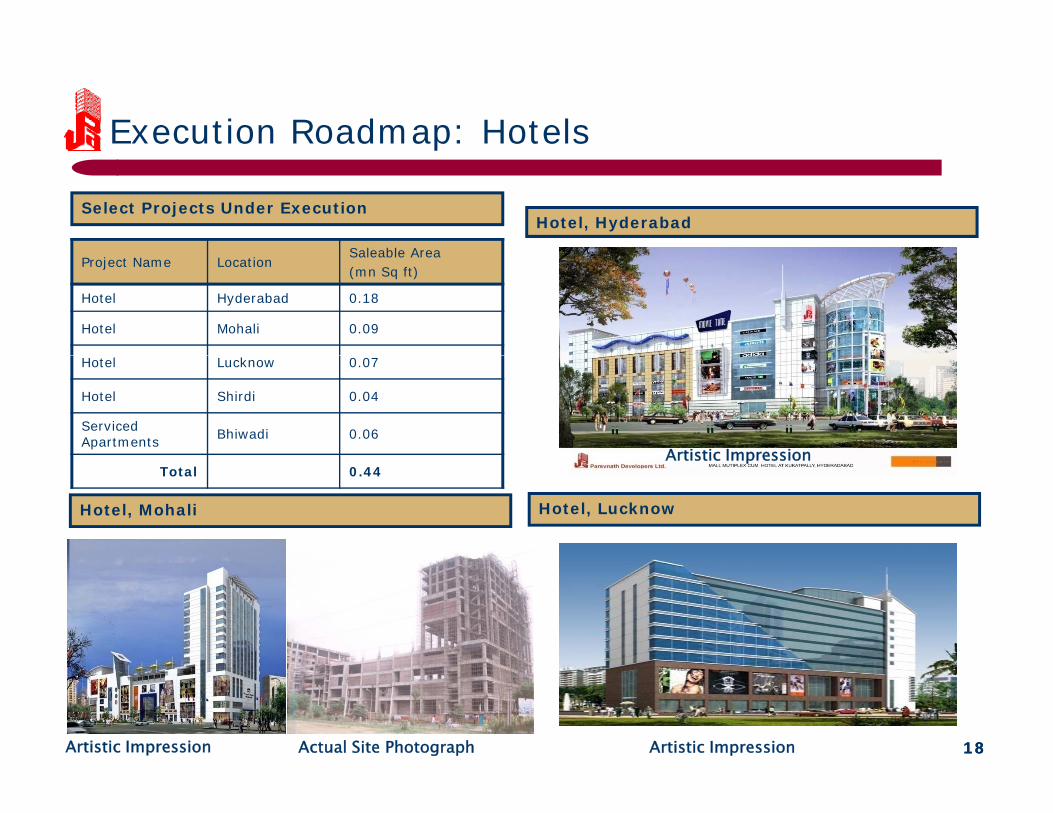
Execution Roadmap: Hotelsp
Select Projects Under Execution
Saleable Area
Hotel, Hyderabad
Project Name LocationSaleable Area (mn Sq ft)
Hotel Hyderabad 0.18
Hotel Mohali 0.09
Hotel Lucknow 0.07
Hotel Shirdi 0.04
Serviced Apartments Bhiwadi 0.06
Artistic ImpressionTotal 0.44
Hotel, Mohali Hotel, Lucknow
Artistic Impression
1818Artistic Impression Actual Site Photograph Artistic Impression
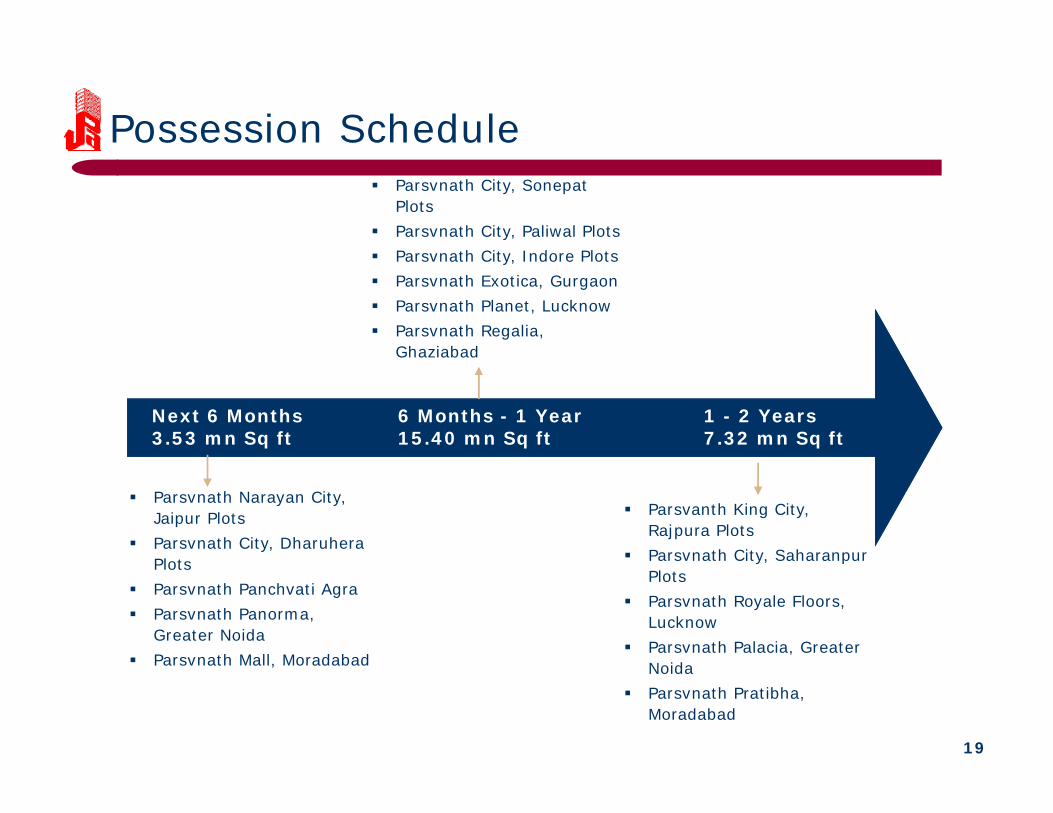
Possession ScheduleParsvnath City, Sonepat PlotsParsvnath City, Paliwal PlotsParsvnath City Indore PlotsParsvnath City, Indore PlotsParsvnath Exotica, GurgaonParsvnath Planet, LucknowParsvnath Regalia, Ghaziabad
Next 6 Months3.53 mn Sq ft
6 Months - 1 Year15.40 mn Sq ft
1 - 2 Years7.32 mn Sq ft
Ghaziabad
Parsvnath Narayan City, Jaipur Plots Parsvnath City, Dharuhera Pl t
Parsvanth King City, Rajpura PlotsParsvnath City, Saharanpur Plots
Parsvnath Panchvati AgraParsvnath Panorma, Greater NoidaParsvnath Mall Moradabad
Parsvnath City, Saharanpur PlotsParsvnath Royale Floors, LucknowParsvnath Palacia, Greater N id
19
Parsvnath Mall, Moradabad NoidaParsvnath Pratibha, Moradabad
Key Prioritiesy
#1 Continue focus on Execution of Existing Projects#1 Continue focus on Execution of Existing Projects
#2 Continue focus on Affordable Housing#2 Continue focus on Affordable Housing
#3 Strengthening Balance Sheet & Deleveraging#3 Strengthening Balance Sheet & Deleveraging
2020
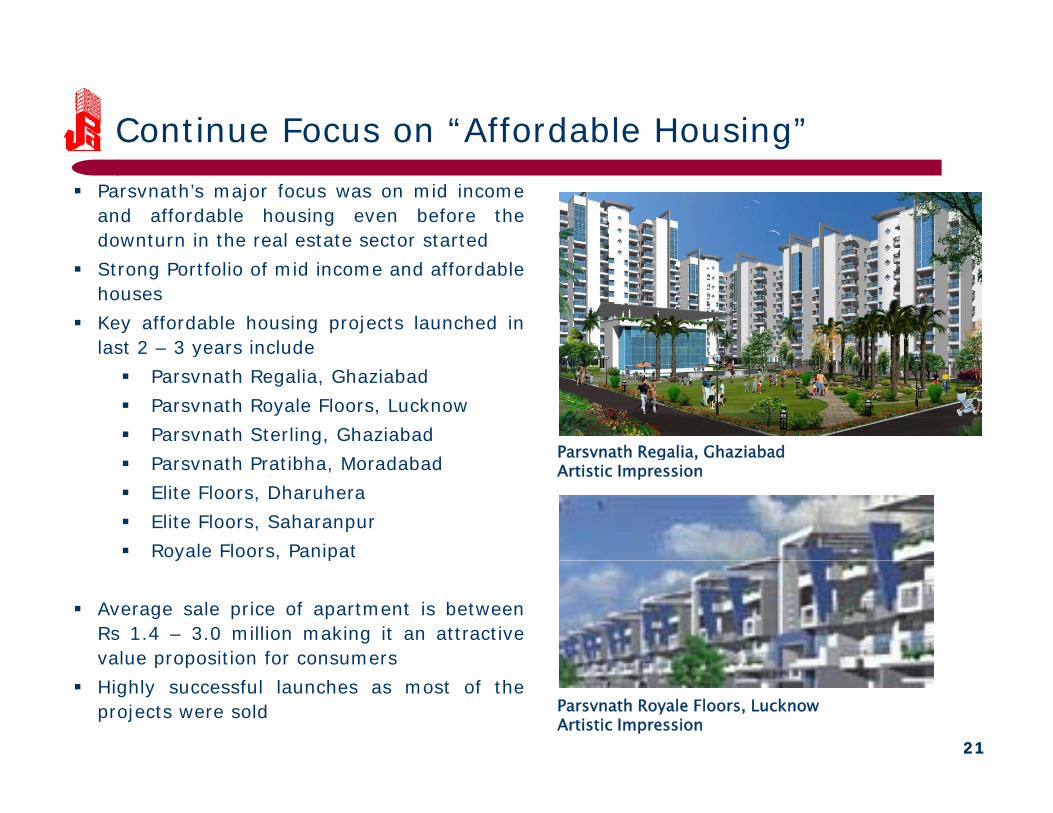
Continue Focus on “Affordable Housing”Parsvnath’s major focus was on mid incomeand affordable housing even before thedownturn in the real estate sector startedStrong Portfolio of mid income and affordablehousesKey affordable housing projects launched inlast 2 – 3 years includey
Parsvnath Regalia, GhaziabadParsvnath Royale Floors, LucknowParsvnath Sterling, GhaziabadP th P tibh M d b d
Parsvnath Regalia, GhaziabadParsvnath Pratibha, MoradabadElite Floors, DharuheraElite Floors, SaharanpurRoyale Floors, Panipat
g ,Artistic Impression
y p
Average sale price of apartment is betweenRs 1.4 – 3.0 million making it an attractivevalue proposition for consumers
2121
value proposition for consumersHighly successful launches as most of theprojects were sold Parsvnath Royale Floors, Lucknow
Artistic Impression
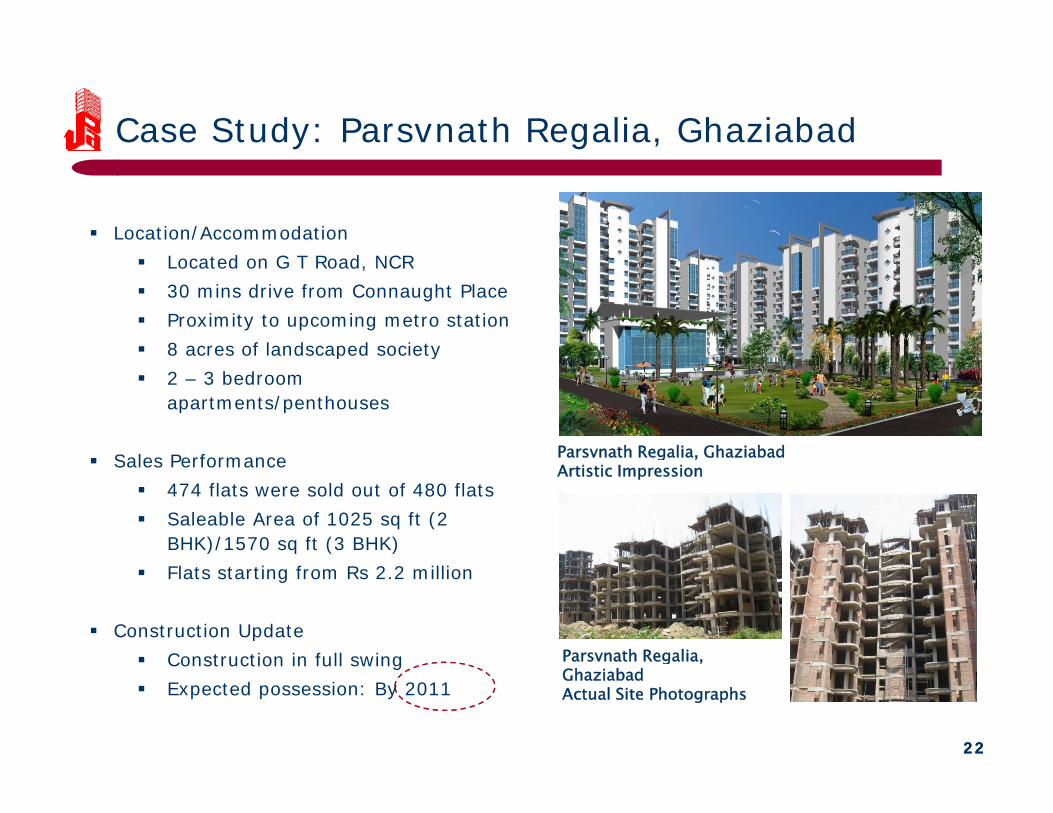
Case Study: Parsvnath Regalia, Ghaziabad
Location/AccommodationLocated on G T Road, NCR30 mins drive from Connaught PlaceProximity to upcoming metro station8 acres of landscaped society8 acres of landscaped society2 – 3 bedroom apartments/penthouses
Sales Performance Parsvnath Regalia, GhaziabadSales Performance474 flats were sold out of 480 flatsSaleable Area of 1025 sq ft (2 BHK)/1570 sq ft (3 BHK)
g ,Artistic Impression
Flats starting from Rs 2.2 million
Construction UpdateConstruction in full swing Parsvnath Regalia,
2222
Construction in full swingExpected possession: By 2011
g ,GhaziabadActual Site Photographs
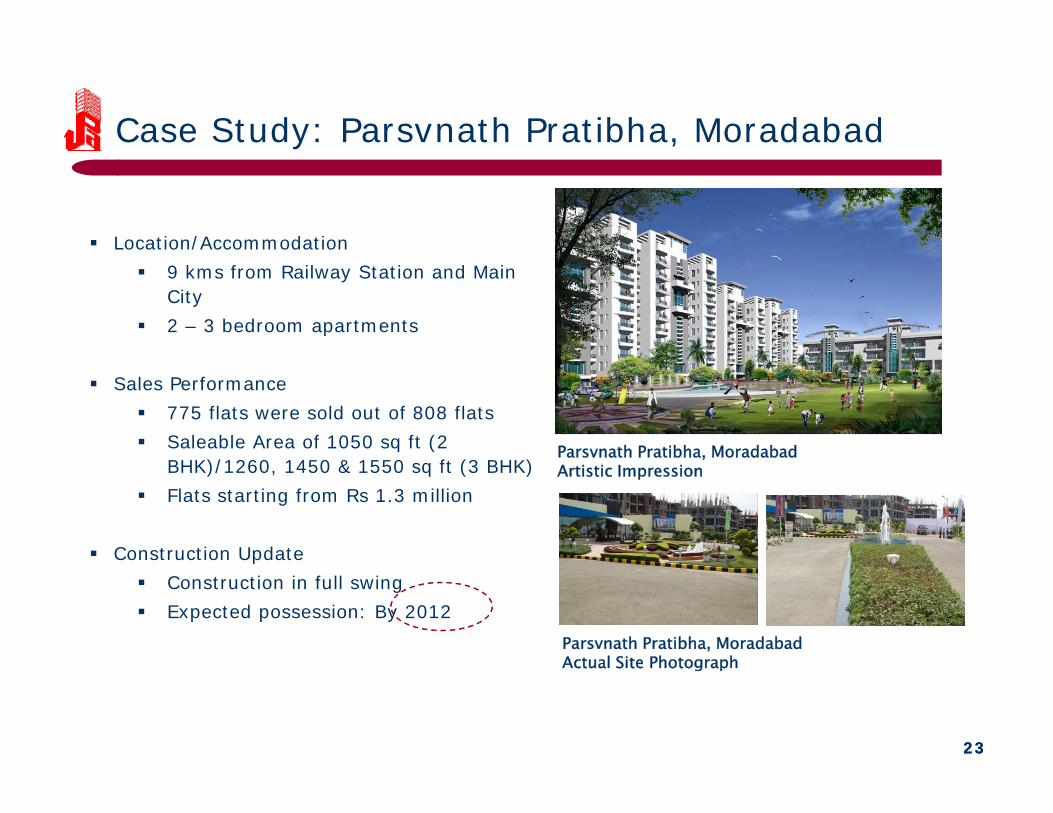
Case Study: Parsvnath Pratibha, Moradabad
Location/Accommodation9 kms from Railway Station and Main City2 – 3 bedroom apartments
Sales Performance775 flats were sold out of 808 flatsSaleable Area of 1050 sq ft (2 Parsvnath Pratibha, MoradabadBHK)/1260, 1450 & 1550 sq ft (3 BHK)Flats starting from Rs 1.3 million
Construction Update
,Artistic Impression
pConstruction in full swingExpected possession: By 2012
Parsvnath Pratibha, MoradabadActual Site Photograph
2323
Actual Site Photograph
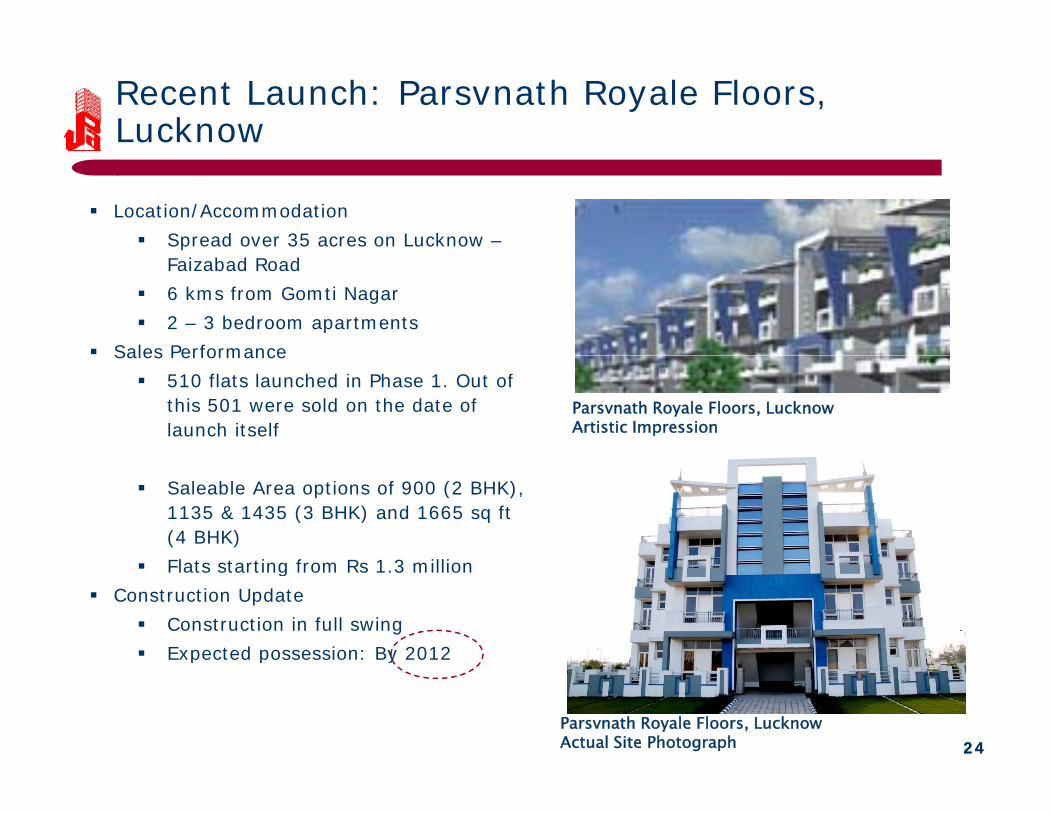
Recent Launch: Parsvnath Royale Floors, Lucknow
Location/AccommodationSpread over 35 acres on Lucknow –Faizabad Road6 kms from Gomti Nagar2 – 3 bedroom apartments
Sales PerformanceSales Performance510 flats launched in Phase 1. Out of this 501 were sold on the date of launch itself
Parsvnath Royale Floors, LucknowArtistic Impression
Saleable Area options of 900 (2 BHK), 1135 & 1435 (3 BHK) and 1665 sq ft (4 BHK)Fl t t ti f R 1 3 illiFlats starting from Rs 1.3 million
Construction UpdateConstruction in full swingExpected possession: By 2012
2424
p p y
Parsvnath Royale Floors, LucknowActual Site Photograph
Overview of Key Business Segments
2525
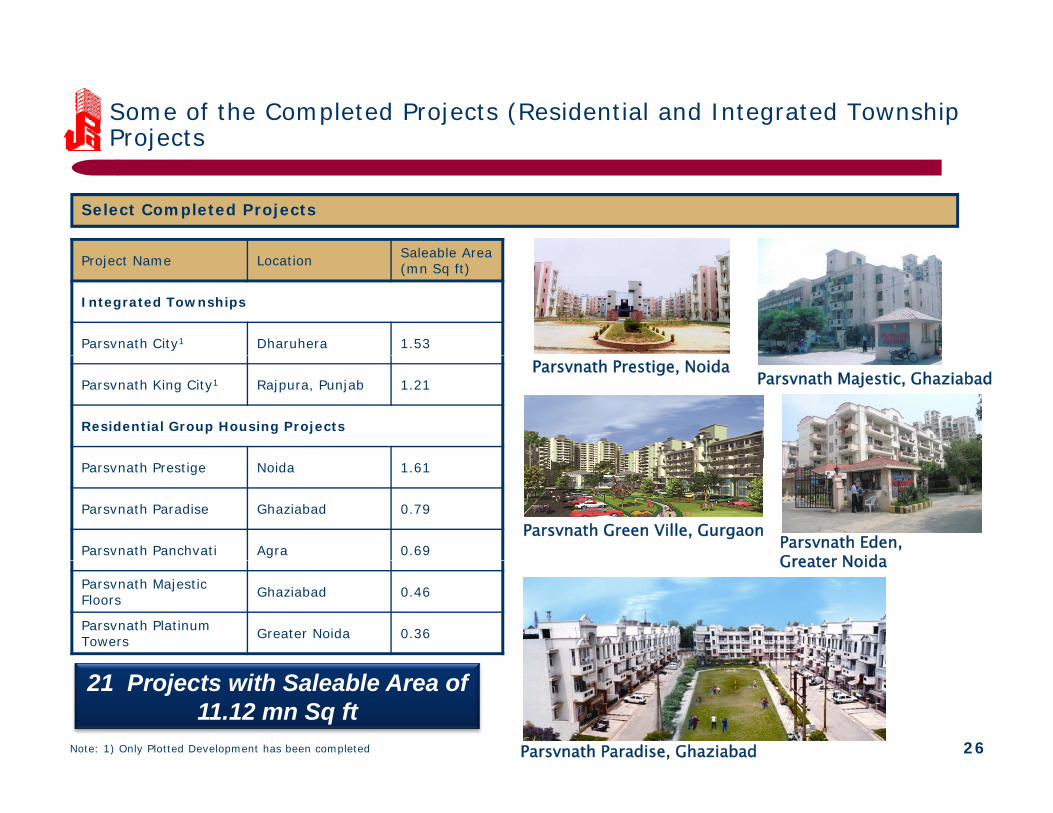
Some of the Completed Projects (Residential and Integrated Township Projectsj
Select Completed Projects
Saleable Area Project Name Location Saleable Area (mn Sq ft)
Integrated Townships
Parsvnath City1 Dharuhera 1.53
Parsvnath King City1 Rajpura, Punjab 1.21
Residential Group Housing Projects
Parsvnath Prestige, NoidaParsvnath Majestic, Ghaziabad
Parsvnath Prestige Noida 1.61
Parsvnath Paradise Ghaziabad 0.79
Parsvnath Panchvati Agra 0.69Parsvnath Green Ville, Gurgaon
Parsvnath Eden, Greater Noida
Parsvnath Majestic Floors Ghaziabad 0.46
Parsvnath Platinum Towers Greater Noida 0.36
Greater Noida
26Parsvnath Paradise, GhaziabadNote: 1) Only Plotted Development has been completed
21 Projects with Saleable Area of 11.12 mn Sq ft
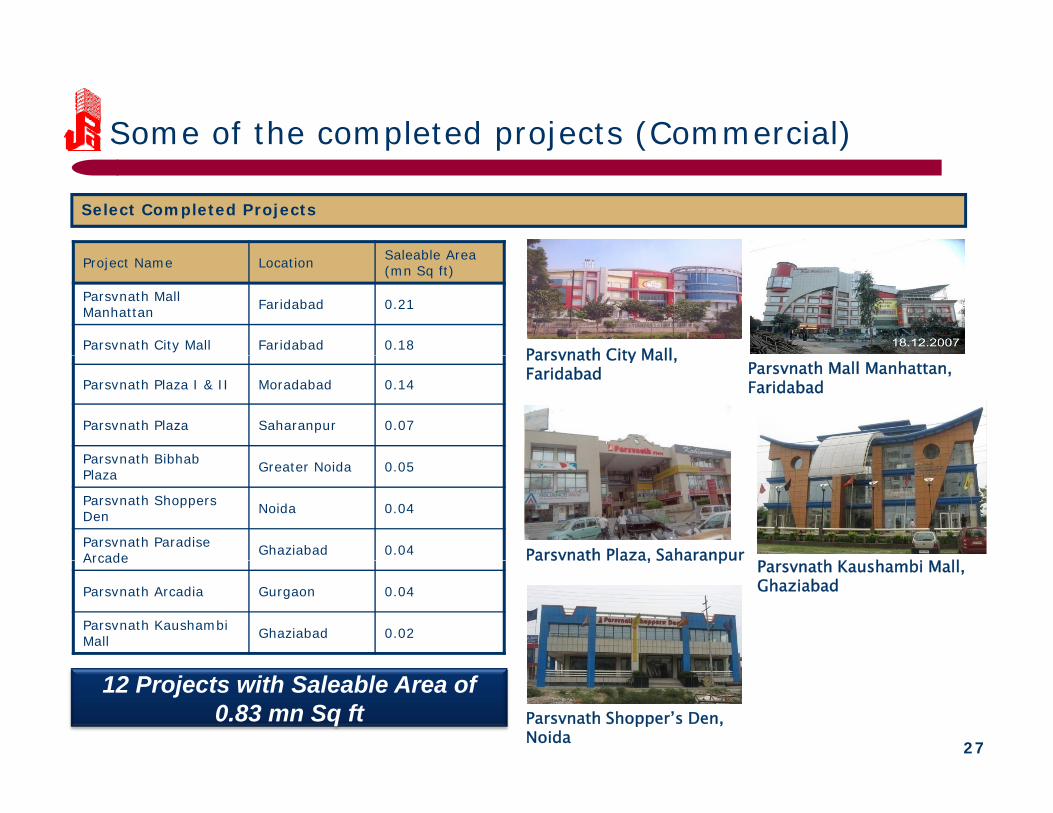
Some of the completed projects (Commercial)p p j ( )
Select Completed Projects
Saleable Area Project Name Location Saleable Area (mn Sq ft)
Parsvnath Mall Manhattan Faridabad 0.21
Parsvnath City Mall Faridabad 0.18 Parsvnath City Mall
Parsvnath Plaza I & II Moradabad 0.14
Parsvnath Plaza Saharanpur 0.07
Parsvnath Bibhab
Parsvnath City Mall, Faridabad Parsvnath Mall Manhattan,
Faridabad
Parsvnath Bibhab Plaza Greater Noida 0.05
Parsvnath Shoppers Den Noida 0.04
Parsvnath Paradise Arcade Ghaziabad 0.04 Parsvnath Plaza, Saharanpur
P h K h bi M llArcade
Parsvnath Arcadia Gurgaon 0.04
Parsvnath Kaushambi Mall Ghaziabad 0.02
a s at a a, Sa a a puParsvnath Kaushambi Mall, Ghaziabad
27
12 Projects with Saleable Area of 0.83 mn Sq ft Parsvnath Shopper’s Den,
Noida
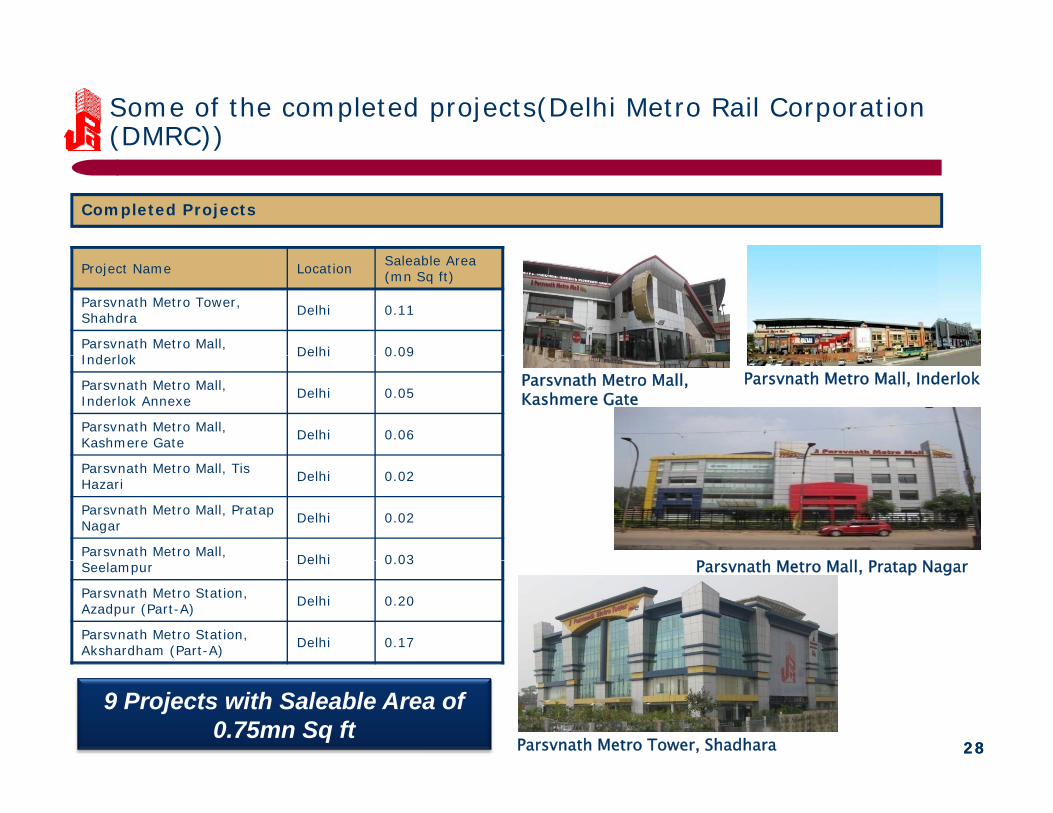
Some of the completed projects(Delhi Metro Rail Corporation (DMRC))( ))
Completed Projects
Project Name Location Saleable Area (mn Sq ft)
Parsvnath Metro Tower, Shahdra Delhi 0.11
Parsvnath Metro Mall, I d l k Delhi 0.09Inderlok Delhi 0.09
Parsvnath Metro Mall, Inderlok Annexe Delhi 0.05
Parsvnath Metro Mall, Kashmere Gate Delhi 0.06
Parsvnath Metro Mall, Kashmere Gate
Parsvnath Metro Mall, Inderlok
Parsvnath Metro Mall, Tis Hazari Delhi 0.02
Parsvnath Metro Mall, Pratap Nagar Delhi 0.02
Parsvnath Metro Mall, Delhi 0 03 P h M M ll P NSeelampur Delhi 0.03
Parsvnath Metro Station, Azadpur (Part-A) Delhi 0.20
Parsvnath Metro Station, Akshardham (Part-A) Delhi 0.17
Parsvnath Metro Mall, Pratap Nagar
2828Parsvnath Metro Tower, Shadhara
9 Projects with Saleable Area of 0.75mn Sq ft
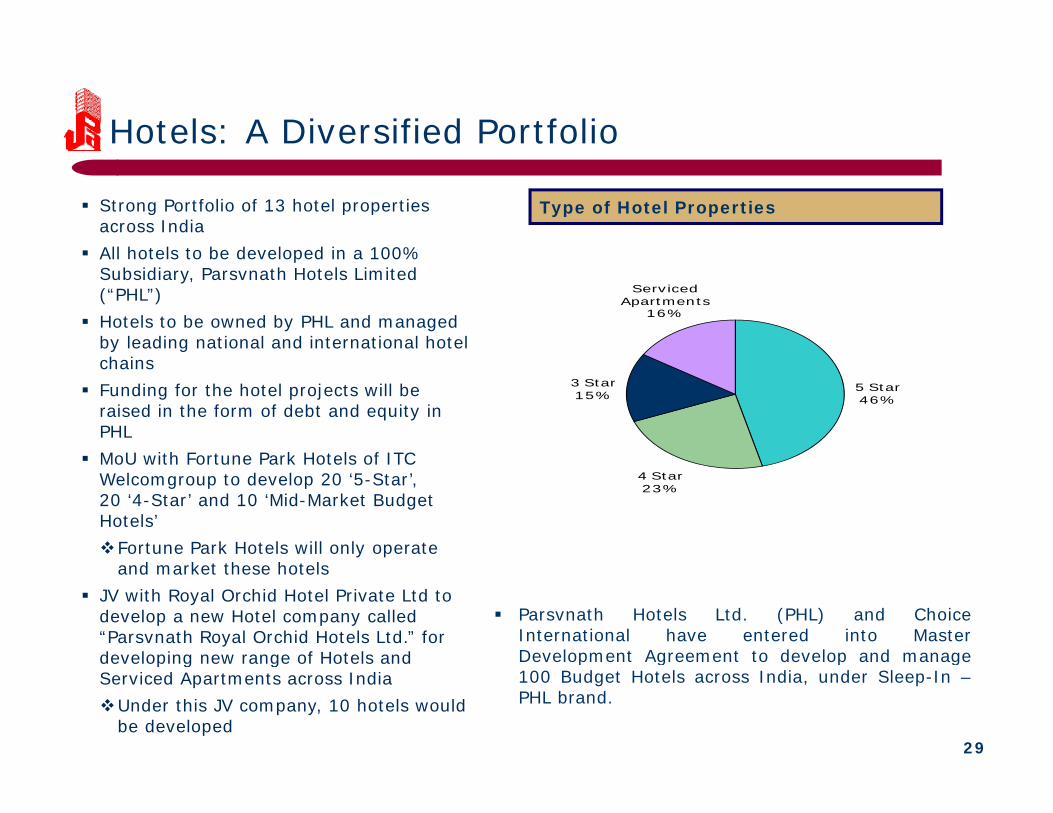
Hotels: A Diversified Portfolio
Strong Portfolio of 13 hotel properties across IndiaAll hotels to be developed in a 100%
Type of Hotel Properties
All hotels to be developed in a 100% Subsidiary, Parsvnath Hotels Limited (“PHL”)Hotels to be owned by PHL and managed by leading national and international hotel
Serviced Apartments
16%
chainsFunding for the hotel projects will be raised in the form of debt and equity in PHLMoU with Fortune Park Hotels of ITC
5 Star46%
3 Star15%
MoU with Fortune Park Hotels of ITC Welcomgroup to develop 20 ‘5-Star’, 20 ‘4-Star’ and 10 ‘Mid-Market Budget Hotels’
Fortune Park Hotels will only operate
4 Star23%
and market these hotelsJV with Royal Orchid Hotel Private Ltd to develop a new Hotel company called “Parsvnath Royal Orchid Hotels Ltd.” for developing new range of Hotels and
Parsvnath Hotels Ltd. (PHL) and ChoiceInternational have entered into MasterDevelopment Agreement to develop and manage
29
developing new range of Hotels and Serviced Apartments across India
Under this JV company, 10 hotels would be developed
p g p g100 Budget Hotels across India, under Sleep-In –PHL brand.
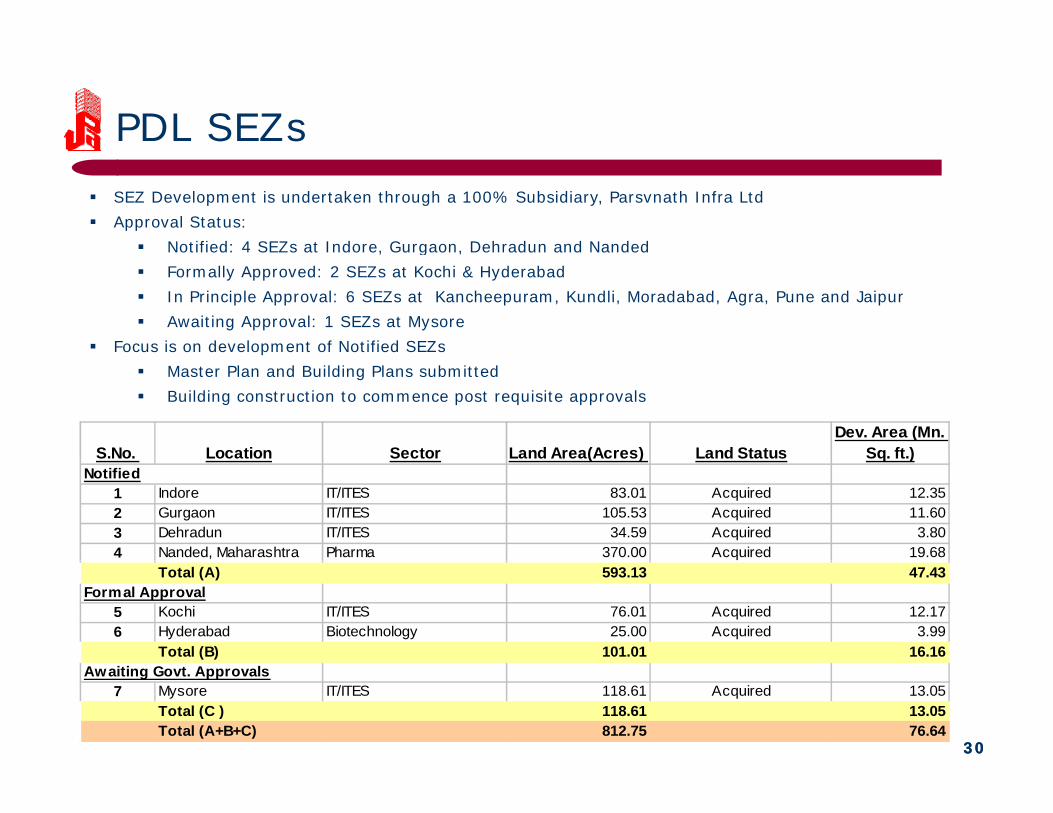
PDL SEZsSEZ Development is undertaken through a 100% Subsidiary, Parsvnath Infra Ltd Approval Status:
Notified: 4 SEZs at Indore, Gurgaon, Dehradun and Nanded, g ,Formally Approved: 2 SEZs at Kochi & HyderabadIn Principle Approval: 6 SEZs at Kancheepuram, Kundli, Moradabad, Agra, Pune and JaipurAwaiting Approval: 1 SEZs at Mysore
Focus is on development of Notified SEZsMaster Plan and Building Plans submittedBuilding construction to commence post requisite approvals
S.No. Location Sector Land Area(Acres) Land StatusDev. Area (Mn.
Sq. ft.)S.No. Location Sector Land Area(Acres) Land Status Sq. ft.)
1 Indore IT/ITES 83.01 Acquired 12.352 Gurgaon IT/ITES 105.53 Acquired 11.603 Dehradun IT/ITES 34.59 Acquired 3.804 Nanded, Maharashtra Pharma 370.00 Acquired 19.68
Notified
Total (A) 593.13 47.43Formal Approval
5 Kochi IT/ITES 76.01 Acquired 12.176 Hyderabad Biotechnology 25.00 Acquired 3.99
Total (B) 101.01 16.16
3030
Awaiting Govt. Approvals7 Mysore IT/ITES 118.61 Acquired 13.05
Total (C ) 118.61 13.05Total (A+B+C) 812.75 76.64
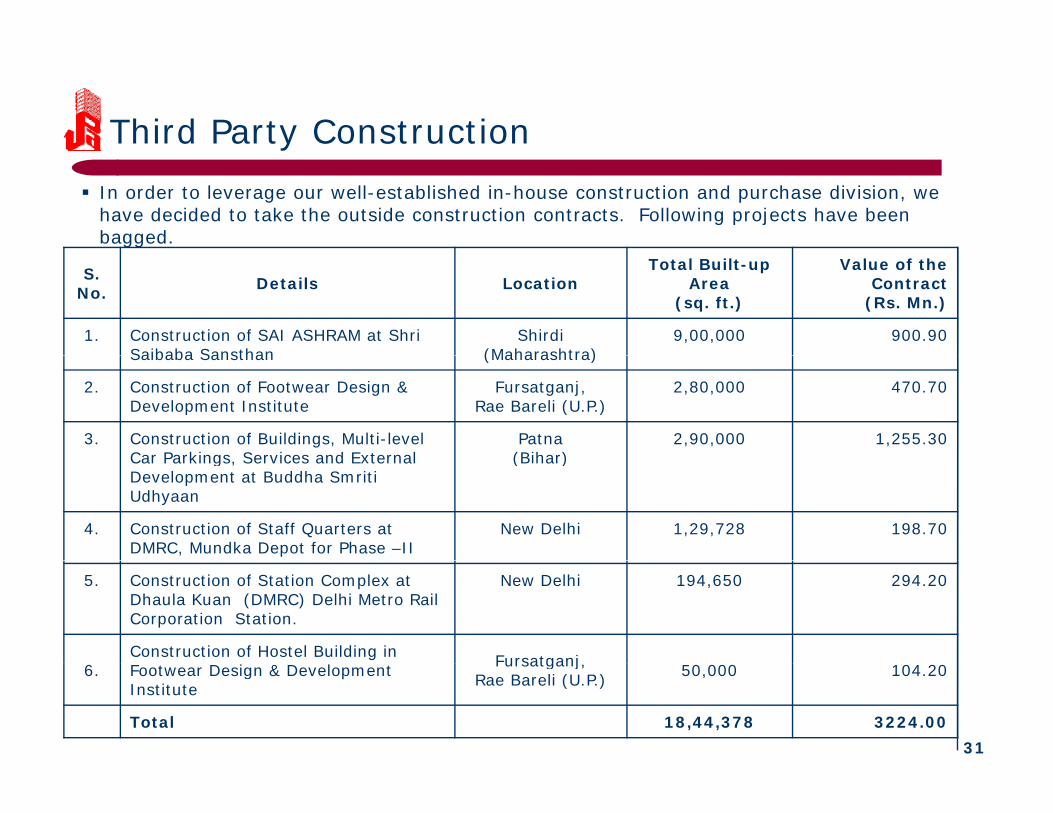
Third Party ConstructionIn order to leverage our well-established in-house construction and purchase division, we have decided to take the outside construction contracts. Following projects have been bagged.
y
S. No. Details Location
Total Built-up Area
(sq. ft.)
Value of the Contract
(Rs. Mn.)
1. Construction of SAI ASHRAM at Shri Saibaba Sansthan
Shirdi(Maharashtra)
9,00,000 900.90Saibaba Sansthan (Maharashtra)
2. Construction of Footwear Design & Development Institute
Fursatganj, Rae Bareli (U.P.)
2,80,000 470.70
3. Construction of Buildings, Multi-level Car Parkings Services and External
Patna (Bihar)
2,90,000 1,255.30Car Parkings, Services and External Development at Buddha SmritiUdhyaan
(Bihar)
4. Construction of Staff Quarters at DMRC, Mundka Depot for Phase –II
New Delhi 1,29,728 198.70
5. Construction of Station Complex at Dhaula Kuan (DMRC) Delhi Metro Rail Corporation Station.
New Delhi 194,650 294.20
Construction of Hostel Building in Fursatganj
31
6. Footwear Design & Development Institute
Fursatganj, Rae Bareli (U.P.) 50,000 104.20
Total 18,44,378 3224.00
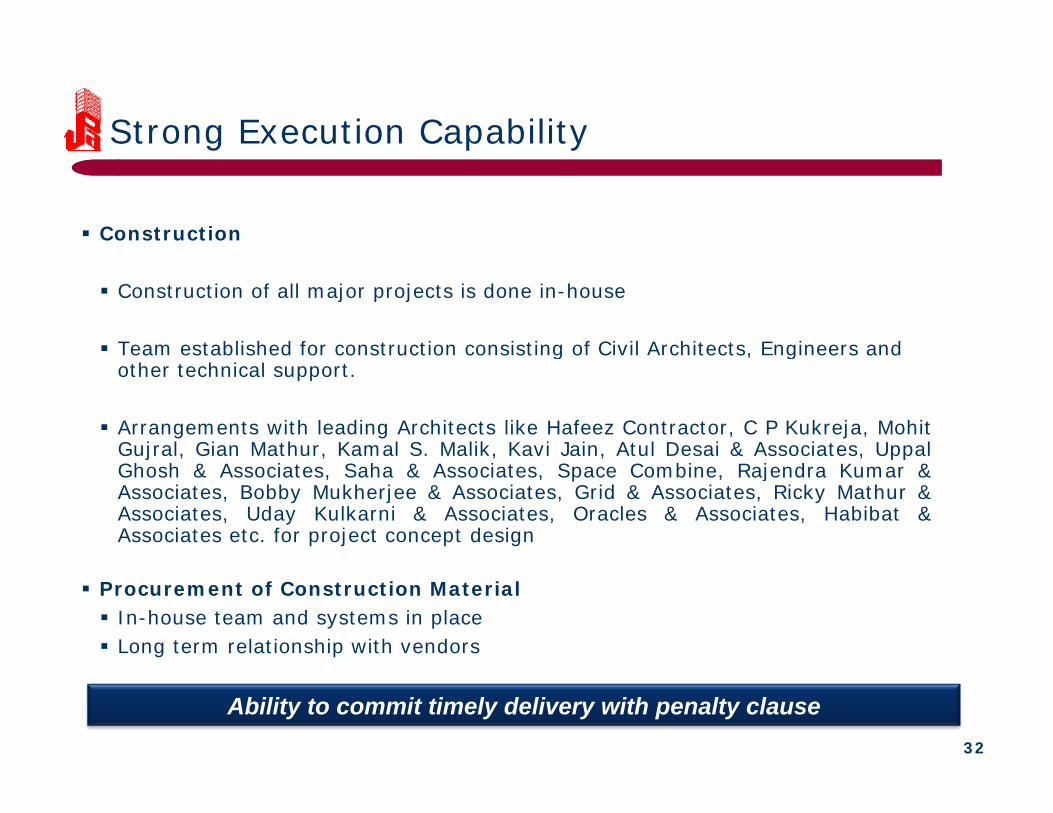
Strong Execution Capabilityg p y
Construction
Construction of all major projects is done in-house
Team established for construction consisting of Civil Architects, Engineers and ea estab s ed o co st uct o co s st g o C c tects, g ee s a dother technical support.
Arrangements with leading Architects like Hafeez Contractor, C P Kukreja, MohitGujral, Gian Mathur, Kamal S. Malik, Kavi Jain, Atul Desai & Associates, Uppalj , , , , , ppGhosh & Associates, Saha & Associates, Space Combine, Rajendra Kumar &Associates, Bobby Mukherjee & Associates, Grid & Associates, Ricky Mathur &Associates, Uday Kulkarni & Associates, Oracles & Associates, Habibat &Associates etc. for project concept design
Procurement of Construction MaterialIn-house team and systems in placeLong term relationship with vendors
32
Ability to commit timely delivery with penalty clause
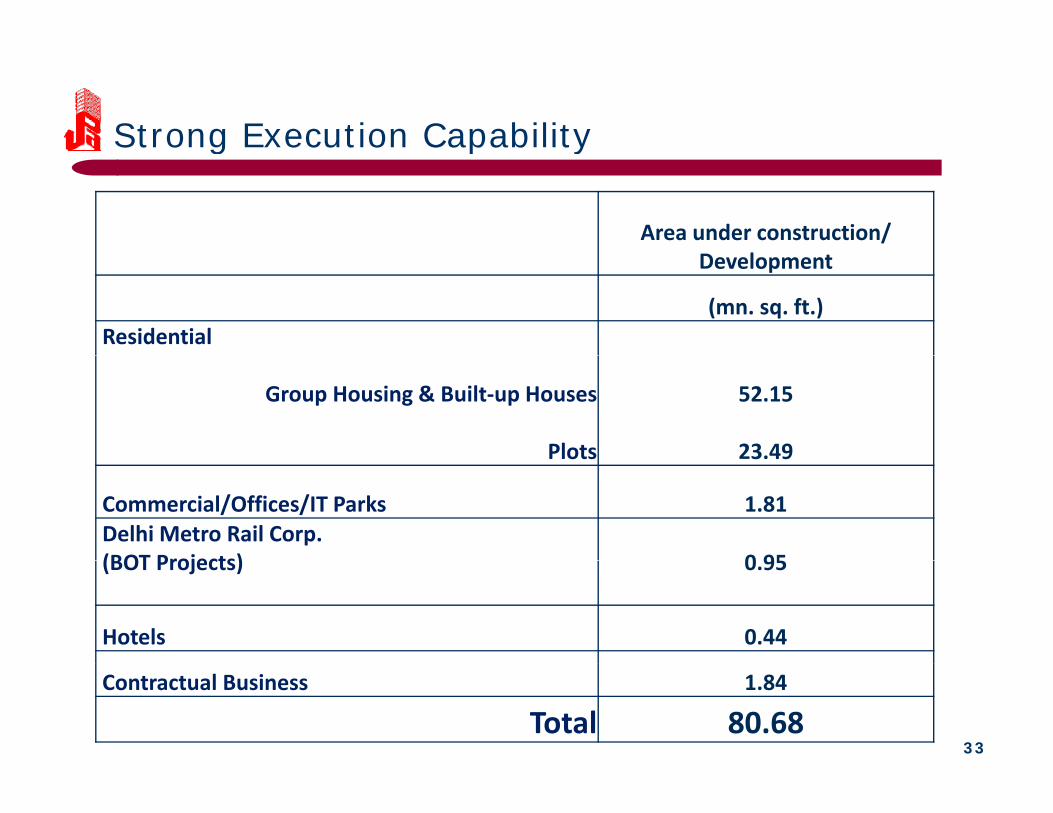
Strong Execution Capability
Area under construction/l
g p y
Development
(mn. sq. ft.)Residential
Group Housing & Built‐up Houses
Plots
52.15
23.49Plots 23.49
Commercial/Offices/IT Parks 1.81Delhi Metro Rail Corp. (BOT Projects) 0 95(BOT Projects) 0.95
Hotels 0.44
33
Contractual Business 1.84
Total 80.68
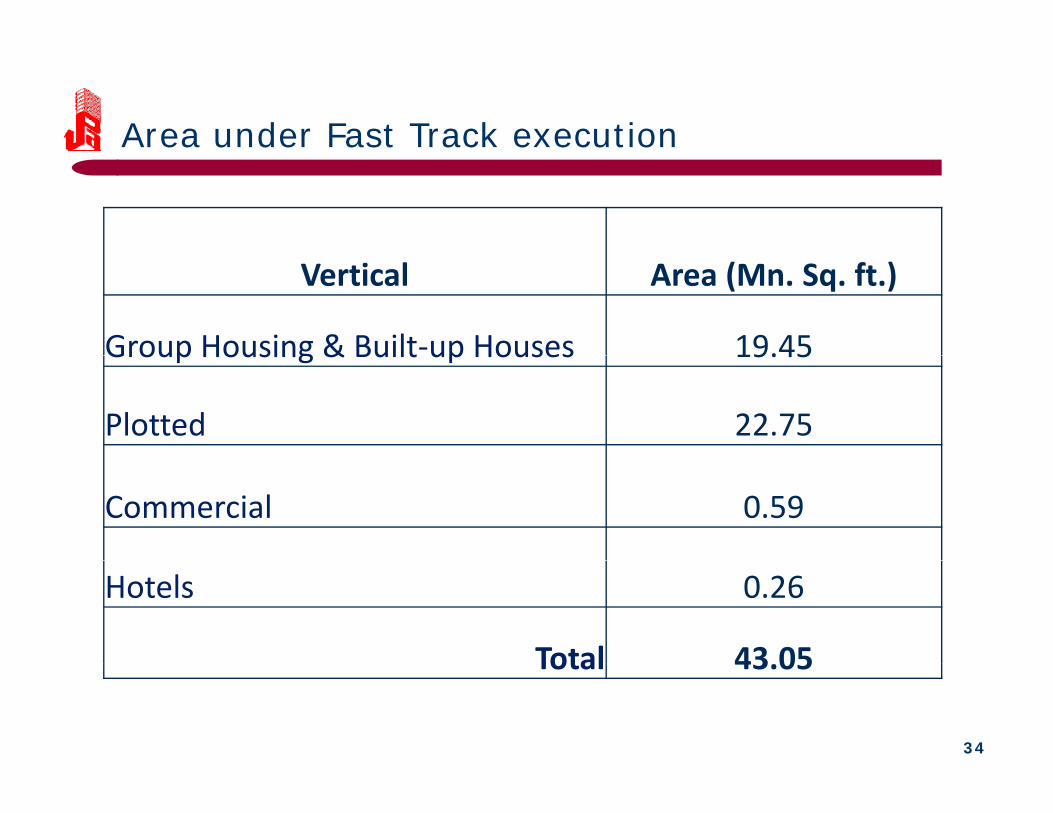
Area under Fast Track execution
Vertical Area (Mn. Sq. ft.)
Group Housing & Built‐up Houses 19.45Group Housing & Built up Houses 19.45
Plotted 22.75
Commercial 0.59
Hotels 0.26
Total 43 05
34
Total 43.05
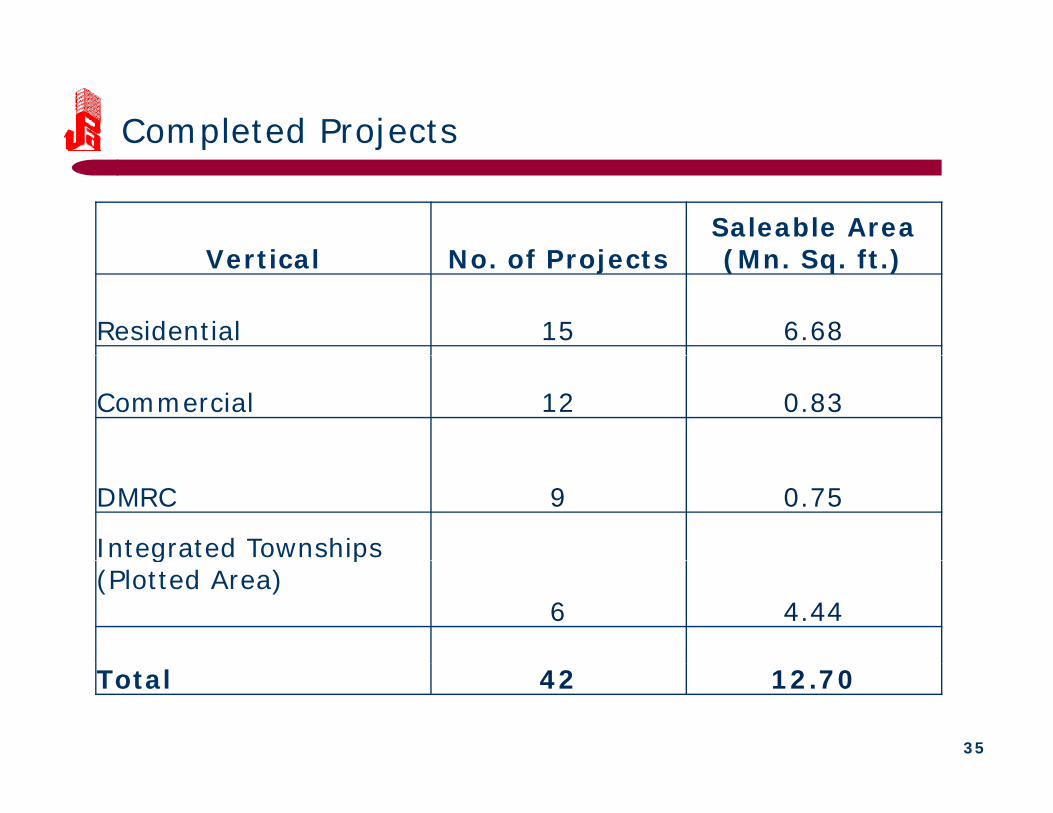
Completed Projects
V ti l N f P j tSaleable Area (M S ft )Vertical No. of Projects (Mn. Sq. ft.)
Residential 15 6.68
Commercial 12 0.83
DMRC 9 0.75
Integrated Townships g p(Plotted Area)
6 4.44
35
Total 42 12.70
Highlights of Q2FY11
36
Major highlights of Q2FY11
• Sold 740 units, an area of 1.42 mn. sq. ft. in Q2FY11.
• Possession offered for 185 units, an area of 4,11,987 sq. ft.
• Allotted 1,90,38,113 shares and raised Rs. 270 Cr. throughQIP route.Q
• Bagged a Third-Party Construction Contract for theconstruction of Hostel Building in Footwear Design &Development Institute (FDDI) at Fursatganj, Rai Bareilly,U.P., having Contract value of Rs. 10.42 Cr. The area to be
t t d i 50 000 ft
37
constructed is approx. 50,000 sq. ft .
Major highlights of Q2FY11 (Cont…)
• Parsvnath Hotels Ltd (PHL) and Choice International have• Parsvnath Hotels Ltd. (PHL) and Choice International haveentered into Master Development Agreement to developand manage 100 Budget Hotels across India, under Sleep-In – PHL brandIn PHL brand.
• Shortlisted by Railway Land Development Authority (RLDA)y y p y ( )with regard to commercial development of railway land atSarai Rohilla, Delhi. The area of plot is 38 Acres and thetotal developable area would be approx. 4 mn. Sq. ft.
• Employees strength stands at 765.
38
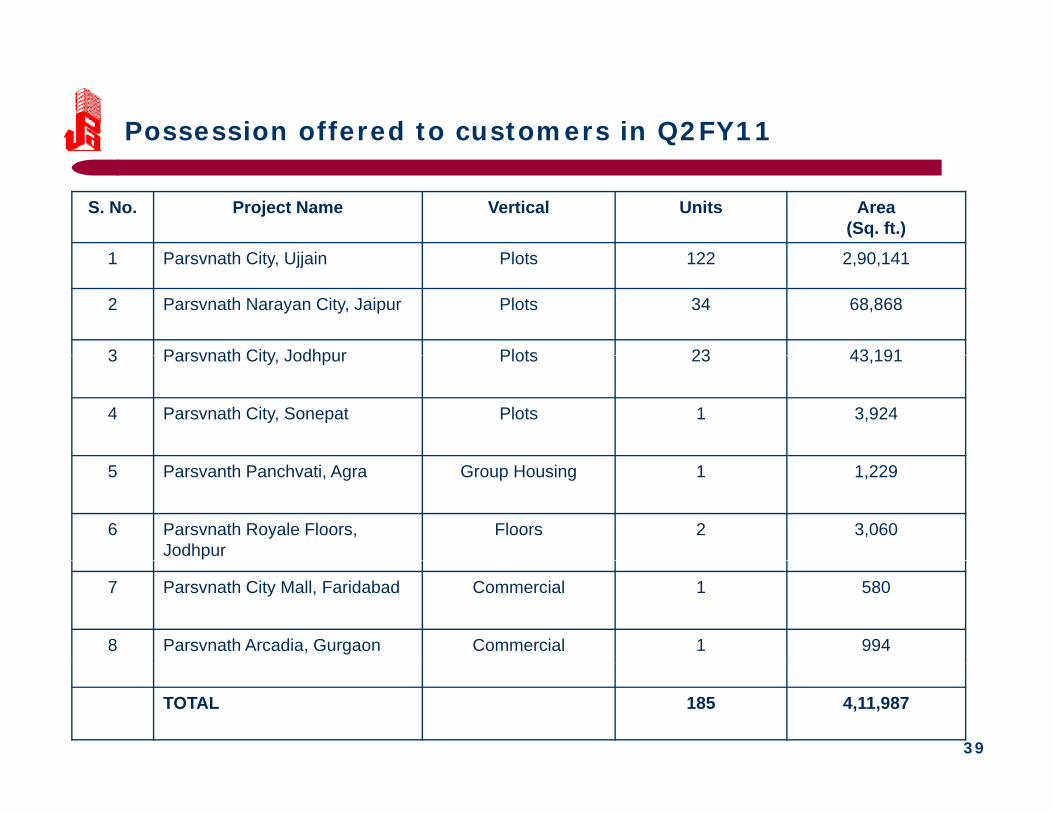
Possession offered to customers in Q2FY11
S. No. Project Name Vertical Units Area (Sq. ft.)
1 P th Cit Ujj i Pl t 122 2 90 1411 Parsvnath City, Ujjain Plots 122 2,90,141
2 Parsvnath Narayan City, Jaipur Plots 34 68,868
3 Parsvnath City Jodhpur Plots 23 43 1913 Parsvnath City, Jodhpur Plots 23 43,191
4 Parsvnath City, Sonepat Plots 1 3,924
5 Parsvanth Panchvati, Agra Group Housing 1 1,229
6 Parsvnath Royale Floors, Jodhpur
Floors 2 3,060
7 Parsvnath City Mall, Faridabad Commercial 1 580
8 Parsvnath Arcadia, Gurgaon Commercial 1 994
39
TOTAL 185 4,11,987
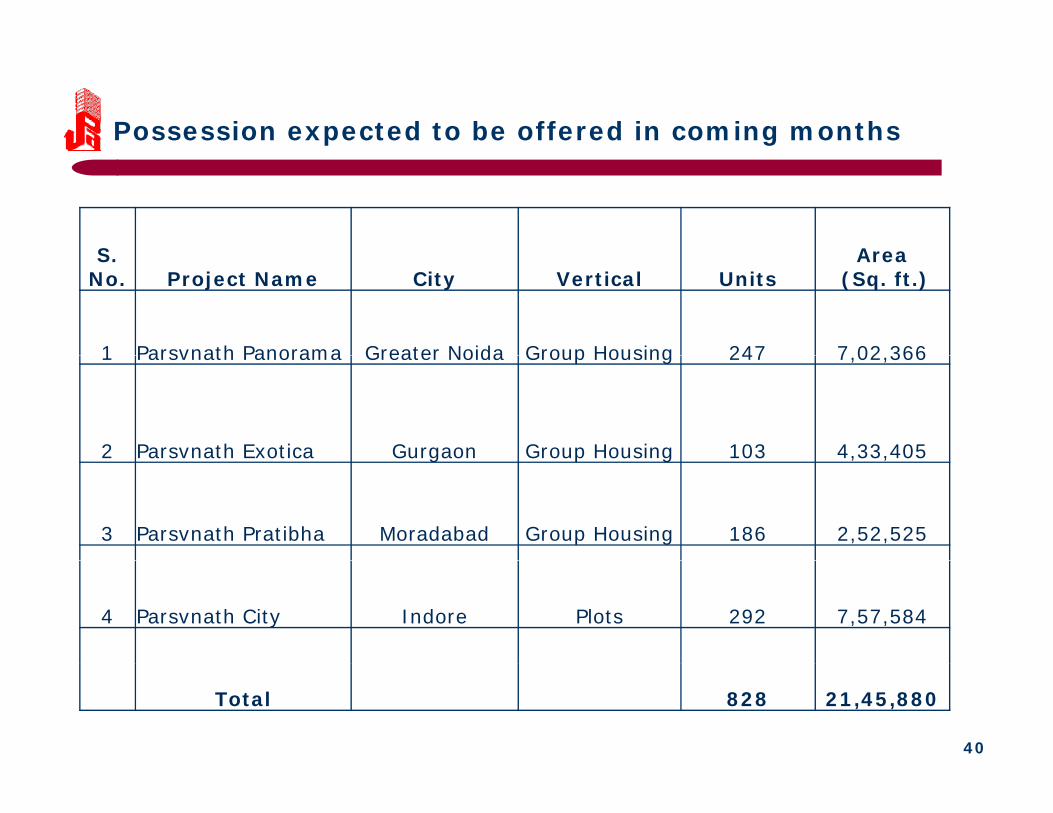
Possession expected to be offered in coming months
S AreaS. No. Project Name City Vertical Units
Area(Sq. ft.)
1 Parsvnath Panorama Greater Noida Group Housing 247 7 02 3661 Parsvnath Panorama Greater Noida Group Housing 247 7,02,366
2 Parsvnath Exotica Gurgaon Group Housing 103 4,33,4052 Parsvnath Exotica Gurgaon Group Housing 103 4,33,405
3 Parsvnath Pratibha Moradabad Group Housing 186 2,52,525
4 Parsvnath City Indore Plots 292 7,57,584
40
Total 828 21,45,880
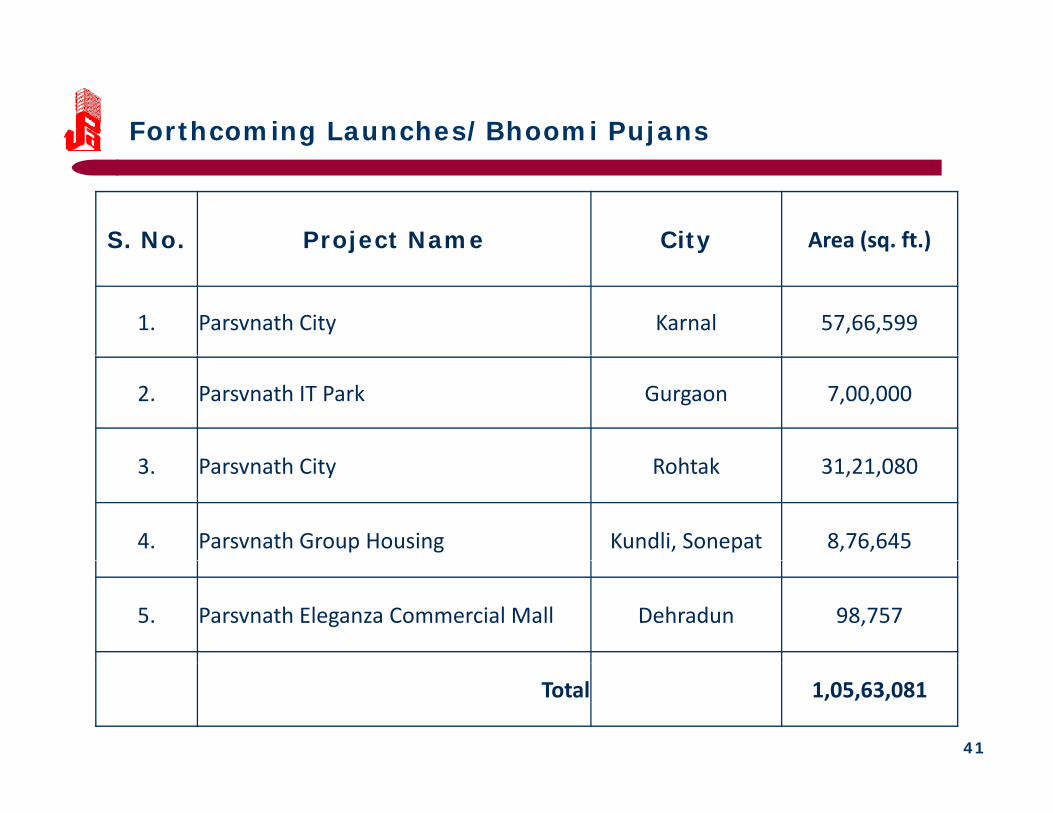
Forthcoming Launches/Bhoomi Pujans
S. No. Project Name City Area (sq. ft.)j
1. Parsvnath City Karnal 57,66,599
2. Parsvnath IT Park Gurgaon 7,00,000
h h k3. Parsvnath City Rohtak 31,21,080
4. Parsvnath Group Housing Kundli, Sonepat 8,76,645
5. Parsvnath Eleganza Commercial Mall Dehradun 98,757
41
Total 1,05,63,081
Key Prioritiesy
#1 Continue focus on Execution of Existing Projects#1 Continue focus on Execution of Existing Projects
#2 Continue focus on Affordable Housing#2 Continue focus on Affordable Housing
#3 Strengthening Balance Sheet & Deleveraging#3 Strengthening Balance Sheet & Deleveraging
4242
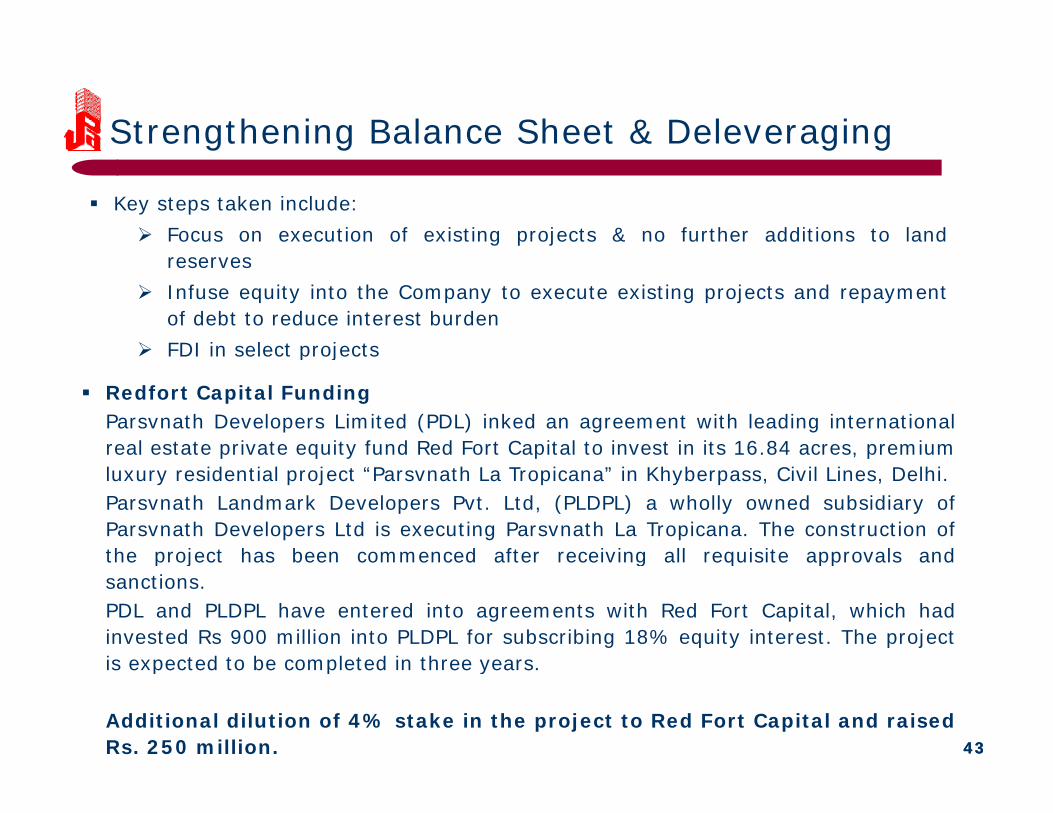
Strengthening Balance Sheet & Deleveragingg g g g
Key steps taken include:Focus on execution of existing projects & no further additions to landreservesInfuse equity into the Company to execute existing projects and repaymentof debt to reduce interest burdenFDI in select projectsFDI in select projects
Redfort Capital FundingParsvnath Developers Limited (PDL) inked an agreement with leading internationalreal estate private equity fund Red Fort Capital to invest in its 16.84 acres, premiump q y p , pluxury residential project “Parsvnath La Tropicana” in Khyberpass, Civil Lines, Delhi.Parsvnath Landmark Developers Pvt. Ltd, (PLDPL) a wholly owned subsidiary ofParsvnath Developers Ltd is executing Parsvnath La Tropicana. The construction ofthe project has been commenced after receiving all requisite approvals andthe project has been commenced after receiving all requisite approvals andsanctions.PDL and PLDPL have entered into agreements with Red Fort Capital, which hadinvested Rs 900 million into PLDPL for subscribing 18% equity interest. The projectis expected to be completed in three years
4343
is expected to be completed in three years.
Additional dilution of 4% stake in the project to Red Fort Capital and raisedRs. 250 million.

Strengthening Balance Sheet & Deleveraging(Cont….)g g g g
Redfort Capital Funding (Cont…)PDL has entered into another agreement with Red Fort Capital, which hadinvested Rs 1200 million for subscribing 24 5% equity interest in PDL Officeinvested Rs 1200 million for subscribing 24.5% equity interest in PDL OfficeComplex at Bhai Veer Singh Marg, Connaught Place, New Delhi.
Sun Apollo FundingInked an agreement with leading international real estate private equity fund SUN-Apollo, an international real estate private equity fund, for an investment in itspremium luxury residential project Parsvnath Exotica Part-II, Gurgaon. SUN-Apollowill invest Rs 750 million for a 50% stake in the project SPV which will developwill invest Rs 750 million for a 50% stake in the project SPV which will developParsvnath Exotica Part – II, Gurgaon.
• We are in the process of negotiating for Private Equity funding in some otherj t lprojects also.
• Funds raised through QIPPDL has allotted 1,38,56,272 shares and raised Rs. 168 Cr. through QIP route in
4444
, , , g QSeptember, 2009.Further allotted 1,90,38,113 shares and raised Rs. 270 Cr. through QIP route inOctober, 2010.
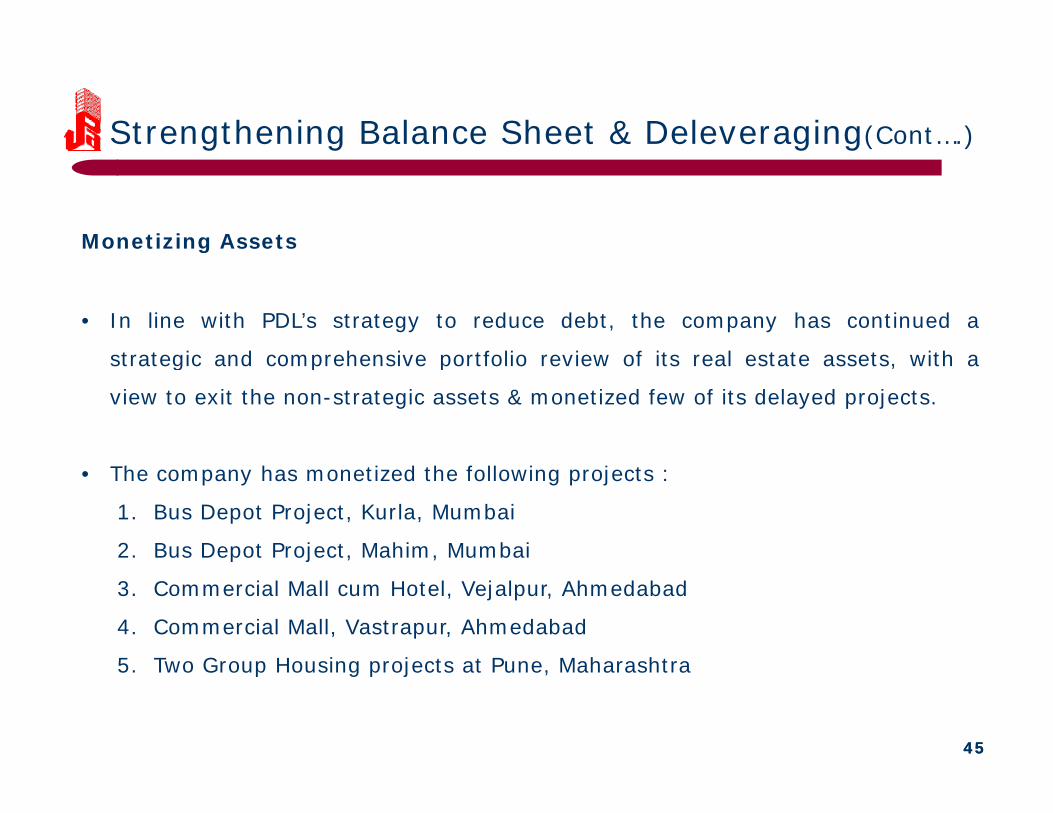
Strengthening Balance Sheet & Deleveraging(Cont….)g g g g
Monetizing Assetsg
• In line with PDL’s strategy to reduce debt, the company has continued a
strategic and comprehensive portfolio review of its real estate assets with astrategic and comprehensive portfolio review of its real estate assets, with a
view to exit the non-strategic assets & monetized few of its delayed projects.
• The company has monetized the following projects :
1. Bus Depot Project, Kurla, Mumbai
2. Bus Depot Project, Mahim, Mumbaip j , ,
3. Commercial Mall cum Hotel, Vejalpur, Ahmedabad
4. Commercial Mall, Vastrapur, Ahmedabad
5 Two Group Housing projects at Pune Maharashtra
4545
5. Two Group Housing projects at Pune, Maharashtra
Financial Overview
4646

Financial ResultsUNAUDITED FINANCIAL RESULTS FOR THE QUARTER / HALF-YEAR ENDED SEPTEMBER 30, 2010
(` In Lacs)Consolidated Standalone
Particulars Quarter ended Half-year ended Year ended Quarter ended Half-year ended Year ended30.09.2010 30.09.2009 30.09.2010 30.09.2009 31.03.2010 30.09.2010 30.09.2009 30.09.2010 30.09.2009 31.03.2010(Unaudited) (Unaudited) (Unaudited) (Unaudited) (Audited) (Unaudited) (Unaudited) (Unaudited) (Unaudited) (Audited)
1 Revenuea. Income from operations 19,553.04 16,846.95 44,832.35 28,219.90 94,073.50 15,102.02 14,758.52 32,046.92 25,484.48 77,114.42 b O h O i I 242 81 459 73 670 89 616 73 1 141 70 175 10 438 04 515 94 578 87 1 030 43 b. Other Operating Income 242.81 459.73 670.89 616.73 1,141.70 175.10 438.04 515.94 578.87 1,030.43 Total 19,795.85 17,306.68 45,503.24 28,836.63 95,215.20 15,277.12 15,196.56 32,562.86 26,063.35 78,144.85
2 Expenditurea. Cost of construction/development 7,146.58 10,163.39 23,869.07 15,652.23 61,726.78 8,422.45 9,173.53 21,001.87 14,215.61 48,382.64 b. Employees cost 768.37 806.00 1,548.81 1,622.57 3,171.94 739.95 793.15 1,507.38 1,594.55 3,116.38 c. Depreciation 399.18 540.17 793.71 1,069.20 2,148.67 396.09 536.22 787.52 1,061.50 2,132.93 d. Other expenditure 1,673.90 1,116.15 2,807.66 2,029.75 4,126.25 1,305.74 840.13 2,173.79 1,570.27 3,314.82 Total 9,988.03 12,625.71 29,019.25 20,373.75 71,173.64 10,864.23 11,343.03 25,470.56 18,441.93 56,946.77
3 Profit from Operations before Other Income,
Interest & Exceptional Items (1 - 2) 9,807.82 4,680.97 16,483.99 8,462.88 24,041.56 4,412.89 3,853.53 7,092.30 7,621.42 21,198.08 4 Oth I 301 02 2 769 59 523 22 3 106 51 3 603 00 277 59 2 761 96 493 58 3 097 11 3 572 71 4 Other Income 301.02 2,769.59 523.22 3,106.51 3,603.00 277.59 2,761.96 493.58 3,097.11 3,572.71 5 Profit before Interest & Exceptional
Items (3 + 4) 10,108.84 7,450.56 17,007.21 11,569.39 27,644.56 4,690.48 6,615.49 7,585.88 10,718.53 24,770.79 6 Interest 1,523.18 1,857.49 3,061.70 3,762.65 8,025.49 1,481.93 1,797.66 2,993.30 3,690.94 7,892.76 7 Profit after Interest but before Exceptional
Items (5 - 6) 8,585.66 5,593.07 13,945.51 7,806.74 19,619.07 3,208.55 4,817.83 4,592.58 7,027.59 16,878.03 8 Exceptional Items - - - - - - - - - -
9 Profit from Ordinary Activities before tax (7 + 8)8,585.66 5,593.07 13,945.51 7,806.74 19,619.07 3,208.55 4,817.83 4,592.58 7,027.59 16,878.03
10 Tax expense 2,794.94 (607.66) 4,141.77 224.80 5,558.00 950.99 (897.12) 1,273.08 (80.11) 3,492.94
11 Net Profit from Ordinary Activities aftertax (9 - 10) 5,790.72 6,200.73 9,803.74 7,581.94 14,061.07 2,257.56 5,714.95 3,319.50 7,107.70 13,385.09
12 Extraordinary Items - - - - - - - - - -13 Minority Interest in Net Profit of Subsidiaries 813.46 57.90 1,644.23 57.84 574.69 - - - - -14 Net Profit [(11) - (12+13)] 4,977.26 6,142.83 8,159.51 7,524.10 13,486.38 2,257.56 5,714.95 3,319.50 7,107.70 13,385.09
15 Paid-up Equity Share Capital 19,855.25 18,469.62 19,855.25 18,469.62 19,855.25 19,855.25 18,469.62 19,855.25 18,469.62 19,855.25 (Face value ` 10 each)
16 Reserves (excluding revaluation reserves) 209,357.69 201,891.49 17 Earnings per Share - Basic & Diluted
(not annualised)a. Before Extraordinary items (`) 2.51 3.33 4.11 4.07 7.05 1.14 3.09 1.67 3.85 6.99 b After Extraordinary items (`) 2 51 3 33 4 11 4 07 7 05 1 14 3 09 1 67 3 85 6 99 b. After Extraordinary items ( ) 2.51 3.33 4.11 4.07 7.05 1.14 3.09 1.67 3.85 6.99
18 Debt Service Coverage Ratio 0.52 0.64 0.58 0.32 0.65 0.56 19 Interest Service Coverage Ratio 2.56 1.83 2.00 1.64 1.82 1.96
20 Public Shareholding a. Number of shares 50,182,072 36,325,800 50,182,072 36,325,800 50,182,072 50,182,072 36,325,800 50,182,072 36,325,800 50,182,072 b. Percentage of shareholding 25.27 19.67 25.27 19.67 25.27 25.27 19.67 25.27 19.67 25.27
21 Promoters and promoter group Shareholding
a. Pledged/Encumbered - No. of shares 121,508,887 120,092,803 121,508,887 120,092,803 123,314,075 121,508,887 120,092,803 121,508,887 120,092,803 123,314,075
P t f h ( % f th t t l
47
- Percentage of shares (as a % of the totalshareholding of promoter and promoter group)
81.90 80.94 81.90 80.94 83.11 81.90 80.94 81.90 80.94 83.11 - Percentage of shares (as a % of the total
share capital of the company) 61.20 65.02 61.20 65.02 62.11 61.20 65.02 61.20 65.02 62.11 b. Non-encumbered
- No. of shares 26,861,513 28,277,597 26,861,513 28,277,597 25,056,325 26,861,513 28,277,597 26,861,513 28,277,597 25,056,325 - Percentage of shares (as a % of the total
shareholding of promoter and promoter group)18.10 19.06 18.10 19.06 16.89 18.10 19.06 18.10 19.06 16.89
- Percentage of shares (as a % of the totalshare capital of the company) 13.53 15.31 13.53 15.31 12.62 13.53 15.31 13.53 15.31 12.62
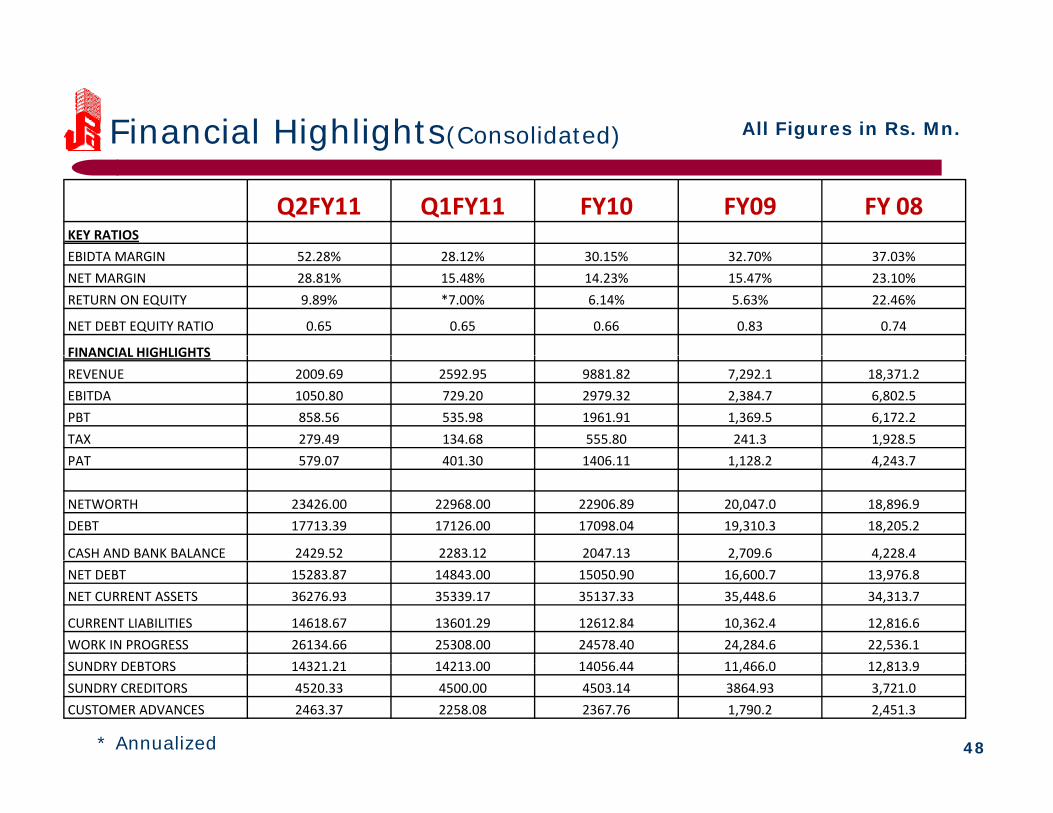
Financial Highlights(Consolidated) All Figures in Rs. Mn.g g
Q2FY11 Q1FY11 FY10 FY09 FY 08KEY RATIOSEBIDTA MARGIN 52 28% 28 12% 30 15% 32 70% 37 03%EBIDTA MARGIN 52.28% 28.12% 30.15% 32.70% 37.03%NET MARGIN 28.81% 15.48% 14.23% 15.47% 23.10%RETURN ON EQUITY 9.89% *7.00% 6.14% 5.63% 22.46%
NET DEBT EQUITY RATIO 0.65 0.65 0.66 0.83 0.74
FINANCIAL HIGHLIGHTSFINANCIAL HIGHLIGHTSREVENUE 2009.69 2592.95 9881.82 7,292.1 18,371.2EBITDA 1050.80 729.20 2979.32 2,384.7 6,802.5PBT 858.56 535.98 1961.91 1,369.5 6,172.2TAX 279.49 134.68 555.80 241.3 1,928.5PAT 579 07 401 30 1406 11 1 128 2 4 243 7PAT 579.07 401.30 1406.11 1,128.2 4,243.7
NETWORTH 23426.00 22968.00 22906.89 20,047.0 18,896.9DEBT 17713.39 17126.00 17098.04 19,310.3 18,205.2
CASH AND BANK BALANCE 2429.52 2283.12 2047.13 2,709.6 4,228.4NET DEBT 15283.87 14843.00 15050.90 16,600.7 13,976.8NET CURRENT ASSETS 36276.93 35339.17 35137.33 35,448.6 34,313.7
CURRENT LIABILITIES 14618.67 13601.29 12612.84 10,362.4 12,816.6WORK IN PROGRESS 26134.66 25308.00 24578.40 24,284.6 22,536.1SUNDRY DEBTORS 14321 21 14213 00 14056 44 11 466 0 12 813 9
48
SUNDRY DEBTORS 14321.21 14213.00 14056.44 11,466.0 12,813.9SUNDRY CREDITORS 4520.33 4500.00 4503.14 3864.93 3,721.0CUSTOMER ADVANCES 2463.37 2258.08 2367.76 1,790.2 2,451.3
* Annualized
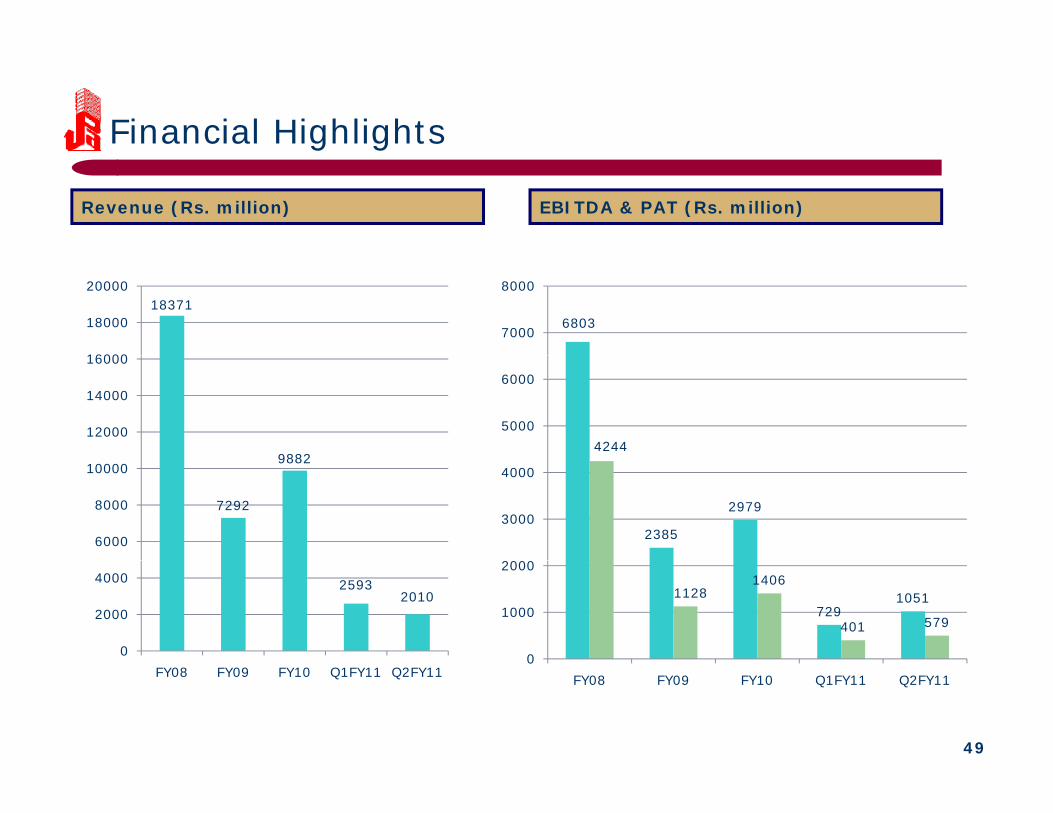
Financial Highlightsg g
Revenue (Rs. million) EBITDA & PAT (Rs. million)
18371
16000
18000
20000
68037000
8000
9882
12000
14000
16000
42445000
6000
7292
9882
6000
8000
10000
2385
2979
2000
3000
4000
25932010
0
2000
4000
72910511128
1406
401 579
0
1000
2000
49
FY08 FY09 FY10 Q1FY11 Q2FY110
FY08 FY09 FY10 Q1FY11 Q2FY11
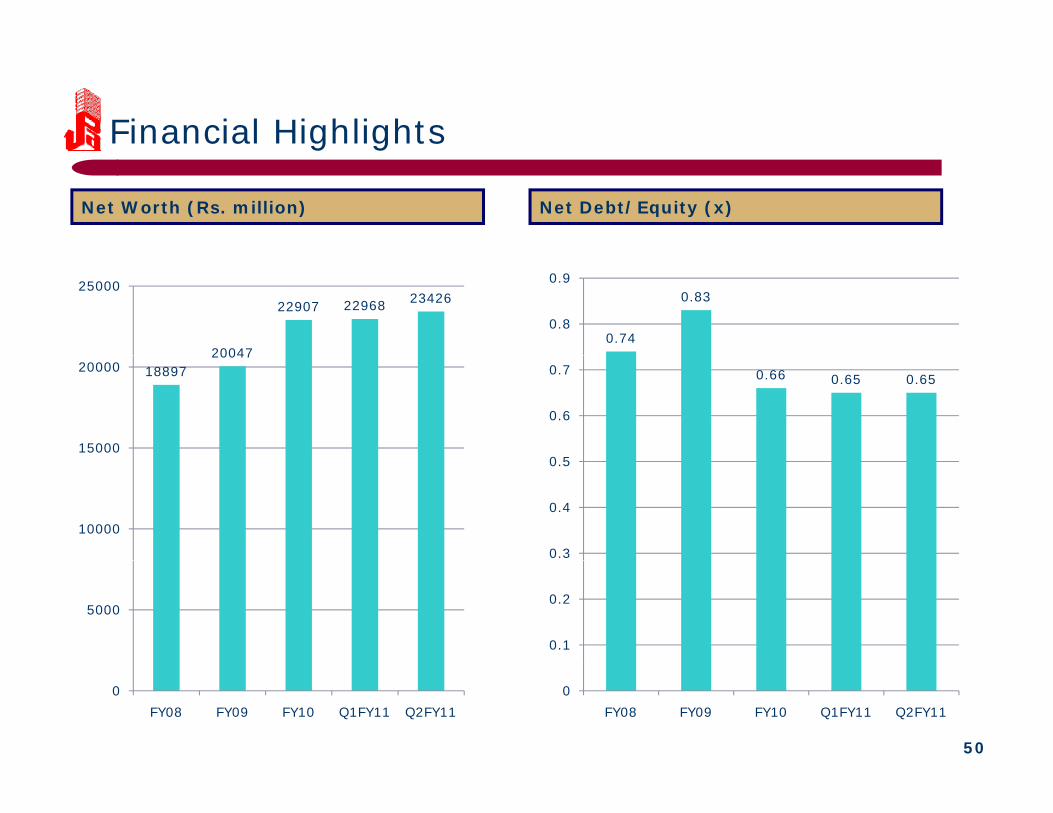
Financial Highlightsg g
Net Worth (Rs. million) Net Debt/Equity (x)
20047
22907 22968 2342625000
0.74
0.83
0.8
0.9
1889720047
15000
20000 0.66 0.65 0.65
0 5
0.6
0.7
10000
0.3
0.4
0.5
5000
0.1
0.2
50
0FY08 FY09 FY10 Q1FY11 Q2FY11
0FY08 FY09 FY10 Q1FY11 Q2FY11
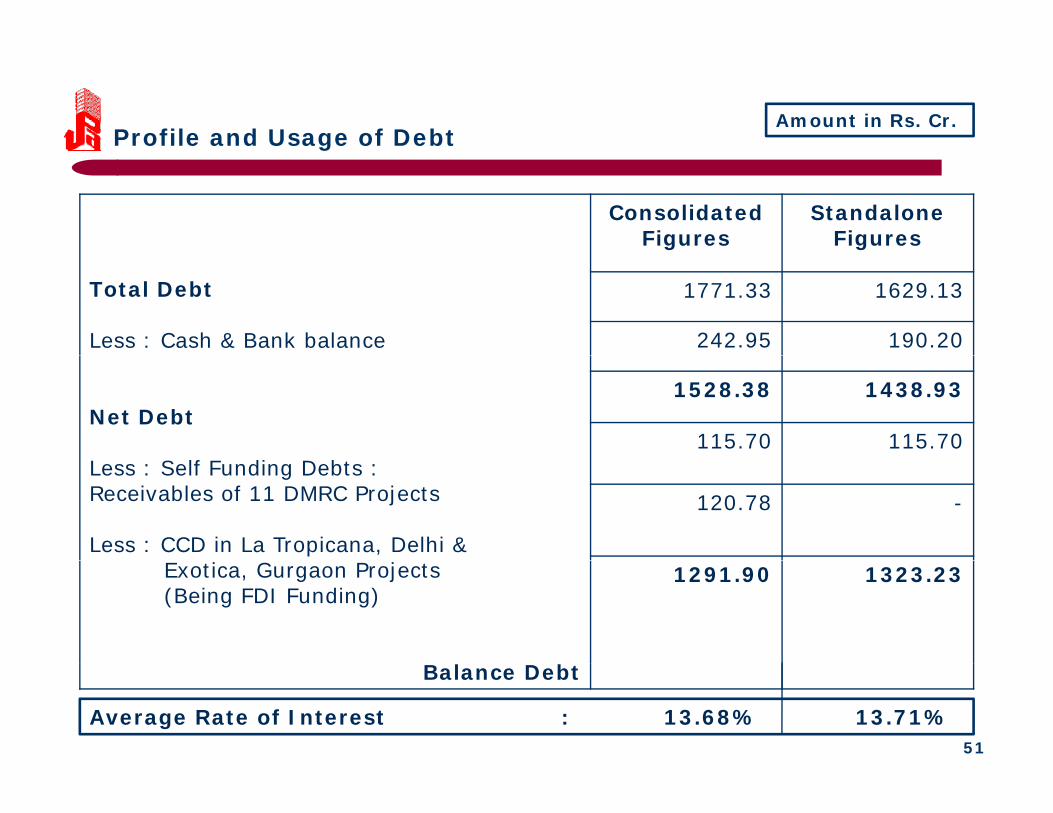
Profile and Usage of DebtAmount in Rs. Cr.
g
Consolidated Figures
Standalone Figures
Total Debt
Less : Cash & Bank balance
1771.33 1629.13
242.95 190.20
Net Debt1528.38 1438.93
115.70 115.70Less : Self Funding Debts : Receivables of 11 DMRC Projects
Less : CCD in La Tropicana, Delhi &
120.78 -
Exotica, Gurgaon Projects(Being FDI Funding)
1291.90 1323.23
51
Average Rate of Interest : 13.68% 13.71%
Balance Debt
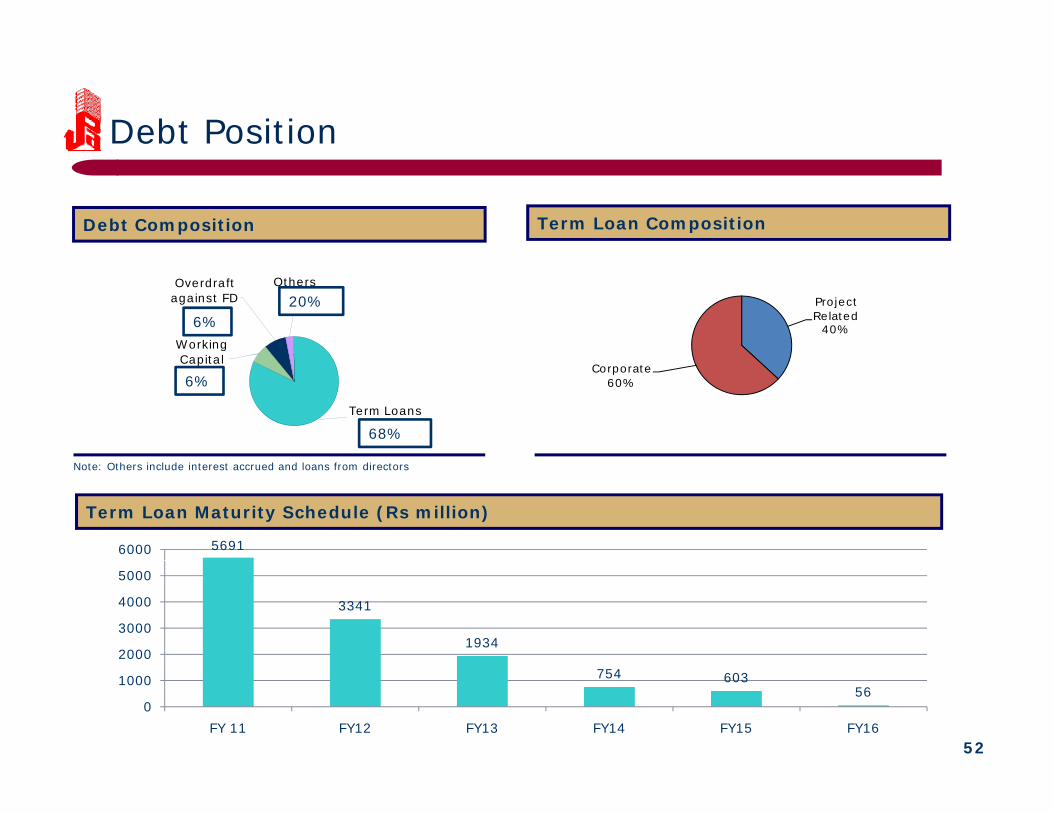
Debt Position
Debt Composition Term Loan Composition
Overdraft against FD
8%
Others3%
Working C it l
Project Related
40%
20%6%
Term Loans82%
Capital7% Corporate
60%6%
68%
Term Loan Maturity Schedule (Rs million)
Note: Others include interest accrued and loans from directors
56916000
3341
19342000
3000
4000
5000
52
754 60356
0
1000
FY 11 FY12 FY13 FY14 FY15 FY16

Thank You Thank You
53