Embed Size (px)
Citation preview
Invoicing currency, firm
size and hedging
EFIGE working paper 49
July 2012
Julien Martin and Isabelle Méjean
EFIGE IS A PROJECT DESIGNED TO HELP IDENTIFY THE INTERNAL POLICIES NEEDED TO IMPROVE EUROPE’S EXTERNAL COMPETITIVENESS
Funded under the
Socio-economic
Sciences and
Humanities
Programme of the
Seventh
Framework
Programme of the
European Union.
LEGAL NOTICE: The
research leading to these
results has received
funding from the
European Community's
Seventh Framework
Programme (FP7/2007-
2013) under grant
agreement n° 225551.
The views expressed in
this publication are the
sole responsibility of the
authors and do not
necessarily reflect the
views of the European
Commission.
The EFIGE project is coordinated by Bruegel and involves the following partner organisations: Universidad Carlos III
de Madrid, Centre for Economic Policy Research (CEPR), Institute of Economics Hungarian Academy of Sciences
(IEHAS), Institut für Angewandte Wirtschafts-forschung (IAW), Centro Studi Luca D'Agliano (Ld’A), Unitcredit Group,
Centre d’Etudes Prospectives et d’Informations Internationales (CEPII).
The EFIGE partners also work together with the following associate partners: Banque de France, Banco de España,
Banca d’Italia, Deutsche Bundesbank, National Bank of Belgium, OECD Economics Department.
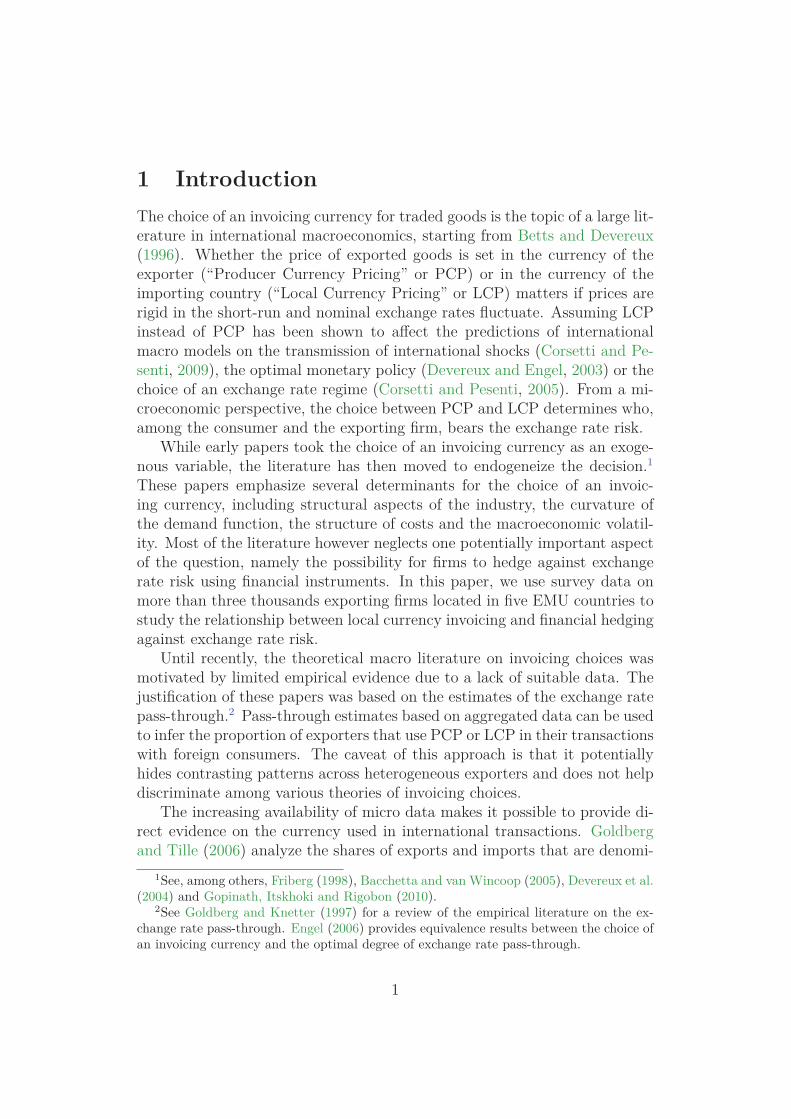
Invoicing Currency, Firm Size, and Hedging∗
Julien Martin1 and Isabelle Méjean2
1IRES - Université catholique de Louvain, Belgium2Ecole Polytechnique, CREST and CEPR, France
July 2012
AbstractWe use the results of a survey conducted on a sample of 3,013 export-ing firms located in 5 EMU countries to explore the link between theinvoicing currency of exports, firm size, and hedging. About 90% offirms in the sample invoice exports in their (producer) currency. Largefirms are more likely to use another currency. The aggregate use ofthe euro is thus 15 percentage points lower when firms are weightedby their size than for the average firm. This heterogenity is robustto controlling for determinants of the invoicing choice stressed by theliterature. We however show that large firms and firms pricing inanother currency as the euro are also more likely to hedge against ex-change rate risk. An IV estimation shows the causal impact of accessto hedging on the choice of the invoicing currency. We find (large)firms having access to hedging being more likely to invoice in the im-porter’s currency.
Keywords: PCP, LCP, Pass-through, firm-level dataJEL classification: F31, F41, G32
∗We wish to thank Tommaso Aquilante for his help with the data. This researchhas received funding from the European Community Seventh Framework Programme(FP7/2007-2013) under grant agreement no 225551. Julien Martin acknowledges financialsupport from the FSR Marie Curie fellowship, and the ARC convention on "Geographicalmobility of factors".
0
1 IntroductionThe choice of an invoicing currency for traded goods is the topic of a large lit-erature in international macroeconomics, starting from Betts and Devereux(1996). Whether the price of exported goods is set in the currency of theexporter (“Producer Currency Pricing” or PCP) or in the currency of theimporting country (“Local Currency Pricing” or LCP) matters if prices arerigid in the short-run and nominal exchange rates fluctuate. Assuming LCPinstead of PCP has been shown to affect the predictions of internationalmacro models on the transmission of international shocks (Corsetti and Pe-senti, 2009), the optimal monetary policy (Devereux and Engel, 2003) or thechoice of an exchange rate regime (Corsetti and Pesenti, 2005). From a mi-croeconomic perspective, the choice between PCP and LCP determines who,among the consumer and the exporting firm, bears the exchange rate risk.
While early papers took the choice of an invoicing currency as an exoge-nous variable, the literature has then moved to endogeneize the decision.1These papers emphasize several determinants for the choice of an invoic-ing currency, including structural aspects of the industry, the curvature ofthe demand function, the structure of costs and the macroeconomic volatil-ity. Most of the literature however neglects one potentially important aspectof the question, namely the possibility for firms to hedge against exchangerate risk using financial instruments. In this paper, we use survey data onmore than three thousands exporting firms located in five EMU countries tostudy the relationship between local currency invoicing and financial hedgingagainst exchange rate risk.
Until recently, the theoretical macro literature on invoicing choices wasmotivated by limited empirical evidence due to a lack of suitable data. Thejustification of these papers was based on the estimates of the exchange ratepass-through.2 Pass-through estimates based on aggregated data can be usedto infer the proportion of exporters that use PCP or LCP in their transactionswith foreign consumers. The caveat of this approach is that it potentiallyhides contrasting patterns across heterogeneous exporters and does not helpdiscriminate among various theories of invoicing choices.
The increasing availability of micro data makes it possible to provide di-rect evidence on the currency used in international transactions. Goldbergand Tille (2006) analyze the shares of exports and imports that are denomi-
1See, among others, Friberg (1998), Bacchetta and van Wincoop (2005), Devereux et al.(2004) and Gopinath, Itskhoki and Rigobon (2010).
2See Goldberg and Knetter (1997) for a review of the empirical literature on the ex-change rate pass-through. Engel (2006) provides equivalence results between the choice ofan invoicing currency and the optimal degree of exchange rate pass-through.
1
nated in the own currency or U.S. dollars for a cross-section of 24 countries.They show the wide spread use of the U.S. dollar as a vehicle currency andfor denominating trade in goods where firms have little price setting power.Goldberg and Tille (2009) use even more disaggregated transaction data onCanadian imports. They show that LCP is more frequent for larger trans-actions. Their interpretation of the result is that consumers buying a largervolume of goods have more bargaining power in the determination of theinvoicing currency. This is consistent with Friberg and Wilander (2008) whouse a survey on a representative sample of Swedish exporters and show thatthe invoicing currency is predominantly set through a negotiation betweenthe exporter and the consumer. Finally, Gopinath et al. (2010) use BLS datato study the frequency of price adjustment in U.S. imports and the relation-ship to the currency of invoicing. They show a link between the choice ofan invoicing currency and the optimal degree of pass-through chosen by thefirm conditional on price adjustment.
In this paper, we use the results of a survey conducted on a sample of3,013 exporting firms located in 5 EMU countries (Austria, France, Germany,Italy and Spain). Among many questions on the firm, her structure, her sizein terms of employment and turnover, the geographical distribution of herexports, etc., the survey provides information about the currency used bythe firm in international transactions. In the data, the use of the euro intransactions with foreign partners is prevalent. More than 90% of firmsdeclare using the euro for exports. This proportion is large in comparisonwith previous studies of the currency denomination of EMU exports thatfind that about 70% of the value of EMU exports are invoiced in euro.3The proportion however decreases once firms in the sample are weighted bytheir size. This means that large firms have a higher propensity to use thelocal currency of the destination country to price their exports. This result,together with the well-documented prevalence of large firms in internationaltrade (Bernard et al., 2011), explains why aggregate results on the role of theeuro as an invoicing currency for EMU exports display a lower proportion ofeuro priced exports than what we obtain using simple averages across firms.
We discuss the robustness of this finding to controlling for the geograph-ical composition of exports, the industry the firm belongs to and the nation-ality of her competitors. In the theoretical and empirical literatures, thesedimensions have been shown important to explain the choice of an invoicingcurrency. Firms mainly exporting in developing countries are expected toprice in PCP while exports to the US or other large industrialized countries
3See Kamps (2006) or the ECB (2011) annual report on the internationalization of theeuro.
2
are more likely to be priced in LCP. Likewise, certain sectors, as the oil indus-try and a lot of agricultural markets, are well-known to over-use the dollarin international markets, whatever the nationality of the exporter. Finally,firms should be more likely to choose a LCP strategy when their competitoris located in a foreign country and is not affected by fluctuations in the bi-lateral exchange rate between the exporter’s and the destination countries.Would large firms have a higher tendency to export in more remote coun-tries, to be concentrated in some specific sectors or to compete with firmslocated in countries using a different currency, one could explain the linkbetween a firm’s size and her propensity to adopt LCP strategies by suchindirect determinants of currency choices. However, we show that the higherpropensity of large firms to price in local currency is robust to controlling forsuch determinants.
We then investigate another aspect of the way firms manage their ex-change rate exposure, namely the possibility to use financial instrumentsto hedge against exchange rate risk.4 This dimension is potentially impor-tant since financial hedging can be considered as a substitute to pricing inPCP. Under LCP, the firm bears the exchange rate risk in order to stabilizeprices in the destination market whatever the behavior of exchange rates. Incomparison with a PCP strategy, this protects her from the risk of loosingcompetitiveness in the destination country in case of detrimental exchangerate fluctuations. However, this induces an uncertainty on her margin ifthere exists a delay between the invoicing decision and the time the pay-ment is proceeded. To reduce this source of uncertainty, the firm can usefinancial instruments to hedge against the exchange rate risk. In that sense,LCP and financial hedging can be considered as complementary in the firm’smanagement of exchange rate risks.
In our data, firms are questionned about their use of instruments suchas derivatives or trade insurances, that can eventually include a protectionagainst exchange rate risk. We use this information to investigate the po-tential complementarity between hedging and LCP. Our probit estimationsshow that it is indeed the case that firms using financial hedging are morelikely to price in foreign currency, even once other standard determinants ofinvoicing are controlled for. Since this relationship may be biased by reversecausality, namely firms chosing to hedge because they are forced to pricein LCP, we instrument the use of financial hedging by various exogenousvariables and find that the relationship between LCP and hedging is even
4Dohring (2008) also considers the hedging and invoicing strategies jointly. However,his data do not let him test for a statistical relationship between hedging and invoicingdecisions.
3
stronger once endogeneity is controlled for. This result is interesting from amicroeconomic point-of-view. LCP is usually interpreted as a transmissionof the exchange rate risk from the consumer to the exporting firm. The re-sult that LCP firms are also more likely to hedge using financial instrumentsmeans that the exchange rate risk is in fact borne by financial markets andthus diversified more efficiently than at the individual level.
While studying the joint behavior of hedging and LCP invoicing in thedata, we show that both are correlated with the size of the firm: Large firmsare more likely to invoice exports in local currency and to hedge against ex-change rate risk. The first relationship is consistent with Goldberg and Tille(2009) who explain the link in terms of bargaining power in the choice of aninvoicing currency. The size-hedging link is consistent with Dohring (2008),who explains it by hedging involving a fixed cost that large firms are morelikely to be willing to pay. In our data, when we control for the instrumentedhedging variable, the impact of the firm’s size on the probability to adopta LCP strategy decreases. This result offers an alternative explanation forthe size-LCP invoicing relationship found in the literature. Namely, it sug-gests that large firms have better access to financial hedging, which lets themadopt LCP strategies without bearing the exchange rate risk.
Last, the paper is connected to the recent literature on firm heterogeneityand pass-through. Berman et al. (2011) show that large French exporters in-crease more their markups after an appreciation of their currency. They findsuch heterogenity within sector, for exports to a given destination. Theypropose several explanations consistent with this fact. All are related tothe curvature of the demand function which turns out to be heterogenousbecause small and large firms have different market powers or react differ-ently to (additive) distribution costs. Our paper suggests a complementaryexplanation for heterogenity in pass-through, namely the heterogeneity ininvoicing currency. If their prices are set in local currency, large firms haveno incentive to adjust consumer prices to ER fluctuations. Since their pricesin local curency are fixed, their markups adjust one to one to ER changes.In contrast, small firms, pricing in producer currency, have less incentives toadjust perfectly their markups.5
The rest of the paper is organized as follows. Section 2 presents our dataand the way we selectionned our sample. In section 3, we present a number ofstylized facts on invoicing and hedging choices. Section 4 then uses a probit
5This result suggests that large firms have more volatile markups and thus face moreuncertainty. However, we show that large firms are able to hedge against ER risk. Instead,such strategy (LCP + hedging) limits two types of risk. First, it dampens the risk to losecompetitiveness in the foreign market due ER changes. Second, the hedging dampens therisk linked to markups fluctuations.
4
framework to study the determinants of local currency invoicing. Besidesstandard determinants, we test for the impact of hedging on LCP invoicingin an IV regression. Finally, Section 5 discusses the aggregate implicationsof our findings.
2 DataThe dataset used in our empirical analysis is based on a survey collectedwithin the European Firms in a Global Economy (EFIGE) project. Thedatabase consists of a representative sample of about 15,000 firms of morethan 10 employees from 7 countries (Austria, France, Germany, Hungary,Italy, Spain, and UK). This survey provides detailed information on thestructure of the firms, their workforce, market and pricing, their interna-tionalization, as well as information on investment and innovation. Most ofquestions concern the firm’s activity during the year 2008.
The questionnaire includes more than 150 items. The firm characteristicsused in this paper are the followings. For each firm, we know the 4-digitindustry classification, the ownership structure, the turnover, the share offoreign markets in total sales, the number of destination markets, and thedistribution of exports across 8 areas (EU15, rest of EU, non EU Europeancountries, China and India, other Asian countries, USA and Canada, rest ofAmerica, and rest of the world). One question is devoted to the currencydenomination of exports. To refine our analysis, we further use items con-cerning the financial and non financial hedging of firms against exchange rateflucatuations, their pricing strategy, and the structure of the market in whichthey operate. Details on these variables are provided in Tables 1 and 2.
There are 14,911 firms in the initial database. However, we do not usethe entire sample of firms for our analysis. First, firms that declare thatthey do not export, or report a value of exports of 0 euro, or a number ofdestinations of 0 are dropped. We further delete 103 firms with inconsistentresponses (share of exports greater than 100 for instance). Firms that donot reply to the question on invoicing currency are also dropped. Finally, wefocus on euro countries and drop observations for UK and Hungary. Withthis triming we keep 6,278 observations.
Firms are asked how they deal with exchange rate (ER) risk. A possibleanswer is that the question is not applicable, as the firm only sells to countrieswith the same currency as her domestic market. We classify these firms asfacing no ER risk. Figure 1 shows the share of firms exposed to exchange riskmovements. Statistics are weighted by the probability to be in the sample(first bar) and by the probability to be in the sample multiplied by firm
5
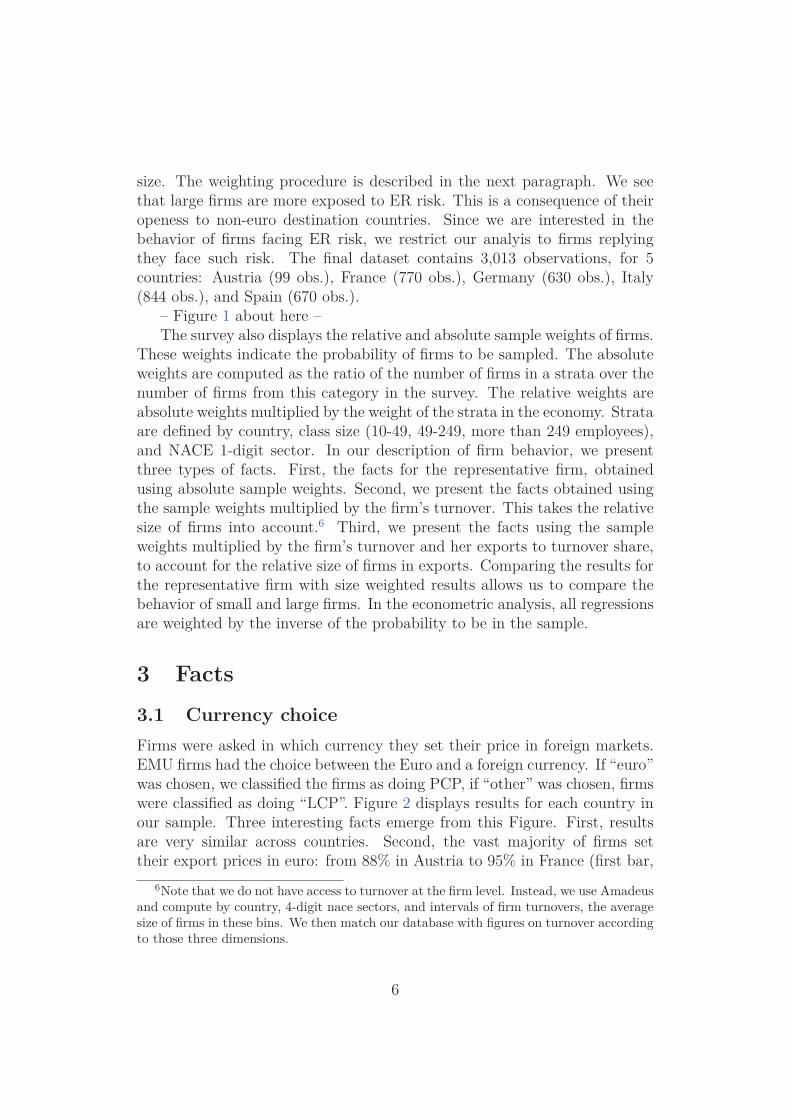
size. The weighting procedure is described in the next paragraph. We seethat large firms are more exposed to ER risk. This is a consequence of theiropeness to non-euro destination countries. Since we are interested in thebehavior of firms facing ER risk, we restrict our analyis to firms replyingthey face such risk. The final dataset contains 3,013 observations, for 5countries: Austria (99 obs.), France (770 obs.), Germany (630 obs.), Italy(844 obs.), and Spain (670 obs.).
– Figure 1 about here –The survey also displays the relative and absolute sample weights of firms.
These weights indicate the probability of firms to be sampled. The absoluteweights are computed as the ratio of the number of firms in a strata over thenumber of firms from this category in the survey. The relative weights areabsolute weights multiplied by the weight of the strata in the economy. Strataare defined by country, class size (10-49, 49-249, more than 249 employees),and NACE 1-digit sector. In our description of firm behavior, we presentthree types of facts. First, the facts for the representative firm, obtainedusing absolute sample weights. Second, we present the facts obtained usingthe sample weights multiplied by the firm’s turnover. This takes the relativesize of firms into account.6 Third, we present the facts using the sampleweights multiplied by the firm’s turnover and her exports to turnover share,to account for the relative size of firms in exports. Comparing the results forthe representative firm with size weighted results allows us to compare thebehavior of small and large firms. In the econometric analysis, all regressionsare weighted by the inverse of the probability to be in the sample.
3 Facts3.1 Currency choiceFirms were asked in which currency they set their price in foreign markets.EMU firms had the choice between the Euro and a foreign currency. If “euro”was chosen, we classified the firms as doing PCP, if “other” was chosen, firmswere classified as doing “LCP”. Figure 2 displays results for each country inour sample. Three interesting facts emerge from this Figure. First, resultsare very similar across countries. Second, the vast majority of firms settheir export prices in euro: from 88% in Austria to 95% in France (first bar,
6Note that we do not have access to turnover at the firm level. Instead, we use Amadeusand compute by country, 4-digit nace sectors, and intervals of firm turnovers, the averagesize of firms in these bins. We then match our database with figures on turnover accordingto those three dimensions.
6
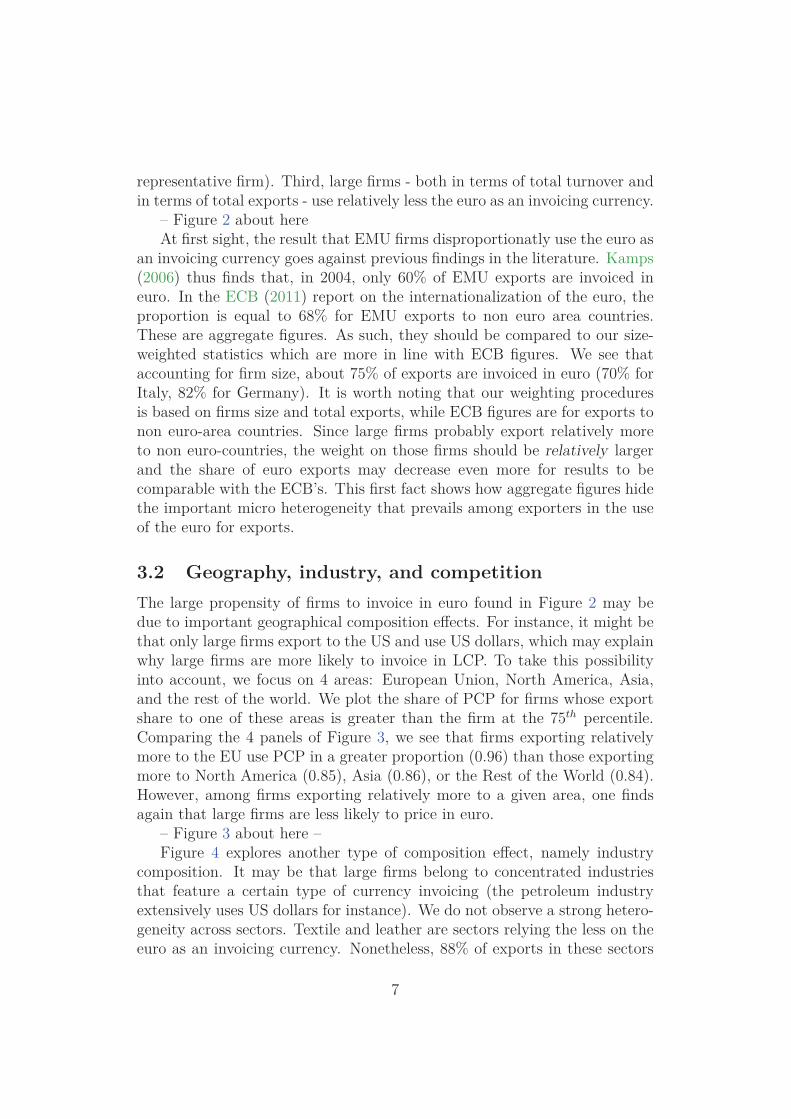
representative firm). Third, large firms - both in terms of total turnover andin terms of total exports - use relatively less the euro as an invoicing currency.
– Figure 2 about hereAt first sight, the result that EMU firms disproportionatly use the euro as
an invoicing currency goes against previous findings in the literature. Kamps(2006) thus finds that, in 2004, only 60% of EMU exports are invoiced ineuro. In the ECB (2011) report on the internationalization of the euro, theproportion is equal to 68% for EMU exports to non euro area countries.These are aggregate figures. As such, they should be compared to our size-weighted statistics which are more in line with ECB figures. We see thataccounting for firm size, about 75% of exports are invoiced in euro (70% forItaly, 82% for Germany). It is worth noting that our weighting proceduresis based on firms size and total exports, while ECB figures are for exports tonon euro-area countries. Since large firms probably export relatively moreto non euro-countries, the weight on those firms should be relatively largerand the share of euro exports may decrease even more for results to becomparable with the ECB’s. This first fact shows how aggregate figures hidethe important micro heterogeneity that prevails among exporters in the useof the euro for exports.
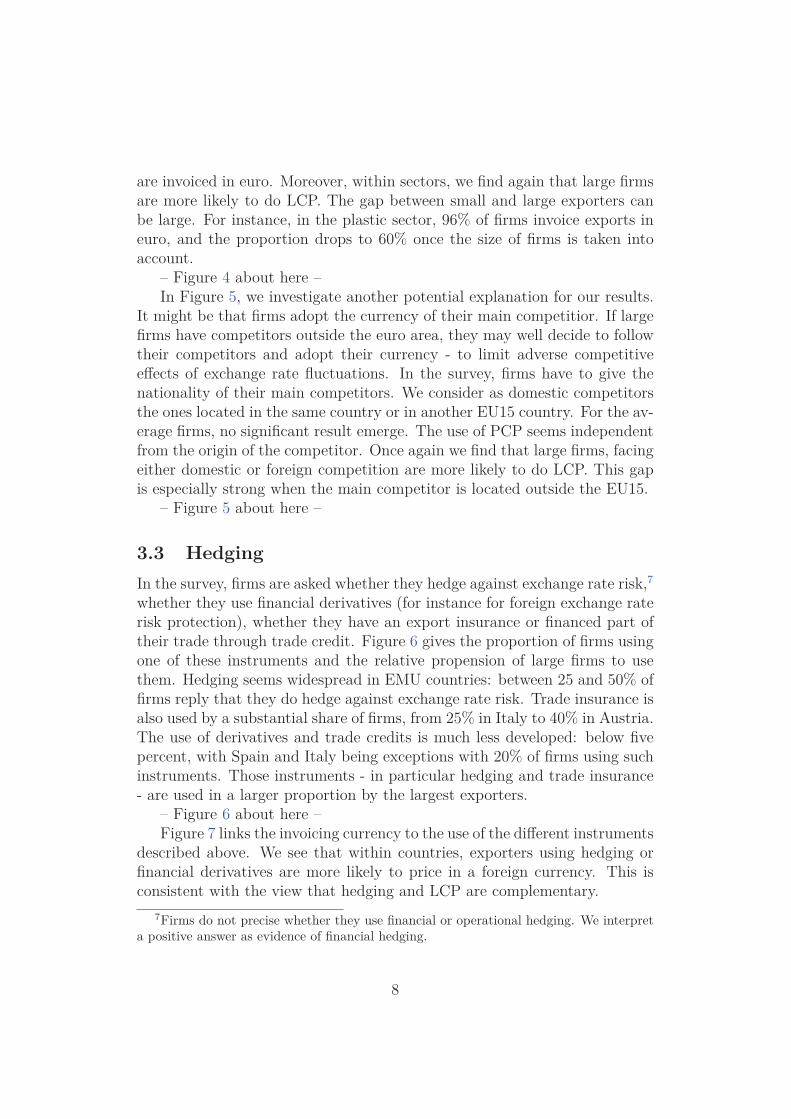
3.2 Geography, industry, and competitionThe large propensity of firms to invoice in euro found in Figure 2 may bedue to important geographical composition effects. For instance, it might bethat only large firms export to the US and use US dollars, which may explainwhy large firms are more likely to invoice in LCP. To take this possibilityinto account, we focus on 4 areas: European Union, North America, Asia,and the rest of the world. We plot the share of PCP for firms whose exportshare to one of these areas is greater than the firm at the 75th percentile.Comparing the 4 panels of Figure 3, we see that firms exporting relativelymore to the EU use PCP in a greater proportion (0.96) than those exportingmore to North America (0.85), Asia (0.86), or the Rest of the World (0.84).However, among firms exporting relatively more to a given area, one findsagain that large firms are less likely to price in euro.
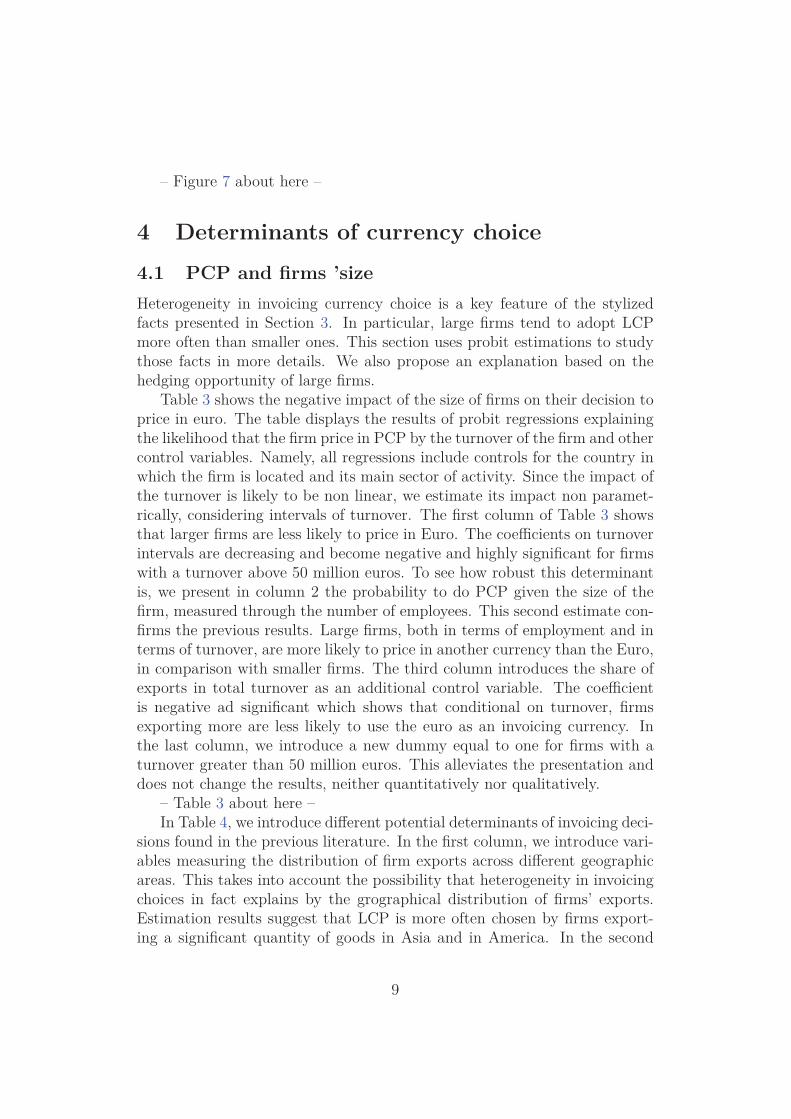
– Figure 3 about here –Figure 4 explores another type of composition effect, namely industry
composition. It may be that large firms belong to concentrated industriesthat feature a certain type of currency invoicing (the petroleum industryextensively uses US dollars for instance). We do not observe a strong hetero-geneity across sectors. Textile and leather are sectors relying the less on theeuro as an invoicing currency. Nonetheless, 88% of exports in these sectors
7
are invoiced in euro. Moreover, within sectors, we find again that large firmsare more likely to do LCP. The gap between small and large exporters canbe large. For instance, in the plastic sector, 96% of firms invoice exports ineuro, and the proportion drops to 60% once the size of firms is taken intoaccount.
– Figure 4 about here –In Figure 5, we investigate another potential explanation for our results.
It might be that firms adopt the currency of their main competitior. If largefirms have competitors outside the euro area, they may well decide to followtheir competitors and adopt their currency - to limit adverse competitiveeffects of exchange rate fluctuations. In the survey, firms have to give thenationality of their main competitors. We consider as domestic competitorsthe ones located in the same country or in another EU15 country. For the av-erage firms, no significant result emerge. The use of PCP seems independentfrom the origin of the competitor. Once again we find that large firms, facingeither domestic or foreign competition are more likely to do LCP. This gapis especially strong when the main competitor is located outside the EU15.
– Figure 5 about here –
3.3 HedgingIn the survey, firms are asked whether they hedge against exchange rate risk,7whether they use financial derivatives (for instance for foreign exchange raterisk protection), whether they have an export insurance or financed part oftheir trade through trade credit. Figure 6 gives the proportion of firms usingone of these instruments and the relative propension of large firms to usethem. Hedging seems widespread in EMU countries: between 25 and 50% offirms reply that they do hedge against exchange rate risk. Trade insurance isalso used by a substantial share of firms, from 25% in Italy to 40% in Austria.The use of derivatives and trade credits is much less developed: below fivepercent, with Spain and Italy being exceptions with 20% of firms using suchinstruments. Those instruments - in particular hedging and trade insurance- are used in a larger proportion by the largest exporters.
– Figure 6 about here –Figure 7 links the invoicing currency to the use of the different instruments
described above. We see that within countries, exporters using hedging orfinancial derivatives are more likely to price in a foreign currency. This isconsistent with the view that hedging and LCP are complementary.
7Firms do not precise whether they use financial or operational hedging. We interpreta positive answer as evidence of financial hedging.
8
– Figure 7 about here –
4 Determinants of currency choice4.1 PCP and firms ’sizeHeterogeneity in invoicing currency choice is a key feature of the stylizedfacts presented in Section 3. In particular, large firms tend to adopt LCPmore often than smaller ones. This section uses probit estimations to studythose facts in more details. We also propose an explanation based on thehedging opportunity of large firms.
Table 3 shows the negative impact of the size of firms on their decision toprice in euro. The table displays the results of probit regressions explainingthe likelihood that the firm price in PCP by the turnover of the firm and othercontrol variables. Namely, all regressions include controls for the country inwhich the firm is located and its main sector of activity. Since the impact ofthe turnover is likely to be non linear, we estimate its impact non paramet-rically, considering intervals of turnover. The first column of Table 3 showsthat larger firms are less likely to price in Euro. The coefficients on turnoverintervals are decreasing and become negative and highly significant for firmswith a turnover above 50 million euros. To see how robust this determinantis, we present in column 2 the probability to do PCP given the size of thefirm, measured through the number of employees. This second estimate con-firms the previous results. Large firms, both in terms of employment and interms of turnover, are more likely to price in another currency than the Euro,in comparison with smaller firms. The third column introduces the share ofexports in total turnover as an additional control variable. The coefficientis negative ad significant which shows that conditional on turnover, firmsexporting more are less likely to use the euro as an invoicing currency. Inthe last column, we introduce a new dummy equal to one for firms with aturnover greater than 50 million euros. This alleviates the presentation anddoes not change the results, neither quantitatively nor qualitatively.
– Table 3 about here –In Table 4, we introduce different potential determinants of invoicing deci-
sions found in the previous literature. In the first column, we introduce vari-ables measuring the distribution of firm exports across different geographicareas. This takes into account the possibility that heterogeneity in invoicingchoices in fact explains by the grographical distribution of firms’ exports.Estimation results suggest that LCP is more often chosen by firms export-ing a significant quantity of goods in Asia and in America. In the second
9
column, we add a dummy equal to one if the firm is part of multinationalgroup. Multinational activities offer the firm with the opportunity to manageher exchange rate exposure through operational hedging. One should thusexpect those firms to find it less costly to price in local currency. This isindeed the case in our data since the coefficient on this variable is negativeand significant. It is worth noting however that, in non reported results, weshow that once we introduce the different turnover intervals, the coefficienton this variable is no more significant. In column 3, we add the number ofdestinations served by the firm based on the intuition that firms selling in alarger number of destinations are less exposed to one specific exchange raterisk and should thus use this diversification opportunity to price in LCP.This variable has no significant impact of the invoicing currency, however.Finally, in the last column, we use a dummy equal to one if the firm reportsthat her price is mainly determined by the market. The coefficient is negativeand significant suggesting that prices determined on world markets are morelikely to be set in another currency as the euro, probably the dollar. This isconsistent with annectodal evidence, for the oil industry for instance.
– Table 4 about here –In Table 5, we investigate the correlation between hedging and currency
choice. In each of those regressions, we use as controls exporter country dum-mies, sector dummies, and the distribution of firm exports to 7 geographicareas. In columns 1-4 of Table 5, different variables related to hedging areintroduced. We see that firms self-reporting as hedging against exchange raterisk are less likely to use the euro as an invoicing currency (column 1). In thesecond column, we use a dummy equal to one if the exporter reports usingderivatives. Firms using such instruments are also more likely to use foreigncurrency to invoice their exports. In columns 3-4, we show that neither thedummy for firms using trade credit nor the subscription of trade insuranceshave an impact on the choice of the invoicing currency. Finally, in the lastcolumn, we introduce the four previous instruments together. The impact ofhedging is still negative and highly significant, the coefficient on derivativesis negative and significant at 5%. The effect of the two other instruments arenot significantly different from zero.
– Table 5 about here –Then, we try to go beyond the correlation between invoicing currency and
hedging, and investigate the causal impact of hedging on the currency choiceof exporters. In doing so, we develop an instrumental variable strategy. Wepropose two specifications using respectively two and four instruments. Thefirst two instruments are a dummy equal to one if the firms has subscribedto a trade insurance, and a dummy equal to one if the firm self reports she islacking organizational resources. We use trade insurance based on evidence
10
for France that firms suscribing to trade insurances are proposed hedginginstruments against ER risk.8 As shown in Table 5 trade insurance does notimpact currency choice. The second instrument is a variable equal to one ifthe firm reports that one of the main factors peventing her growth is the lackof management and/or organisational resources. We assume that firms withmanagement concerns have less ability to hedge against ER risk but this isnot correlated with their invoicing choice. The other two instruments are thenumber of destinations served by the firms (linked to the decision of hedgingas shown by Allayannis et al. (2001)) and a dummy equal to one if part offirms’ trade is financed through trade credit.
In the first column of Table 6, we show that none of those instrumentshas a significant and direct impact on the choice of the invoicing currency.In columns 2-3, we present the first and second stages of an instrumentedprobit, in which we explain the use of the euro by the size of the firm, differentsector and country characteristics and the use of hedging. Here, the hedgingvariable is instrumented by the use of a trade insurance and a measure of thelack of organizational resources of the firm. In the first stage (column 3), wefind that large firms, firms using trade insurance and firms that do not lack oforganiational resources are more likely to hedge against exchange rate risk. Inthe second stage (column 2), we find a negative and significant impact of theinstrumented hedging variable on the decision to use the euro as an invoicingcurrency. The coefficient is less precisely measured, but larger, than withoutinstrumentation (column 1). Columns 4-5 reproduce the same exercise butadding two instruments (trade credit and the number of destinations) to thespecification. Once again we find a negative and significant causal impactof hedging on the decision to use the euro, once endogeneity is taken intoaccount.
– Table 6 about here –These results suggest that, controlling for size, firms with better access
to hedging instruments are less likely to price in euro. Since large firmsare also more likely to hedge against exchange rate risk, this relationshipmay be at the origin of the link between a firm’s size and her invoicingbehavior. It is indeed the case that, once hedging is taken into account, thecoefficient on the firm’s size decreases, in absolute value (compare Table 4and Table 5). Thus, the size-invoicing relationship in part explains by largefirms having better access to financial hedging. This opportunity to hedgeagainst exchange rate risk lets them invoice in local currency without facinga risk on their unit margin. This explains why their propensity to invoicein local currency is larger. However, the size-invoicing relationship does not
8See www.coface.fr.
11
completly disappears once hedging is taken into account. Other economicmechanisms, for instance related to the relative strengths of the producerand the consumer in the bargaining determining the invoicing currency, maybe at play in the data and explain this relationship.
5 ConclusionThe paper offers three new results. First, large firms in EMU countriesare less likely to use the euro than smaller ones. Second, large firms andfirms doing LCP are more likely to hedge against ER risk. Third, hedgingopportunity increases the propensity of firms to do LCP.
These new facts open the way for future empirical and theoretical researchavenues. First, more empirical evidence are needed to confirm the link be-tween invoicing currency, firm heterogenity and hedging. Our preliminaryresults however suggest that theoretical models should consider firms’ accessto hedging when modeling the choice of invoicing currencies. Recent resultson the heterogeneity in pass-through across firms within an industry mightalso be read in light of the evidence we provide that firms have heterogenousbehaviors when it comes to deciding on the invoicing currency. Last, theresults on hedging have important implications for the costs of ER fluctua-tions. Actually, since large firms tend to hedge against ER fluctuations, itseems that ER risk is not born solely by one of the two parties involved inexport transactions, as usually assumed by the literature. Instead, the riskseems diversifiable through financial markets.
12
ReferencesAllayannis, G., Ihrig, J. and Weston, J. P. (2001), ‘Exchange-rate hedg-
ing: Financial versus operational strategies’, American Economic Review91(2), 391–395.
Bacchetta, P. and van Wincoop, E. (2005), ‘A theory of the currency de-nomination of international trade’, Journal of International Economics67(2), 295–319.
Berman, N., Martin, P. and Mayer, T. (2011), ‘How do different exportersreact to exchange rate changes?’, Quarterly Journal of Economics (forth-coming).
Bernard, A. B., Jensen, J. B., Redding, S. J. and Schott, P. K. (2011), Theempirics of firm heterogeneity and international trade, NBER WorkingPapers 17627, National Bureau of Economic Research, Inc.
Betts, C. and Devereux, M. B. (1996), ‘The exchange rate in a model ofpricing-to-market’, European Economic Review 40(3-5), 1007–1021.
Corsetti, G. and Pesenti, P. (2005), ‘International dimensions of optimalmonetary policy’, Journal of Monetary Economics 52(2), 281–305.
Corsetti, G. and Pesenti, P. (2009), The simple geometry of transmissionand stabilization in closed and open economies, in ‘NBER InternationalSeminar on Macroeconomics 2007’, NBER Chapters, National Bureau ofEconomic Research, Inc, pp. 65–116.
Devereux, M. B. and Engel, C. (2003), ‘Monetary policy in the open economyrevisited: Price setting and exchange-rate flexibility’, Review of EconomicStudies 70(4), 765–783.
Devereux, M. B., Engel, C. and Storgaard, P. E. (2004), ‘Endogenous ex-change rate pass-through when nominal prices are set in advance’, Journalof International Economics 63(2), 263–291.
Dohring, B. (2008), Hedging and invoicing strategies to reduce exchange rateexposure - a euro-area perspective, European Economy - Economic Papers299, Directorate General Economic and Monetary Affairs, European Com-mission.
ECB (2011), The International Role of the Euro, European Central Bank.
13
Engel, C. (2006), ‘Equivalence results for optimal pass-through, optimal in-dexing to exchange rates, and optimal choice of currency for export pric-ing’, Journal of the European Economic Association 4(6), 1249–1260.
Friberg, R. (1998), ‘In which currency should exporters set their prices?’,Journal of International Economics 45(1), 59–76.
Friberg, R. and Wilander, F. (2008), ‘The currency denomination of exports– a questionnaire study’, Journal of International Economics 75(1), 54–69.
Goldberg, L. S. and Tille, C. (2006), The international role of the dollarand trade balance adjustment, Nber working papers, National Bureau ofEconomic Research, Inc.
Goldberg, L. and Tille, C. (2009), Micro, Macro, and Strategic Forces inInternational Trade Invoicing, CEPR Discussion Papers 7534, C.E.P.R.Discussion Papers.
Goldberg, P. K. and Knetter, M. M. (1997), ‘Goods prices and ex-change rates: What have we learned?’, Journal of Economic Literature35(3), 1243–1272.
Gopinath, G., Itskhoki, O. and Rigobon, R. (2010), ‘Currency choice andexchange rate pass-through’, American Economic Review 100(1), 304–36.
Kamps, A. (2006), The euro as invoicing currency in international trade,Working Paper Series 665, European Central Bank.
14
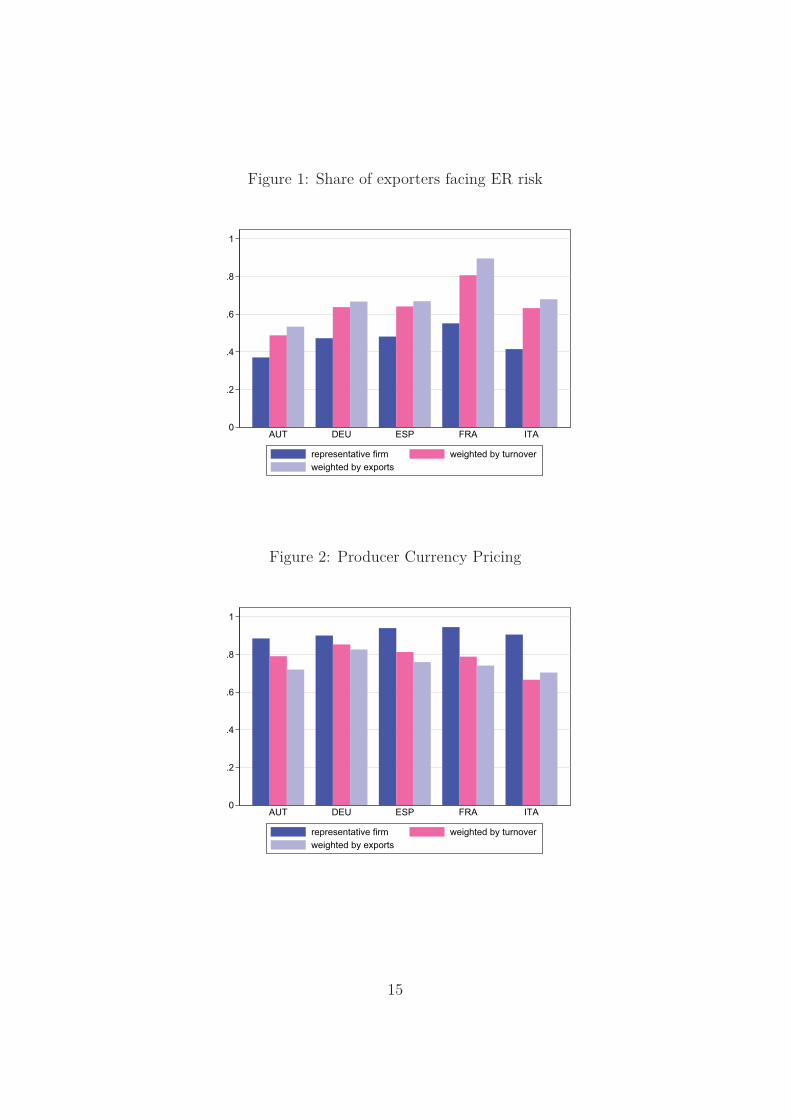
Figure 1: Share of exporters facing ER risk
0
.2
.4
.6
.8
1
AUT DEU ESP FRA ITA
representative firm weighted by turnoverweighted by exports
Figure 2: Producer Currency Pricing
0
.2
.4
.6
.8
1
AUT DEU ESP FRA ITA
representative firm weighted by turnoverweighted by exports
15
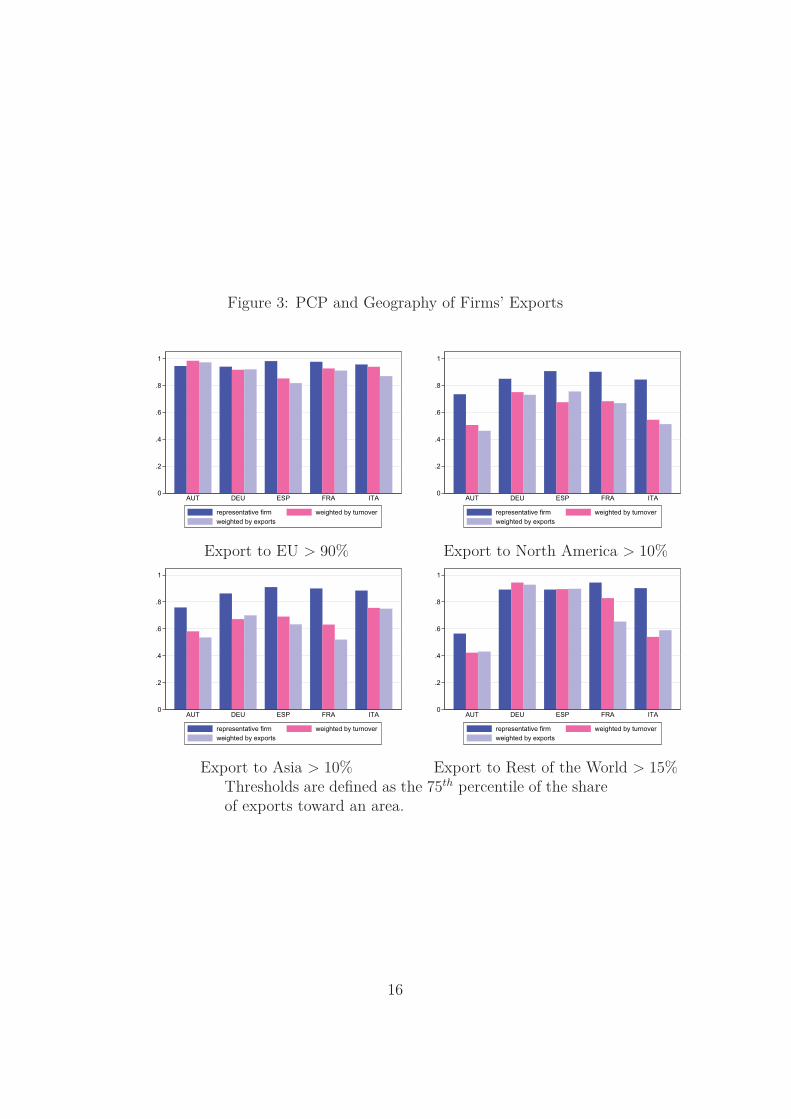
Figure 3: PCP and Geography of Firms’ Exports
0
.2
.4
.6
.8
1
AUT DEU ESP FRA ITA
representative firm weighted by turnoverweighted by exports
0
.2
.4
.6
.8
1
AUT DEU ESP FRA ITA
representative firm weighted by turnoverweighted by exports
Export to EU > 90% Export to North America > 10%
0
.2
.4
.6
.8
1
AUT DEU ESP FRA ITA
representative firm weighted by turnoverweighted by exports
0
.2
.4
.6
.8
1
AUT DEU ESP FRA ITA
representative firm weighted by turnoverweighted by exports
Export to Asia > 10% Export to Rest of the World > 15%Thresholds are defined as the 75th percentile of the shareof exports toward an area.
16
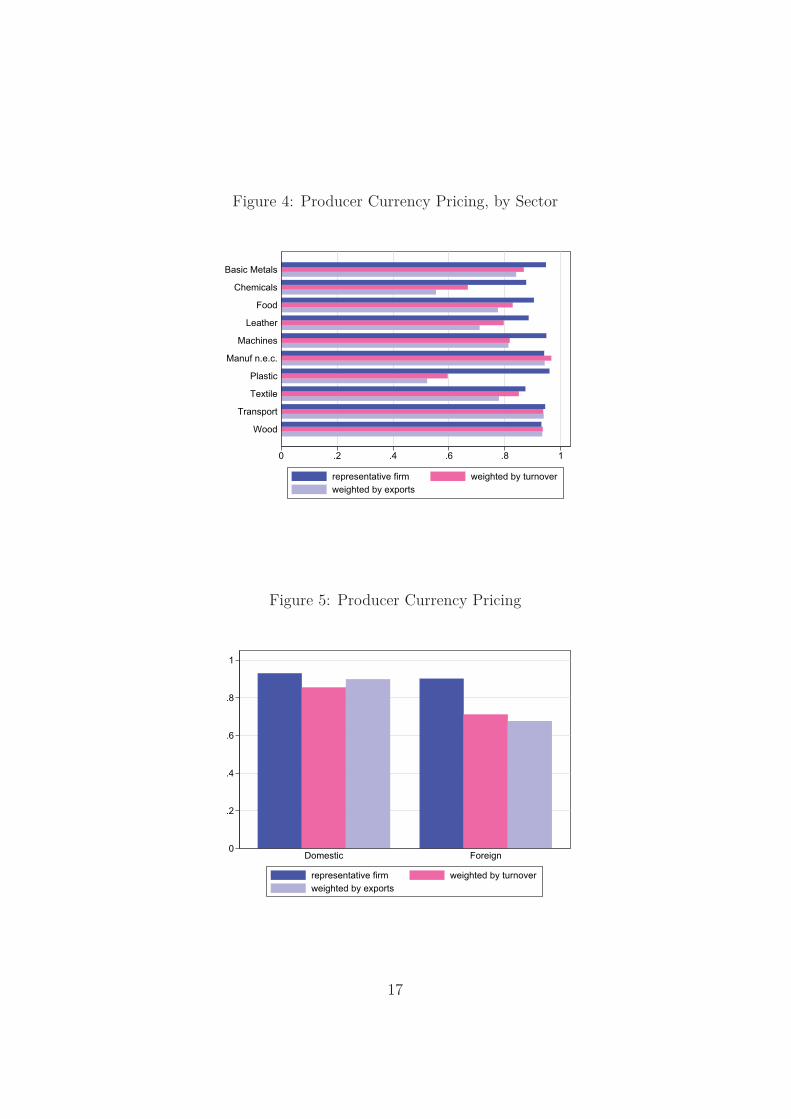
Figure 4: Producer Currency Pricing, by Sector
0 .2 .4 .6 .8 1
Wood
Transport
Textile
Plastic
Manuf n.e.c.
Machines
Leather
Food
Chemicals
Basic Metals
representative firm weighted by turnoverweighted by exports
Figure 5: Producer Currency Pricing
0
.2
.4
.6
.8
1
Domestic Foreign
representative firm weighted by turnoverweighted by exports
17
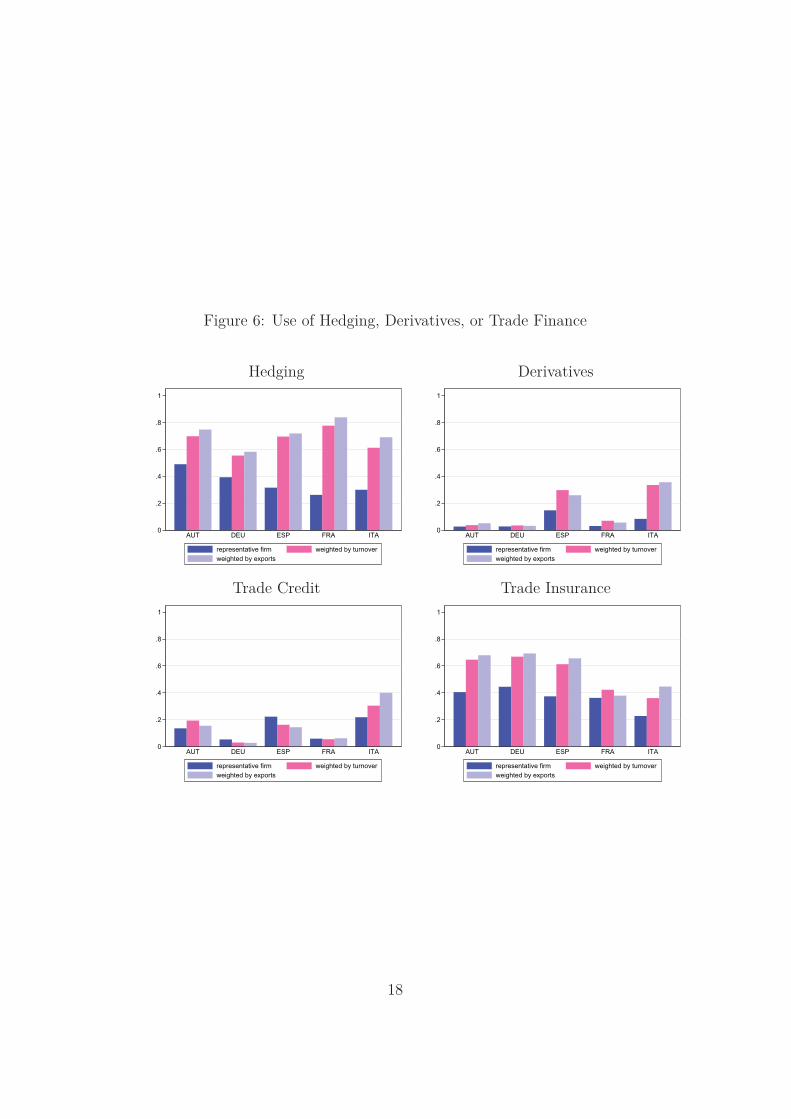
Figure 6: Use of Hedging, Derivatives, or Trade Finance
Hedging Derivatives
0
.2
.4
.6
.8
1
AUT DEU ESP FRA ITA
representative firm weighted by turnoverweighted by exports
0
.2
.4
.6
.8
1
AUT DEU ESP FRA ITA
representative firm weighted by turnoverweighted by exports
Trade Credit Trade Insurance
0
.2
.4
.6
.8
1
AUT DEU ESP FRA ITA
representative firm weighted by turnoverweighted by exports
0
.2
.4
.6
.8
1
AUT DEU ESP FRA ITA
representative firm weighted by turnoverweighted by exports
18
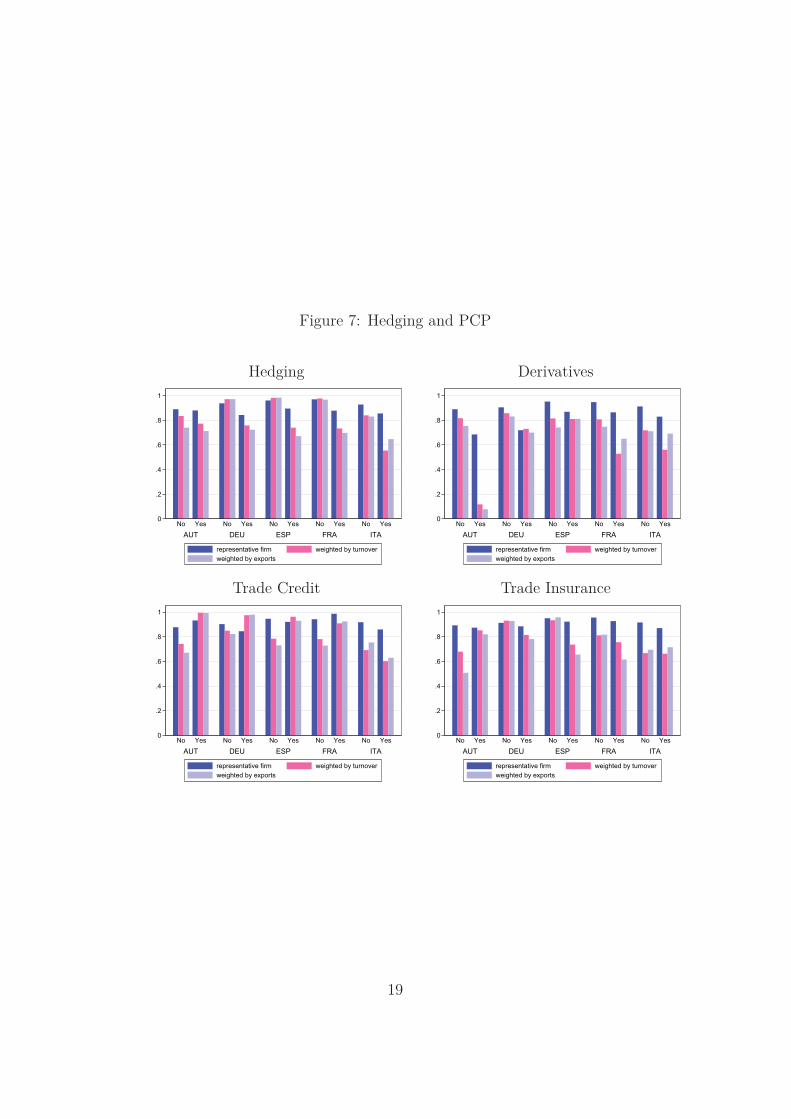
Figure 7: Hedging and PCP
Hedging Derivatives
0
.2
.4
.6
.8
1
AUT DEU ESP FRA ITANo Yes No Yes No Yes No Yes No Yes
representative firm weighted by turnoverweighted by exports
0
.2
.4
.6
.8
1
AUT DEU ESP FRA ITANo Yes No Yes No Yes No Yes No Yes
representative firm weighted by turnoverweighted by exports
Trade Credit Trade Insurance
0
.2
.4
.6
.8
1
AUT DEU ESP FRA ITANo Yes No Yes No Yes No Yes No Yes
representative firm weighted by turnoverweighted by exports
0
.2
.4
.6
.8
1
AUT DEU ESP FRA ITANo Yes No Yes No Yes No Yes No Yes
representative firm weighted by turnoverweighted by exports
19
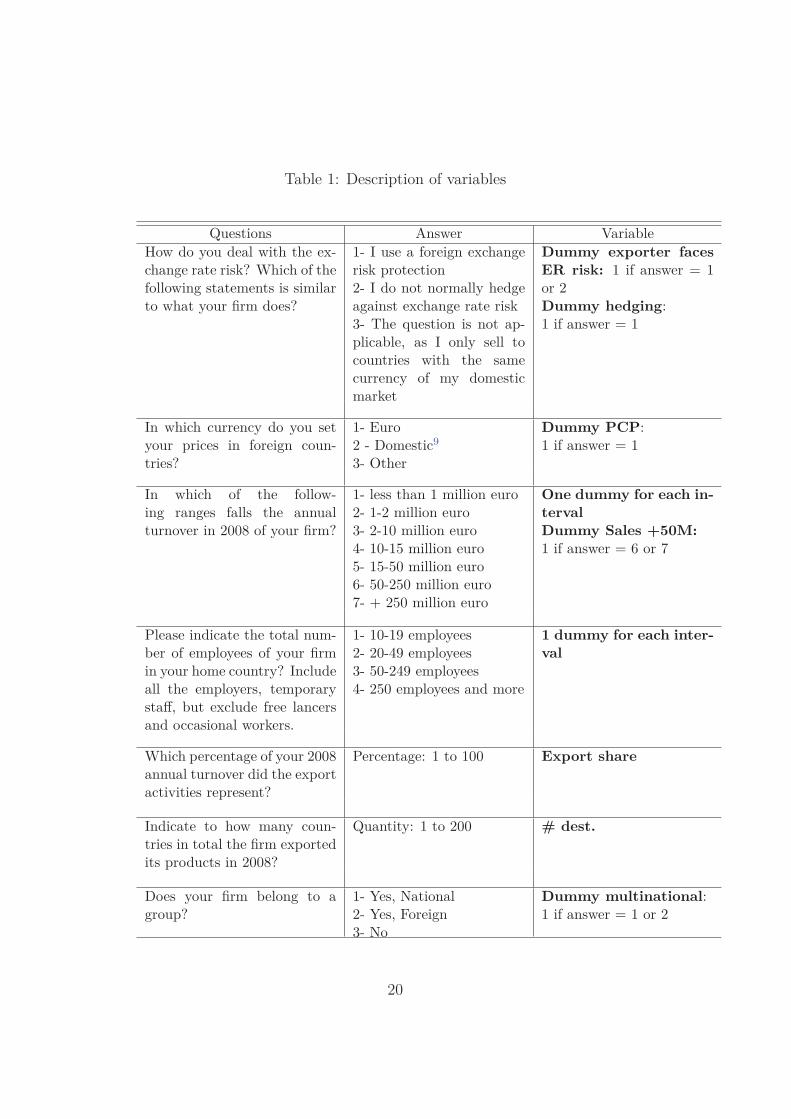
Table 1: Description of variables
Questions Answer VariableHow do you deal with the ex-change rate risk? Which of thefollowing statements is similarto what your firm does?
1- I use a foreign exchangerisk protection2- I do not normally hedgeagainst exchange rate risk3- The question is not ap-plicable, as I only sell tocountries with the samecurrency of my domesticmarket
Dummy exporter facesER risk: 1 if answer = 1or 2Dummy hedging:1 if answer = 1
In which currency do you setyour prices in foreign coun-tries?
1- Euro2 - Domestic9
3- Other
Dummy PCP:1 if answer = 1
In which of the follow-ing ranges falls the annualturnover in 2008 of your firm?
1- less than 1 million euro2- 1-2 million euro3- 2-10 million euro4- 10-15 million euro5- 15-50 million euro6- 50-250 million euro7- + 250 million euro
One dummy for each in-tervalDummy Sales +50M:1 if answer = 6 or 7
Please indicate the total num-ber of employees of your firmin your home country? Includeall the employers, temporarystaff, but exclude free lancersand occasional workers.
1- 10-19 employees2- 20-49 employees3- 50-249 employees4- 250 employees and more
1 dummy for each inter-val
Which percentage of your 2008annual turnover did the exportactivities represent?
Percentage: 1 to 100 Export share
Indicate to how many coun-tries in total the firm exportedits products in 2008?
Quantity: 1 to 200 # dest.
Does your firm belong to agroup?
1- Yes, National2- Yes, Foreign3- No
Dummy multinational:1 if answer = 1 or 2
20
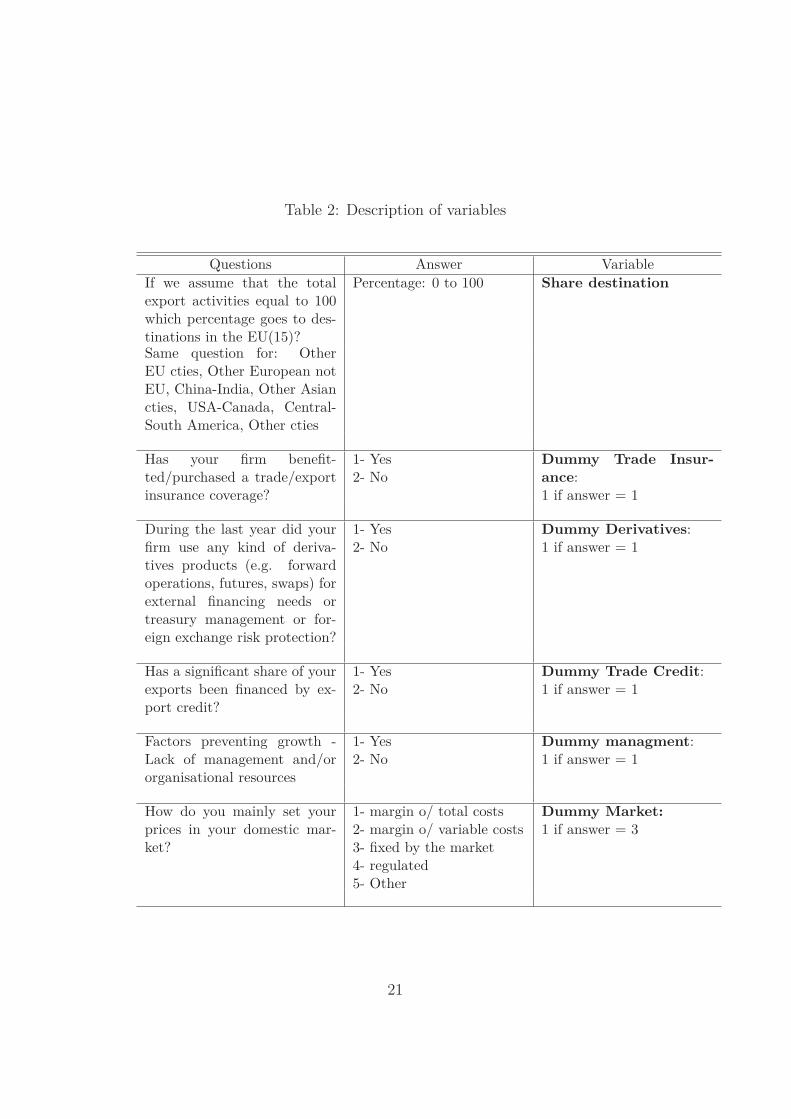
Table 2: Description of variables
Questions Answer VariableIf we assume that the totalexport activities equal to 100which percentage goes to des-tinations in the EU(15)?
Percentage: 0 to 100 Share destination
Same question for: OtherEU cties, Other European notEU, China-India, Other Asiancties, USA-Canada, Central-South America, Other cties
Has your firm benefit-ted/purchased a trade/exportinsurance coverage?
1- Yes2- No
Dummy Trade Insur-ance:1 if answer = 1
During the last year did yourfirm use any kind of deriva-tives products (e.g. forwardoperations, futures, swaps) forexternal financing needs ortreasury management or for-eign exchange risk protection?
1- Yes2- No
Dummy Derivatives:1 if answer = 1
Has a significant share of yourexports been financed by ex-port credit?
1- Yes2- No
Dummy Trade Credit:1 if answer = 1
Factors preventing growth -Lack of management and/ororganisational resources
1- Yes2- No
Dummy managment:1 if answer = 1
How do you mainly set yourprices in your domestic mar-ket?
1- margin o/ total costs2- margin o/ variable costs3- fixed by the market4- regulated5- Other
Dummy Market:1 if answer = 3
21
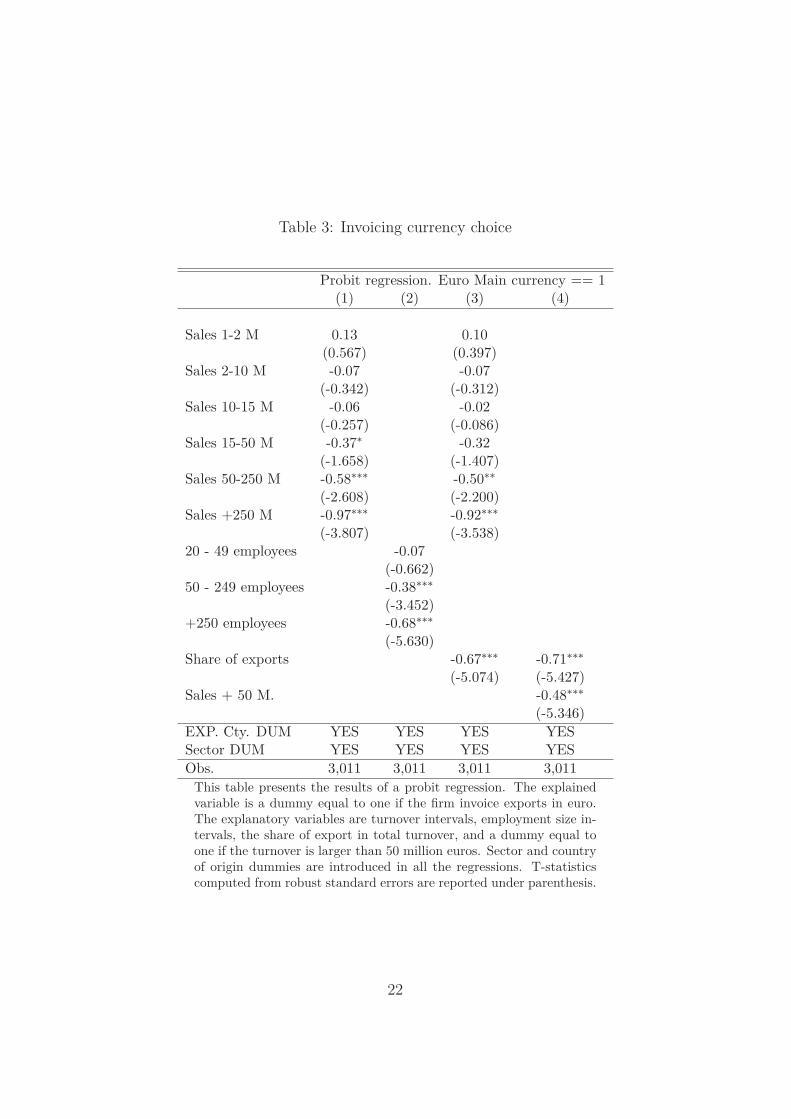
Table 3: Invoicing currency choice
Probit regression. Euro Main currency == 1(1) (2) (3) (4)
Sales 1-2 M 0.13 0.10(0.567) (0.397)
Sales 2-10 M -0.07 -0.07(-0.342) (-0.312)
Sales 10-15 M -0.06 -0.02(-0.257) (-0.086)
Sales 15-50 M -0.37∗ -0.32(-1.658) (-1.407)
Sales 50-250 M -0.58∗∗∗ -0.50∗∗
(-2.608) (-2.200)Sales +250 M -0.97∗∗∗ -0.92∗∗∗
(-3.807) (-3.538)20 - 49 employees -0.07
(-0.662)50 - 249 employees -0.38∗∗∗
(-3.452)+250 employees -0.68∗∗∗
(-5.630)Share of exports -0.67∗∗∗ -0.71∗∗∗
(-5.074) (-5.427)Sales + 50 M. -0.48∗∗∗
(-5.346)EXP. Cty. DUM YES YES YES YESSector DUM YES YES YES YESObs. 3,011 3,011 3,011 3,011
This table presents the results of a probit regression. The explainedvariable is a dummy equal to one if the firm invoice exports in euro.The explanatory variables are turnover intervals, employment size in-tervals, the share of export in total turnover, and a dummy equal toone if the turnover is larger than 50 million euros. Sector and countryof origin dummies are introduced in all the regressions. T-statisticscomputed from robust standard errors are reported under parenthesis.
22
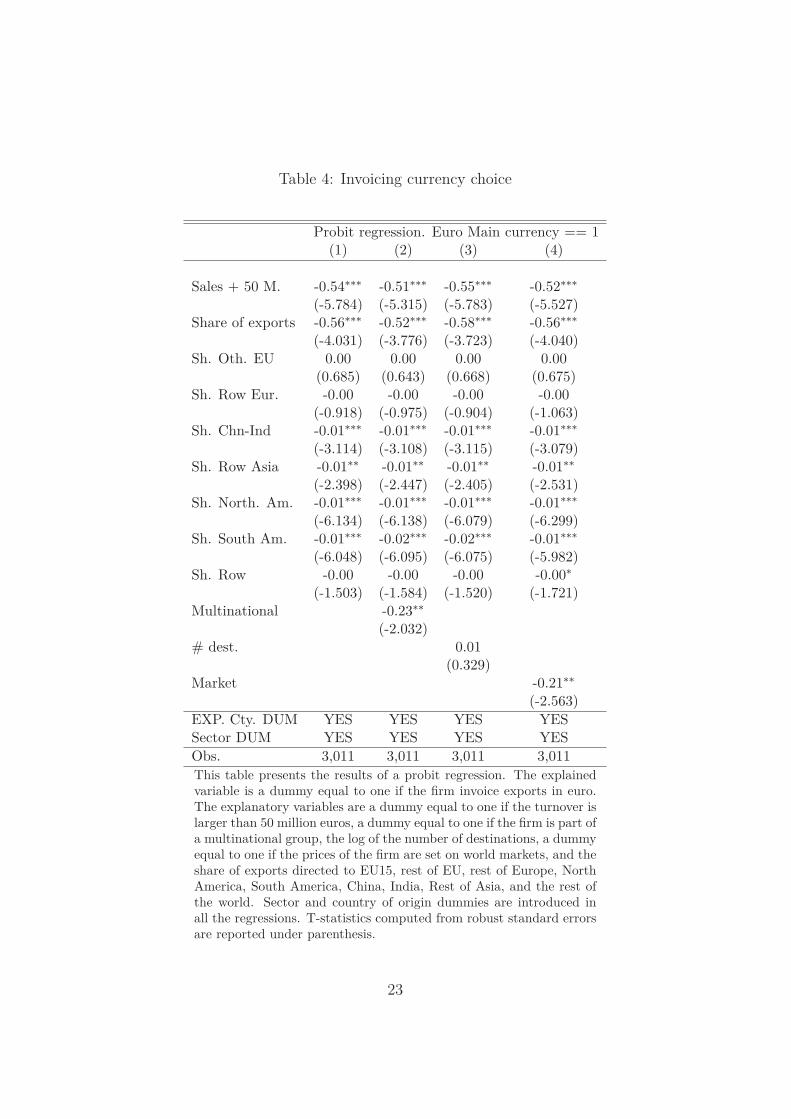
Table 4: Invoicing currency choice
Probit regression. Euro Main currency == 1(1) (2) (3) (4)
Sales + 50 M. -0.54∗∗∗ -0.51∗∗∗ -0.55∗∗∗ -0.52∗∗∗
(-5.784) (-5.315) (-5.783) (-5.527)Share of exports -0.56∗∗∗ -0.52∗∗∗ -0.58∗∗∗ -0.56∗∗∗
(-4.031) (-3.776) (-3.723) (-4.040)Sh. Oth. EU 0.00 0.00 0.00 0.00
(0.685) (0.643) (0.668) (0.675)Sh. Row Eur. -0.00 -0.00 -0.00 -0.00
(-0.918) (-0.975) (-0.904) (-1.063)Sh. Chn-Ind -0.01∗∗∗ -0.01∗∗∗ -0.01∗∗∗ -0.01∗∗∗
(-3.114) (-3.108) (-3.115) (-3.079)Sh. Row Asia -0.01∗∗ -0.01∗∗ -0.01∗∗ -0.01∗∗
(-2.398) (-2.447) (-2.405) (-2.531)Sh. North. Am. -0.01∗∗∗ -0.01∗∗∗ -0.01∗∗∗ -0.01∗∗∗
(-6.134) (-6.138) (-6.079) (-6.299)Sh. South Am. -0.01∗∗∗ -0.02∗∗∗ -0.02∗∗∗ -0.01∗∗∗
(-6.048) (-6.095) (-6.075) (-5.982)Sh. Row -0.00 -0.00 -0.00 -0.00∗
(-1.503) (-1.584) (-1.520) (-1.721)Multinational -0.23∗∗
(-2.032)# dest. 0.01
(0.329)Market -0.21∗∗
(-2.563)EXP. Cty. DUM YES YES YES YESSector DUM YES YES YES YESObs. 3,011 3,011 3,011 3,011This table presents the results of a probit regression. The explainedvariable is a dummy equal to one if the firm invoice exports in euro.The explanatory variables are a dummy equal to one if the turnover islarger than 50 million euros, a dummy equal to one if the firm is part ofa multinational group, the log of the number of destinations, a dummyequal to one if the prices of the firm are set on world markets, and theshare of exports directed to EU15, rest of EU, rest of Europe, NorthAmerica, South America, China, India, Rest of Asia, and the rest ofthe world. Sector and country of origin dummies are introduced inall the regressions. T-statistics computed from robust standard errorsare reported under parenthesis.
23
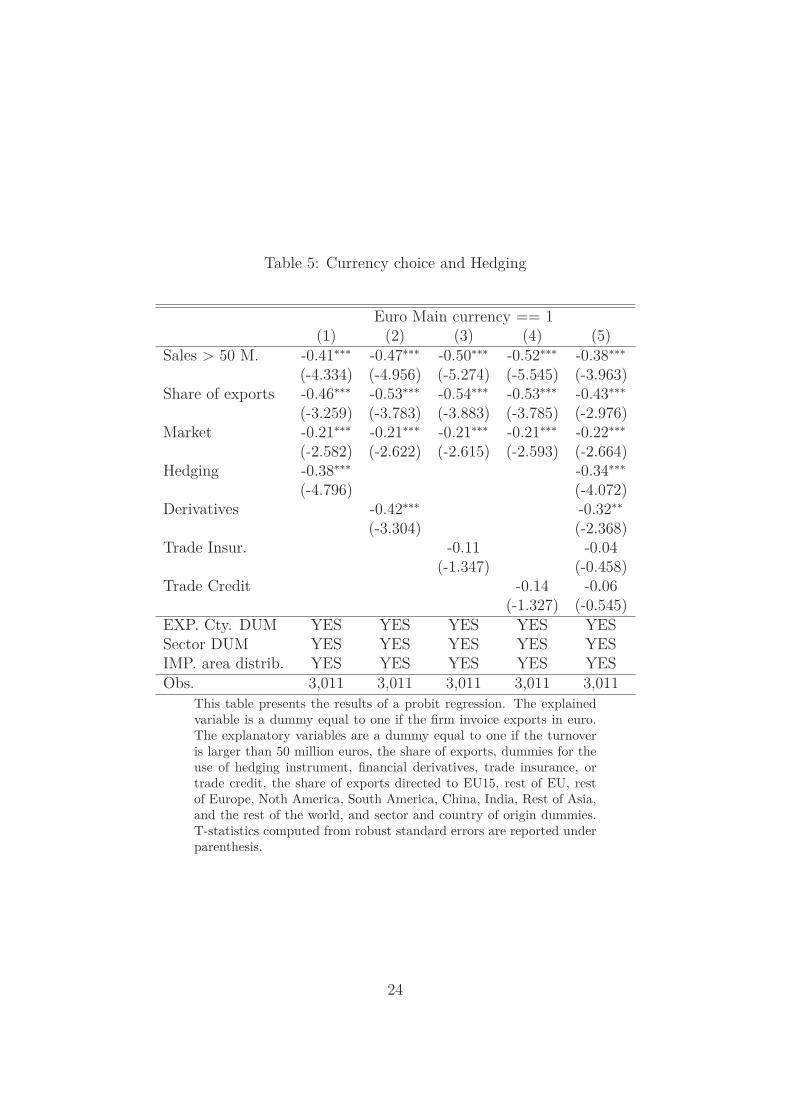
Table 5: Currency choice and Hedging
Euro Main currency == 1(1) (2) (3) (4) (5)
Sales > 50 M. -0.41∗∗∗ -0.47∗∗∗ -0.50∗∗∗ -0.52∗∗∗ -0.38∗∗∗
(-4.334) (-4.956) (-5.274) (-5.545) (-3.963)Share of exports -0.46∗∗∗ -0.53∗∗∗ -0.54∗∗∗ -0.53∗∗∗ -0.43∗∗∗
(-3.259) (-3.783) (-3.883) (-3.785) (-2.976)Market -0.21∗∗∗ -0.21∗∗∗ -0.21∗∗∗ -0.21∗∗∗ -0.22∗∗∗
(-2.582) (-2.622) (-2.615) (-2.593) (-2.664)Hedging -0.38∗∗∗ -0.34∗∗∗
(-4.796) (-4.072)Derivatives -0.42∗∗∗ -0.32∗∗
(-3.304) (-2.368)Trade Insur. -0.11 -0.04
(-1.347) (-0.458)Trade Credit -0.14 -0.06
(-1.327) (-0.545)EXP. Cty. DUM YES YES YES YES YESSector DUM YES YES YES YES YESIMP. area distrib. YES YES YES YES YESObs. 3,011 3,011 3,011 3,011 3,011
This table presents the results of a probit regression. The explainedvariable is a dummy equal to one if the firm invoice exports in euro.The explanatory variables are a dummy equal to one if the turnoveris larger than 50 million euros, the share of exports, dummies for theuse of hedging instrument, financial derivatives, trade insurance, ortrade credit, the share of exports directed to EU15, rest of EU, restof Europe, Noth America, South America, China, India, Rest of Asia,and the rest of the world, and sector and country of origin dummies.T-statistics computed from robust standard errors are reported underparenthesis.
24
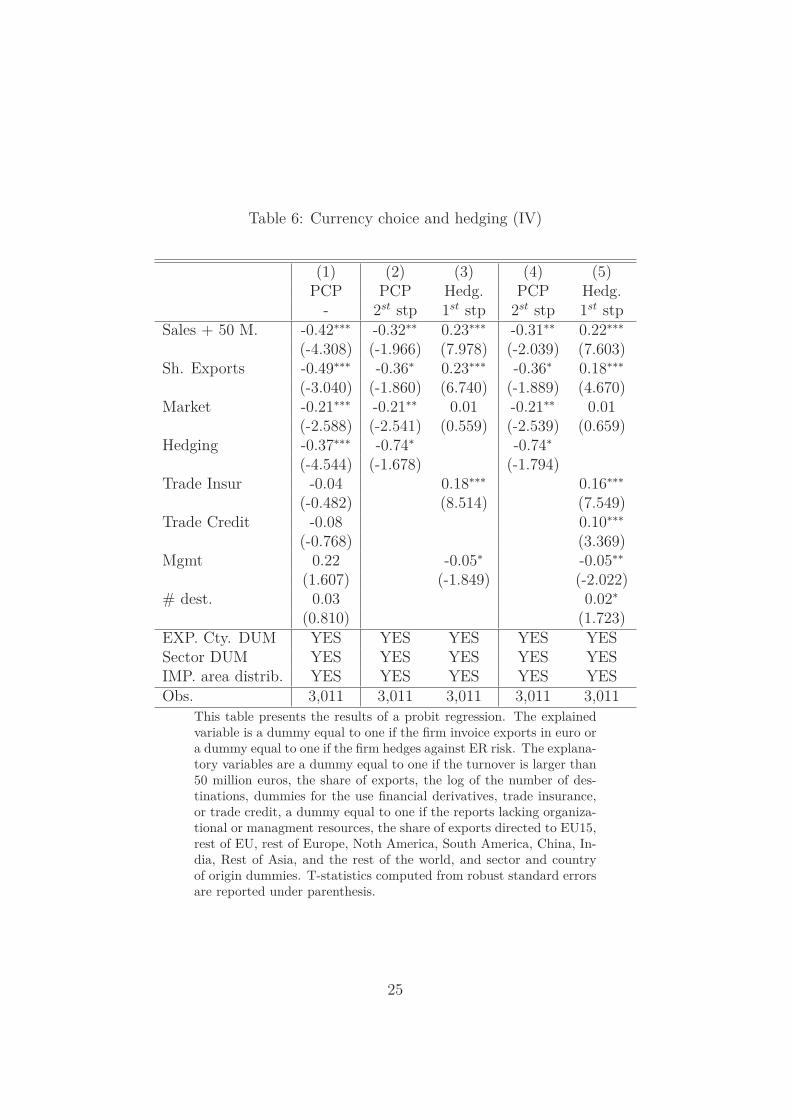
Table 6: Currency choice and hedging (IV)
(1) (2) (3) (4) (5)PCP PCP Hedg. PCP Hedg.
- 2st stp 1st stp 2st stp 1st stpSales + 50 M. -0.42∗∗∗ -0.32∗∗ 0.23∗∗∗ -0.31∗∗ 0.22∗∗∗
(-4.308) (-1.966) (7.978) (-2.039) (7.603)Sh. Exports -0.49∗∗∗ -0.36∗ 0.23∗∗∗ -0.36∗ 0.18∗∗∗
(-3.040) (-1.860) (6.740) (-1.889) (4.670)Market -0.21∗∗∗ -0.21∗∗ 0.01 -0.21∗∗ 0.01
(-2.588) (-2.541) (0.559) (-2.539) (0.659)Hedging -0.37∗∗∗ -0.74∗ -0.74∗
(-4.544) (-1.678) (-1.794)Trade Insur -0.04 0.18∗∗∗ 0.16∗∗∗
(-0.482) (8.514) (7.549)Trade Credit -0.08 0.10∗∗∗
(-0.768) (3.369)Mgmt 0.22 -0.05∗ -0.05∗∗
(1.607) (-1.849) (-2.022)# dest. 0.03 0.02∗
(0.810) (1.723)EXP. Cty. DUM YES YES YES YES YESSector DUM YES YES YES YES YESIMP. area distrib. YES YES YES YES YESObs. 3,011 3,011 3,011 3,011 3,011
This table presents the results of a probit regression. The explainedvariable is a dummy equal to one if the firm invoice exports in euro ora dummy equal to one if the firm hedges against ER risk. The explana-tory variables are a dummy equal to one if the turnover is larger than50 million euros, the share of exports, the log of the number of des-tinations, dummies for the use financial derivatives, trade insurance,or trade credit, a dummy equal to one if the reports lacking organiza-tional or managment resources, the share of exports directed to EU15,rest of EU, rest of Europe, Noth America, South America, China, In-dia, Rest of Asia, and the rest of the world, and sector and countryof origin dummies. T-statistics computed from robust standard errorsare reported under parenthesis.
25