Embed Size (px)
Citation preview
I/O PsychologyI/O PsychologyResearch MethodsResearch Methods
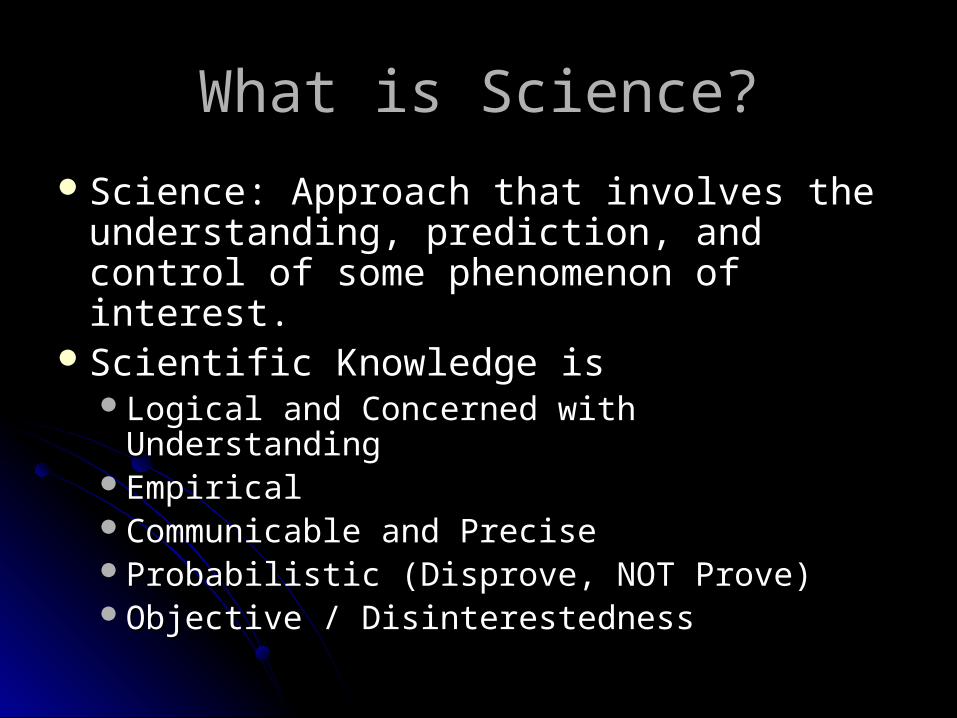
What is Science?What is Science?
Science: Approach that involves the Science: Approach that involves the understanding, prediction, and control of understanding, prediction, and control of some phenomenon of interest.some phenomenon of interest.
Scientific Knowledge isScientific Knowledge isLogical and Concerned with UnderstandingLogical and Concerned with UnderstandingEmpiricalEmpiricalCommunicable and PreciseCommunicable and PreciseProbabilistic (Disprove, NOT Prove)Probabilistic (Disprove, NOT Prove)Objective / DisinterestednessObjective / Disinterestedness
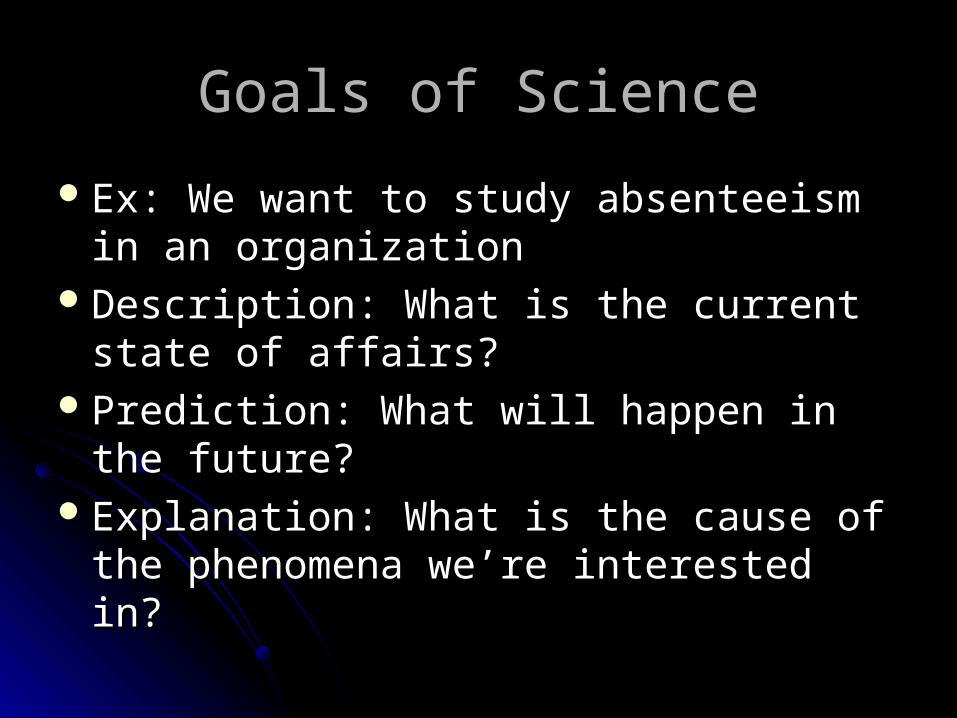
Goals of ScienceGoals of Science
Ex: We want to study absenteeism in an Ex: We want to study absenteeism in an organizationorganization
Description: What is the current state of Description: What is the current state of affairs?affairs?
Prediction: What will happen in the future?Prediction: What will happen in the future?Explanation: What is the cause of the Explanation: What is the cause of the
phenomena we’re interested in?phenomena we’re interested in?
What is “research”?What is “research”?
Systematic study of phenomena according Systematic study of phenomena according to scientific principles.to scientific principles.
A set of procedures used to obtain A set of procedures used to obtain empirical and verifiable information from empirical and verifiable information from which we then make informed, educated which we then make informed, educated conclusions.conclusions.
The Empirical Research ProcessThe Empirical Research Process
1. Statement of the Problem1. Statement of the Problem
2. Design of the Research Study2. Design of the Research Study
3. Measurement of Variables3. Measurement of Variables
4. Analysis of Data4. Analysis of Data
5. Interpretation/Conclusions 5. Interpretation/Conclusions
Step 1: Statement of the ProblemStep 1: Statement of the Problem
Theory: statement that explains the relationship Theory: statement that explains the relationship among phenomena; gives us a framework within among phenomena; gives us a framework within which to conduct research. which to conduct research. ““There is nothing quite so practical as a good theory.” There is nothing quite so practical as a good theory.”
Kurt LewinKurt Lewin
Two Approaches:Two Approaches: Inductive – theory building; use data to derive theory. Inductive – theory building; use data to derive theory. Deductive – theory testing; start with theory and Deductive – theory testing; start with theory and
collect data to test that theory. collect data to test that theory.
Step 1: Statement of the ProblemStep 1: Statement of the Problem
HypothesisHypothesisA testable statement about the status of a A testable statement about the status of a
variable or the relationship among multiple variable or the relationship among multiple variablesvariables
Must be falsifiable!Must be falsifiable!
Step 1: Statement of the ProblemStep 1: Statement of the Problem
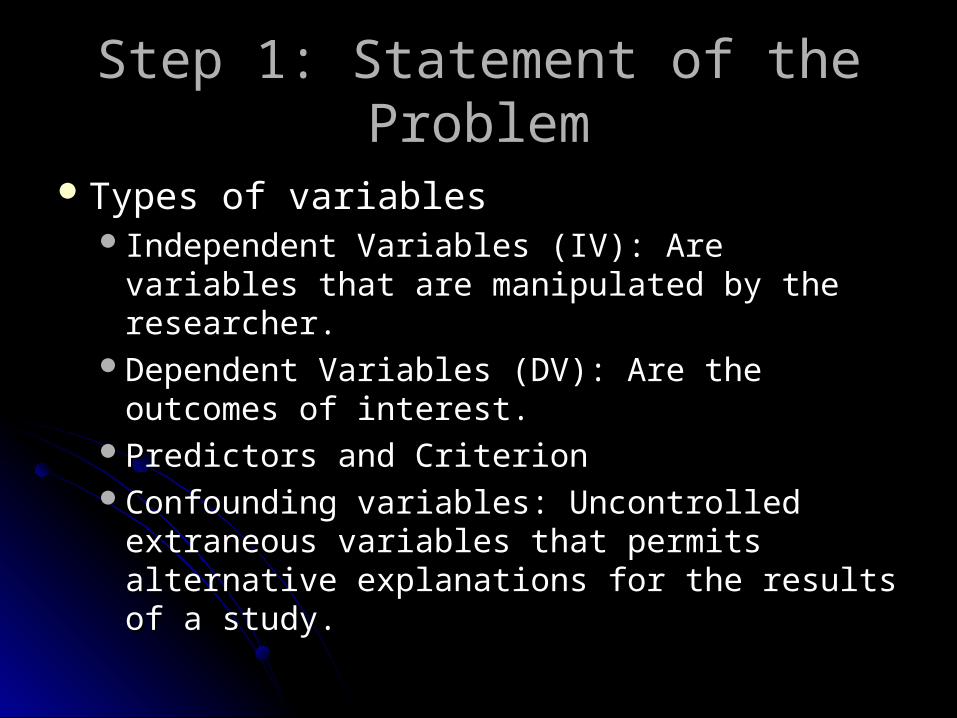
Types of variablesTypes of variables Independent Variables (IV): Are variables that Independent Variables (IV): Are variables that
are manipulated by the researcher.are manipulated by the researcher.Dependent Variables (DV): Are the outcomes Dependent Variables (DV): Are the outcomes
of interest.of interest.Predictors and CriterionPredictors and CriterionConfounding variables: Uncontrolled Confounding variables: Uncontrolled
extraneous variables that permits alternative extraneous variables that permits alternative explanations for the results of a study.explanations for the results of a study.
Moderator VariableModerator Variable
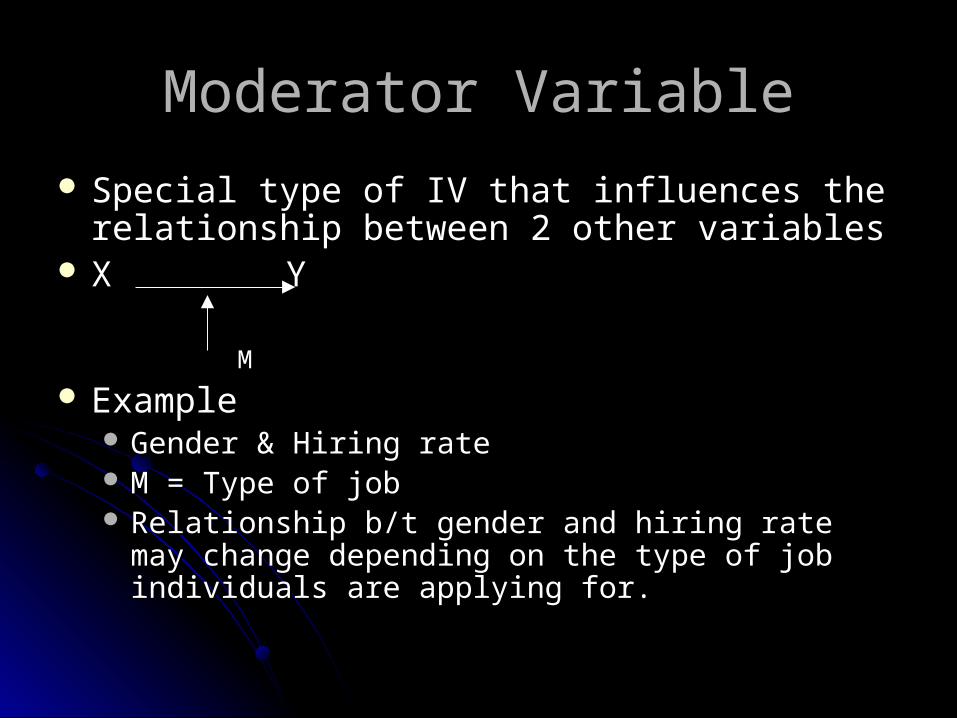
Special type of IV that influences the relationship Special type of IV that influences the relationship between 2 other variablesbetween 2 other variables
XX Y Y
MM
ExampleExample Gender & Hiring rateGender & Hiring rate M = Type of job M = Type of job Relationship b/t gender and hiring rate may change Relationship b/t gender and hiring rate may change
depending on the type of job individuals are applying depending on the type of job individuals are applying for.for.
Mediator VariableMediator Variable
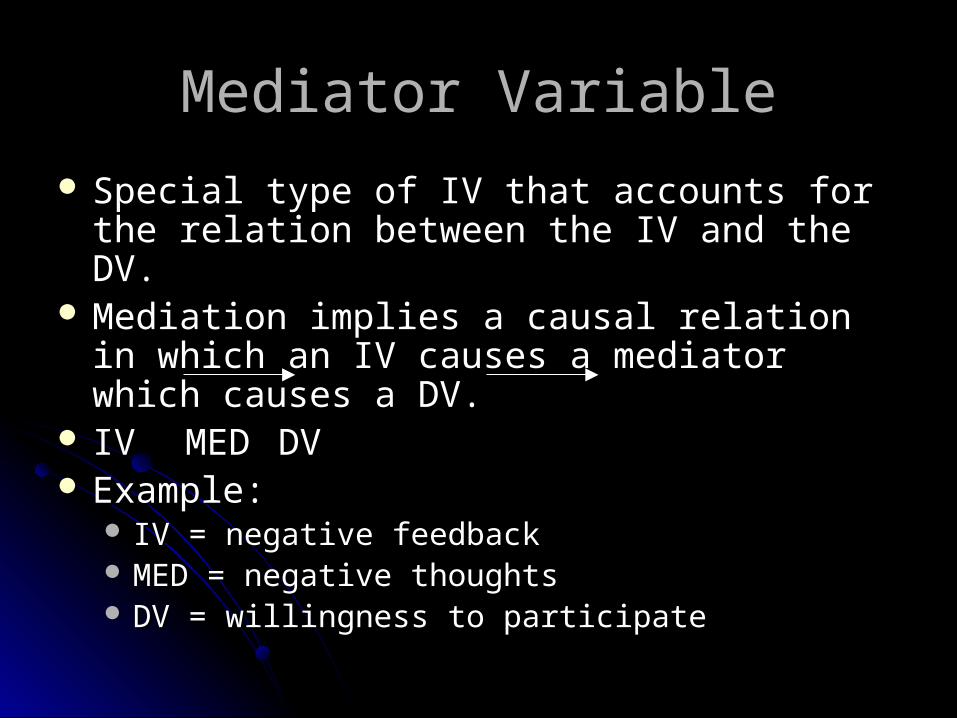
Special type of IV that accounts for the relation Special type of IV that accounts for the relation between the IV and the DV.between the IV and the DV.
Mediation implies a causal relation in which an Mediation implies a causal relation in which an IV causes a mediator which causes a DV. IV causes a mediator which causes a DV.
IVIV MEDMED DVDV Example:Example:
IV = negative feedback IV = negative feedback MED = negative thoughts MED = negative thoughts DV = willingness to participateDV = willingness to participate
Moderator vs. MediatorModerator vs. Mediator
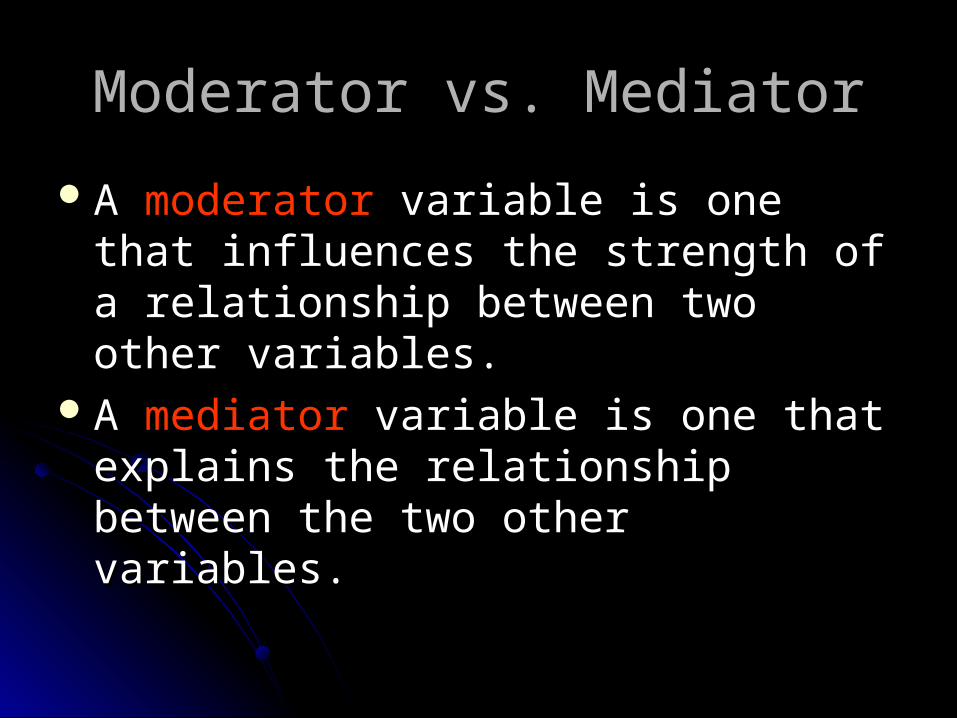
A A moderator moderator variable is one that influences variable is one that influences the strength of a relationship between two the strength of a relationship between two other variables.other variables.
A A mediator mediator variable is one that explains variable is one that explains the relationship between the two other the relationship between the two other variables. variables.
ExampleExample
You are an I/O psychologist working for an You are an I/O psychologist working for an insurance company. You want to assess which insurance company. You want to assess which of two training methods is most effective for of two training methods is most effective for training new secretaries. You give one group of training new secretaries. You give one group of secretaries on-the-job training and a booklet to secretaries on-the-job training and a booklet to study at home. You give the second group of study at home. You give the second group of secretaries on-the-job training and have them secretaries on-the-job training and have them watch a 30-minute video. watch a 30-minute video.
Step 2: Research DesignStep 2: Research Design
A A research designresearch design is the structure or is the structure or architecture for the study.architecture for the study.A plan for how to treat variables that can A plan for how to treat variables that can
influence results so as to rule out alternative influence results so as to rule out alternative interpretations.interpretations.
Primary Research Methods:Primary Research Methods: Experimental (Laboratory vs. Field Research) Experimental (Laboratory vs. Field Research) Quasi-ExperimentalQuasi-Experimental Non-Experimental (Observational, Survey)Non-Experimental (Observational, Survey)
Step 2: Research DesignStep 2: Research Design
Secondary Research MethodsSecondary Research MethodsMeta-analysis: statistical method for Meta-analysis: statistical method for
combining/analyzing the results from many combining/analyzing the results from many studies to draw a general conclusion about studies to draw a general conclusion about relationships among variables (p.61).relationships among variables (p.61).
Qualitative Research MethodsQualitative Research MethodsRely on observation, interview, case study, Rely on observation, interview, case study,
and analysis of diaries to produce narrative and analysis of diaries to produce narrative descriptions of events or processes.descriptions of events or processes.

Evaluating Research DesignEvaluating Research Design Internal validity (Control)Internal validity (Control)
Does X cause Y?Does X cause Y?Lab studies eliminate distracting variables Lab studies eliminate distracting variables
through through experimental controlexperimental control..Using of statistical techniques to control for Using of statistical techniques to control for
the influences of certain variables is the influences of certain variables is statistical controlstatistical control. .
External validity (Generalizability)External validity (Generalizability)Does the relation of X and Y hold in other Does the relation of X and Y hold in other
settings and with other participants and settings and with other participants and stimuli?stimuli?
Threats to Internal ValidityThreats to Internal Validity HistoryHistory InstrumentationInstrumentation SelectionSelection MaturationMaturation Mortality/AttritionMortality/Attrition TestingTesting Experimenter BiasExperimenter Bias Awareness of Being a SubjectAwareness of Being a Subject
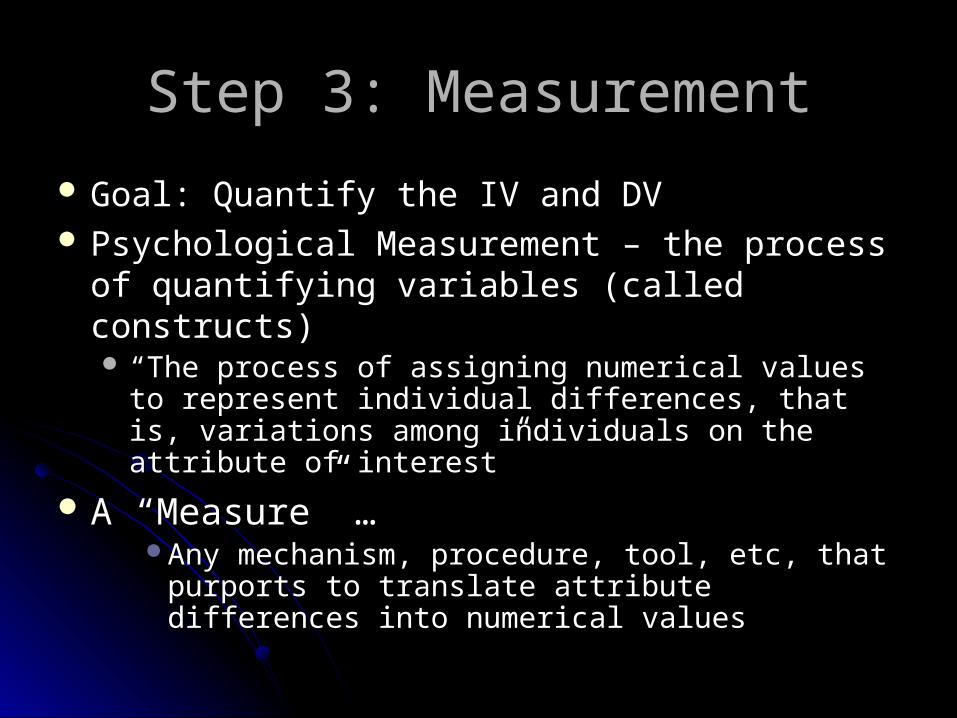
Step 3: MeasurementStep 3: Measurement
Goal: Quantify the IV and DVGoal: Quantify the IV and DV Psychological Measurement – the process of Psychological Measurement – the process of
quantifying variables (called constructs)quantifying variables (called constructs) ““The process of assigning numerical values to The process of assigning numerical values to
represent individual differences, that is, variations represent individual differences, that is, variations among individuals on the attribute of interest”among individuals on the attribute of interest”
A “Measure” …A “Measure” …Any mechanism, procedure, tool, etc, that purports Any mechanism, procedure, tool, etc, that purports
to translate attribute differences into numerical to translate attribute differences into numerical valuesvalues
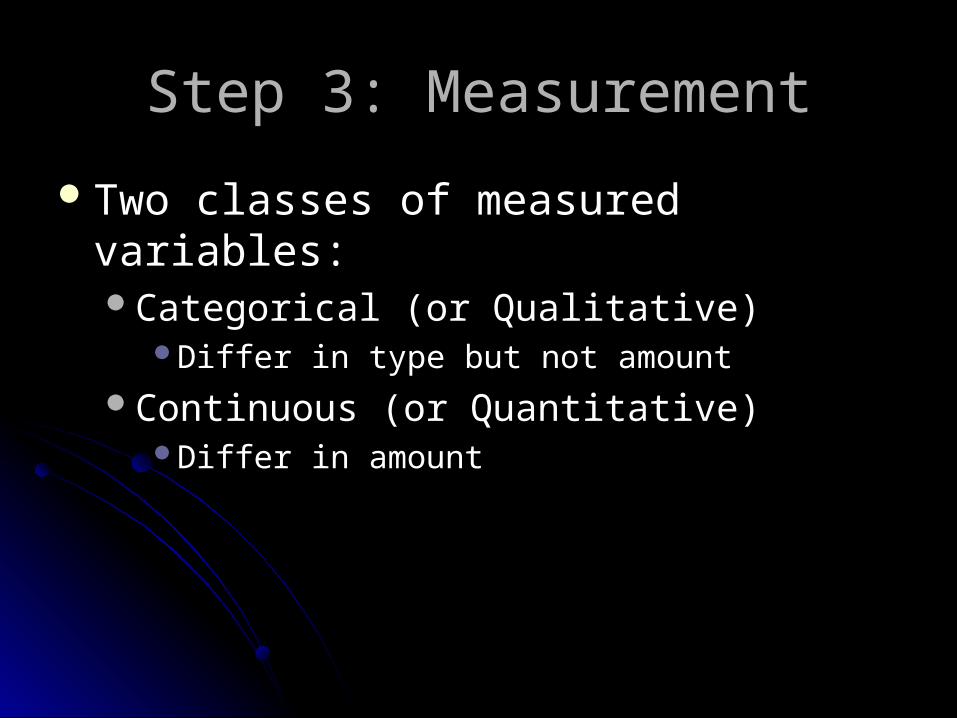
Step 3: MeasurementStep 3: Measurement
Two classes of measured variables:Two classes of measured variables:Categorical (or Qualitative)Categorical (or Qualitative)
Differ in type but not amountDiffer in type but not amount
Continuous (or Quantitative)Continuous (or Quantitative)Differ in amountDiffer in amount
Step 4: Data AnalysisStep 4: Data Analysis
Statistics are what we use to summarize Statistics are what we use to summarize relationship among variables and to estimate relationship among variables and to estimate the odds that they reflect more than mere the odds that they reflect more than mere chancechance Descriptive Statistics: Summarize, organize, and Descriptive Statistics: Summarize, organize, and
describe a sample of data.describe a sample of data. Inferential Statistics: Used to make inferences from Inferential Statistics: Used to make inferences from
sample data to a larger sample or population. sample data to a larger sample or population.
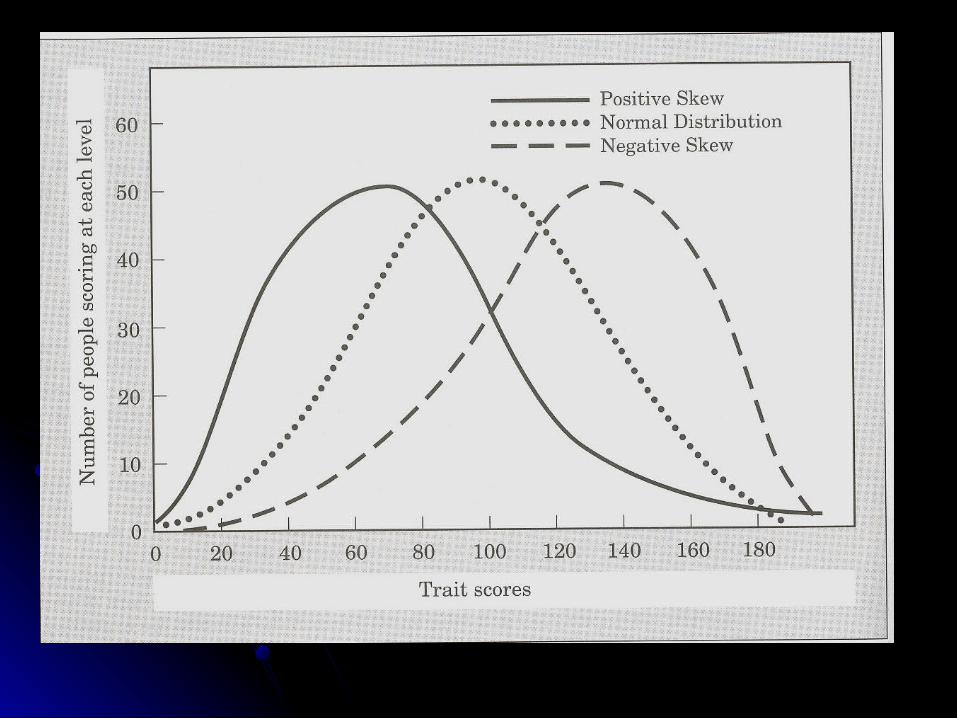
DistributionsDistributions
Descriptive StatisticsDescriptive Statistics
Measures of Central TendencyMeasures of Central TendencyMean, Median, ModeMean, Median, Mode
Measures of VariabilityMeasures of VariabilityRange, Variance, SDRange, Variance, SD
Fre
qu
en
cy
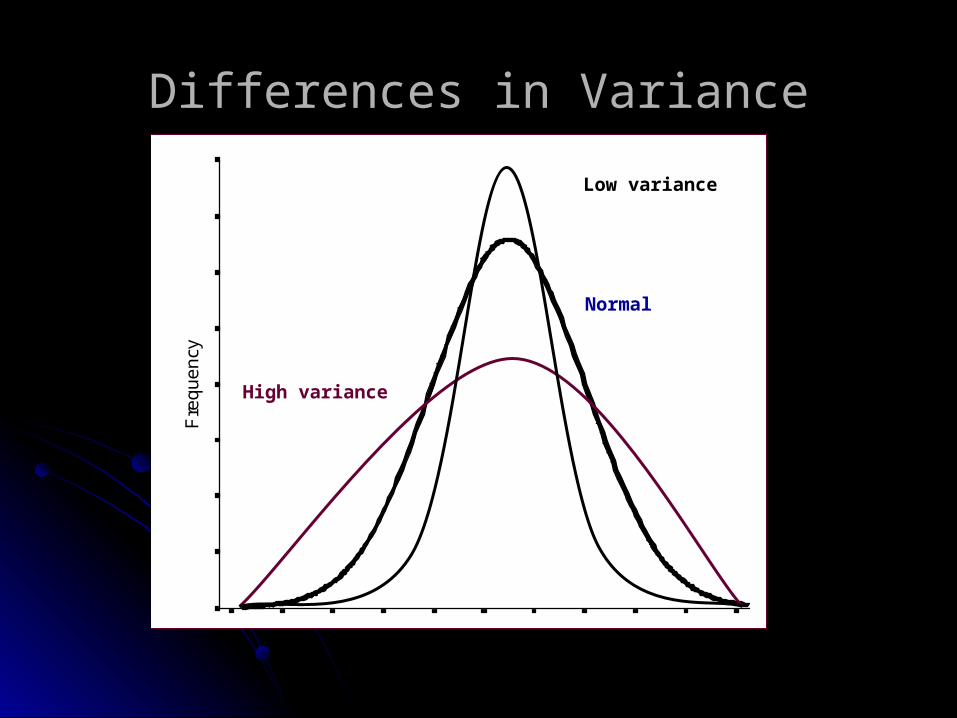
Differences in VarianceDifferences in Variance
High variance
Low variance
Normal
Inferential StatisticsInferential Statistics
Compares a hypothesis to an alternativeCompares a hypothesis to an alternativeStatistical Significance: The likelihood that Statistical Significance: The likelihood that
the observed difference would be obtained the observed difference would be obtained if the null hypothesis were trueif the null hypothesis were true
Statistical Power: Likelihood of finding a Statistical Power: Likelihood of finding a statistically significant difference when a statistically significant difference when a true difference existstrue difference exists

CorrelationCorrelation
CorrelationCorrelationUsed to assess the relationship between 2 Used to assess the relationship between 2
variablesvariablesRepresented by the correlation coefficient “r”Represented by the correlation coefficient “r” r can take on values from –1 to +1r can take on values from –1 to +1
Size denotes the magnitude of the relationshipSize denotes the magnitude of the relationship0 means no relationship0 means no relationship

Correlation and RegressionCorrelation and Regression
CorrelationCorrelationScatterplotScatterplotRegression LineRegression Line
Linear vs. Non-LinearLinear vs. Non-LinearMultiple CorrelationsMultiple CorrelationsCorrelation and CausationCorrelation and Causation
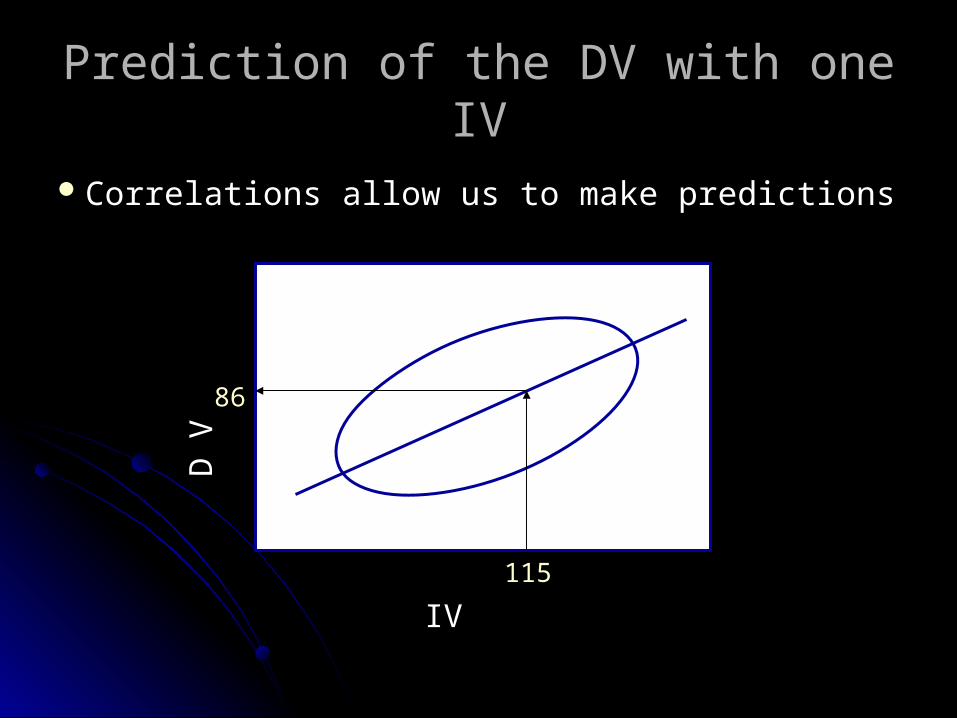
Prediction of the DV with one IVPrediction of the DV with one IV
Correlations allow us to make predictionsCorrelations allow us to make predictions
IV
D V
115
86
Interpretation: Evaluating MeasuresInterpretation: Evaluating Measures
How do you determine the usefulness of How do you determine the usefulness of the information gathered from our the information gathered from our measures?measures?
The Answer:The Answer:Reliability EvidenceReliability EvidenceValidity EvidenceValidity Evidence
Interpretation: Evaluating MeasuresInterpretation: Evaluating Measures
Reliability: Consistency or stability of a measure. Reliability: Consistency or stability of a measure. A measure should yield a similar score each A measure should yield a similar score each
time it is giventime it is given We can get a reliable measure by reducing We can get a reliable measure by reducing
errors of measurement: any factor that affects errors of measurement: any factor that affects obtained scores but is not related to the thing we obtained scores but is not related to the thing we want to measure.want to measure.
Errors of measurementErrors of measurement Random factors, practice effects, etc.Random factors, practice effects, etc.
Evaluating Measures: ReliabilityEvaluating Measures: Reliability
Test-Retest (Index of Stability) Test-Retest (Index of Stability) Method: Give the same test on two occasions and correlate Method: Give the same test on two occasions and correlate
sets of scores (coefficient of stability)sets of scores (coefficient of stability) Error: Anything that differentially influences scores across time Error: Anything that differentially influences scores across time
for the same testfor the same test Issue: How long should the time interval be?Issue: How long should the time interval be? Limitations:Limitations:
Not good for tests that are supposed to assess changeNot good for tests that are supposed to assess change Not good for tests of things that change quickly (i.e., mood)Not good for tests of things that change quickly (i.e., mood) Difficult and expensive to retestDifficult and expensive to retest Memory/practice effects are likelyMemory/practice effects are likely

Evaluating Measures: ReliabilityEvaluating Measures: Reliability
Equivalent Forms (Index of Equivalence) Equivalent Forms (Index of Equivalence) Method: Give two versions of a test and correlate Method: Give two versions of a test and correlate
scores (coefficient of equivalence)scores (coefficient of equivalence)• Reflects the extent to which the two different versions Reflects the extent to which the two different versions
are measuring the same concept in the same wayare measuring the same concept in the same way• Issue: are tests really parallel?; length of interval?Issue: are tests really parallel?; length of interval?• Limitations:Limitations:
• Difficult and expensiveDifficult and expensive• Testing timeTesting time• Unique estimate for each intervalUnique estimate for each interval
Evaluating Measures: ReliabilityEvaluating Measures: Reliability
Internal Consistency ReliabilityInternal Consistency Reliability Method: take a single test and look at how well the Method: take a single test and look at how well the
items on the test relate to each otheritems on the test relate to each other Split-half: similar to alternate forms (e.g., odd vs. even Split-half: similar to alternate forms (e.g., odd vs. even
items)items) Cronbach’s Alpha: mathematically equivalent to the Cronbach’s Alpha: mathematically equivalent to the
average of all possible split-half estimatesaverage of all possible split-half estimates
LimitationsLimitations Only use for multiple item testsOnly use for multiple item tests Some “tests” are not designed to be homogeneousSome “tests” are not designed to be homogeneous Doesn’t assess stability over timeDoesn’t assess stability over time

Evaluating Measures: ReliabilityEvaluating Measures: Reliability
Inter-Rater ReliabilityInter-Rater Reliability Method: two different raters rate the Method: two different raters rate the
same target and the ratings are same target and the ratings are correlatedcorrelated
Correlation reflects the proportion of Correlation reflects the proportion of consistency among the ratingsconsistency among the ratings
• Issue: reliability doesn’t imply accuracyIssue: reliability doesn’t imply accuracy• LimitationsLimitations
• Need informed, trained ratersNeed informed, trained raters• Ratings are not a good way to measure many Ratings are not a good way to measure many
attributesattributes
Interpretation: Evaluating MeasuresInterpretation: Evaluating Measures
Validity: Validity: The accurateness of inferences made based The accurateness of inferences made based
on data.on data.Whether a measure accurately and Whether a measure accurately and
completely represents what was intended to completely represents what was intended to be measured.be measured.
Validity is not a property of the testValidity is not a property of the test It is a property of the inferences we make It is a property of the inferences we make
from the test scoresfrom the test scores
Evaluating Measures: ValidityEvaluating Measures: Validity
Criterion-RelatedCriterion-RelatedPredictivePredictiveConcurrentConcurrent
Content-RelatedContent-RelatedConstruct-RelatedConstruct-RelatedReliability is a necessary but not Reliability is a necessary but not
sufficient condition for validitysufficient condition for validity
Content ValidityContent Validity
The extent to which a predictor provides a The extent to which a predictor provides a representative sample of the thing we’re representative sample of the thing we’re measuringmeasuring
Example: First ExamExample: First Exam Content: history, research methods, criterion theory, Content: history, research methods, criterion theory,
job analysis, measurement in selectionjob analysis, measurement in selection
EvidenceEvidence SME evaluation SME evaluation

Criterion-Related ValidityCriterion-Related Validity
The extent to which a predictor relates to a The extent to which a predictor relates to a criterioncriterion
EvidenceEvidenceCorrelation (called the validity coefficient)Correlation (called the validity coefficient)
A good validity coefficient is around .3 to .4A good validity coefficient is around .3 to .4Concurrent ValidityConcurrent ValidityPredictive ValidityPredictive Validity
Construct ValidityConstruct Validity
The extent to which a test is an accurate The extent to which a test is an accurate representation of the construct it is trying to representation of the construct it is trying to measuremeasure
Construct validity results from the slow Construct validity results from the slow accumulation of evidence (multiple methods)accumulation of evidence (multiple methods)
Evidence:Evidence: Content validity and criterion-related validity can Content validity and criterion-related validity can
provide support for construct validityprovide support for construct validity Convergent validityConvergent validity Divergent (discriminant) validityDivergent (discriminant) validity
Step 5: Conclusions From Step 5: Conclusions From ResearchResearch
You are making inferences!You are making inferences!What if it you’re inferences seem “wrong”?What if it you’re inferences seem “wrong”?
Theory is wrong?Theory is wrong? Information (data) is bad?Information (data) is bad?
Bad measurement?Bad measurement?Bad research design?Bad research design?Bad sample?Bad sample?
Analysis was wrong?Analysis was wrong?
Step 5: Conclusions From Step 5: Conclusions From ResearchResearch
Cumulative ProcessCumulative ProcessDisseminationDissemination
Conference presentations & journal Conference presentations & journal publicationspublications
Boundary conditionsBoundary conditionsGeneralizabilityGeneralizabilityCausationCausation
SerendipitySerendipity
Research EthicsResearch Ethics
Informed consentInformed consentWelfare of subjectsWelfare of subjectsConflicting obligations to the organization Conflicting obligations to the organization
and to the participantsand to the participants


![Turchin [Book] - The Phenomenon of Science](https://img.pdfslide.net/doc/110x75/577d2a551a28ab4e1ea900fd/turchin-book-the-phenomenon-of-science.jpg)