Embed Size (px)
Citation preview
Ion interaction at the interface of Langmuir
monolayers having amine headgroups
Doseok Kim
Department of Physics, Sogang University, Seoul, Korea
http://smos.sogang.ac.kr
July 4, 2017
Soft Matter Summer School, KAIST

2
2
0 0
127.2 eV (2 Ry)
4
eE
a
e -e
a0 = 0.53 A
atomic stability
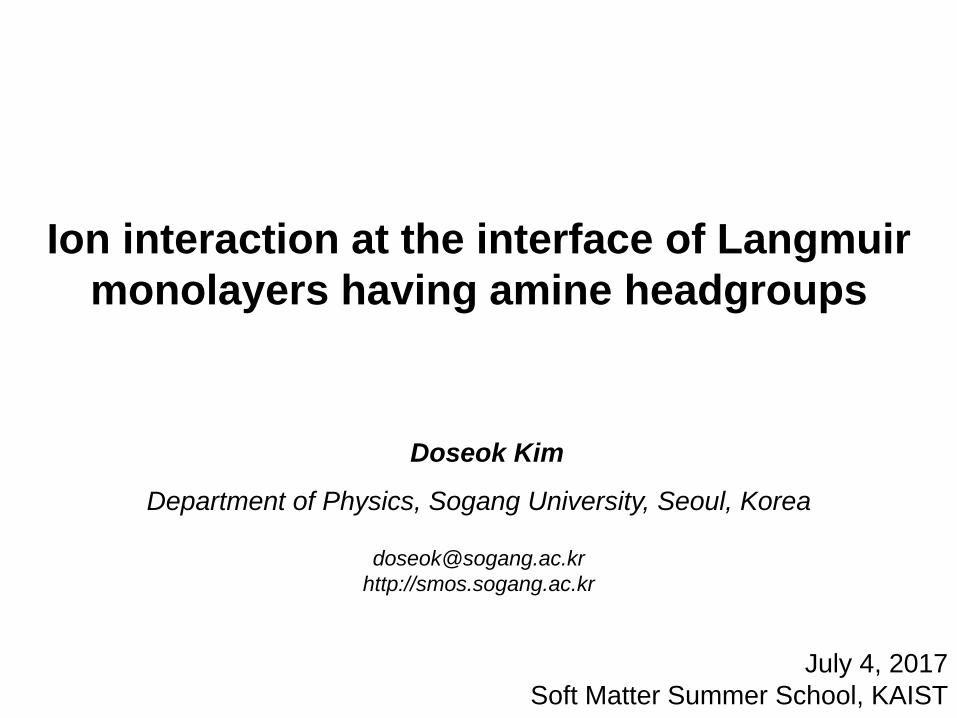
= 80
3
2
room
0 0
1 124 meV
4 13 B
eE k T
a
e -e
13a0 ~ 7 A ~ l B
biological versatility
2
0 0
1~2 eV
4 13
eE
a

1.Introduction
4

5
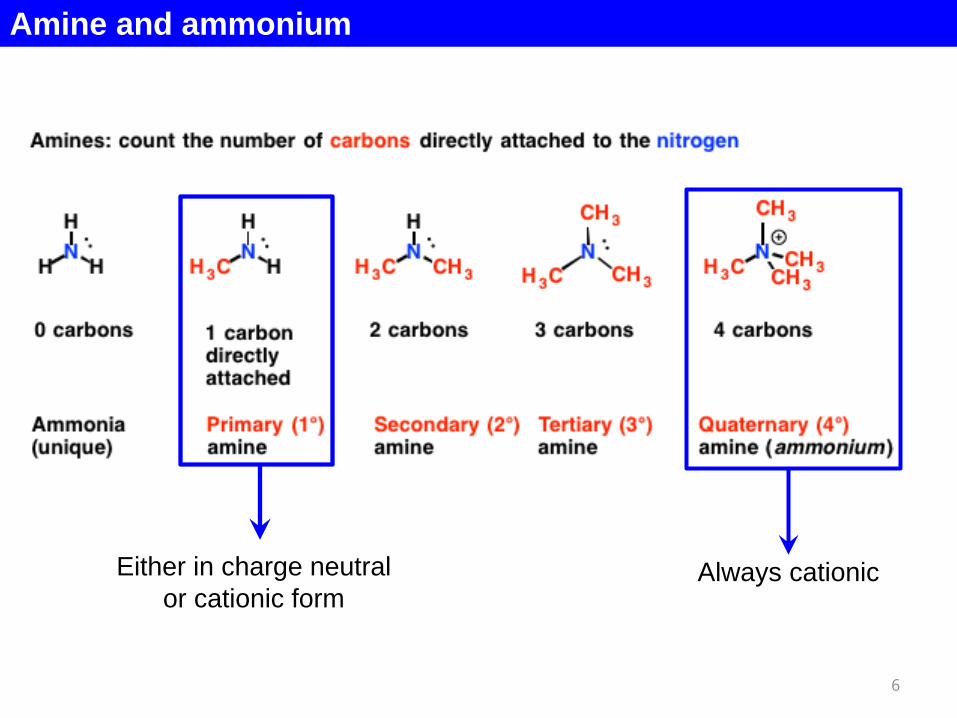
Amine and ammonium
Either in charge neutral
or cationic formAlways cationic
6

Amines and ammoniums in biological systems
Polypeptide chainPeptide bonding
Protein
7

Amines and ammoniums in biological systems
Cell
Lipid bilayer
Lipids : Main building block of cell
8
Cell membrane

Langmuir monolayer: model system mimicking biomembrane
Lipid bilayer Langmuir monolayer
9

Sum-frequency vibrational spectroscopy (SFVS)
2(2)
( ) : ( ) ( )SFG IR Vis eff IR VisI E E
reflects molecular
properties at interface
SFG
Vis
IRx y
z
10
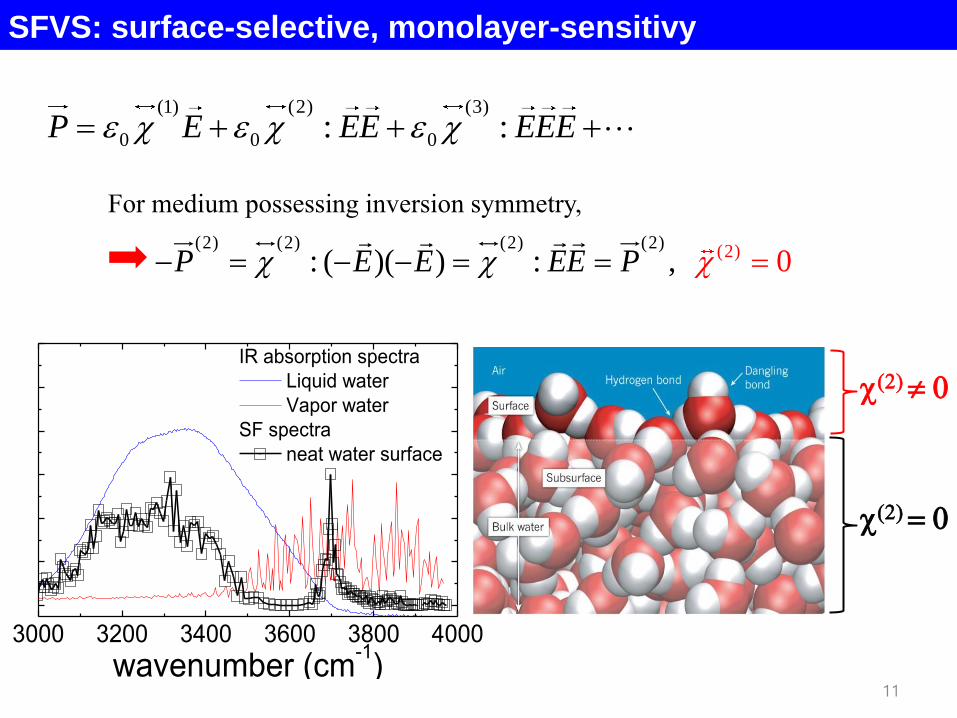
SFVS: surface-selective, monolayer-sensitivy
(1) (2) (3)
0 0 0: :P E EE EEE
(2) (2) (2) (2)(2): ( 0)( ) : , P E E EE P
(2) 0
(2) 0
For medium possessing inversion symmetry,
3000 3200 3400 3600 3800 4000
IR absorption spectra
Liquid water
Vapor water
SF spectra
neat water surface
wavenumber (cm-1)
11

Experimental setup
pump
idler
signal
Sample
(Langmuir monolayer)
Nd-YAG laser (50 ps, 1.064 mm)
LiNbO3 LiNbO3
2.5 - 4 mm, 150 mJ
532 nm,1 mJ
Optical Parametric Generator/Amplifier (OPG/OPA)
KTP
ir
vis
SFG
OPG/OPA
Sample Stage
12
2800 3000 3200 3400 3600
-0.9
-0.6
-0.3
0.0
0.3
0.6
0.9
1.2
-0.9
-0.6
-0.3
0.0
0.3
0.6
0.9
1.2
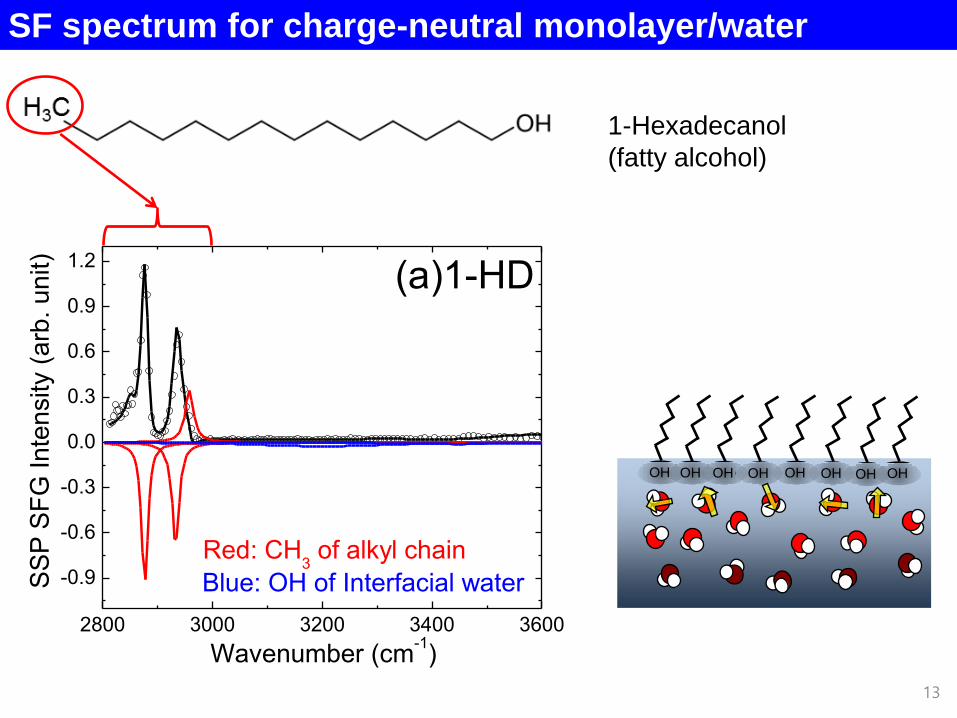
Blue: OH of Interfacial water I
m
(2)
S
SP
SF
G In
ten
sity (
arb
. u
nit)
Wavenumber (cm-1)
(a)1-HD
Red: CH3 of alkyl chain
SF spectrum for charge-neutral monolayer/water
OH OH OH OH OH OHOH OH
1-Hexadecanol
(fatty alcohol)
13
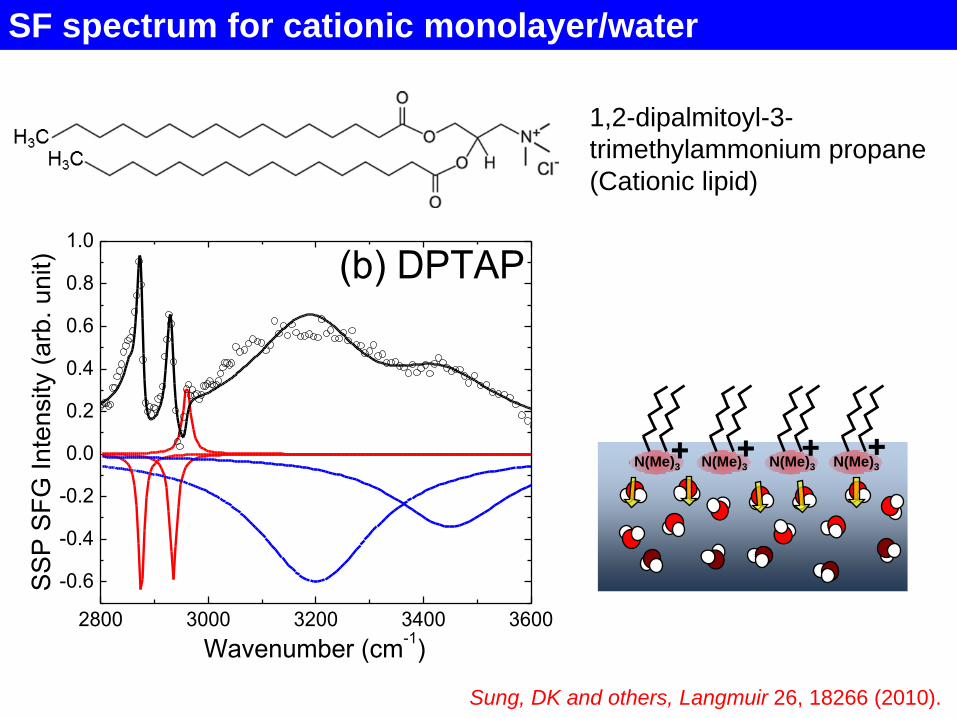
SF spectrum for cationic monolayer/water
2800 3000 3200 3400 3600
-0.6
-0.4
-0.2
0.0
0.2
0.4
0.6
0.8
1.0
-0.6
-0.4
-0.2
0.0
0.2
0.4
0.6
0.8
1.0
Wavenumber (cm-1)
Im
(2)
SS
P S
FG
In
tensity (
arb
. u
nit) (b) DPTAP(b) DPTAP
Sung, DK and others, Langmuir 26, 18266 (2010).
N(Me)3 N(Me)3N(Me)3 N(Me)3
1,2-dipalmitoyl-3-
trimethylammonium propane
(Cationic lipid)
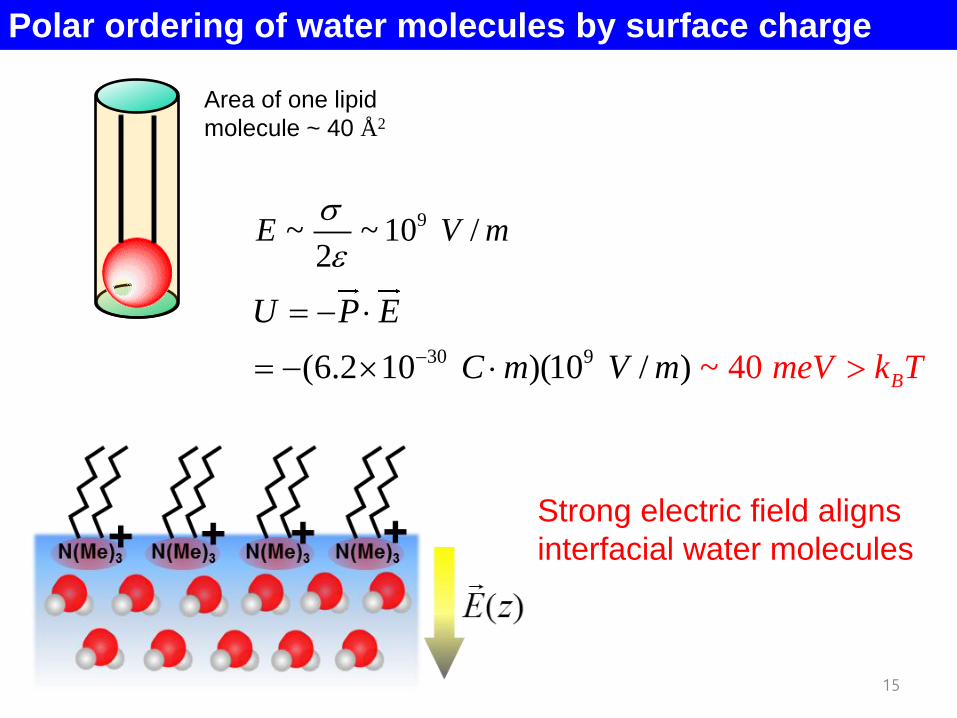
Polar ordering of water molecules by surface charge
Area of one lipid
molecule ~ 40 Å 2
9~ ~ 10 /2
E V m
30 9(6.2 10 )(10 ~ 40 / ) B
U P E
C meV k Tm V m
Strong electric field aligns
interfacial water molecules
15

polar ordering increases SF signal
162800 3000 3200 3400 3600
-0.9
-0.6
-0.3
0.0
0.3
0.6
0.9
1.2
-0.9
-0.6
-0.3
0.0
0.3
0.6
0.9
1.2
Blue: OH of Interfacial water
Im
(2
)
S
SP
SF
G In
ten
sity (
arb
. u
nit)
Wavenumber (cm-1)
(a)1-HD
Red: CH3 of alkyl chain
2800 3000 3200 3400 3600
-0.6
-0.4
-0.2
0.0
0.2
0.4
0.6
0.8
1.0
-0.6
-0.4
-0.2
0.0
0.2
0.4
0.6
0.8
1.0
Wavenumber (cm-1)
Im
(2)
SS
P S
FG
Inte
nsity (
arb
. unit) (b) DPTAP(b) DPTAP

2. Quaternary-amine
monolayer
17
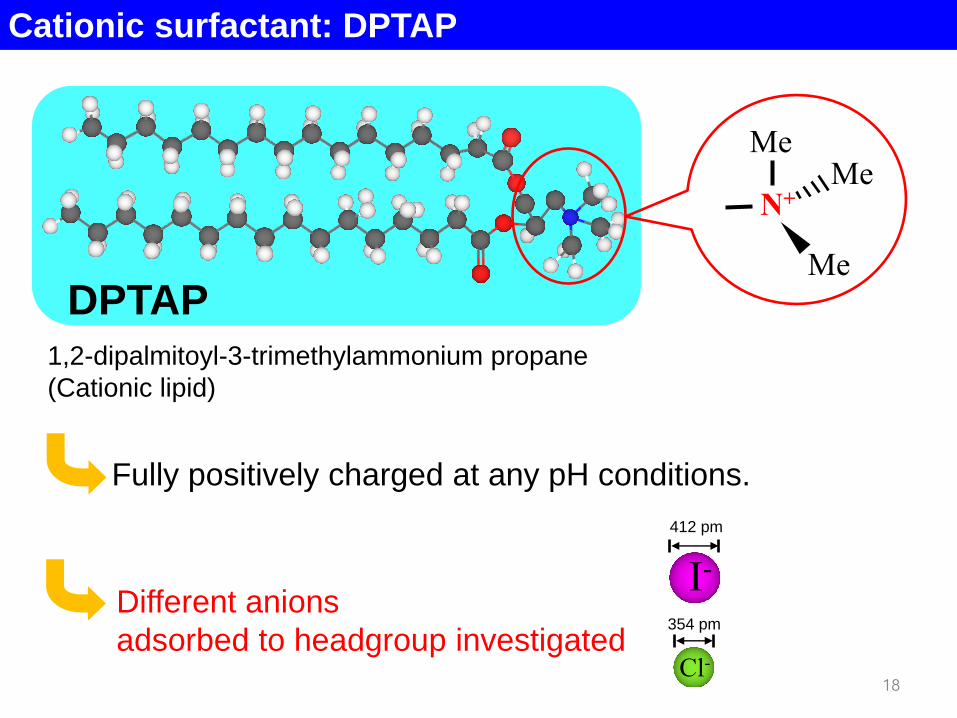
Cationic surfactant: DPTAP
DPTAP
MeMe
Me
N+
Fully positively charged at any pH conditions.
1,2-dipalmitoyl-3-trimethylammonium propane
(Cationic lipid)
Cl-
I-
412 pm
354 pm
Cl-
Different anions
adsorbed to headgroup investigated
18
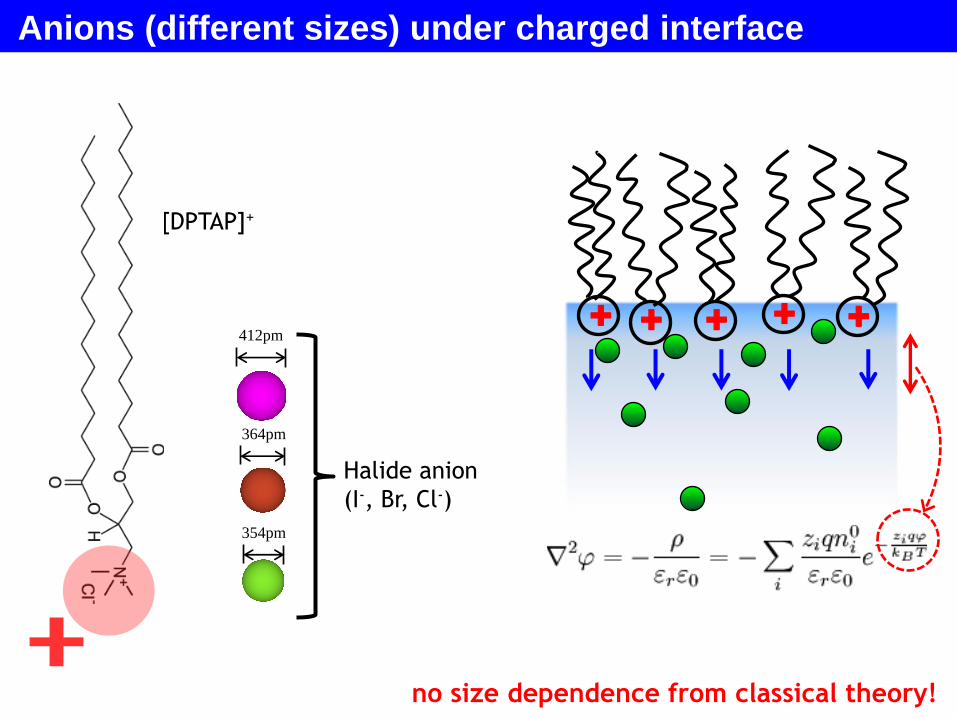
Halide anion
(I-, Br, Cl-)
354pm
364pm
412pm
[DPTAP]+
Anions (different sizes) under charged interface
no size dependence from classical theory!
++ ++ +
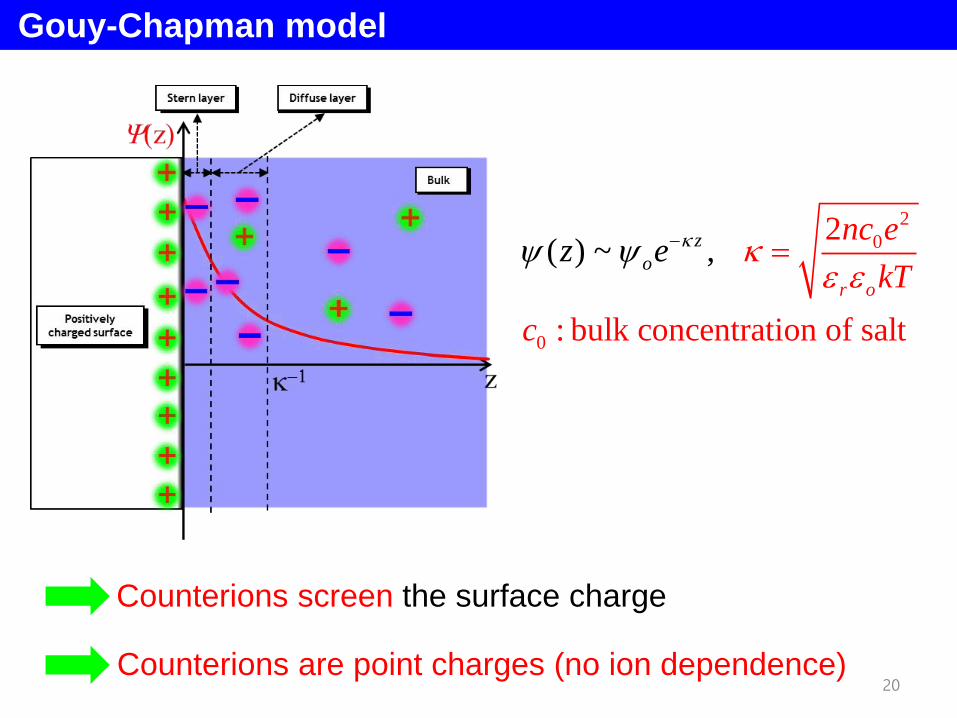
Gouy-Chapman model
2
0
0
2
: bul
( ) ~
k concentrati
,
on of salt
z
o
r o
z enc e
kT
c
Counterions screen the surface charge
Counterions are point charges (no ion dependence)20

20 30 400
10
20
30
40
50
60
70
S
urf
ace
Pre
ssure
(m
N/m
)
Surface Area (A2 / chain)
NaI (10 mM)/DPTAP
NaBr (10 mM)/DPTAP
NaCl (10 mM)/DPTAP
Water/DPTAP
- Pressure decreased in salt solutions
- Pressure decreased more for larger halide anion
Cl-Br -
I -
Pressure-area (-A) isotherm

adding ions in water
Sung, DK, and others, J. Phys. Chem. C 119, 7130 (2015).
Counterions decrease
SF intensity of the OH band.
Larger anions (I-) disturb
water dipole orientation more.

2800 2900 3000 3100 3200 3300 3400 3500 36000.0
0.5
1.0
1.5
2.0
2.5
3.0
3.5
Pure water
10 uM NaI
100 uM NaI
1 mM NaI
10 mM NaI
100 mM NaI
SS
P S
FG
Inte
nsity (
arb
. unit)
IR wavenumber (cm-1)
2800 2900 3000 3100 3200 3300 3400 3500 36000.0
0.5
1.0
1.5
2.0
2.5
3.0
3.5
Neat water (x5)
Pure water
10 uM NaCl
100 uM NaCl
1 mM NaCl
10 mM NaCl
IR wavenumber (cm-1)
SS
P S
FG
Inte
nsity (
arb
. unit)
100 mM NaCl
Detailed concentration dependence
DPTAP full monolayers
on NaCl solutionsDPTAP full monolayers
on NaI solutions
23
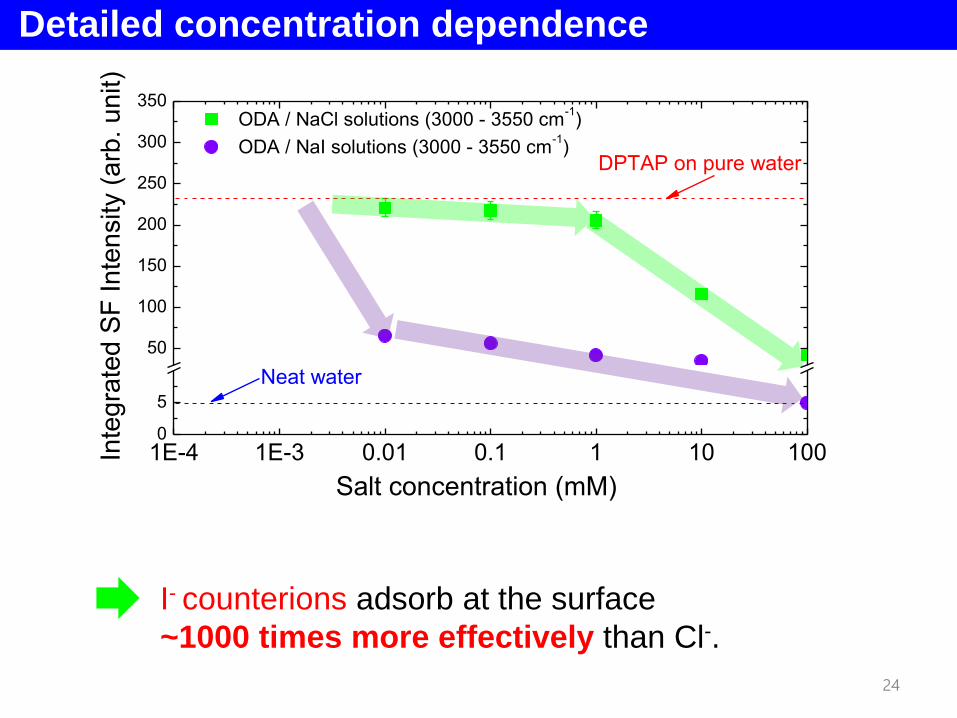
1E-4 1E-3 0.01 0.1 1 10 1000
5
50
100
150
200
250
300
350
Neat water
Salt concentration (mM)
DPTAP on pure water
Inte
gra
ted
SF
In
ten
sity (
arb
. u
nit)
ODA / NaCl solutions (3000 - 3550 cm-1)
ODA / NaI solutions (3000 - 3550 cm-1)
I- counterions adsorb at the surface
~1000 times more effectively than Cl-.
24
Detailed concentration dependence

So there is a strong evidence (from the change of OH signal)
of counterion adsorption,
can we see the excess halide ions directly?

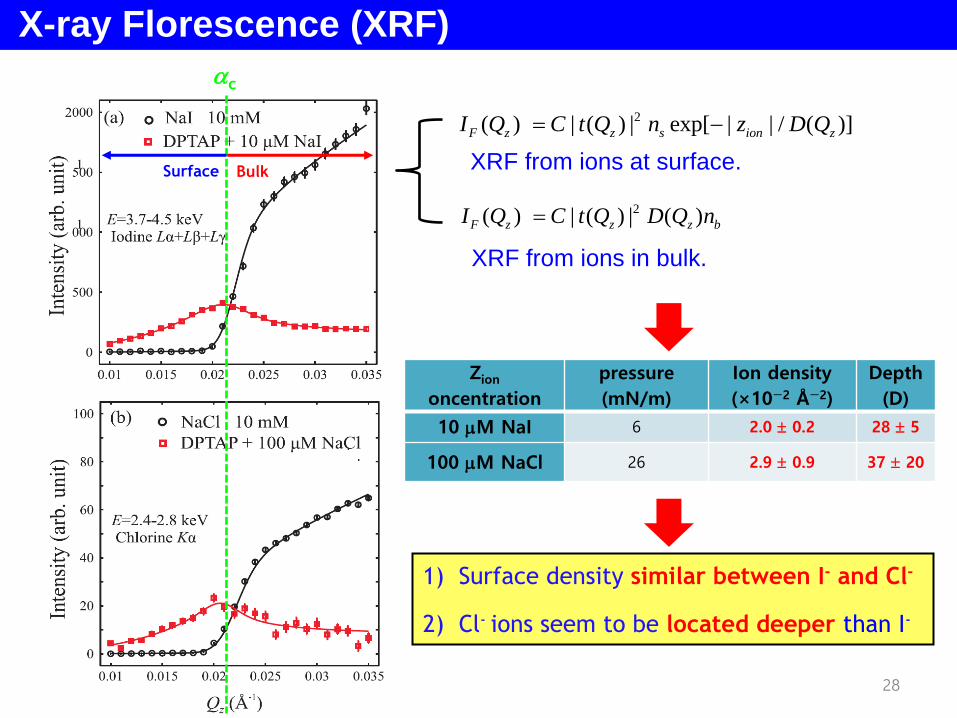
X-ray Florescence (XRF)
z
penetration depth
below c: 6 – 8 nm
Bu and Vaknin, J. Appl. Phys. 105, 084911 (2009).
Cu emission
(8.05keV)
Cl- emission (K-lines ~2.8 keV)
I- emission (L-lines ~3.5−5.0 keV)
c = 0.8o at Qz = 0.022A-1
1- ~= 1-10-4
W. Wang and D. Vaknin in Ames
26

Bulk XRFSurface XRF
c
XRF: Direct measurement of adsorbed counterions
Surface adsorption of I - observed
Wang, DK and others, JPCB (2013)
BulkSurface
c
Zion
oncentration
pressure
(mN/m)
Ion density
(×10−2 Å−2)
Depth
(D)
10 mM NaI 6 2.0 0.2 28 5
100 mM NaCl 26 2.9 0.9 37 20
2( ) | ( ) | exp[ | | / ( )]F z z s ion zI Q C t Q n z D Q
2( ) | ( ) | ( )F z z z bI Q C t Q D Q n
XRF from ions in bulk.
XRF from ions at surface.
28
X-ray Florescence (XRF)
1) Surface density similar between I- and Cl-
2) Cl- ions seem to be located deeper than I-
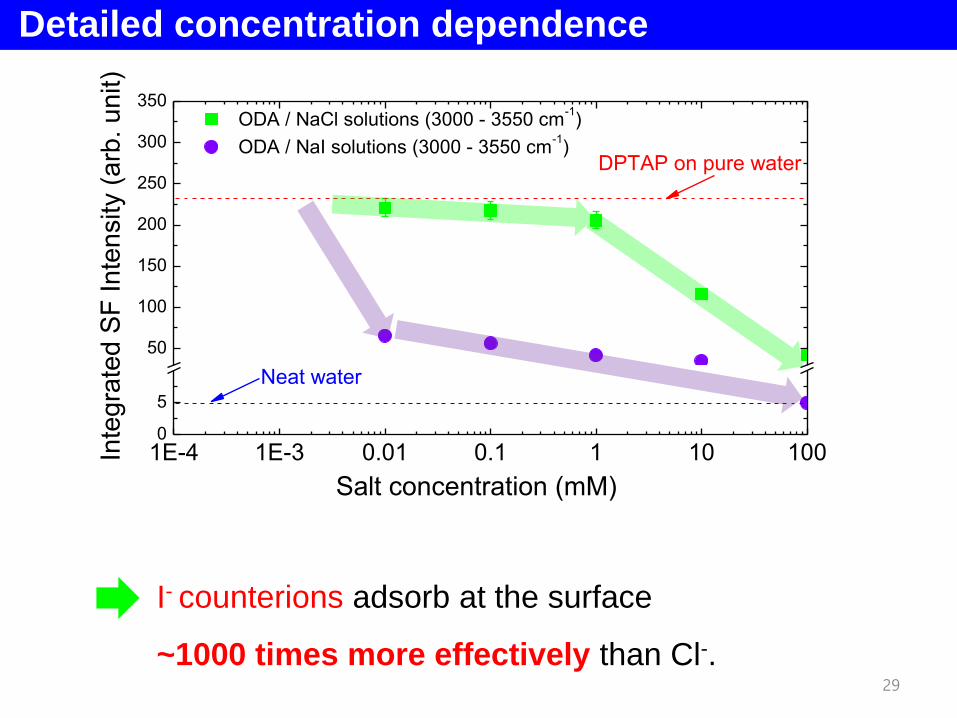
1E-4 1E-3 0.01 0.1 1 10 1000
5
50
100
150
200
250
300
350
Neat water
Salt concentration (mM)
DPTAP on pure water
Inte
gra
ted
SF
In
ten
sity (
arb
. u
nit)
ODA / NaCl solutions (3000 - 3550 cm-1)
ODA / NaI solutions (3000 - 3550 cm-1)
I- counterions adsorb at the surface
~1000 times more effectively than Cl-.29
Detailed concentration dependence

Why does X-ray seem to contradict SFG?
- X-ray probes 6 ~ 8 nm (by evanescent wave)
- SFG can probe only where inversion symmetry is broken
X-ray
SFG
X-ray
SFG

Monolayer structure: X-ray reflectivity

High e- density:
Headgroups and ionsLow e- density:
Hydrocarbon tails
Surface structure of DPTAP monolayer
NaCl:
lateral ordering
disturbed by Cl- adsorption
no salt (counter ions):
well-ordered monolayerNaI:
disruption becomes more
severe due to adsorbed I-
- - -- -- - -

Alkyl chain conformation by SFG
2800 2900 3000 3100
Increasing
area/molecule
CH2,s CH2,as
CH3,s CH3,fr
Sung, DK and others, Langmuir (2010)
Neat monolayer: only terminal methyl (CH3) groups contribute to SFG
Disordered monolayer: methylene (CH2) groups contribute to SFG
34
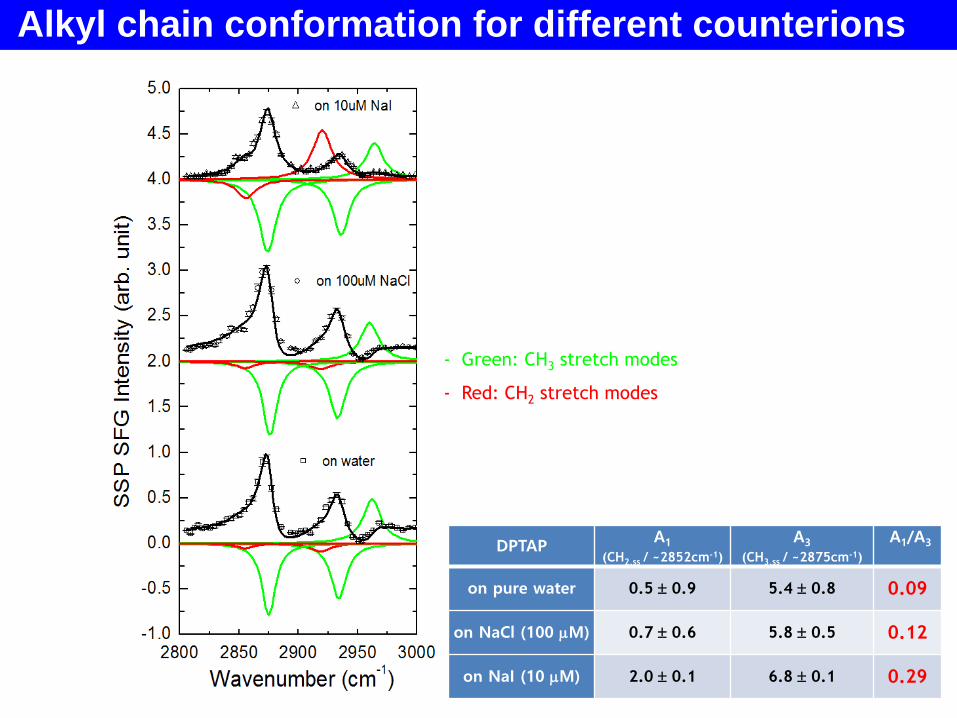
Alkyl chain conformation for different counterions
- Green: CH3 stretch modes
- Red: CH2 stretch modes
DPTAP A1
(CH2,ss / ~2852cm-1)
A3
(CH3,ss / ~2875cm-1)
A1/A3
on pure water 0.5 0.9 5.4 0.8 0.09
on NaCl (100 mM) 0.7 0.6 5.8 0.5 0.12
on NaI (10 mM) 2.0 0.1 6.8 0.1 0.29

1. Surface excess of halide anions on charged interface:
- by surface SFG
- direct observation of the anions by X-ray
2. I-: direct adsorption to the headgroup
Cl-: broadly distributed over the double layer
3. X-ray and surface nonlinear optics are
complementary tools for surface science
Conclusion
Sung, DK and others, JPCC (2015)
X-ray
SFG

36
Growth of Au nanorods

37
Why does the rod only grow along the length direction?

38
Use of CTAB surfactant in the growth of Au nanorods

TEM images of Au nanocrystals
T. K. Sau, C. J. Murphy, Philos. Mag. 2007, 87, 2143
CTA-Cl [0.1M] CTA-Br [0.1 M]
Garg et al. Langmuir 2010, 26, 10271

3. Primary-amine
monolayer
40
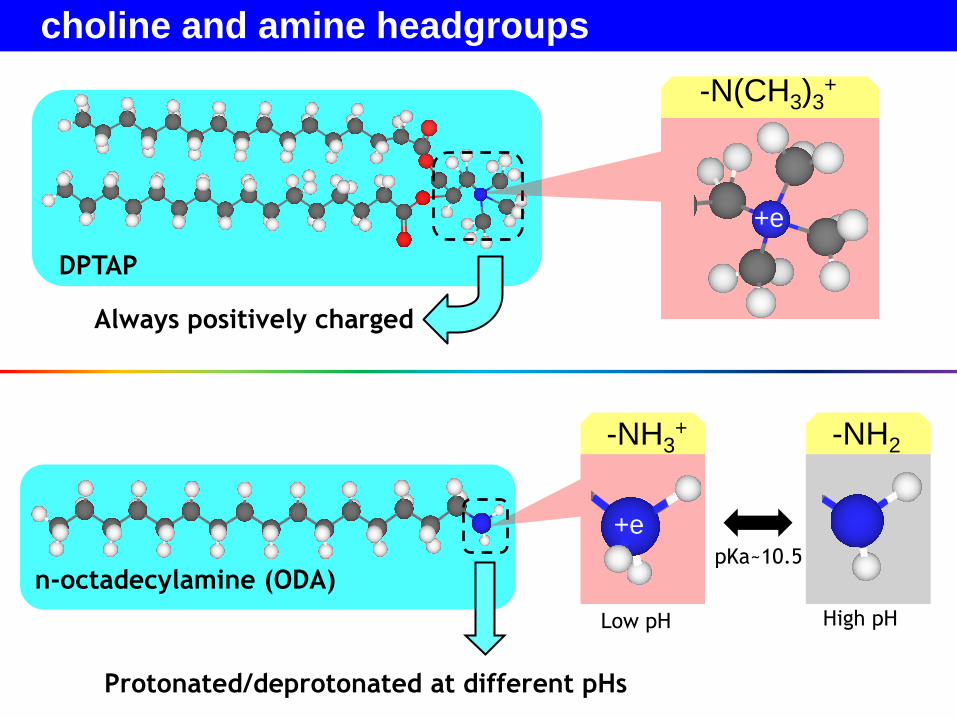
DPTAP
Always positively charged
-N(CH3)3+
+e
choline and amine headgroups
n-octadecylamine (ODA)
Protonated/deprotonated at different pHs
+e
-NH3+ -NH2
High pHLow pH
pKa~10.5

n-octadecylamine (ODA) on water
Surface area~20Å 2/molecule
Langmuir trough 42
pH changed by
adding HCl or NaOH

ODA/water interface: pH dependence
2850 3000 3150 3300 3450
0
1
2
3
4
5
6
7
8
2850 2900 2950 3000
pH 2.0
pH 3.0
pH 3.5
pH 5.7
pH 9.0
pH 10.0
pH 11.0
Wavenumber (cm-1)
SS
P S
FG
Inte
nsity (
arb
. unit)
pH 11.0
pH 2.0
CH3 CH3
CH2CH2
Mostly trans
Gauche defects
OH water band intensity
increases at low pHs
Langmuir 31, 13753 (2015). 43

Isotherm compression curves
3D: PV ~ nRT
Langmuir trough
2D: A ~ nRT (gas phase)10 20 30 40 50
0
10
20
30
40
50
60
70
pH 2
pH 3
pH 3.5
Surf
ace P
ressu
re (
mN
/m)
Surface Area (A2/molecule)
pH 5.7
10 15 20 250
10
20
30
40
50
60
pH 4.0 pH 3.0 pH 2.75
pH 2.5 pH 2.25 pH 2.0
44

Isotherm compression curves
10 20 30 40 500
10
20
30
40
50
60
70
pH 2
pH 3
pH 3.5
S
urf
ace
Pre
ssu
re (
mN
/m)
Surface Area (A2/molecule)
pH 5.7
10 15 20 250
10
20
30
40
50
60
pH 4.0 pH 3.0 pH 2.75
pH 2.5 pH 2.25 pH 2.0
N
HH
Limitation area
~ 20 Å
Surface pressure increases again below pH 3
No surface pressure at pH ~ 3.5.
45

At pH 3.5 …
3000 3200 3400 3600 38000.0
0.1
0.2
0.3
0.4
0.5
0.6
S
SP
SF
G I
nte
nsity (
arb
. u
nit)
Wavenumber (cm-1)
ODA monolayer/water, pH 3.5
ODA monolayer/water, pH 5.7 (x5)
Air/neat water, pH 5.7 (x5)
N
HH𝐇+
enhancement of water OH band indicates the
existence of ODA molecules at air/water interface.
Free
OH
46
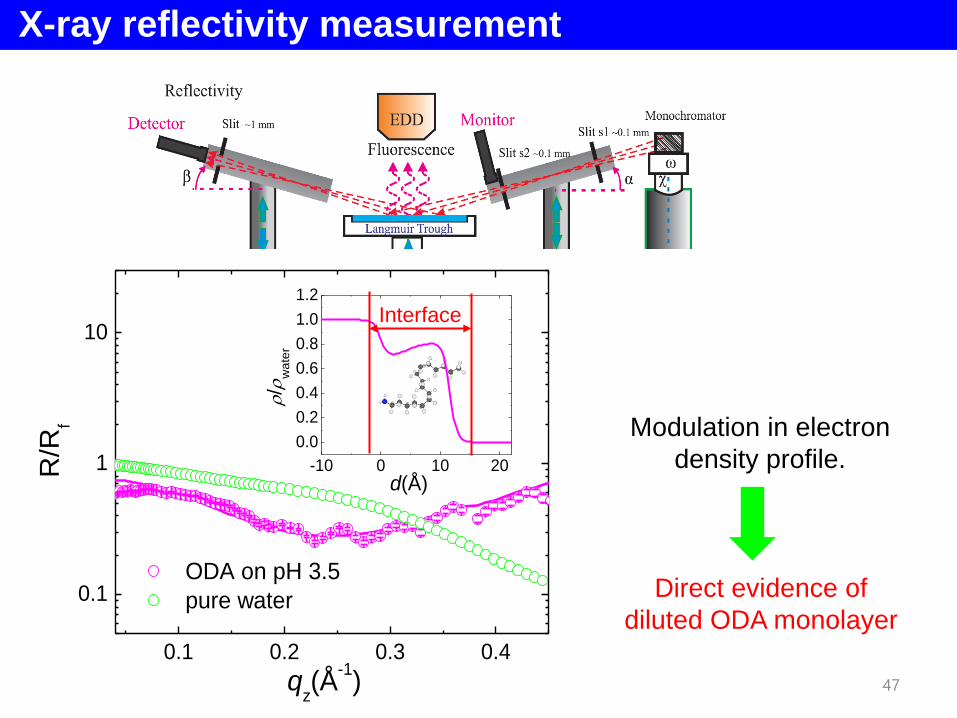
X-ray reflectivity measurement
-10 0 10 20
0.0
0.2
0.4
0.6
0.8
1.0
1.2
/
wa
ter
d(Å )
0.1 0.2 0.3 0.4
0.1
1
10
R/R
f
qz(Å
-1)
ODA on pH 3.5
pure water
Interface
Modulation in electron
density profile.
Direct evidence of
diluted ODA monolayer
47

ODA on D2O/H2O mixture
2800 3000 3200 3400 36000.00
0.02
0.04
0.06
0.08
0.10S
SP
SF
G Inte
nsity (
arb
.unit)
Wavenumber (cm-1)
ODA on pH 3.5 (D2O/H
2O=90/10)
2800 2840 2880 2920 2960 30000.00
0.02
0.04
CH2,asCH2,ss
existence of disordered ODA molecules48

Reminder: pH dependence
2800 3000 3200 3400 36000.0
0.2
0.4
0.6
0.8
1.0
SS
P S
FG
Inte
nsity (
arb
.unit)
Wavenumber (cm-1)
ODA monolayers
on pure water (pH 5.7)
on pH 2.0 water
on pH 3.5 water
+ + ++ +++
pH 5.7 pH 3.5 pH 2.0
Why does the CH signal appear again at lower pH?49

Conjecture: Effect from Cl- ions
HCl
H3O+
Cl-
H3O+Cl-
H2O
H2O
H2O
H2O
H2O
50

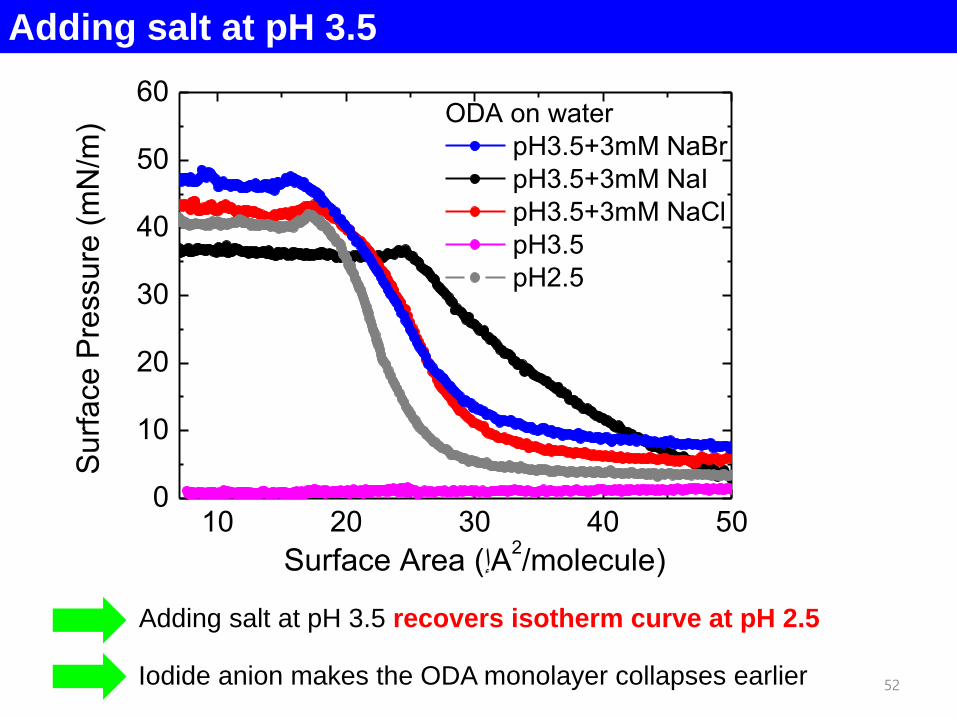
Adding salt at pH 3.5
2800 3000 3200 3400 3600 38000.0
0.5
1.0
1.5
SS
P S
FG
Inte
nsity (
arb
. unit)
Wavenumber (cm-1)
ODA at pH 3.5 3mM NaCl
3mM NaBr
3mM NaI
without salt
pH 3.5 + 3 mM
NaCl gives
same Cl- anion
concentration as
water at pH 2.5
Adding 3 mM NaX salt recovers CHx bands. 51
10 20 30 40 500
10
20
30
40
50
60
Su
rfa
ce
Pre
ssu
re (
mN
/m)
Surface Area (إA2/molecule)
ODA on water
pH3.5+3mM NaBr
pH3.5+3mM NaI
pH3.5+3mM NaCl
pH3.5
pH2.5
Adding salt at pH 3.5 recovers isotherm curve at pH 2.5
Iodide anion makes the ODA monolayer collapses earlier 52
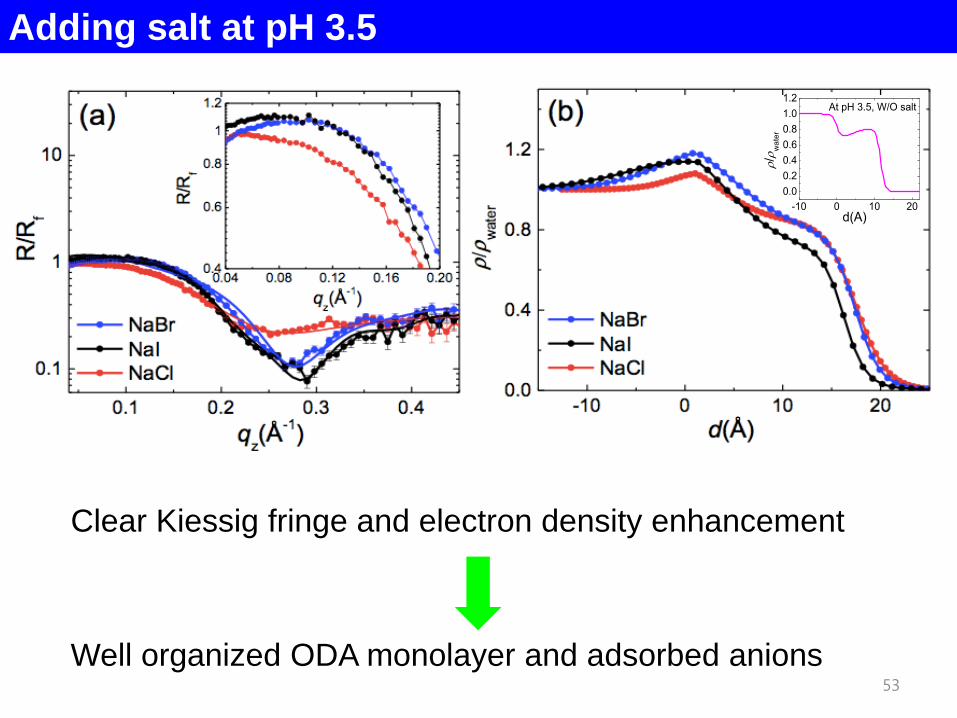
Adding salt at pH 3.5
-10 0 10 20
0.0
0.2
0.4
0.6
0.8
1.0
1.2
/
wa
ter
d(A)
At pH 3.5, W/O salt
Clear Kiessig fringe and electron density enhancement
Well organized ODA monolayer and adsorbed anions53
Adding salt at pH 3.5

Conclusion
pH > 5 3 < pH < 5 pH < 3
1) Effective pKa of ODA in Langmuir monolayer (pKa ~ 5) is much lower
than its bulk value (pKa ~ 10.5).
2) When protonation of ODA amine happens (at low pH),
the monolayer becomes unstable.
3) Surface enrichment of counter Cl- ions stabilizes the ODA monolayer.
54

4. Primary-amine monolayer
with salt addition
55

2800 2900 3000 3100 3200 3300 3400 3500 36000.0
0.5
1.0
1.5
2.0
2.5
3.0
3.5
Pure water
10 uM NaCl
100 uM NaCl
1 mM NaCl
10 mM NaCl
IR wavenumber (cm-1)
SS
P S
FG
Inte
nsity (
arb
. unit)
100 mM NaCl
Y(z)
Reminder: salt adsorbed on cationic surface
z
2
0
0
2( ) ~ ,
: salt concentration
z
o
r o
c ez e
kT
c
0c
DPTAP/NaCl solution
56

2800 2900 3000 3100 3200 3300 3400 3500 36000.0
0.5
1.0
IR Wavenumber (cm-1)
SS
P S
FG
Inte
nsity (
arb
. unit)
Mostly charge neutral monolayer
57
ODA on pure water

2800 2900 3000 3100 3200 3300 3400 3500 36000.0
0.5
1.0
1.5
2.0
2.5
3.0
3.5
DPTAP (x1)
100 mM
10 mM
10 uM
100 uM
No Salt
1 mM
IR Wavenumber (cm-1)
SS
P S
FG
Inte
nsity (
arb
. unit)
2800 2900 3000 3100 3200 3300 3400 3500 36000.0
0.5
1.0
1.5
2.0
2.5
3.0
3.5
No Salt
10 uM
100 uM
1 mM
10 mM
100 mM
IR Wavenumber (cm-1)
SS
P S
FG
Inte
nsity (
arb
. unit)
Neat water (x5)
ODA / NaCl and NaI solutions
58
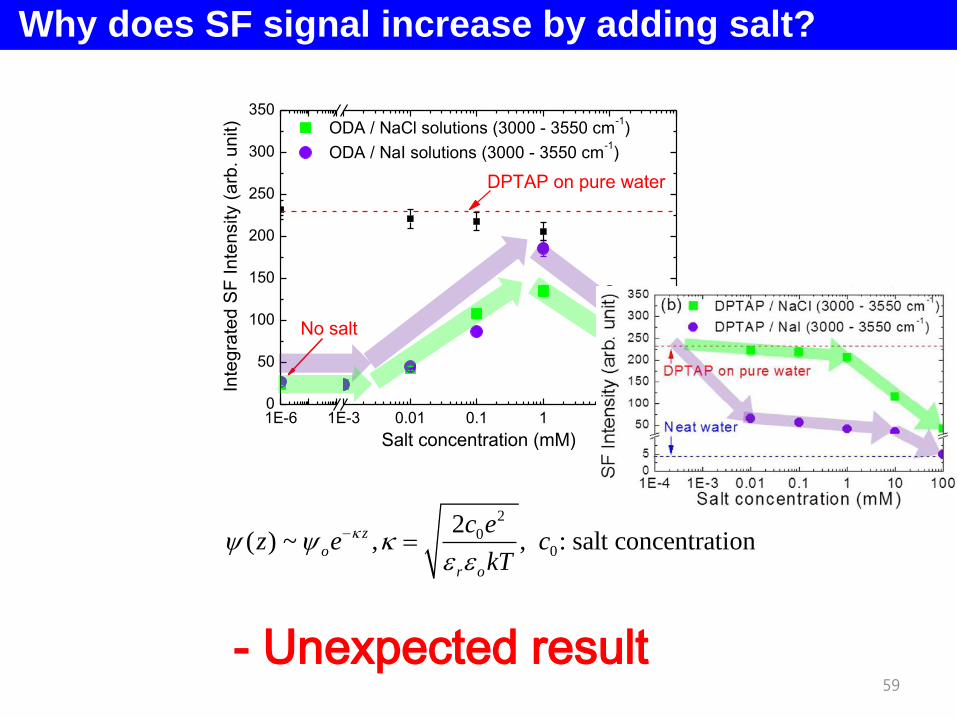
Why does SF signal increase by adding salt?
2
00
2( ) ~ , , : salt concentration
z
o
r o
c ez e c
kT
- Unexpected result
1E-6 1E-3 0.01 0.1 1 10 1000
50
100
150
200
250
300
350
ODA / NaCl solutions (3000 - 3550 cm-1)
ODA / NaI solutions (3000 - 3550 cm-1)
Inte
gra
ted
SF
In
ten
sity (
arb
. u
nit)
Salt concentration (mM)
No salt
DPTAP on pure water
59
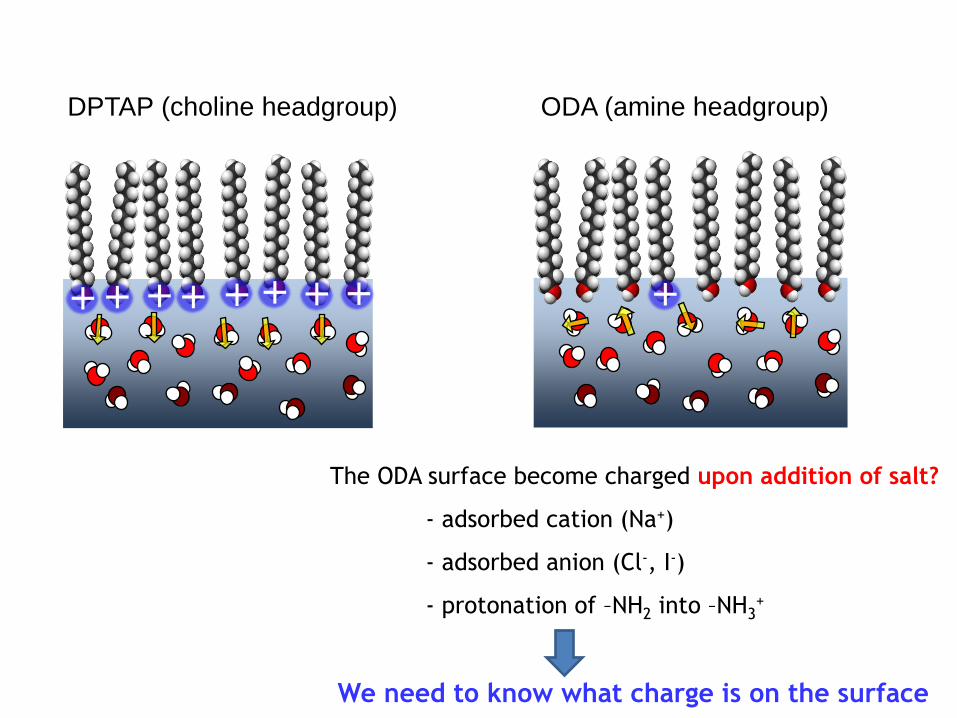
+
ODA (amine headgroup)
The ODA surface become charged upon addition of salt?
- adsorbed cation (Na+)
- adsorbed anion (Cl-, I-)
- protonation of –NH2 into –NH3+
We need to know what charge is on the surface
DPTAP (choline headgroup)
++ ++ + +++

Wei bu et al. J. Phys. Chem. Lett. 1, 1936 (2010).
Previous XRF study – only anions
I-Cs+
Only anions at the surface !
Bu et al. J. Phys. Chem. Lett. 1, 1936 (2010).61

square measurement is not enough to determine the phase
I() = |E()|2 = |- E()|2
I() = |ELO() + E()|2 = ILO() + I() + 2Re(ELO()E*())
≠ |ELO() - E()|2 = ILO() + I() - 2Re(ELO()E*())
Interference by introducing
the local oscillator field, ELO()

Phase sensitive (PS)-SFVS
2
2 2
* *
( ) i t
SF sample LO
sample L
i t i t
LO sample LO sample
O
E E e
I E E e
E E
E E e
2
SF sampleI E
Direct measurement of sum-frequency E-field, not |E|2
63

Nihonyanagi et al. J. Chem. Phys. 130, 204704 (2009).
2
2 2 * *
2wher ( ) 1e,
i
sample LO
i i
sample LO LO
F
sample LO sam le
S
p
E E e
E E E E e
n d
E E e
monochromator
CCD
Camera
(Constructive)
(Destructive)
Schematics of PS-SFVS

2( 1)FSn d
Interference fringe from the reference (z-cut quartz)
-3000 -2000 -1000 0 1000 2000 3000-2.00E+008
-1.00E+008
0.00E+000
1.00E+008
2.00E+008
SF
G Inte
nsity (
arb
. un
it)
Time (fs)
FT real part
FT imaginary part
1200 1400 1600 1800 2000 2200 2400
ImFTSFGref
ReFTSFGref
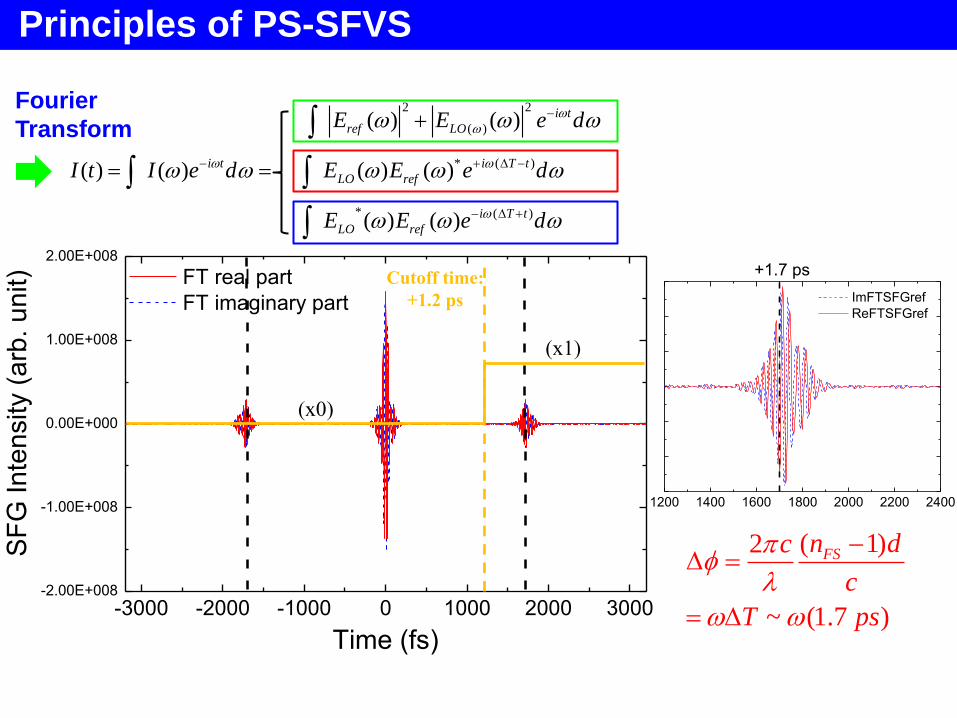
+1.7 psCutoff time:
+1.2 ps
(x1)
(x0)
Fourier
Transform2 2
( )
* ( )
* ( )
( ) ( )
( ) ( ) ( ) ( )
( ) ( )
i t
ref LO
i t i T t
LO ref
i T t
LO ref
E E e d
I t I e d E E e d
E E e d
( 1)2
~ (1.7 )
FSn dc
c
T ps
Principles of PS-SFVS
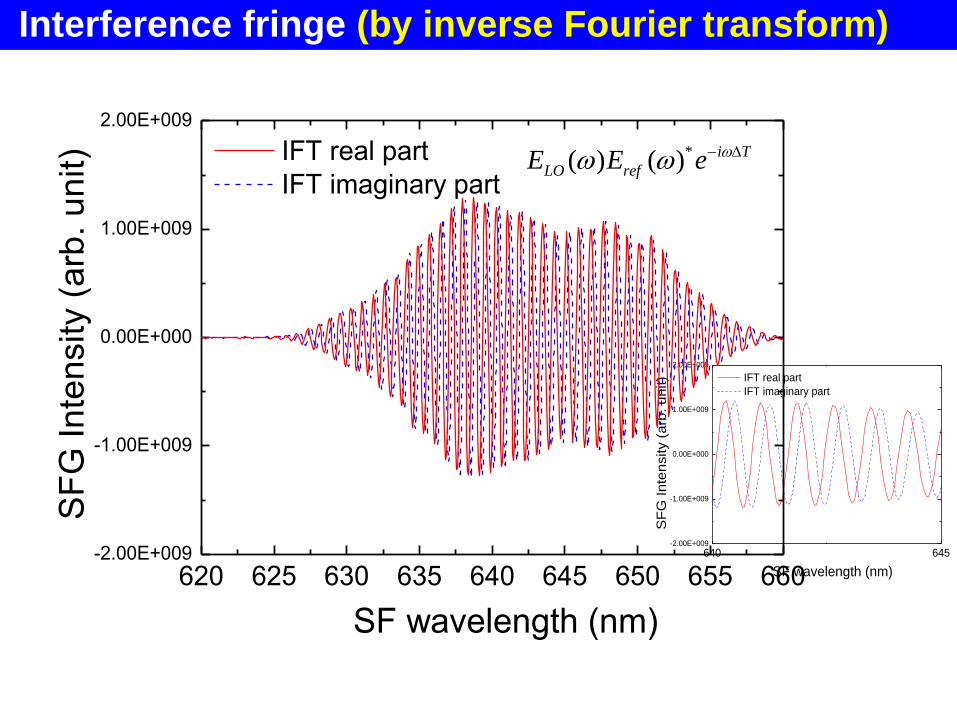
*( ) ( ) i T
LO refE E e
640 645-2.00E+009
-1.00E+009
0.00E+000
1.00E+009
2.00E+009
SF
G In
ten
sity (
arb
. u
nit)
SF wavelength (nm)
IFT real part
IFT imaginary part
620 625 630 635 640 645 650 655 660-2.00E+009
-1.00E+009
0.00E+000
1.00E+009
2.00E+009
SF
G Inte
nsity (
arb
. un
it)
SF wavelength (nm)
IFT real part
IFT imaginary part
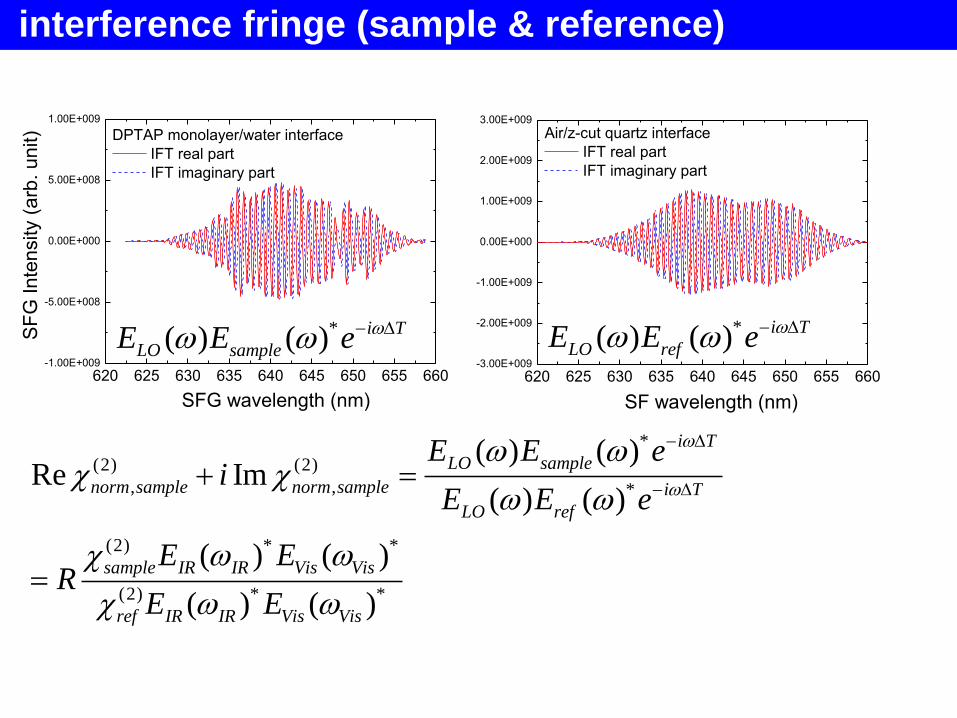
Interference fringe (by inverse Fourier transform)
620 625 630 635 640 645 650 655 660-1.00E+009
-5.00E+008
0.00E+000
5.00E+008
1.00E+009
SF
G In
ten
sity (
arb
. u
nit)
SFG wavelength (nm)
DPTAP monolayer/water interface
IFT real part
IFT imaginary part
*( ) ( ) i T
LO sampleE E e
620 625 630 635 640 645 650 655 660-3.00E+009
-2.00E+009
-1.00E+009
0.00E+000
1.00E+009
2.00E+009
3.00E+009
SF wavelength (nm)
Air/z-cut quartz interface
IFT real part
IFT imaginary part
*( ) ( ) i T
LO refE E e
*
(2) (2)
, , *
(2) * *
(2) * *
( ) ( )Re Im
( ) ( )
( ) ( )
( ) ( )
i T
LO sample
norm sample norm sample i T
LO ref
sample IR IR Vis Vis
ref IR IR Vis Vis
E E ei
E E e
E ER
E E
interference fringe (sample & reference)

(2
2 22 2
)(( )
()
(~
))
q
q IR
q
SFG NR
q I
q IR q
q IRq qq qR qq
A
i
AAE
i
When molecules at interface are excited resonantly by IR,
Non-resonant
contribution
(very weak)
Im (2)R
(determines sign of Aq
directly)
Resonant contribution,
(2)R
(damped oscillation)
Re (2)R
^ ^ ^^ ^ ^(2) (2)
, ,
( )( )( )( )
iNR
i IR i i
sNA
i j ki
Molecular moiety
orientation
ensemble average over molecules
Sum-frequency field

2800 2900 3000 3100 3200 3300 3400 3500-5.0
-2.5
0.0
2.5
5.0
SF
fie
ld a
mplit
ude (
arb
.unit)
DPTAP / pH 5.7 water
Im(2)
Re(2)
Wavenumber (cm-1)
HD-SFVS: OH band sign change
2800 2900 3000 3100 3200 3300 3400 3500-5.0
-2.5
0.0
2.5
5.0
SF
fie
ld a
mplit
ude (
arb
.unit) Arachidic acid / pH 12.0 water
Im(2)
Re(2)
Negatively charged surface
- dipole upward
- positive OH band
CH3CH3
+ +
- - Positively charged surface
- dipole downward
- Negative OH band+
-
CH3
70

2800 2900 3000 3100 3200 3300 3400 3500-5
-4
-3
-2
-1
0
1
2
3
4
5
SF
fie
ld a
mplit
ude (
arb
.unit) DPTAP / water - Im
(2)
DPTAP / NaCl(10 mM) - Im(2)
Comparison between DPTAP and ODA
2800 2900 3000 3100 3200 3300 3400 3500-5
-4
-3
-2
-1
0
1
2
3
4
5
SF
fie
ld a
mplit
ude (
arb
.unit)
IR wavenumber (cm-1)
ODA / water- Im (2)
ODA / NaCl(10 mM)- Im (2)
salt addition
salt addition
screening by positive
surface charges
becomes more positively
charged!
CH3CH3
CH3
N+
71

protonation of amine groups by added salt
1E-6 1E-3 0.01 0.1 1 10 1000
50
100
150
200
250
300
350
ODA / NaCl solutions (3000 - 3550 cm-1)
ODA / NaI solutions (3000 - 3550 cm-1)
Inte
gra
ted
SF
In
ten
sity (
arb
. u
nit)
Salt concentration (mM)
No salt
DPTAP on pure water
72
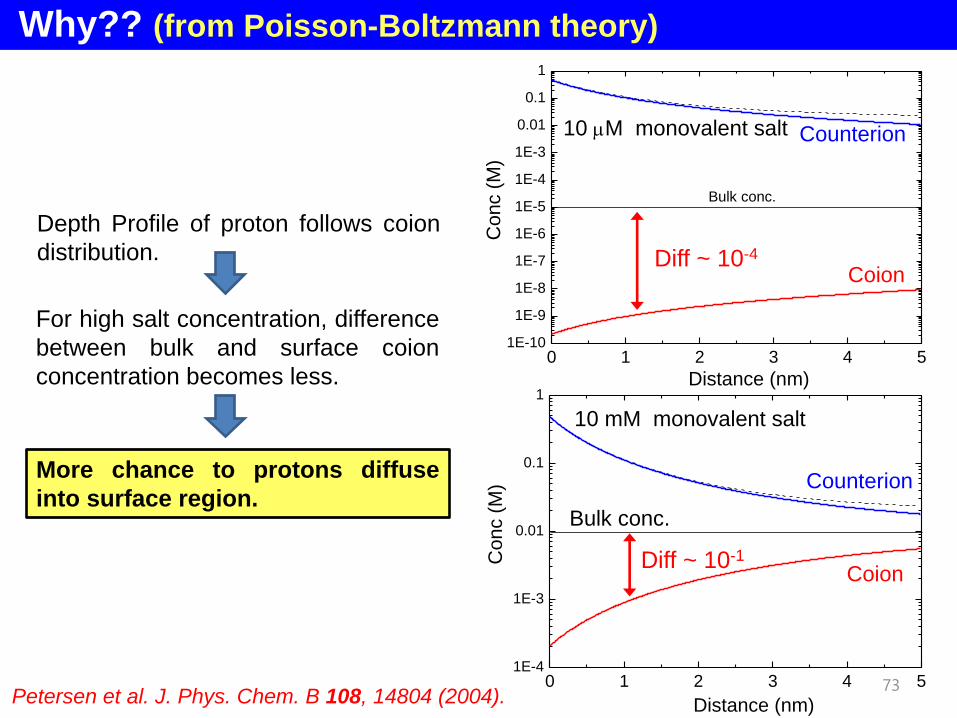
Why?? (from Poisson-Boltzmann theory)
0 1 2 3 4 51E-4
1E-3
0.01
0.1
1
Bulk conc.
Coion
Counterion
10 mM monovalent salt
Conc (
M)
Distance (nm)
0 1 2 3 4 51E-10
1E-9
1E-8
1E-7
1E-6
1E-5
1E-4
1E-3
0.01
0.1
1
Bulk conc.
Coion
Counterion10 mM monovalent salt
Co
nc (
M)
Distance (nm)
Petersen et al. J. Phys. Chem. B 108, 14804 (2004).
Depth Profile of proton follows coion
distribution.
For high salt concentration, difference
between bulk and surface coion
concentration becomes less.
More chance to protons diffuse
into surface region.
Diff ~ 10-4
Diff ~ 10-1
73
74
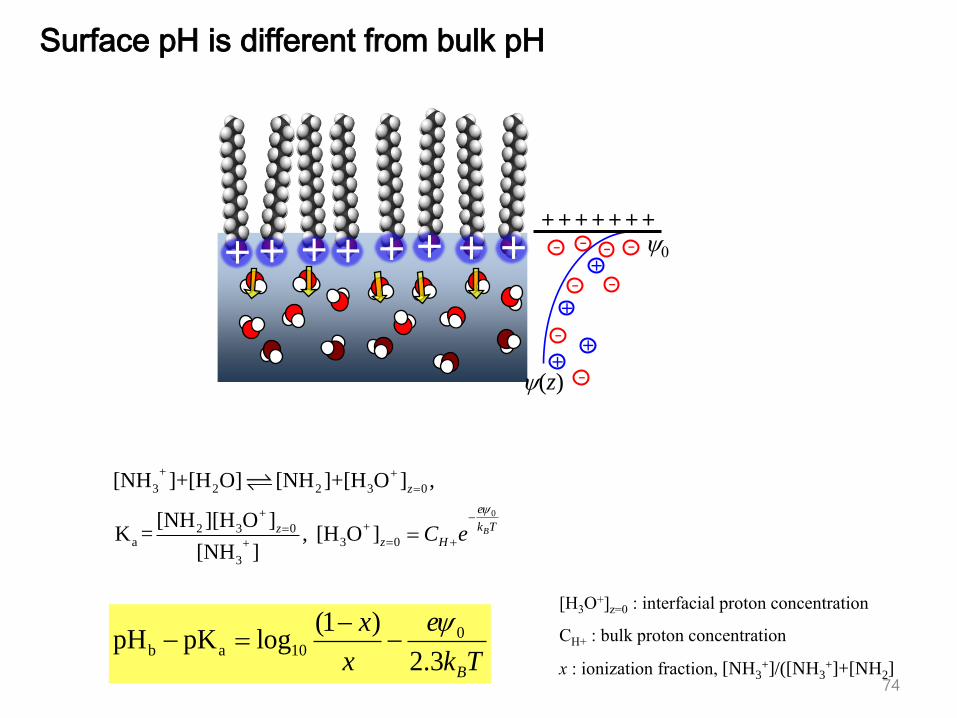
++ ++ + +++
0
+ +
3 2 2 3 0
++2 3 0
a 3 0+
3
[NH ]+[H O] [NH ]+[H O ] ,
[NH ][H O ]K = , [H O ]
[NH ]
B
z
e
k Tzz HC e
[H3O+]z=0 : interfacial proton concentration
CH+ : bulk proton concentration
x : ionization fraction, [NH3+]/([NH3
+]+[NH2]
0b a 10
(1 )pH pK log
2.3
B
ex
x k T
+++++++
(z)
0
+
- - - -
- -
-
-
+
++
Surface pH is different from bulk pH

75
Adding salt also changes surface proton concentration
,
,
(z) ~ (z)
H bulk
H coion
coion bulk
CC C
C

76
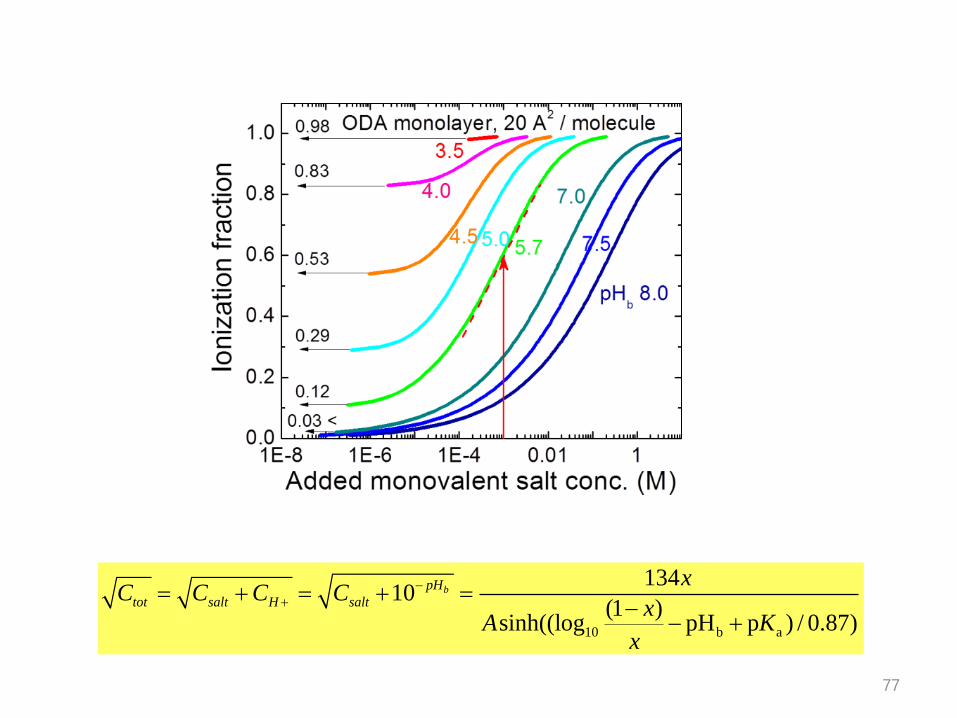
For more quantitative prediction….
00 0
e8 sinh( ) , (Graham equation)
2
r B
B
eC k T x
k T A
0b a 10
(1 )pH pK log , (surface pH)
2.3
B
ex
x k T
10 b a
13410
(1 )sinh((log pH p ) / 0.87)
bpH
tot salt H salt
xC C C C
xA K
x
77
10 b a
13410
(1 )sinh((log pH p ) / 0.87)
bpH
tot salt H salt
xC C C C
xA K
x

78
(1) Different ions (Cl-, I-) worked differently
(2) Adding salt increased (did not decrease) the E field
2
0
1 1
4
eE
r

Science 340, 1265 (2013)
80
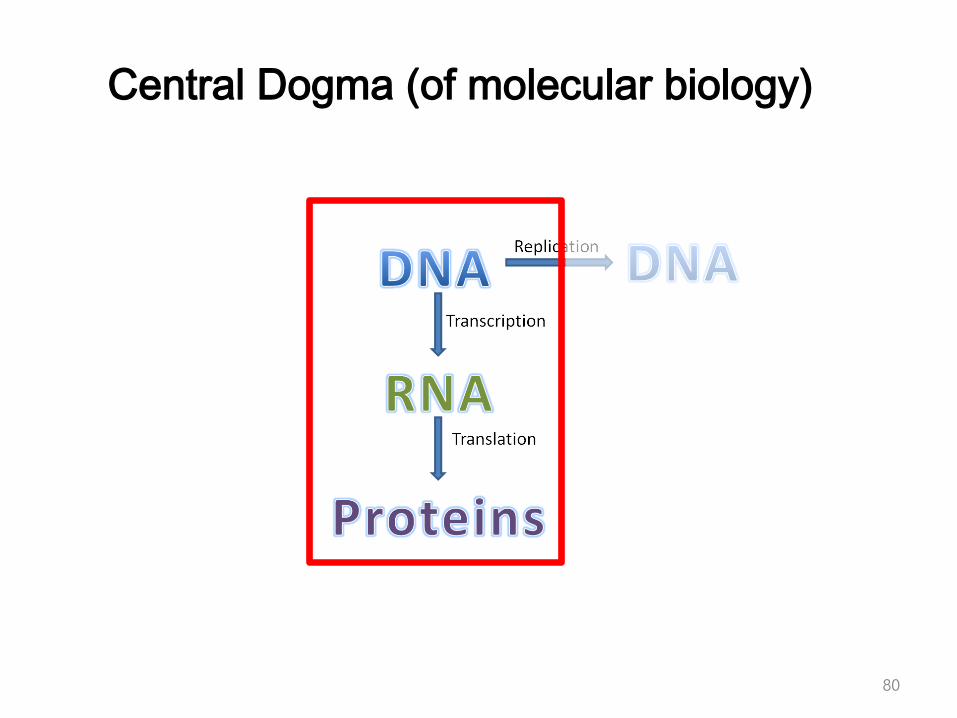
Central Dogma (of molecular biology)
81

82
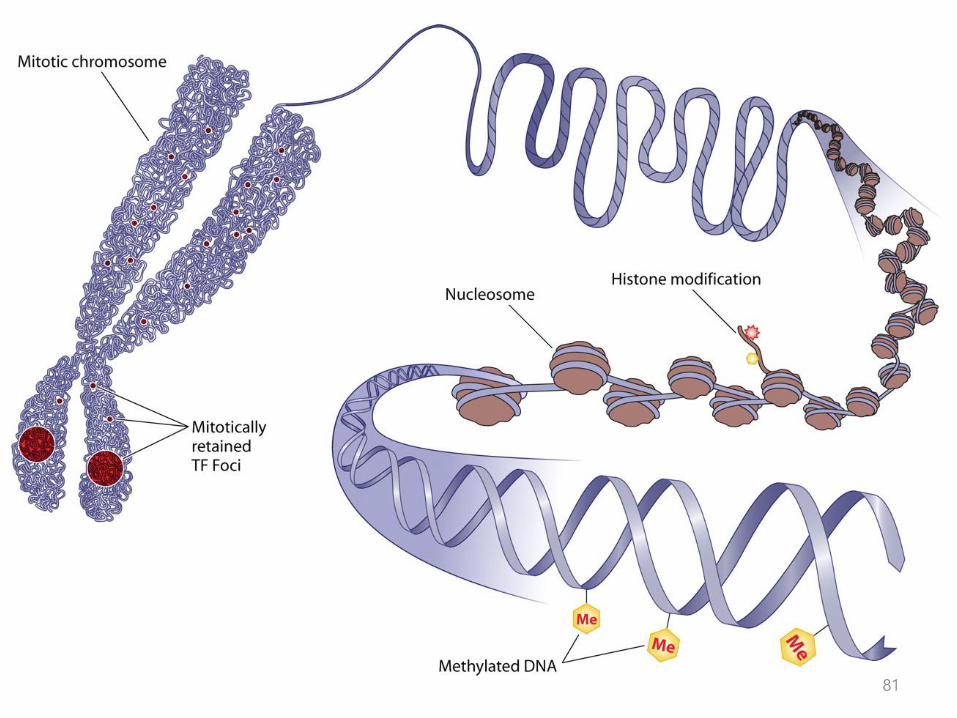
Epigenetic modification of the histone
Science, Mar. 2017
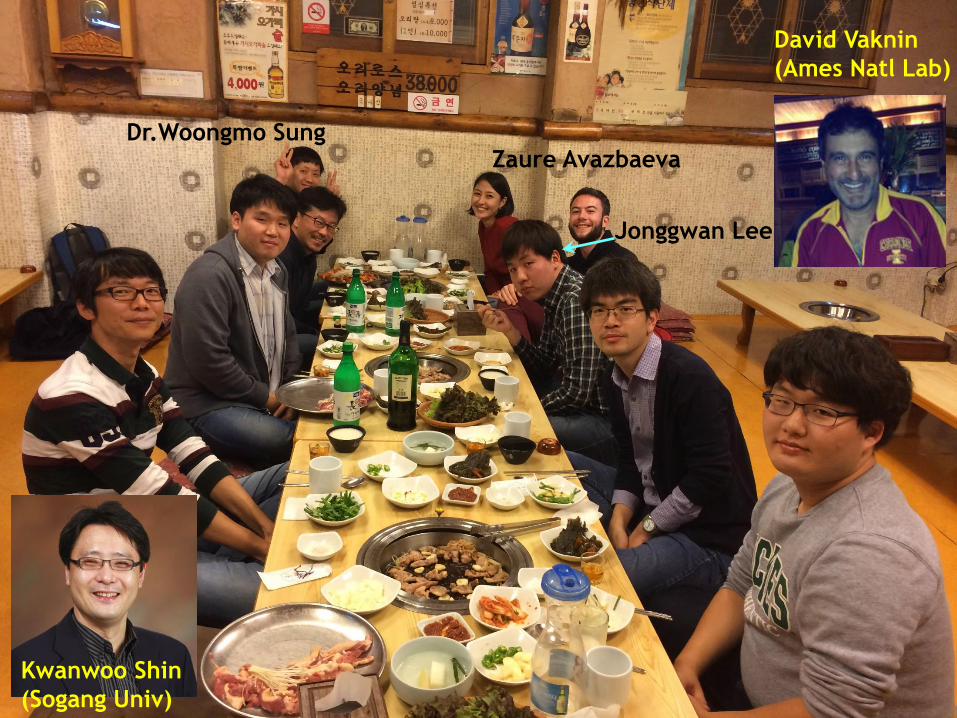
Dr.Woongmo SungZaure Avazbaeva
Jonggwan Lee
David Vaknin
(Ames Natl Lab)
Kwanwoo Shin
(Sogang Univ)


![Interactions between Phospholipid Monolayers (DPPC and DMPC) … · 2015. 6. 10. · processes occurring on a self-assembled monolayer [18], metal ion binding to the Langmuir monolayer](https://img.pdfslide.net/doc/110x75/600d3401e529355e3642b483/interactions-between-phospholipid-monolayers-dppc-and-dmpc-2015-6-10-processes.jpg)