Embed Size (px)
Citation preview
9,000 -
mi POWER PLANT EMISSIONS
8,OOO- MJOTHER FOSSIL FUEL EMISSIONS _CEMENT PLANT EMISSIONS
7,000
6000-
o 4,000
3,000
1890 19001910 1920 1930 1940 1950 1960 1970 1980 1990 2000
Fig. 1. Carbon dioxide emissions from power plant and other industrial opera- tions.
Carbon dioxide emissions from in- dustrial sources should project to ap- proximately eighteenfold from 1890 to 2000. The greatest average increases in rates of carbon dioxide emissions will be about 4 percent per year and will occur between 1965 and 1985. This is the period when increased demands on fossil fuels for power generation will be the greatest and when nuclear power generation will be proved.
In the absence of more precise and definitive data from other countries one can only speculate on the increases in worldwide emission rate of carbon dioxide. It seems reasonable that emis- sion rates in many other presently in- dustrialized areas will be similar to those in the United States, and that in a large share of the world, particularly the underdeveloped regions, emissions will increase at even greater rates because these regions possess the latent urge and potential for greater industrializa- tion and progress.
F. A. ROHRMAN B. J. STEIGERWALD
J. H. LUDWIG National Center for Air Pollution Control, U.S. Public Health Service, Cincinnati, Ohio
References
1. Implications of the Rising Carbon Dioxide Content of the Atmosphere (The Conservation Foundation, New York, 1963); Report of the Environmental Pollution Panel, President's Sci- ence Advisory Committee, 1965, p. 111.
2. T. C. Chamberlain, J. Geol. 7, 575 (1899). 3. Svante Arrhenius, Lehrbuch der Kosmischen
Physik (Hirzel, Leipzig, 1903), vol. 2. 4. G. S. Callendar, Quart. J. Roy. Meteorol. Soc.
64, 223 (1938).
9,000 -
mi POWER PLANT EMISSIONS
8,OOO- MJOTHER FOSSIL FUEL EMISSIONS _CEMENT PLANT EMISSIONS
7,000
6000-
o 4,000
3,000
1890 19001910 1920 1930 1940 1950 1960 1970 1980 1990 2000
Fig. 1. Carbon dioxide emissions from power plant and other industrial opera- tions.
Carbon dioxide emissions from in- dustrial sources should project to ap- proximately eighteenfold from 1890 to 2000. The greatest average increases in rates of carbon dioxide emissions will be about 4 percent per year and will occur between 1965 and 1985. This is the period when increased demands on fossil fuels for power generation will be the greatest and when nuclear power generation will be proved.
In the absence of more precise and definitive data from other countries one can only speculate on the increases in worldwide emission rate of carbon dioxide. It seems reasonable that emis- sion rates in many other presently in- dustrialized areas will be similar to those in the United States, and that in a large share of the world, particularly the underdeveloped regions, emissions will increase at even greater rates because these regions possess the latent urge and potential for greater industrializa- tion and progress.
F. A. ROHRMAN B. J. STEIGERWALD
J. H. LUDWIG National Center for Air Pollution Control, U.S. Public Health Service, Cincinnati, Ohio
References
1. Implications of the Rising Carbon Dioxide Content of the Atmosphere (The Conservation Foundation, New York, 1963); Report of the Environmental Pollution Panel, President's Sci- ence Advisory Committee, 1965, p. 111.
2. T. C. Chamberlain, J. Geol. 7, 575 (1899). 3. Svante Arrhenius, Lehrbuch der Kosmischen
Physik (Hirzel, Leipzig, 1903), vol. 2. 4. G. S. Callendar, Quart. J. Roy. Meteorol. Soc.
64, 223 (1938). 5. F. A. Rohrman and J. H. Ludwig, Chem.
Eng. Progr. 61, 59 (1965). 6. F. A. Rohrman, B. J. Steigerwald, J. H.
Ludwig, paper presented to Amer. Soc. Mech. Eng.-Inst. Elect. Electron. Eng. National Pow- er Conference, Albany, N.Y., Sept. 1965.
7. Staff Study, Oil Gas J. 63, 95 (1965). 6 February 1967; 3 April 1967
5. F. A. Rohrman and J. H. Ludwig, Chem. Eng. Progr. 61, 59 (1965).
6. F. A. Rohrman, B. J. Steigerwald, J. H. Ludwig, paper presented to Amer. Soc. Mech. Eng.-Inst. Elect. Electron. Eng. National Pow- er Conference, Albany, N.Y., Sept. 1965.
7. Staff Study, Oil Gas J. 63, 95 (1965). 6 February 1967; 3 April 1967
Ionium Dating of Igneous Rocks
Abstract. Local fractionation of uran- ium and thorium, between minerals within a sample of igneous rock at the time of crystallization, makes it possi- ble to date its solidification by use of ionium and uranium. Results on sam- ples of granite, pumice, and lava sug- gest that this method of dating is re- liable.
Much chronological information on Quaternary events has derived from use, in dating, of the radioactive dis- equilibrium between ionium and uran- ium in pelagic sediments (1) and ma- rine biologic carbonates (2). From car- bonates, ionium was essentially ex- cluded at the time of formation, and the observed approach to equilibrium makes it possible to date the time of for- mation. I now extend the application of ionium dating to igneous rocks, which almost always have had amounts of ionium in equilibrium with uranium since the time of their solidification.
In a rock that is not very old in comparison with the half-life of ioni- um, some of the ionium has been con- tained since the time of solidification; the remainder has grown in situ from U234 after the solidification. The ratio of these two amounts of ionium from different genetic origins varies in each mineral according to its uranium and thorium contents. The amount of ac- cumulated ionium must be proportional to the amount of U234 or Th234 in each mineral, and the amount of original ionium that has survived since the time of solidification must be proportional to the amount of Th232. With this expected regularity in the distribution of thorium isotopes in different parts or minerals of an igneous rock, we can determine the amounts of the two kinds of ionium, from which we can date solidification of the rock.
If thorium isotopes are completely mixed in a rock at the time it crystal- lizes, and if a phase or a mineral of the rock sample has been kept as a closed system for t years after solidi- fication, the total amount of Th230 in this part is given by
Aoi = aA0i exp(-Xt) + A4,[1-exp(-Xt)] (1)
where Ao, A21, and A4, are the dis-
Ionium Dating of Igneous Rocks
Abstract. Local fractionation of uran- ium and thorium, between minerals within a sample of igneous rock at the time of crystallization, makes it possi- ble to date its solidification by use of ionium and uranium. Results on sam- ples of granite, pumice, and lava sug- gest that this method of dating is re- liable.
Much chronological information on Quaternary events has derived from use, in dating, of the radioactive dis- equilibrium between ionium and uran- ium in pelagic sediments (1) and ma- rine biologic carbonates (2). From car- bonates, ionium was essentially ex- cluded at the time of formation, and the observed approach to equilibrium makes it possible to date the time of for- mation. I now extend the application of ionium dating to igneous rocks, which almost always have had amounts of ionium in equilibrium with uranium since the time of their solidification.
In a rock that is not very old in comparison with the half-life of ioni- um, some of the ionium has been con- tained since the time of solidification; the remainder has grown in situ from U234 after the solidification. The ratio of these two amounts of ionium from different genetic origins varies in each mineral according to its uranium and thorium contents. The amount of ac- cumulated ionium must be proportional to the amount of U234 or Th234 in each mineral, and the amount of original ionium that has survived since the time of solidification must be proportional to the amount of Th232. With this expected regularity in the distribution of thorium isotopes in different parts or minerals of an igneous rock, we can determine the amounts of the two kinds of ionium, from which we can date solidification of the rock.
If thorium isotopes are completely mixed in a rock at the time it crystal- lizes, and if a phase or a mineral of the rock sample has been kept as a closed system for t years after solidi- fication, the total amount of Th230 in this part is given by
Aoi = aA0i exp(-Xt) + A4,[1-exp(-Xt)] (1)
where Ao, A21, and A4, are the dis- integration rates of Th230, Th232, and Th234, respectively, in a phase indicated by subscript i; a is an activity ratio Aoi: A2j, at t - 0, which must be con- stant in all phases of a rock sample; and
integration rates of Th230, Th232, and Th234, respectively, in a phase indicated by subscript i; a is an activity ratio Aoi: A2j, at t - 0, which must be con- stant in all phases of a rock sample; and
932 932
X is the decay constant of Th230. The first term of Eq. 1 indicates a de- crease of the ionium that has been in- cluded, with Th232, in the i-th phase of the rock sample since the time of solidification; the second term indi- cates increase of the ionium from U234. By use of the ratios Ro =-
Ao : A2 and R4 = A4 : A2 for two different parts (i and j) of a rock sample, Eq. 1 gives an age of solidifica- tion (t) as
1 ln[/( Ro- -
- R
R. i - Rt 1 ln[/( Ro-
- -
R R. i - Rt (2) (2)
The precision of this method of dat- ing depends mainly on the magnitude of the difference (R4-R4j) arising from the fractionation of uranium and thorium in the phases i and j.
Instead of mechanical or dynamic separation of minerals, partial dissolu- tion or extraction may be used to separate the portions having different ratios of uranium:thorium. I now re-
port some results of analyses of por- tions separated by heavy liquids or acid treatment. The following acid treat- ments yield two portions: (i) boiling 20- to 200-gram samples of powdered rock in 2N HC1 for 40 hours, and (ii) solution in 9N HF of most nonmafic minerals in the residues remaining from the treatment with HC1. In Table 1, G-1 and 0-1 correspond to the HC1- extracted solutions, and G-2 and 0-2 correspond to HF-dissolved portions. A-1 is a portion obtained by partial dissolution of the powdered rock by 9N HF without any pretreatment, and A-2 is a residue from the HF treat- ment that mainly consisted of mafic minerals. Separation of heavy liquid (Toulet solution) gave two portions: 0-4, consisting mainly of glass, and 0-3, consisting of mafic minerals.
The thorium in these separated por- tions was purified by mesityl oxide ex- traction, fluoride precipitation, and ex-
S
3
z 3 0 CO (9
S
3
z 3 0 CO (9
2 4 6 DAYS
2 4 6 DAYS
8 8 10 12 10 12
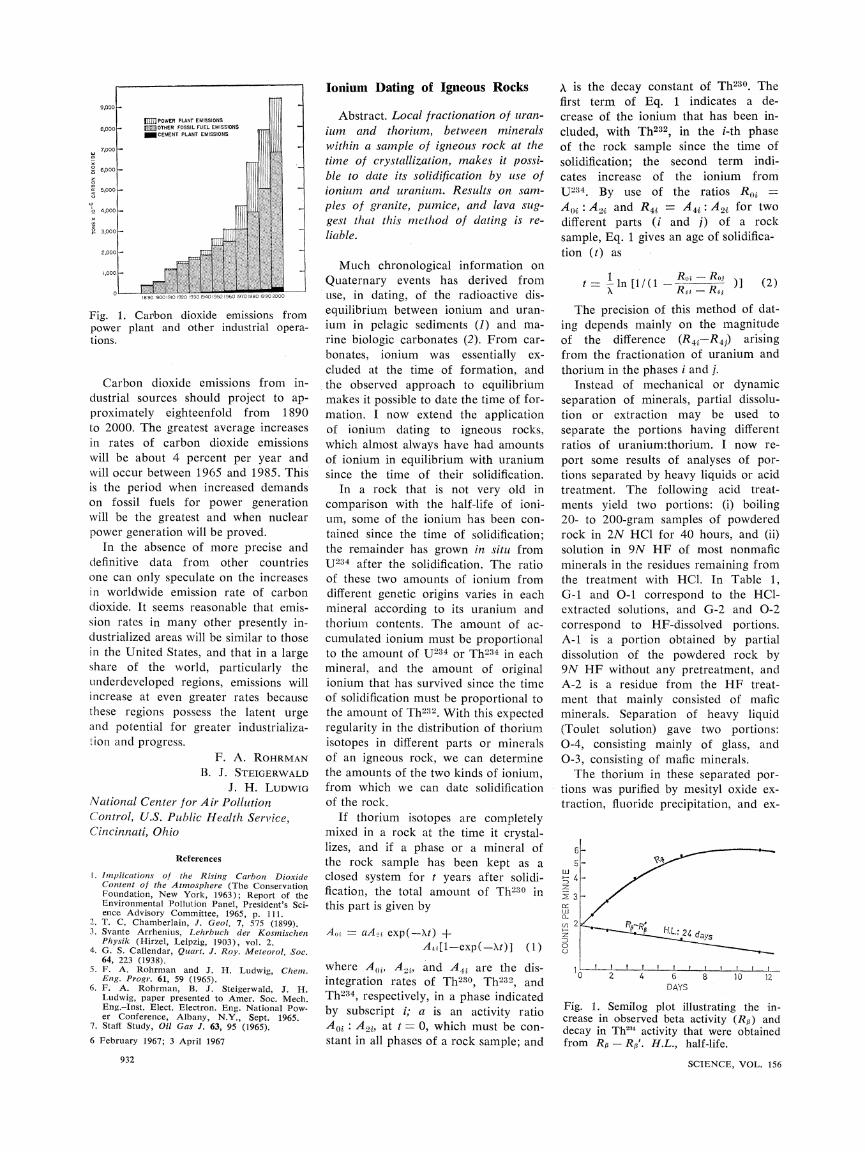
Fig. 1. Semilog plot illustrating the in- crease in observed beta activity (Rp) and decay in Th234 activity that were obtained from Rp- Rp'. H.L., half-life.
SCIENCE, VOL. 156
Fig. 1. Semilog plot illustrating the in- crease in observed beta activity (Rp) and decay in Th234 activity that were obtained from Rp- Rp'. H.L., half-life.
SCIENCE, VOL. 156
traction with 2-thenoyltrifluoroacetone (3). Finally, thorium was back-extracted with 1N HNO3 from solution in 2- thenoyltrifluoroacetone and electroplat- ed on stainless steel disks from weakly acidic solution.
The energy spectrum of alpha rays from the thorium on a stainless steel disk was measured with a surface-bar- rier detector using a 100-channel pulse- height analyzer; the ratio of the areas of the peaks corresponding to Th230 and Th232 gives the activity ratio Ro0. On the same disk the beta activity was measured with a low-background proportional counter; the surface of the disk was covered with polyethylene film having a thickness of 39 mg/cm2. The beta activity increases with time (Fig. 1) because of the increase of daughter nuclides of Th228. The tight covering with polyethylene film, to pre- vent the escape and spread of radon from the surface of the disk, gives a regular increase of beta activity that is expressed by the formula
Rp = kAs 1 -- \12 - 2
[X12 exp(-\2.') -X24 exp(-X12t')] (3)
where Rp' is the counting rate of beta rays from the daughter nuclides of Th228, A8, is the disintegration rate of Th228, AX2 and X24 are the decay constants of Pb212 and Ra224, re- spectively, t' is the time after the separa- tion of thorium from its daughter nu- clides, and k is a constant that de- pends on the counting efficiency of the beta activities.
Subtraction of R' from the total beta-rays counting rate Rp gives the counting rate of the Th234 beta ac- tivity, which decays with 24.1-day half-life (Fig. 1). The activity ratio R4, = A 4:A2l was computed, with the Th232 alpha activity and this Th234 beta activity, at a time of separation of uranium from thorium during the process of chemical purifica- tion of the thorium.
The calculation of ages based on Eq. 2 gave results in good agreement with the expected ages (Table 1, last two columns). The errors indicated in Table 1 derive solely from the standard deviations of statistical errors in count- ing.
The sample of granite (Table 1) (4) is Cretaceous and should have an in- finite age by ionium dating. In Fig. 2, the plotted points of G-1 and G-2 lie on a straight line through the origin, showing that there is no surviving 19 MAY 1967
Table 1. The ages of rock samples, in the separated portions.
and observed disintegration ratios of thorium nuclides
Method of Th2:0:Th2:2 Th23t:Th232 Th8Th32 r No. Th-28:Th232 separation (=R0o) (R41) *Known Cal. from G Eq. 2
Granite (4) G-1 HC1 on -200-
mesh powder G-2 HF on residue
of G-1
0.284?0.005
.422- .004
A-1 HF on +200- mesh powder 0.897-0.011
A-2 Residue of A-1 .905?- .012
0-1 HC1 on +200- mesh powder
0-2 HF on residue of 0-1
0-3 Heavy liquid (d> 2.9
0-4 Heavy liquid (d> 2.7)
0.451 ?.0.009
0.285-0.005
.420? .005
1.01+0.02
1.00? .01
Lava (5)
0.960-0.017 0.995?0.012 1.243- .025 1.018+ .014
Pumice (6)
0.304-0.017 1.40?0.02
.565- .017 .662? .031 1.08? .014
.583? .015 .786? .020 1.01? .02
(Cretaceous) >310,000
(A.D. 1783) <6700
35,700+ 37,600? 1400 5500 (9)
(GaK-1047)
(8)
.555+ .010 .566- .008 1.02- .02
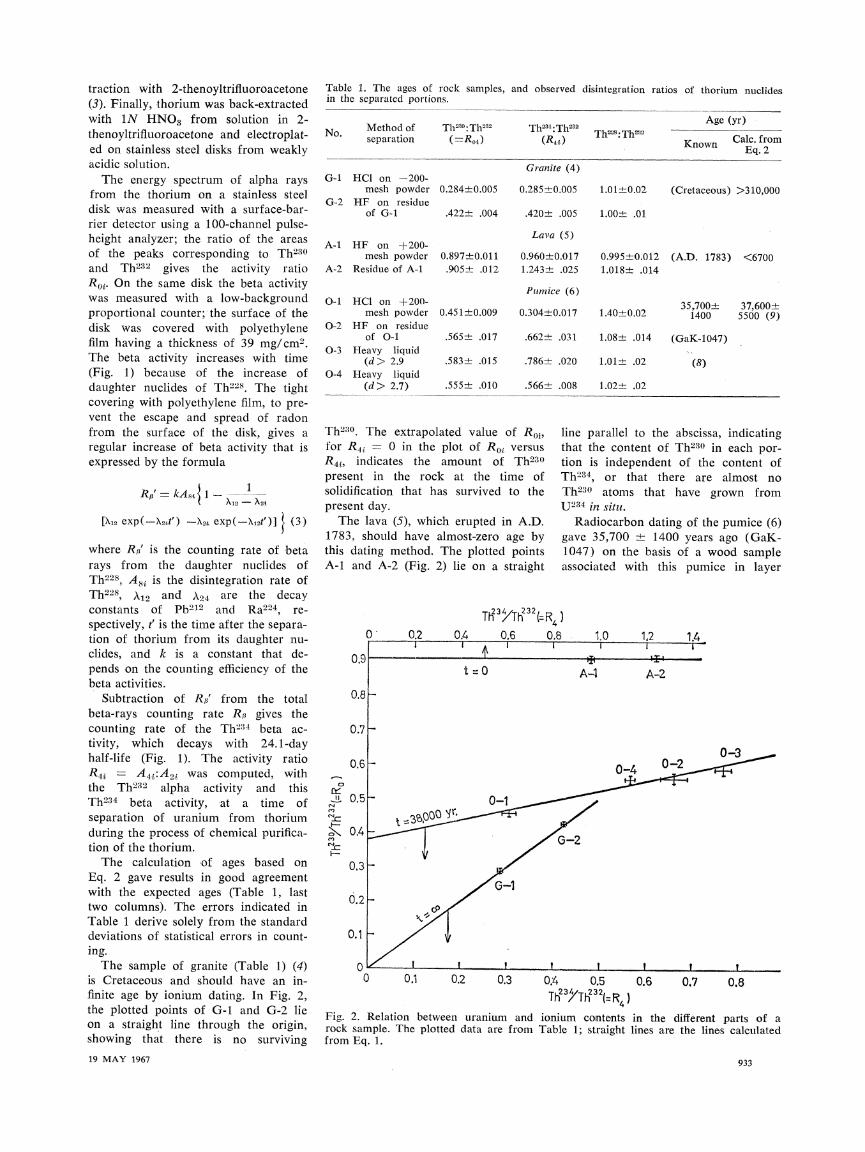
Th230. The extrapolated value of R0i, for RXi - 0 in the plot of Roi versus R4i, indicates the amount of Th230 present in the rock at the time of solidification that has survived to the present day.
The lava (5), which erupted in A.D. 1783, should have almost-zero age by this dating method. The plotted points A-1 and A-2 (Fig. 2) lie on a straight
line parallel to the abscissa, indicating that the content of Th230 in each por- tion is independent of the content of Th234, or that there are almost no Th230 atoms that have grown from U234 in situ.
Radiocarbon dating of the pumice (6) gave 35,700 -+ 1400 years ago (GaK- 1047) on the basis of a wood sample associated with this pumice in layer
Tih23Th232= R )
1--
n
c^
n
0.:
0.1
0
t=0 A-1 A-2
0-3
0 0.1 0.2 0.3 OA. 0.5 0.6 0.7 0.8 Th23/Th232 R4 )
Fig. 2. Relation between uranium and ionium contents in the different parts of a rock sample. The plotted data are from Table 1; straight lines are the lines calculated from Eq. 1.
933
P-III and taken from the Ono Menyan- thes bed (7).
The counting rate of the alpha rays from Th228, which is required to com-
pute Rp' by Eq. 3, was not always equal to that from the Th232, even when the contribution from Ra224 to the 5.4-Mev peak of the Th228 spec- trum was eliminated. The radioactive
disequilibrium between Th228 and Th232 may result from difference in chemical behavior between these nu- clides. A prominent excess amount of Th228 in 0-1 (Table 1) seems to indicate that Th228 atoms were selec-
tively extracted from the minerals dur-
ing the acid treatment. The disequi- librium may support the view that recoil atoms produced by alpha decay in the solid are more soluble in the chemical treatment than are the atoms that have remained intact in the rock.
The occurrence of this chemical ef- fect on recoil atoms is a disadvantage in a method based on separation, by acid extraction, of portions having dif- ferent uranium:thorium ratios. When an extraction is used as a source of a
portion from the total rock sample, the
isotopic composition of thorium in the
portion from which a part of thorium was extracted must be represented in the extracted solution. The chemical effect on the atoms, of disintegration products of uranium, possibly makes observed Th230:Th232 or Th234:Th232 ratios in the extracted solution different from the ratio in an analyzed portion of the rock sample. However, since in that portion Th234 and some Th230 are grown in situ by alpha decays of
nearly equal energy, these nuclides may behave in about the same manner: that is, the ratio of extracted Th230 to Th230 grown in situ in that portion may be the same as the ratio of ex- tracted Th234 to total Th234. If these two ratios are the same, a plot of
R4V versus R0, gives a point on a
straight line given by Eq. 1. In the cases of 0-2, 0-3, and 0-4,
there was no distinct difference be- tween the counting rates of Th232 and Th228. Although 0-1 showed significant difference between the counting rates of Th232 and Th228, all four points 0-1, 0-2, 0-3, and 0-4 (Fig. 2) lie on a
straight line. Thus it is shown that,. in the acid-extraction process for 0-1, the
P-III and taken from the Ono Menyan- thes bed (7).
The counting rate of the alpha rays from Th228, which is required to com-
pute Rp' by Eq. 3, was not always equal to that from the Th232, even when the contribution from Ra224 to the 5.4-Mev peak of the Th228 spec- trum was eliminated. The radioactive
disequilibrium between Th228 and Th232 may result from difference in chemical behavior between these nu- clides. A prominent excess amount of Th228 in 0-1 (Table 1) seems to indicate that Th228 atoms were selec-
tively extracted from the minerals dur-
ing the acid treatment. The disequi- librium may support the view that recoil atoms produced by alpha decay in the solid are more soluble in the chemical treatment than are the atoms that have remained intact in the rock.
The occurrence of this chemical ef- fect on recoil atoms is a disadvantage in a method based on separation, by acid extraction, of portions having dif- ferent uranium:thorium ratios. When an extraction is used as a source of a
portion from the total rock sample, the
isotopic composition of thorium in the
portion from which a part of thorium was extracted must be represented in the extracted solution. The chemical effect on the atoms, of disintegration products of uranium, possibly makes observed Th230:Th232 or Th234:Th232 ratios in the extracted solution different from the ratio in an analyzed portion of the rock sample. However, since in that portion Th234 and some Th230 are grown in situ by alpha decays of
nearly equal energy, these nuclides may behave in about the same manner: that is, the ratio of extracted Th230 to Th230 grown in situ in that portion may be the same as the ratio of ex- tracted Th234 to total Th234. If these two ratios are the same, a plot of
R4V versus R0, gives a point on a
straight line given by Eq. 1. In the cases of 0-2, 0-3, and 0-4,
there was no distinct difference be- tween the counting rates of Th232 and Th228. Although 0-1 showed significant difference between the counting rates of Th232 and Th228, all four points 0-1, 0-2, 0-3, and 0-4 (Fig. 2) lie on a
straight line. Thus it is shown that,. in the acid-extraction process for 0-1, the chemical behavior of Th230 grown in situ was just the same as that of Th234.
When this dating procedure is used with separated minerals, there should be no complex problem in regard to the basis of the dating. Separations
934
chemical behavior of Th230 grown in situ was just the same as that of Th234.
When this dating procedure is used with separated minerals, there should be no complex problem in regard to the basis of the dating. Separations
934
by partial dissolution or extraction prob- ably involve the recoiled-atom effects when the observed Th228 and Th232 activities are not equal. Fortunately in the case of this pumice (6) these ef- fects appear to have been the same for Th234 and Th230. Because of a great difference between the half-lives of Th234 and Th230, it is also plausible that in the other rocks only a feeble effect is left on the recoiled Th230 atoms; further studies are necessary to establish a general conclusion.
KUNIHIKO KIGOSHI
Faculty of Science, Gakushuin University, Toshimaku, Mejiro, Tokyo, Japan
References and Notes
1. E. D. Goldberg and M. Koide, Geochim. Cosmochim. Acta 26, 417 (1962).
2. W. S. Broecker, J. Geophys. Res. 68, 2817 (1963); D. L. Thurber, ibid. 67, 4518 (1962); J. K. Osmond, J. R. Carpenter, H. L. Win- dom, ibid. 70, 1843 (1965).
3. F. L. Moore, Anal. Chem. 30, 1020 (1958). 4. From Mino, Aichi Prefecture, Japan. 5. From a flow at the north foot of Mount
Asama, Nagano Prefecture, Japan. 6. Taken (by K. Kobayashi, Shinshu Univ., whom
I thank) from layer P-III, Ono, Nagano Pre- fecture, Japan; believed to derive from a fall during the Early Wiirm.
7. K. Kobayashi, Spec. Paper Geol. Soc. Amer. 84, 367 (1965).
8. The age was calculated by the Libby half- life of carbon-14, 5570 years.
9. Calculated from the data on 0-1 and 0-3.
14 February 1967
Iodide Abundance in Oilfield
Brines in Oklahoma
Abstract. Samples of subsurface water, oil, and rock from strata of Mississippian and Pennsylvanian age in the Northern Oklahoma Platform area were analyzed. Several of the wa- ter samples contained iodide at more than 500 parts per million. Analyses of the brines and rock indicated that the iodide originated organically.
Samples of water, oil, and rock were obtained from various strata in the marine-sedimentary Anadarko Basin, coming from primary production wells; they should represent connate data as closely as possible. Some of the water samples were analyzed at the wellhead for unstable properties and constituents; others were stored in plas- tic bottles and transported to the lab- oratory for analysis. Each sample was
by partial dissolution or extraction prob- ably involve the recoiled-atom effects when the observed Th228 and Th232 activities are not equal. Fortunately in the case of this pumice (6) these ef- fects appear to have been the same for Th234 and Th230. Because of a great difference between the half-lives of Th234 and Th230, it is also plausible that in the other rocks only a feeble effect is left on the recoiled Th230 atoms; further studies are necessary to establish a general conclusion.
KUNIHIKO KIGOSHI
Faculty of Science, Gakushuin University, Toshimaku, Mejiro, Tokyo, Japan
References and Notes
1. E. D. Goldberg and M. Koide, Geochim. Cosmochim. Acta 26, 417 (1962).
2. W. S. Broecker, J. Geophys. Res. 68, 2817 (1963); D. L. Thurber, ibid. 67, 4518 (1962); J. K. Osmond, J. R. Carpenter, H. L. Win- dom, ibid. 70, 1843 (1965).
3. F. L. Moore, Anal. Chem. 30, 1020 (1958). 4. From Mino, Aichi Prefecture, Japan. 5. From a flow at the north foot of Mount
Asama, Nagano Prefecture, Japan. 6. Taken (by K. Kobayashi, Shinshu Univ., whom
I thank) from layer P-III, Ono, Nagano Pre- fecture, Japan; believed to derive from a fall during the Early Wiirm.
7. K. Kobayashi, Spec. Paper Geol. Soc. Amer. 84, 367 (1965).
8. The age was calculated by the Libby half- life of carbon-14, 5570 years.
9. Calculated from the data on 0-1 and 0-3.
14 February 1967
Iodide Abundance in Oilfield
Brines in Oklahoma
Abstract. Samples of subsurface water, oil, and rock from strata of Mississippian and Pennsylvanian age in the Northern Oklahoma Platform area were analyzed. Several of the wa- ter samples contained iodide at more than 500 parts per million. Analyses of the brines and rock indicated that the iodide originated organically.
Samples of water, oil, and rock were obtained from various strata in the marine-sedimentary Anadarko Basin, coming from primary production wells; they should represent connate data as closely as possible. Some of the water samples were analyzed at the wellhead for unstable properties and constituents; others were stored in plas- tic bottles and transported to the lab- oratory for analysis. Each sample was in duplicate; one half was acidified im- mediately to pH 1.5 with HCl. They were analyzed by reported methods (2). The oil samples were transported to the laboratory in metal containers and analyzed by reported methods (3),
in duplicate; one half was acidified im- mediately to pH 1.5 with HCl. They were analyzed by reported methods (2). The oil samples were transported to the laboratory in metal containers and analyzed by reported methods (3),
except for the iodide analysis which was done by a neutron-activation tech-
nique. Concentrations of iodide exceeded
500 ppm in several samples of water from various oil wells; the highest were in brines taken from rocks of Missis- sippian and Pennsylvanian age in the Northern Oklahoma Platform area (Fig. 1). These brines contained some of the highest concentrations of iodide on record. Most oilfield brines con- tain less than 10 ppm of iodide; some approach 100 ppm, but few contain more.
The data indicate that the heaviest concentration of iodide is in the Okla- homa Platform area east of the Nema- ha Ridge; here the top of the Mis- sissippian sediments is about 1830 m
deep. Table 1 gives the pertinent data for six brines high in iodide content and the iodide and bromide contents of some seaweeds and corals. All these brine samples were taken in Oklahoma from depths exceeding 1800 m, and the associated rocks were Mississip- pian or Pennsylvanian in age. Sample 5 (Table 1) is obviously a meteoric water containing relatively high con- centrations of iodide and bromide; it cannot be relict sea water because of its low content of chloride.
The brines were depleted in mag- nesium and relatively rich in calcium
(up to 16,000 ppm), indicating that
they are very old and that diagenetic dolomitization could have occurred. Other constituents detected were lith- ium, up to 25 ppm; potassium, up to 2100 ppm; rubidium, up to 5 ppm; cesium, up to 2 ppm; strontium, up to 1500 ppm; barium, up to 15 ppm; boron, up to 220 ppm; and sulfate, up to 900 ppm.
Some of the brines were analyzed at the wellhead for ferrous iron, fer- ric iron, thiosulfate, sulfite, sulfide, dissolved carbon dioxide, bicarbonate, and ammonium. Thiosulfate, ammo- nium, dissolved carbon dioxide, bicar- bonate, and traces of sulfite were pres- ent; hydrogen sulfide was absent.
High ratios of ferrous iron to ferric iron indicate a reducing environment. The Fe2+ : Fe3+ ratios varied from 5.0 to 40.0; pH, from 5.9 to 6.5. The measured Eh (4) ranged from 270 to 300 my. A reducing environment is
except for the iodide analysis which was done by a neutron-activation tech-
nique. Concentrations of iodide exceeded
500 ppm in several samples of water from various oil wells; the highest were in brines taken from rocks of Missis- sippian and Pennsylvanian age in the Northern Oklahoma Platform area (Fig. 1). These brines contained some of the highest concentrations of iodide on record. Most oilfield brines con- tain less than 10 ppm of iodide; some approach 100 ppm, but few contain more.
The data indicate that the heaviest concentration of iodide is in the Okla- homa Platform area east of the Nema- ha Ridge; here the top of the Mis- sissippian sediments is about 1830 m
deep. Table 1 gives the pertinent data for six brines high in iodide content and the iodide and bromide contents of some seaweeds and corals. All these brine samples were taken in Oklahoma from depths exceeding 1800 m, and the associated rocks were Mississip- pian or Pennsylvanian in age. Sample 5 (Table 1) is obviously a meteoric water containing relatively high con- centrations of iodide and bromide; it cannot be relict sea water because of its low content of chloride.
The brines were depleted in mag- nesium and relatively rich in calcium
(up to 16,000 ppm), indicating that
they are very old and that diagenetic dolomitization could have occurred. Other constituents detected were lith- ium, up to 25 ppm; potassium, up to 2100 ppm; rubidium, up to 5 ppm; cesium, up to 2 ppm; strontium, up to 1500 ppm; barium, up to 15 ppm; boron, up to 220 ppm; and sulfate, up to 900 ppm.
Some of the brines were analyzed at the wellhead for ferrous iron, fer- ric iron, thiosulfate, sulfite, sulfide, dissolved carbon dioxide, bicarbonate, and ammonium. Thiosulfate, ammo- nium, dissolved carbon dioxide, bicar- bonate, and traces of sulfite were pres- ent; hydrogen sulfide was absent.
High ratios of ferrous iron to ferric iron indicate a reducing environment. The Fe2+ : Fe3+ ratios varied from 5.0 to 40.0; pH, from 5.9 to 6.5. The measured Eh (4) ranged from 270 to 300 my. A reducing environment is characteristic of a petroleum-bearing formation.
It is often assumed that, in brines in which the I:C1 and I:Br ratios are much greater than those of sea water, marine concentrators of iodine are
SCIENCE, VOL. 156
characteristic of a petroleum-bearing formation.
It is often assumed that, in brines in which the I:C1 and I:Br ratios are much greater than those of sea water, marine concentrators of iodine are
SCIENCE, VOL. 156