Embed Size (px)
Citation preview
Disease Markers 28 (2010) 1–14 1DOI 10.3233/DMA-2010-0677IOS Press
Applicability of antibody and mRNAexpression microarrays for identifyingdiagnostic and progression markers of earlyand late stage colorectal cancer
Sandor Spisaka,b,∗, Barnabas Galamba, Ferenc Siposa, Orsolya Galamba,b, Barnabas Wichmanna,Norbert Solymosia, Balazs Nemesc, Jeannette Molnard, Zsolt Tulassaya,b and Bela Molnara,b
a2nd Department of Medicine, Semmelweis University, Budapest, HungarybMolecular Medicine Research Unit, Hungarian Academy of Sciences, Budapest, HungarycTransplantation and Surgical Department, Semmelweis University, Budapest, HungarydDepartment of Nutrition, National Institute of Food and Nutritional Science, Budapest, Hungary
Abstract. The exact molecular background and the connection between protein and mRNA expression in colorectal cancer (CRC)development and progression are not completely elucidated. Our purposes were the identification of protein markers of colorectalcarcinogenesis and progression using protein arrays and validation on tissue microarrays. The connection between antibody andmRNA expression array results was also examined. Using cancerous and adjacent normal samples from 10 patients with earlyand 6 with advanced CRC, 67 differentially expressed genes were identified between normal and cancerous samples. A markerset containing 6 proteins (CCNA1, AR, TOP1, TGFB, HSP60, ERK1) was developed which could differentiate normal specimen,early and late stage CRC with high sensitivity and specificity. Dukes D stage samples were analyzed on HGU133plus2.0microarrays. In these samples, mRNA and protein expression of 143 genes showed strong positive correlations (R2 > 0.8), whilea negative correlation (R2 > 0.9) was found in case of 95 genes. Based on our results a correlation could be established betweentranscriptome and antibody array results, hence the former may be used as a high-capacity screening method before applyingantibody arrays containing already planned targets. Antibody microarrays may have a fundamental importance in testing ofmarker combinations and future application in diagnostics of tumorous diseases.
Keywords: Colorectal cancer, progression marker, antibody microarray, gene expression, transcriptomics, proteomics, bioequiv-alency
1. Introduction
Colorectal cancer (CRC) is the second most fre-quent cause of tumor related death in Western coun-tries [1,2]. In the molecular biological background ofCRC, different genetic pathways are known to be de-
∗Corresponding author: Sandor Spisak, 2nd Department ofMedicine Semmelweis University, Szentkiralyi str. 46, 1088 Bu-dapest, Hungary. Tel.: +36 1 266 09 26; Fax: +36 1 266 08 16;E-mail: [email protected].
fected: changes in DNA like SNP, insertion, deletion,duplication, methylation, on the other hand changesof the regulation of transcription and translation suchas splicing, miRNAs, phosphorylation, glycosylation,complex formation and different interactions [3–11].One of the best known pathways is the adenoma-dysplasia-carcinoma sequence, in which dysplasticcrypts develop from normal epithelium after APC mu-tation, followed by an adenoma. During the process,chromosomal instability and aneuploidy may also bepresent [11–13]. Chromosomal or microsatellite insta-
ISSN 0278-0240/10/$27.50 2010 – IOS Press and the authors. All rights reserved

2 S. Spisak et al. / Applicability of antibody and mRNA expression microarrays for identifying diagnostic
bility and the presence or absence of CpG island methy-lator phenotype establish the basis of molecular patho-logical classification. These characteristics may be usedsuccessfully during the examination of left and rightsided colon tumours or when selecting a chemother-apy protocol [1,2,14]. However, the association be-tween these molecular events and protein expressionalterations has not yet been clarified.
Whole genomic arrays provide an excellent oppor-tunity for the development of molecular expressionpattern based colorectal cancer classification [3,7,10].The diagnostic application of these patterns has al-so emerged as a possibility [15–18] according to theresults of our research team. Using array technolo-gies, the discrimination of early and late stage colorec-tal cancers [14], the prediction of metastatic and non-metastatic disease [19] as well as the characterizationof the adenoma-dysplasia-carcinoma sequence becamepossible [20,21].
Array techniques can also be used for the proteinlevel based description of molecular changes leadingto tumour development [15]. In recent years, besidesconventional MS and 2D elfo techniques, protein chipshave become available. This technology results not justin qualitative expression patterns, but may also be usedto determine the quantity of the examined protein. Anadditional advantage of protein arrays is their easiersample preparation compared to the other two classicalproteomics technologies.
The molecular changes that lead to cancer develop-ment may be explored by using several techniques atmRNA and protein level, however the connections be-tween these levels are not fully understood. The lack ofpermeability between technological platforms hindersthe comparison of results. Array techniques allow usto perform mRNA and protein analysis from the samesamples, hence the discovery of the coherence betweenresults may become closer.
Regarding the correlation between protein andmRNA expression chips, there are no definite litera-ture data, not even from cell culture studies. In yeast,the detection of protein and mRNA profile similari-ties failed [22]. This may be explained by the timeframe between transcription and translation, the mRNAprocessing, the half-life time and degradation of thesemacromolecules. To our knowledge, there are hard-ly any published studies focusing on the associationsbetween mRNA and protein levels, which may be im-portant in case of tumorous diseases, using only mi-croarray techniques. There are already a few data avail-able from transcript profile analyses that were simul-
taneously prepared using protein level MS, bead-array,and ELISA examinations. Previously, a positive corre-lation of 32 percent was reported by the parallel analy-sis of 1200 proteins and transcripts [23].
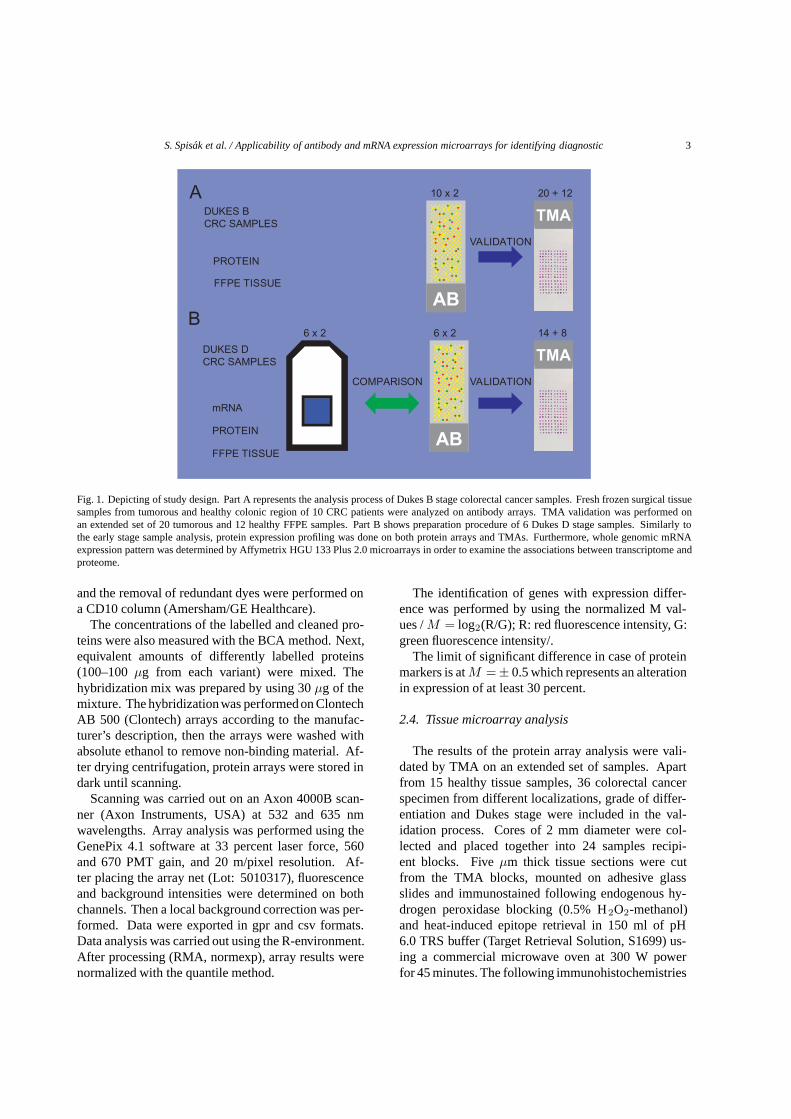
In this study we examined how the changes atmRNA level, modified during disease development andprogression, influence protein expression, and whetherthese altered protein expression patterns may be usedfor the molecular classification of colorectal cancer(Fig. 1).
2. Materials and methods
2.1. Sample collection
Surgically removed tissue samples from the diseasedand the healthy parts of the colon of 16 colorectal cancerpatients (10 Dukes B, 6 Dukes D stage, Table 1.) werecollected. Maximum 10 minutes after resection 500 mgtissue were snap frozen in liquid nitrogen both from theintact mucosa, close to the resection line and from thetumorous tissue. Samples were then stored at −80◦C.In parallel, formalin fixed, paraffin embedded tissuesamples were also prepared from the same samplesfor both conventional histopathological diagnosis andtissue microarrays.
2.2. Protein isolation
Frozen samples were homogenised in lysis buffer,then 1 g of Alumina (Sigma Aldrich) was added to eachgramm of initial material. After extensive homogenisa-tion, samples were centrifuged at 25000 g for 10 min-utes. The supernatant containing the crude extract wasstored in 100 µl aliquots at −80◦C until utilization.
2.3. Clontech AB 500 array analysis
The protein concentrations of the crude extracts weremeasured with the BCA method. 1 mg/ml workingsolutions were prepared from all samples. Cy3 andCy5 monoreactive dyes were used for protein labellingaccording to the manufacturer’s description (Amer-sham/GE Healthcare). Labelling was carried out withthe dye swap method. In reaction A, the tumoroussample was labelled with Cy5 (red), and the normalsample with Cy3 (green). Afterwards, in reaction B,the tumorous sample was labelled with Cy3 and thenormal sample with Cy5. Labelled protein cleaning
S. Spisak et al. / Applicability of antibody and mRNA expression microarrays for identifying diagnostic 3
TMA
AB
TMA
AB
DUKES BCRC SAMPLES
DUKES DCRC SAMPLES
PROTEIN
FFPE TISSUE
10 x 2 20 + 12
mRNA
PROTEIN
FFPE TISSUE
6 x 26 x 2 14 + 8
VALIDATION
VALIDATIONCOMPARISON
A
B
Fig. 1. Depicting of study design. Part A represents the analysis process of Dukes B stage colorectal cancer samples. Fresh frozen surgical tissuesamples from tumorous and healthy colonic region of 10 CRC patients were analyzed on antibody arrays. TMA validation was performed onan extended set of 20 tumorous and 12 healthy FFPE samples. Part B shows preparation procedure of 6 Dukes D stage samples. Similarly tothe early stage sample analysis, protein expression profiling was done on both protein arrays and TMAs. Furthermore, whole genomic mRNAexpression pattern was determined by Affymetrix HGU 133 Plus 2.0 microarrays in order to examine the associations between transcriptome andproteome.
and the removal of redundant dyes were performed ona CD10 column (Amersham/GE Healthcare).
The concentrations of the labelled and cleaned pro-teins were also measured with the BCA method. Next,equivalent amounts of differently labelled proteins(100–100 µg from each variant) were mixed. Thehybridization mix was prepared by using 30 µg of themixture. The hybridization was performed on ClontechAB 500 (Clontech) arrays according to the manufac-turer’s description, then the arrays were washed withabsolute ethanol to remove non-binding material. Af-ter drying centrifugation, protein arrays were stored indark until scanning.
Scanning was carried out on an Axon 4000B scan-ner (Axon Instruments, USA) at 532 and 635 nmwavelengths. Array analysis was performed using theGenePix 4.1 software at 33 percent laser force, 560and 670 PMT gain, and 20 m/pixel resolution. Af-ter placing the array net (Lot: 5010317), fluorescenceand background intensities were determined on bothchannels. Then a local background correction was per-formed. Data were exported in gpr and csv formats.Data analysis was carried out using the R-environment.After processing (RMA, normexp), array results werenormalized with the quantile method.
The identification of genes with expression differ-ence was performed by using the normalized M val-ues / M = log2(R/G); R: red fluorescence intensity, G:green fluorescence intensity/.
The limit of significant difference in case of proteinmarkers is at M =± 0.5 which represents an alterationin expression of at least 30 percent.
2.4. Tissue microarray analysis
The results of the protein array analysis were vali-dated by TMA on an extended set of samples. Apartfrom 15 healthy tissue samples, 36 colorectal cancerspecimen from different localizations, grade of differ-entiation and Dukes stage were included in the val-idation process. Cores of 2 mm diameter were col-lected and placed together into 24 samples recipi-ent blocks. Five µm thick tissue sections were cutfrom the TMA blocks, mounted on adhesive glassslides and immunostained following endogenous hy-drogen peroxidase blocking (0.5% H2O2-methanol)and heat-induced epitope retrieval in 150 ml of pH6.0 TRS buffer (Target Retrieval Solution, S1699) us-ing a commercial microwave oven at 300 W powerfor 45 minutes. The following immunohistochemistries
4 S. Spisak et al. / Applicability of antibody and mRNA expression microarrays for identifying diagnostic
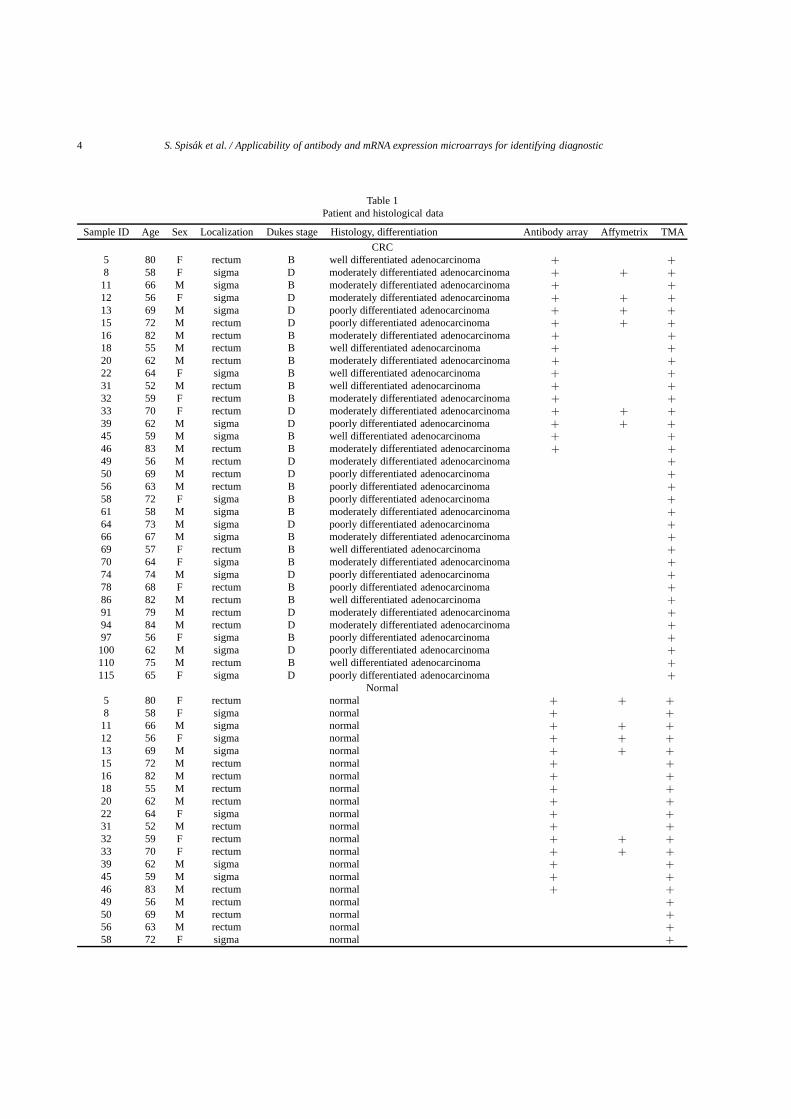
Table 1Patient and histological data
Sample ID Age Sex Localization Dukes stage Histology, differentiation Antibody array Affymetrix TMA
CRC5 80 F rectum B well differentiated adenocarcinoma + +8 58 F sigma D moderately differentiated adenocarcinoma + + +
11 66 M sigma B moderately differentiated adenocarcinoma + +12 56 F sigma D moderately differentiated adenocarcinoma + + +13 69 M sigma D poorly differentiated adenocarcinoma + + +15 72 M rectum D poorly differentiated adenocarcinoma + + +16 82 M rectum B moderately differentiated adenocarcinoma + +18 55 M rectum B well differentiated adenocarcinoma + +20 62 M rectum B moderately differentiated adenocarcinoma + +22 64 F sigma B well differentiated adenocarcinoma + +31 52 M rectum B well differentiated adenocarcinoma + +32 59 F rectum B moderately differentiated adenocarcinoma + +33 70 F rectum D moderately differentiated adenocarcinoma + + +39 62 M sigma D poorly differentiated adenocarcinoma + + +45 59 M sigma B well differentiated adenocarcinoma + +46 83 M rectum B moderately differentiated adenocarcinoma + +49 56 M rectum D moderately differentiated adenocarcinoma +50 69 M rectum D poorly differentiated adenocarcinoma +56 63 M rectum B poorly differentiated adenocarcinoma +58 72 F sigma B poorly differentiated adenocarcinoma +61 58 M sigma B moderately differentiated adenocarcinoma +64 73 M sigma D poorly differentiated adenocarcinoma +66 67 M sigma B moderately differentiated adenocarcinoma +69 57 F rectum B well differentiated adenocarcinoma +70 64 F sigma B moderately differentiated adenocarcinoma +74 74 M sigma D poorly differentiated adenocarcinoma +78 68 F rectum B poorly differentiated adenocarcinoma +86 82 M rectum B well differentiated adenocarcinoma +91 79 M rectum D moderately differentiated adenocarcinoma +94 84 M rectum D moderately differentiated adenocarcinoma +97 56 F sigma B poorly differentiated adenocarcinoma +100 62 M sigma D poorly differentiated adenocarcinoma +110 75 M rectum B well differentiated adenocarcinoma +115 65 F sigma D poorly differentiated adenocarcinoma +
Normal5 80 F rectum normal + + +8 58 F sigma normal + +
11 66 M sigma normal + + +12 56 F sigma normal + + +13 69 M sigma normal + + +15 72 M rectum normal + +16 82 M rectum normal + +18 55 M rectum normal + +20 62 M rectum normal + +22 64 F sigma normal + +31 52 M rectum normal + +32 59 F rectum normal + + +33 70 F rectum normal + + +39 62 M sigma normal + +45 59 M sigma normal + +46 83 M rectum normal + +49 56 M rectum normal +50 69 M rectum normal +56 63 M rectum normal +58 72 F sigma normal +
S. Spisak et al. / Applicability of antibody and mRNA expression microarrays for identifying diagnostic 5
were performed: APC, Caveolin, CBP, cyclinA, ERK,HSP60, Cox2, EGFR, C-myc, Cald, Top1, DARPP32,MRE11A, AndrogenR, EPS8.
Immunostained TMA slides and blood smears weredigitalized using a high-resolution Mirax Desk instru-ment (Zeiss, Goettingen, Germany) and the stainedspots were analysed with the Mirax TMA Module soft-ware (Zeiss). Protein expression was evaluated usingan empirical scoring system considering both intensityand frequency in epithelial/lamina propria cells. In caseof cytoplasmatic proteins (APC, Caveolin, CBP, ERK,HSP60, Cox2, C-myc, Cald1, DARPP32, MRE11A,AndrogenR and EPS8), the score value was−2 for neg-ative staining; 0 for weak, 1 for moderate and 2 for in-tensive strong, diffuse cytoplasmatic immunostaining.In case of nuclear proteins (cyclinA1, Top1), the scorevalue was −2 for a negative immunoreaction, 0 if theratio of immunopositive cells was under 2.5%, 1 for aratio between 2.5% and 5%, and 2 if positive cells weremore than 5%. In case of EGFR, a −2 score representsnegative staining, 0–1 represents weak-moderate cyto-plasmatic staining, and 2 represents strong cell mem-brane staining.
To measure the association of the two categoricalvariables (group and score) contingency tables wereconstructed and tested by Chi-square test. If the dif-ference was statistically significant (p < 0.05), a moredetailed analysis was visualized on the basis of thePearson residuals. These results were summarized ina graphical association plot [http://gap.stat.sinica.edu.tw/Software/GAP].
2.5. Immunohistochemistry
After dewaxing, antigen retrieval was carried out bymicrowave oven heating (at 750W) in citrate buffer for20 minutes. Signal conversion was performed withstandard indirect immunoperoxidase reaction, wherediamino-benzidine was used as chromogen substrate(Dako). For immunohistochemical labellings, Abgene,Dako antibodies were used according to the descriptionof the manufacturer.
2.6. Affymetrix whole genome expression analysis
From the homogenised samples that were collectedand snap frozen in RNAlater, total RNA was extractedusing the RNeasy Mini Kit (Qiagen) according to themanufacturer’s instructions. Quantity and quality of theisolated RNA were tested measuring the absorbanceby agarose or capillary gelelectrophoresis using the
2100Bioanalyzer and RNA 6000 Pico Kit (Agilent Inc,Santa Clara, USA). Biotinylated cRNA probes weresynthesized from 5–8 µg total RNA and fragmentedusing GeneChip cDNA synthesis reagents, a samplecleaning kit and the IVT Labeling Kit [http://www.aff-ymetrix.com/support/downloads/manuals/expressions2 manual.pdf – 1 version] according to the Affymetrixinstructions. Ten µg of each fragmented cRNA sam-ple were hybridized onto HGU133 Plus2.0 arrays(Affymetrix) at 45◦C for 16 hours. The slides werewashed and stained using a Fluidics Station 450 andan antibody amplification staining method was ap-plied according to the manufacturer’s instructions. Thefluorescent signals were detected by a GeneChip Scan-ner 3000.
2.7. Statistical analysis
Quality control analyses were performed accordingto the guidelines of The Tumour Analysis Best PracticesWorking Group [19]. Scanned images were inspect-ed for artifacts, percentage of present calls (> 25%)and the degree of RNA degradation were evaluated.Based on the evaluation criteria all biopsy measure-ments fulfilled the minimal quality requirements. TheAffymetrix expression arrays were pre-processed bygcRMA with quantile normalization and median polishsummarization. For feature selection linear modelscombined with empirical Bayesian methods wereused [24].
2.8. Correlation analysis between Affymetrix andprotein array data
Based on the Swissprot ID of the antibody arraytargets, Affymetrix IDs for 481 genes were assignedby using the Netaffx database. One Affymetrix ID wasassigned to each protein. In case of several AffymetrixIDs, the 3’ end probe set was preferred. The changesin expression (M values) of both mRNA and proteinwere plotted in a frame of reference, then correlationanalysis was performed. For the selection of the bestcorrelating pairs the distance of the pair from zero andthe size of their quotient were taken as a basis.
3. Results
3.1. Discrimination of normal and tumorous groups(normal vs. Dukes B and D)
Tumorous groups were collectively compared to thenormal samples, and the list of differentially expressed

6 S. Spisak et al. / Applicability of antibody and mRNA expression microarrays for identifying diagnostic
Table 2Top 20 significantly altered protein between normal and colorectal samples
Gene name SwissProt ID Biological function M value adj,P,Val
ubiquitin-conjugating enzyme E2E 1 (UBC4/5 homolog, yeast) P51965 protein degradation −1.319 0.002sequestosome 1 Q13501 cell differentiation −1.044 0.005KH domain containing, RNA binding, signal transduction associated 1 Q07666 cell proliferation −0.733 0.008branched chain aminotransferase 1, cytosolic P54687 cell proliferation −0.719 0.008protein phosphatase 1, regulatory (inhibitor) subunit 1B (dopamine andcAMP regulated phosphoprotein, DARPP-32)
Q9NNW1 signal transduction −0.616 0.035
syntaxin 8 Q9UNK0 transport −0.541 0.029plectin 1, intermediate filament binding protein 500kDa Q15149 cytoskeletal anchoring −0.478 0.005nitric oxide synthase 1 (neuronal) P29475 cell-cell signaling −0.408 0.025adenomatosis polyposis coli P25054 signal transduction −0.397 0.026caldesmon 1 Q05682 muscle contraction −0.392 0.022proteasome (prosome, macropain) activator subunit 3 (PA28 gamma; Ki) Q12920 immune response 0.389 0.033serine/threonine kinase 24 (STE20 homolog, yeast) Q9Y6E0 signal transduction 0.431 0.003topoisomerase (DNA) I P11387 DNA topological change 0.435 0.008thioredoxin-like, 32kDa O43396 apoptosis 0.474 0.001guanine nucleotide binding protein (G protein), beta polypeptide 1 P04901 signal transduction 0.478 0.004F11 receptor Q9Y624 inflammatory response 0.529 0.005cyclin A1 P20248 cell cycle 0.543 0.002nuclear mitotic apparatus protein 1 Q14980 cell cycle 0.571 0.004CDC-like kinase 1 P21127 cell proliferation 0.578 0.003heat shock 60kDa protein 1 (chaperonin) P10809 protein folding 0.635 0.004
genes was compiled (Table 1.) Between the two groups(normal vs. CRC) 67 differentially expressed geneswere found. Based on their function, they can be clas-sified into apoptosis (5), cell cycle regulation (7), tran-scription regulation (4), DNA replication (4), molecu-lar transport and cell adhesion (45) related genes. Thetop 10 over- and underexpressed genes are functionallyclassified in Table 2.
3.2. Discrimination of normal and Dukes B groups:protein markers of early cancer progression
In group Dukes B, 22 genes were found to besignificantly altered from normal mucosa (Table 3).Nine of them were underexpressed, while 13 showedupregulation compared to normal. They were classi-fied into the following functional groups: ubiquitin cy-cle (1), signal transduction (8), meiotic recombination(1), viral envelopment protein (1), cell proliferation(1), mitosis (3), oxidoreductase and lyase activity (1),transcription factor (1), unknown (1), DNA topologicalchange (1), cell motility (1) and transport (1). In somesamples, the presence of HPV-16 virus was detected,but as it was not present in all samples, it was excludedof further analysis.
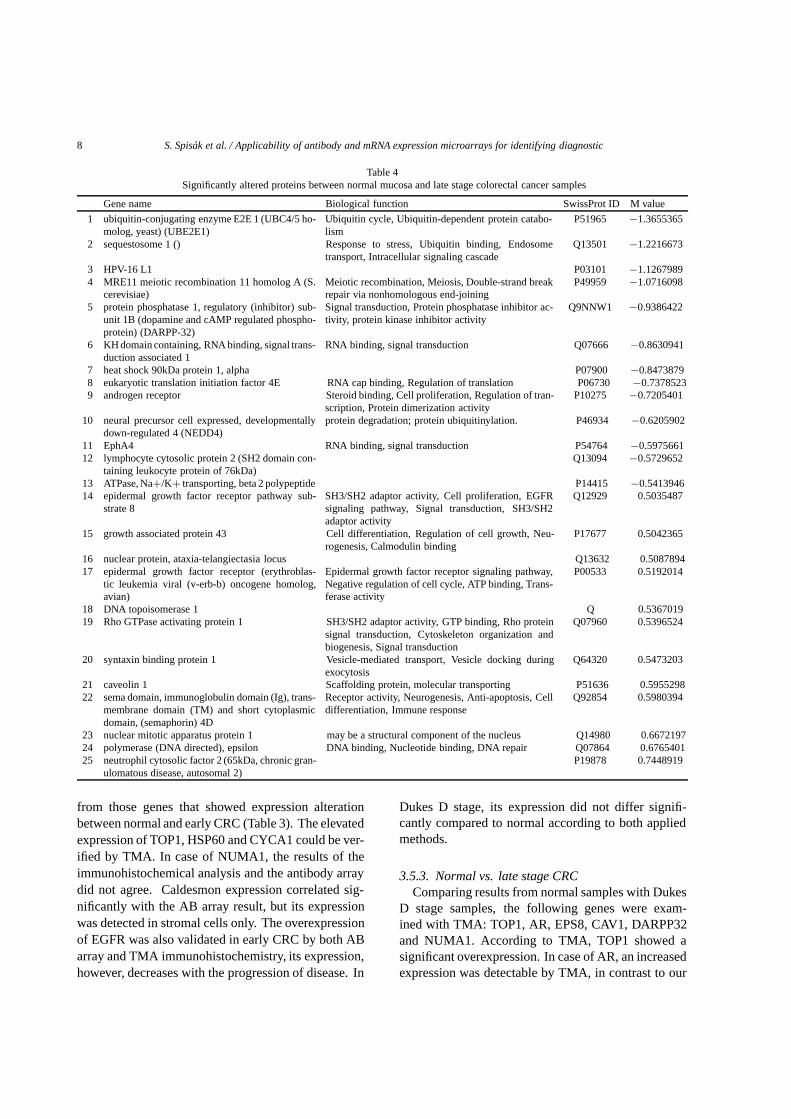
3.3. Discrimination of normal and Dukes D groups
In group Dukes D, 25 genes were found to besignificantly altered from normal mucosa. Thirteen of
them were underexpressed, while 12 showed upregula-tion compared to normal. They were classified into thefollowing functional groups: ubiquitin cycle (1), signaltransduction (7), viral envelopment protein (1), DNArepair (3), RNA binding (1), cell proliferation (3), regu-lation of translation (1), ubiquitinylation (1), transcrip-tion factor (1), cell differentiation (2), cell cycle (1),transport (2) and mitosis (1). The percentual change ofexpression and the cell function of the identified genescan be seen in Table 4.
3.4. Identification of progression markers
The following two strategies were applied for theidentification of progression markers. First, resultsfrom Dukes B and Dukes D samples were directly com-pared with each other. Second, data from separatelyperformed analyses were compared in order to deter-mine how the expression of one gene altered already inthe early stage of disease changes in the late stage. Us-ing the first method, 58 genes were identified betweenthe early and late stage CRC samples out of which 11showed a significant expression alteration between thetwo groups (Table 5).
Using the second method, the underexpressed genesin Dukes D stage could be classified into three sub-groups based on their expression status in DukesB stage. There were 8 genes in the first subgroup(HPV-16, NEDD4, MRE11A, UBE2E1, EPHA4,KHDRBS1, SQSTM1, PPP1R1B), that already showed

S. Spisak et al. / Applicability of antibody and mRNA expression microarrays for identifying diagnostic 7
Table 3Significantly altered proteins between healthy colon and early stage cancer samples
Gene name Biological function SwissProt ID M value
1 ubiquitin-conjugating enzyme E2E 1(UBC4/5 homolog, yeast)
Ubiquitin cycle, Ubiquitin-dependent protein catabolism P51965 −1.865995434
2 sequestosome 1 Response to stress, Ubiquitin binding, Endosome transport,Intracellular signaling cascade
Q13501 −1.728747978
3 MRE11 meiotic recombination11 homolog A (S. cerevisiae)
Meiotic recombination, Meiosis, Double-strand break repairvia nonhomologous end-joining
P49959 −1.5668813
4 HPV-16 L1 Viral envelopment protein P03101 −1.1709424715 protein phosphatase 1, regulatory (in-
hibitor) subunit 1B (dopamine and cAMPregulated phosphoprotein, DARPP-32)
Signal transduction, Protein phosphatase inhibitor activity, pro-tein kinase inhibitor activity
Q9NNW1 −1.127870256
6 KH domain containing, RNA binding,signal transduction associated 1
RNA binding, signal transduction Q07666 −0.99810321
7 branched chain aminotransferase 1,cytosolic
Cell proliferation P54687 −0.759377286
8 EphA4 RNA binding, signal transduction P54764 −0.6200301999 neural precursor cell expressed, develop-
mentally down-regulated 4Structural molecule activity, Nuclear organization and biogen-esis, Mitotic anaphase
P46934 −0.618087113
10 prenylcysteine lyase Oxidoreductase activity, Lyase activity Q9UHG3 0.50125769811 thioredoxin-like, 32kDa Electron transporter activity, Thiol-disulfide exchange interme-
diate activity, Apoptosis, Signal transductionO43396 0.514952034
12 casein kinase 2, beta polypeptide Wnt receptor signaling pathway, Protein serine/threonine ki-nase activity
P13862 0.532917948
13 heat shock transcription factor 4 Transcription corepressor activity, Transcription factor activity,Response to unfolded protein, Transcription, Protein folding
Q9ULV5 0.534018124
14 nuclear mitotic apparatus protein 1 Mitosis Q14980 0.5457712315 polyamine-modulated factor 1 Q9UBQ3 0.55101223516 cyclin A1 Mitosis, Regulation of cyclin dependent protein kinase activity P20248 0.55775331917 epidermal growth factor receptor (ery-
throblastic leukemia viral (v-erb-b) onco-gene homolog, avian)
Epidermal growth factor receptor signaling pathway, Negativeregulation of cell cycle, ATP binding, Transferase activity
P00533 0.564085732
18 CDC-like kinase 1 Cell cycle P21127 0.57473144719 topoisomerase (DNA) I DNA topological change, DNA unwinding P11387 0.57703309320 guanine nucleotide binding protein (G
protein), beta polypeptide 1Signal transducer activity, G-protein coupled receptor proteinsignaling pathway
P04901 0.60497692
21 F11 receptor Cell motility, Inflammatory response Q9Y624 0.69849787922 heat shock 60kDa protein 1 (chaperonin) Unfolded protein binding, Mitochondrial matrix protein import P10809 0.776671019
downregulation in early stage CRC. Underexpressedgenes in Dukes D stage that showed no significantdownregulation in Dukes B stage (EIF4E, HSP90AA1,AR, LCP2) formed the second subgroup. The onlygene in the third subgroup was ATP1B2, which wasslightly overexpressed in Dukes B stage.
Those genes that were overexpressed in Dukes Dstage were also classified into three subgroups. EGFRand NUMA1 were in the first subgroup: they were al-ready overexpressed in early stage of CRC. Genes thatwere only slightly overexpressed in early CRC (CAV1,TOP2B, EPS8, NPAT, STXBP1, SEMA4D) formed thesecond subgroup. The third subgroup contained genesthat were overexpressed in Dukes D stage but underex-pressed in Dukes B stage (GAP43, NCF2, POLE).
All genes that were underexpressed in Dukes B stagewere also underexpressed in Dukes D stage, and 9 ofthe upregulated genes in early CRC were also overex-pressed late stage CRC. In case of 4 genes (HSPD1,
TOP1, PMF1, HSF4), only protein levels increasedduring disease progression, their gene expression,however, was not altered.
3.5. TMA verification of antibody array results
3.5.1. Normal vs. tumourThe upregulation of TOP1, CCNA1 and HSP60, and
the downregulation of APC were validated by TMA. Incase of v-myc, the expression decrease detected by pro-tein chip was significant (p = 0.019), but considerablylower than the expression decrease validated by TMAimmunohistochemistry. In case of AR, the results ofthe protein chip and TMA did not agree.
3.5.2. Normal vs. early stage CRCSix genes (TOP1, HSP60, CYCA1, NUMA1,
CALD1, EGFR) were selected for TMA validation
8 S. Spisak et al. / Applicability of antibody and mRNA expression microarrays for identifying diagnostic
Table 4Significantly altered proteins between normal mucosa and late stage colorectal cancer samples
Gene name Biological function SwissProt ID M value
1 ubiquitin-conjugating enzyme E2E 1 (UBC4/5 ho-molog, yeast) (UBE2E1)
Ubiquitin cycle, Ubiquitin-dependent protein catabo-lism
P51965 −1.3655365
2 sequestosome 1 () Response to stress, Ubiquitin binding, Endosometransport, Intracellular signaling cascade
Q13501 −1.2216673
3 HPV-16 L1 P03101 −1.12679894 MRE11 meiotic recombination 11 homolog A (S.
cerevisiae)Meiotic recombination, Meiosis, Double-strand breakrepair via nonhomologous end-joining
P49959 −1.0716098
5 protein phosphatase 1, regulatory (inhibitor) sub-unit 1B (dopamine and cAMP regulated phospho-protein) (DARPP-32)
Signal transduction, Protein phosphatase inhibitor ac-tivity, protein kinase inhibitor activity
Q9NNW1 −0.9386422
6 KH domain containing, RNA binding, signal trans-duction associated 1
RNA binding, signal transduction Q07666 −0.8630941
7 heat shock 90kDa protein 1, alpha P07900 −0.84738798 eukaryotic translation initiation factor 4E RNA cap binding, Regulation of translation P06730 −0.73785239 androgen receptor Steroid binding, Cell proliferation, Regulation of tran-
scription, Protein dimerization activityP10275 −0.7205401
10 neural precursor cell expressed, developmentallydown-regulated 4 (NEDD4)
protein degradation; protein ubiquitinylation. P46934 −0.6205902
11 EphA4 RNA binding, signal transduction P54764 −0.597566112 lymphocyte cytosolic protein 2 (SH2 domain con-
taining leukocyte protein of 76kDa)Q13094 −0.5729652
13 ATPase, Na+/K+ transporting, beta 2 polypeptide P14415 −0.541394614 epidermal growth factor receptor pathway sub-
strate 8SH3/SH2 adaptor activity, Cell proliferation, EGFRsignaling pathway, Signal transduction, SH3/SH2adaptor activity
Q12929 0.5035487
15 growth associated protein 43 Cell differentiation, Regulation of cell growth, Neu-rogenesis, Calmodulin binding
P17677 0.5042365
16 nuclear protein, ataxia-telangiectasia locus Q13632 0.508789417 epidermal growth factor receptor (erythroblas-
tic leukemia viral (v-erb-b) oncogene homolog,avian)
Epidermal growth factor receptor signaling pathway,Negative regulation of cell cycle, ATP binding, Trans-ferase activity
P00533 0.5192014
18 DNA topoisomerase 1 Q 0.536701919 Rho GTPase activating protein 1 SH3/SH2 adaptor activity, GTP binding, Rho protein
signal transduction, Cytoskeleton organization andbiogenesis, Signal transduction
Q07960 0.5396524
20 syntaxin binding protein 1 Vesicle-mediated transport, Vesicle docking duringexocytosis
Q64320 0.5473203
21 caveolin 1 Scaffolding protein, molecular transporting P51636 0.595529822 sema domain, immunoglobulin domain (Ig), trans-
membrane domain (TM) and short cytoplasmicdomain, (semaphorin) 4D
Receptor activity, Neurogenesis, Anti-apoptosis, Celldifferentiation, Immune response
Q92854 0.5980394
23 nuclear mitotic apparatus protein 1 may be a structural component of the nucleus Q14980 0.667219724 polymerase (DNA directed), epsilon DNA binding, Nucleotide binding, DNA repair Q07864 0.676540125 neutrophil cytosolic factor 2 (65kDa, chronic gran-
ulomatous disease, autosomal 2)P19878 0.7448919
from those genes that showed expression alterationbetween normal and early CRC (Table 3). The elevatedexpression of TOP1, HSP60 and CYCA1 could be ver-ified by TMA. In case of NUMA1, the results of theimmunohistochemical analysis and the antibody arraydid not agree. Caldesmon expression correlated sig-nificantly with the AB array result, but its expressionwas detected in stromal cells only. The overexpressionof EGFR was also validated in early CRC by both ABarray and TMA immunohistochemistry, its expression,however, decreases with the progression of disease. In
Dukes D stage, its expression did not differ signifi-cantly compared to normal according to both appliedmethods.
3.5.3. Normal vs. late stage CRCComparing results from normal samples with Dukes
D stage samples, the following genes were exam-ined with TMA: TOP1, AR, EPS8, CAV1, DARPP32and NUMA1. According to TMA, TOP1 showed asignificant overexpression. In case of AR, an increasedexpression was detectable by TMA, in contrast to our

S. Spisak et al. / Applicability of antibody and mRNA expression microarrays for identifying diagnostic 9
Table 5Selected significantly differentially expressed genes during the tumor progression
Gene name Biological function SwissProt ID M valueubiquitin-conjugating enzyme E2E 1 (UBC4/5 homolog, yeast) cell proliferation P51965 −1.314214341sequestosome 1 signal transduction Q13501 −1.043584071HPV-16 L1 transport P03101 −0.77024562KH domain containing, RNA binding, signal transduction associated 1 cytoskeletal anchoring Q07666 −0.733015297branched chain aminotransferase 1, cytosolic cell-cell signaling P54687 −0.718986189protein phosphatase 1, regulatory (inhibitor) subunit 1B (dopamine andcAMP regulated phosphoprotein, DARPP-32)
signal transduction Q9NNW1 −0.616086234
syntaxin 8 muscle contraction Q9UNK0 −0.541441325F11 receptor immune response Q9Y624 0.528651479cyclin A1 cell cycle P20248 0.542708779nuclear mitotic apparatus protein 1 DNA topological change Q14980 0.571409175CDC-like kinase 1 signal transduction P21127 0.577723106heat shock 60kDa protein 1 (chaperonin) protein folding P10809 0.634592412
results by AB array. The TMA verification of EPS8,CAV1, DARPP32 and NUMA1 failed, as there was nosignificant change in immunohistochemical expressionbetween normal and late stage CRC.
3.5.4. Follow-up of tumour progressionThree genes that were found to be related to tumour
progression in our AB array analysis (CBP (EIF4),ERK (MAPK12), v-myc), and 5 genes whose selec-tion was based on literature data (GSTP, IGFR, TGFB,CALD, COX2) but did not change significantly in thisstudy, were analysed by TMA.
ERK showed overexpression, while v-myc was un-derexpressed. In case of CBP and EGFR, a tendencyof downregulation was detected between early and latestage CRC. The results of TMA validation can be seenin Fig. 2.
3.6. Validation results
Our results confirm recently published data,according to which using only one marker is notenough/sufficient for the classification of the differentstages of CRC. Therefore, we designed marker sets thatare appropriate for such classification.
To test the force of differentiation of the markersets, an additional, separate set of samples was exam-ined by TMA analysis. Using cluster analysis basedon the score values, a set of 6 genes was determined(CycA, Ar, Top1, TGFB, Hsp60, ERK), with whichdiscrimination between normal and tumorous groupsbecame possible (Fig. 3). This marker set was tested bydiscriminant analysis. The distinction between normaland tumorous groups was 100%, and 90.9% betweenearly and late stage CRC cases (Fig. 4).
3.7. Correlation between mRNA and protein arrayresults
Of the 500 genes examined, 465 (93%) showed noexpression alteration at protein level. Similarly, themRNA expression of these 465 genes showed no sig-nificant change between normal and Dukes D stage(groups). Both platforms detected the same expressionchanges, which is visualized in Fig. 5. It can be seenthat higher oscillation is detected at mRNA than at pro-tein level. A positive correlation was established in caseof 143 transcripts (R2 > 0,8), most of which belongedto transport proteins. We also identified 95 genes whoseexpression changed in opposite directions for mRNAand protein levels (R2 > 0.9); the majority of thesegenes is involved in the regulation of cell functions.
Next, genes with a highly significant expression al-teration on both platforms were examined.
Twelve genes were identified (Fig. 6.) that showeda significant difference between normal and DukesD stage CRC cases on both platforms. The absolutevalues of their expression changes (M) was higherthan 0.5 on both platforms. These genes could be clas-sified into 3 subgroups. In case of 4 genes (EIF4E,AR, UBE2E1, EPHA4), mRNA underexpression wasfollowed by the downregulation of protein expres-sion. These genes are involved in translation initiation,transcription, intercellular communication, posttrans-lational modification and signal transduction. Thesecond subgroup contained genes whose increase inmRNA expression was followed by protein overex-pression (NCF2, TOP2B, SEMA4D, NUMA1). Thesegenes are involved in cellular defense, electron carrier,DNA topological change, immuneresponse, cell dif-ferentiation and mitosis. In the third subgroup, mR-NA expression and protein levels changed into oppositedirections (GLUL, GAP43, LCP2, PPP1R1B). These

10 S. Spisak et al. / Applicability of antibody and mRNA expression microarrays for identifying diagnostic
Fig. 2. Validation of selected protein markers on TMA. Protein expression of APC, Cyclin A, TOP1, EGFR. APC immunohistochemistry onnormal (1A), Dukes B (1B), Dukes B (1C) and Dukes D (1D) stage colorectal samples and the association plot (1E), showing the frequency ofthe staining intensities. Cyclin A1 Immunohistochemistry on normal (2A), Dukes B (2B), Dukes B (2C), Dukes D (2D) stage CRC samples, andthe association plot (2E). Topoisomerase 1 immunohistochemistry on normal (3A), Dukes B (3B), Dukes B (3C), Dukes D (3D) samples, and therelated association plot (3E). EGFR immunohystochemistry on normal (4A), normal (4B), Dukes B (4C), Dukes D (4D) samples, and the relatedassociation plot (4E).
genes are involved in metabolism, cell growth, cytokinesecretion and signal transduction regulation.
4. Discussion
Protein chips have been used in order to measurechanges in the expression of genes involved in sig-nal transduction and to examine the activation statusof proteins. While further developing this technolo-gy, however, the analysis of expression profiles is get-ting more and more attention. Using reverse phase ar-rays performed (RPA) on laser microdissected samples,primary tumours were successfully discriminated fromtheir metastases based on the phosphoproteomics pro-file of 29 genes involved in signal transduction [25]. Itis important to note that in previous AB array analysesthe number of genes showing a two-fold expression al-teration was very low. Therefore, the intra-group vari-
ance expressed by the p value is more useful than theexact values of expression changes.
Other studies also support that M values between0.5–0.7 represent acceptable protein level changes.In other words, the increase of protein expression to140 percent, as well as its decrease to 70 percent, rep-resent significant expression alterations [1].
The CCNE1 and CCND1 genes, which were foundto be significantly altered in our classification,have pre-viously been reported to be overexpressed in colorectalcancer. Higher levels of CCND1 have also been detect-ed in the plasma of CRC patients. Our TMA-validatedAB array results support this observation.
The MRE11A gene codes a protein in the cell nu-cleus that forms a complex with the RAD50 and NBS1proteins. This complex is involved in homolog re-combination, telomere protection and double strandedDNA repair, hence it can be classified as belonging tothe MMR gene family [20]. Our antibody array dataagree with the results of Giannini et al. that MRE11

S. Spisak et al. / Applicability of antibody and mRNA expression microarrays for identifying diagnostic 11
Fig. 3. Hierarchical clustering of 6 differentially expressed genes found to be associated with CRC subtype after TMA validation.
is downregulated in colon cancer, probably due to itsmutation which results in a truncated protein. How-ever, this observation made by AB array, could not bevalidated by TMA as protein expression did not changeeither in early or in late CRC.
Caldesmon 1 is expressed in low levels in colorec-tal cancer (GeneAtlas), but it was recently reportedthat this actin-binding protein plays a crucial role inthe invasivity of cancer cells [26]. Ectopic expressionof caldesmon 1 arrests extracellular matrix degrada-tion, and decreases podosomes and invadopodia. Theexamination of caldesmon 1 and related proteins maybe important in the assessment of tumour progression.The case of caldesmon 1 highlights a special errorof AB arrays: tissue specificity of protein expressionand sample homogeneity may influence the results.Caldesmon 1 is expressed mainly in smooth muscle andstromal cells, in cell layers around the crypts, and notin the epithelium. The M = 0.39 value measured byAB array suggests that this protein is underexpressed in
tumours. However, immunohistochemistry shows thatthis gene is highly overexpressed in some stromal cellgroups of tumours.
The opposing expression changes detected in thisstudy may be caused by a higher expression of the pro-tein in the stromal parts of the tumour, but these his-tological regions are relatively rare. It is also possiblethat during sample collection, the healthy colon wascontaminated with smooth muscle. This renders thevalidation of marker localization and tissue specificityeven more important.
Although association plots made according to the re-sults of cluster and TMA analyses show no significantmolecular alteration between the two disease groups,establishing a molecular-based disease classificationmay be useful in order to complement conventionalclinical disease classification.
During tumour progression, some proteins showedcontinuous overexpression (TOP1, HSP60), whileothers (APC) were consistently downregulated in a

12 S. Spisak et al. / Applicability of antibody and mRNA expression microarrays for identifying diagnostic
Fig. 4. Discrimination of tumor subtypes. Discriminant analysis of colonic biopsy specimens. Note the clear separation of the single classificationgroups based on the discriminatory genes detailed in the results section. Group 1 = normal, Group 2 = Dukes B colorectal cancer, Group 3 =Dukes D colorectal cancer.
Fig. 5. Associations between mRNA and protein expression levels (A). The selected positively (B) and negatively (C) correlating genes.
trend-like manner. EGFR showed a stage-associatedexpression, as in the phase of tumour growth it wasoverexpressed, and after metastasis development, itsexpression decreased.
Several different factors may help to explain the dis-crepancies found between protein array and immuno-histochemical analysis results. In some extreme cases,
antibody array and immunohistochemistry show oppo-site results (e.g. MRE11A and AR). One of the mostimportant facts, which is also decisive in this study, isthe distinct antigen–antibody interaction between pro-tein detection from protein extract and from FFPE tis-sue. As observed in case of Caldesmon1, both the tis-sue specific expression and the relative portion of tu-

S. Spisak et al. / Applicability of antibody and mRNA expression microarrays for identifying diagnostic 13
Fig. 6. The association between mRNA and protein products of 12 genes by M values of the two platforms. The first column (black) representsthe mRNA and the second column (gray) represents the protein expression.
mor cells may differ in tissue samples. Furthermore,different antibodies were applied on the AB array andthe TMA-based immunohistochemistry. A further ex-planation for the above mentioned discrepancies maybe tumor heterogeneity, because the crude extract forthe AB array was prepared from a relatively large tumortissue specimen, while TMAs contain only some 2mmcores from the representative area of the FFPE tissuesample. Another important fact is that each an-tibody was individually optimized in TMA experi-ments, while in case of AB microarray analysis sim-ilar circumstances are provided for hundreds of an-tibodies. In contrast to TMA evaluation, which isbased on discrete values and may have a subjectivecomponent, continuous variables are objectively eva-luted during array analysis. During TMA evalua-tion (scoring) we focused only on the epithelial re-gion. However, our experiences suggest that the dif-ferent cell types in the tumor microenvironment mayaffect protein array analysis causing the discrepan-cies between the results of the two platforms. Thestrong correlation between protein array and mRNAmay be explained by using the homogenized tissue andmicroarray platforms. Considering these parameters,the protein arrays may become useful tools for the as-sessment of protein expression in diagnostic practice,at present, however, immunohistochemical biomarkerdetection on TMAs seems to be more reliable and cost-effective.
To our knowledge, a similarly detailed study to de-termine whether there is an association between mRNAand protein expression has not been performed before.According to our data and primarily because of the highcorrelation values, it seems possible to predict proteinarray results based on whole genome mRNA expres-sion microarrays. These correlations may be increasedwith the help of better protocols that allow the simulta-neous isolation of RNA and protein in high quality andsufficient amounts while using a single set of startingmaterial.
High throughput antibody arrays may be useful forthe identification of protein biomarkers and diagnosticprotein expression patterns. The identification of mark-er combinations and their application in everyday prac-tice are important tasks where antibody microarraysmay be of fundamental importance. As this technologyis extremely sensitive, these marker combinations maybe used in screening, diagnostics and follow-up of dif-ferent stages of tumorous diseases. Today the numberof markers on antibody arrays is considerably lowerthan the number of genes on whole genome mRNAarrays although their price is higher. If a correlationcan be established between the results of whole genomemRNA chips and antibody arrays of limited capaci-ty, then the former may be used as a convenient highcapacity screening method before applying antibodyarrays that contain already planned targets. Based on

14 S. Spisak et al. / Applicability of antibody and mRNA expression microarrays for identifying diagnostic
our results, it seems that protein level changes can bepredicted by the results of mRNA expression analyses.This could be important in case of proteins whose in-tracellular concentration fluctuates rapidly. Because ofbiological processes that are not yet fully understood,such as stability, half-lifetime, RNA processing and itsregulation or posttranslational modifications, these re-sults must be carefully evaluated. Taking these fac-tors into consideration, antibody arrays may representa new approach for tumor and biomarker research.
Acknowledgements
We thank hereby the excellent technical assistanceof Gabriella Farkas and support of Tibor Kren acs Ph.D.for TMA immunohistochemistry optimalization.
References
[1] J. Madoz-Gurpide, M. Canamero, L. Sanchez, J. Solano, P.Alfonso and J.I. Casal, A proteomics analysis of cell signalingalterations in colorectal cancer, Mol Cell Proteomics 6 (2007),2150–2164.
[2] J.R. Jass, Classification of colorectal cancer based on cor-relation of clinical, morphological and molecular features,Histopathology 50 (2007), 113–130.
[3] S.B. Baylin, J.G. Herman, J.R. Graff, P.M. Vertino and J.P.Issa, Alterations in DNA methylation: a fundamental aspectof neoplasia, Adv Cancer Res 72 (1998), 141–196.
[4] G.A. Calin, C.M. Croce, MicroRNA-cancer connection: thebeginning of a new tale, Cancer Res 66 (2006), 7390–7394.
[5] G.A. Calin and C.M. Croce, MicroRNAs and chromosomalabnormalities in cancer cells, Oncogene 25 (2006), 6202–6210.
[6] G.A. Calin and C.M. Croce, MicroRNA signatures in humancancers, Nat Rev Cancer 6 (2006), 857–866.
[7] R.Z. Chen, U. Pettersson, C. Beard, L. Jackson-Grusby andR. Jaenisch, DNA hypomethylation leads to elevated mutationrates, Nature 395 (1998), 89–93.
[8] R. Garzon, M. Fabbri, A. Cimmino, G.A. Calin and C.M.Croce, MicroRNA expression and function in cancer, TrendsMol Med, 12 (2006), 580–587.
[9] H. Hayashi, G. Nagae, S. Tsutsumi, K. Kaneshiro, T.Kozaki, A. Kaneda, H. Sugisaki and H. Aburatani, High-resolution mapping of DNA methylation in human genomeusing oligonucleotide tiling array, Hum Genet 120 (2007),701–711.
[10] P.A. Jones and P.W. Laird, Cancer epigenetics comes of age,Nat Genet 21 (1999), 163–167.
[11] B. Vogelstein, E.R. Fearon, S.R. Hamilton, S.E. Kern, A.C.Preisinger, M. Leppert, Y. Nakamura, R. White, A.M. Smitsand J.L. Bos, Genetic alterations during colorectal-tumor de-velopment, N Engl J Med 319 (1988), 525–532.
[12] E.R. Fearon and B.A. Vogelstein, genetic model for colorectaltumorigenesis, Cell 61 (1990), 759–767.
[13] A. Leslie, F.A. Carey, N.R. Pratt and R.J. Steele, The colorectaladenoma-carcinoma sequence, Br J Surg (2002), 845–860.
[14] D.A. Notterman, U. Alon, A.J. Sierk and A.J. Levine, Tran-scriptional gene expression profiles of colorectal adenoma,adenocarcinoma, and normal tissue examined by oligonu-cleotide arrays, Cancer Res 61 (2001), 3124–3130.
[15] S. Spisak, Z. Tulassay, B. Molnar and A. Guttman, Proteinmicrochips in biomedicine and biomarker discovery, Elec-trophoresis 28 (2007), 4261–4273.
[16] O. Galamb, F. Sipos, E. Dinya, S. Spisak, Z. Tulassay andB. Molnar, mRNA expression, functional profiling and mul-tivariate classification of colon biopsy specimen by cDNAoverall glass microarray, World J Gastroenterol 12 (2006),6998–7006.
[17] O. Galamb, F. Sipos, B. Molnar, D. Szoke, S. Spisak and Z.Tulassay, Evaluation of malignant and benign gastric biopsyspecimens by mRNA expression profile and multivariate sta-tistical methods, Cytometry B Clin Cytom 72 (2007), 299–309.
[18] S. Spisak and A. Guttman, Biomedical applications of proteinmicroarrays, Curr Med Chem 16 (2009), 2806–2815.
[19] F. Bertucci, S. Salas, S. Eysteries, V. Nasser, P. Finetti, C.Ginestier, E. Charafe-Jauffret, B. Loriod, L. Bachelart, J.Montfort, G. Victorero, F. Viret, V. Ollendorff, V. Fert, M.Giovaninni, J.R. Delpero, C. Nguyen, P. Viens, G. Monges,D. Birnbaum and R. Houlgatte, Gene expression profiling ofcolon cancer by DNA microarrays and correlation with histo-clinical parameters, Oncogene 23 (2004), 1377–1391.
[20] G. Giannini, C. Rinaldi, E. Ristori, M.I. Ambrosini, F. Cerig-noli, A. Viel, E. Bidoli, S. Berni, G. D’Amati, G. Scambia,L. Frati, I. Screpanti and A. Gulino, Mutations of an intronicrepeat induce impaired MRE11 expression in primary humancancer with microsatellite instability, Oncogene 23 (2004),2640–2647.
[21] G. Giannini, E. Ristori, F. Cerignoli, C. Rinaldi, M. Zani, A.Viel, L. Ottini, M. Crescenzi, S. Martinotti, M. Bignami, L.Frati, I. Screpanti and A. Gulino, Human MRE11 is inactivatedin mismatch repair-deficient cancers, EMBO Rep 3 (2002),248–254.
[22] S.P. Gygi, Y. Rochon, B.R. Franza and R. Aebersold, Correla-tion between protein and mRNA abundance in yeast, Mol CellBiol 19 (1999), 1720–1730.
[23] E. Spooncer, N. Brouard, S.K. Nilsson, B. Williams, M.C.Liu, R.D. Unwin, D. Blinco, E. Jaworska, P.J. Simmons andA.D. Whetton, Developmental fate determination and markerdiscovery in hematopoietic stem cell biology using proteomicfingerprinting, Mol Cell Proteomics 7 (2008), 573–581.
[24] G.K. Smyth, Linear models and empirical bayes methods forassessing differential expression in microarray experiments,Stat Appl Genet Mol Biol 3 (2004), Article3.
[25] C. Belluco, E. Mammano, E. Petricoin, L. Prevedello, V.Calvert, L. Liotta, D. Nitti and M. Lise, Kinase substrate pro-tein microarray analysis of human colon cancer and hepaticmetastasis, Clin Chim Acta 357 (2005), 180–183.
[26] T. Yoshio, T. Morita, Y. Kimura, M. Tsujii, N. Hayashi andK. Sobue, Caldesmon suppresses cancer cell invasion by reg-ulating podosome/invadopodium formation, FEBS Lett 581(2007), 3777–3782.

Submit your manuscripts athttp://www.hindawi.com
Stem CellsInternational
Hindawi Publishing Corporationhttp://www.hindawi.com Volume 2014
Hindawi Publishing Corporationhttp://www.hindawi.com Volume 2014
MEDIATORSINFLAMMATION
of
Hindawi Publishing Corporationhttp://www.hindawi.com Volume 2014
Behavioural Neurology
EndocrinologyInternational Journal of
Hindawi Publishing Corporationhttp://www.hindawi.com Volume 2014
Hindawi Publishing Corporationhttp://www.hindawi.com Volume 2014
Disease Markers
Hindawi Publishing Corporationhttp://www.hindawi.com Volume 2014
BioMed Research International
OncologyJournal of
Hindawi Publishing Corporationhttp://www.hindawi.com Volume 2014
Hindawi Publishing Corporationhttp://www.hindawi.com Volume 2014
Oxidative Medicine and Cellular Longevity
Hindawi Publishing Corporationhttp://www.hindawi.com Volume 2014
PPAR Research
The Scientific World JournalHindawi Publishing Corporation http://www.hindawi.com Volume 2014
Immunology ResearchHindawi Publishing Corporationhttp://www.hindawi.com Volume 2014
Journal of
ObesityJournal of
Hindawi Publishing Corporationhttp://www.hindawi.com Volume 2014
Hindawi Publishing Corporationhttp://www.hindawi.com Volume 2014
Computational and Mathematical Methods in Medicine
OphthalmologyJournal of
Hindawi Publishing Corporationhttp://www.hindawi.com Volume 2014
Diabetes ResearchJournal of
Hindawi Publishing Corporationhttp://www.hindawi.com Volume 2014
Hindawi Publishing Corporationhttp://www.hindawi.com Volume 2014
Research and TreatmentAIDS
Hindawi Publishing Corporationhttp://www.hindawi.com Volume 2014
Gastroenterology Research and Practice
Hindawi Publishing Corporationhttp://www.hindawi.com Volume 2014
Parkinson’s Disease
Evidence-Based Complementary and Alternative Medicine
Volume 2014Hindawi Publishing Corporationhttp://www.hindawi.com