Embed Size (px)
Citation preview

Research ArticleIoT Healthcare: Design of Smart and Cost-Effective Sleep QualityMonitoring System
Khizra Saleem ,1 Imran Sarwar Bajwa ,1 Nadeem Sarwar ,2 Waheed Anwar ,1
and Amna Ashraf1
1Department of Computer Science & IT, The Islamia University of Bahawalpur, Bahawalpur, Pakistan2Department of Computer Science, Bahria University, Lahore, Pakistan
Correspondence should be addressed to Imran Sarwar Bajwa; [email protected]
Received 20 July 2020; Revised 30 September 2020; Accepted 5 October 2020; Published 24 October 2020
Academic Editor: ahmed alkhayyat
Copyright © 2020 Khizra Saleem et al. This is an open access article distributed under the Creative Commons Attribution License,which permits unrestricted use, distribution, and reproduction in any medium, provided the original work is properly cited.
Getting quality sleep is important for every person to get better physical health. Irregular sleep patterns may indicate the illnessresulting in chronic depression, which makes the evaluation of the sleep cycle mandatory for a healthy body and mind. In thearena of globalization, along with the increased facilities, various other challenges have been probed to provide the quality healthcare facilities with the use of economical instruments and technology. The development of the Internet of Things (IoT)technology purports the preambles to build a consistent and cost-effective system to monitor the sleep quality of patients.Several other systems are available for this purpose; however, such systems are very costly and difficult to implement. Toovercome the issue, this study suggests an inventive system to monitor and analyze the sleep patterns using ambient parameters.The proposed system is effective enough that it can proficiently monitor patient’s sleep using Commercial off the Shelf (COS)sensors as well as predicts the results using the intelligent capability of the random forest model. The patient’s bio statusincluding physical movement of the body, heartbeat, SPO2 level (oxygen saturation in the blood for the proper functioning ofthe body), and snoring patterns could be measured through this system, in which recorded data is transmitted to the computersystem in a real-time environment. This system consists of two parts. One part consists of analyzing the behavior of data usingthe intelligent technique of the random forest model and decision rules in a real-time environment. This real-time analysisnotifies the caretaker about the situation of the patient. In the second part, batch data processing is performed which allows thedetailed analysis of data using statistical methods to produce the overall condition of the patient in a specified interval of time.Through the proposed system, we can easily measure the sleep patterns of patients and provide them with better treatment byusing this simple and cost-effective system. The result of the conducted research shows that the proposed technique provides95% accuracy. The patient’s sleep data is used to test this method through the validation of manual results, which provides theminimum error rate. This study highlights the implementation of an intelligent and smart sleep quality monitoring system usingIoT on a variant number of people with minimum expense rate.
1. Introduction
In broad-spectrum, sleep is related to “brain activity,” andthis brain activity helps in to pull through brain exhaustion[1]. Quality sleep provides good mental health as it mini-mizes fatigue of daily routine and sleepiness, which leaves apositive impact on the body. Any disruption in the sleep cycleresults in poor physical and mental health, as various otherinternal and external factors contribute to sleep abnormali-ties. However, major categories are mental/psychological
factors, biological factors, and environmental factors [2].Sleeping illness triggered through the physiological factorsresults in different mental problems like anxiety and depres-sion. Nowadays, anxiety is the number one cause of manyproblems. Short-term illness fluctuates the biological systemthat interrupts the sleep of a person, consequently leading tothe long-term effects. Thismay also happen due to disturbancein the body’s nervous system, metabolism, and cardiac system.The last one is the environmental factor, which containsphysical features, as these factors include environmental
HindawiJournal of SensorsVolume 2020, Article ID 8882378, 17 pageshttps://doi.org/10.1155/2020/8882378
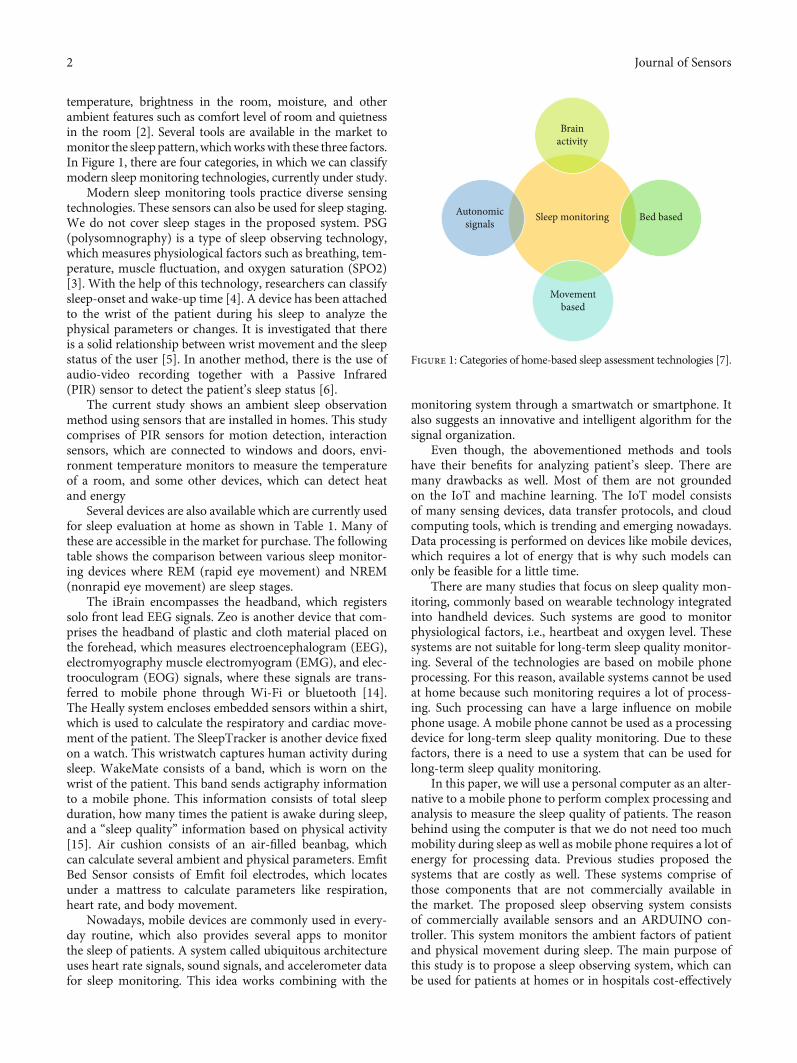
temperature, brightness in the room, moisture, and otherambient features such as comfort level of room and quietnessin the room [2]. Several tools are available in the market tomonitor the sleeppattern,whichworkswith these three factors.In Figure 1, there are four categories, in which we can classifymodern sleep monitoring technologies, currently under study.
Modern sleep monitoring tools practice diverse sensingtechnologies. These sensors can also be used for sleep staging.We do not cover sleep stages in the proposed system. PSG(polysomnography) is a type of sleep observing technology,which measures physiological factors such as breathing, tem-perature, muscle fluctuation, and oxygen saturation (SPO2)[3]. With the help of this technology, researchers can classifysleep-onset and wake-up time [4]. A device has been attachedto the wrist of the patient during his sleep to analyze thephysical parameters or changes. It is investigated that thereis a solid relationship between wrist movement and the sleepstatus of the user [5]. In another method, there is the use ofaudio-video recording together with a Passive Infrared(PIR) sensor to detect the patient’s sleep status [6].
The current study shows an ambient sleep observationmethod using sensors that are installed in homes. This studycomprises of PIR sensors for motion detection, interactionsensors, which are connected to windows and doors, envi-ronment temperature monitors to measure the temperatureof a room, and some other devices, which can detect heatand energy
Several devices are also available which are currently usedfor sleep evaluation at home as shown in Table 1. Many ofthese are accessible in the market for purchase. The followingtable shows the comparison between various sleep monitor-ing devices where REM (rapid eye movement) and NREM(nonrapid eye movement) are sleep stages.
The iBrain encompasses the headband, which registerssolo front lead EEG signals. Zeo is another device that com-prises the headband of plastic and cloth material placed onthe forehead, which measures electroencephalogram (EEG),electromyography muscle electromyogram (EMG), and elec-trooculogram (EOG) signals, where these signals are trans-ferred to mobile phone through Wi-Fi or bluetooth [14].The Heally system encloses embedded sensors within a shirt,which is used to calculate the respiratory and cardiac move-ment of the patient. The SleepTracker is another device fixedon a watch. This wristwatch captures human activity duringsleep. WakeMate consists of a band, which is worn on thewrist of the patient. This band sends actigraphy informationto a mobile phone. This information consists of total sleepduration, how many times the patient is awake during sleep,and a “sleep quality” information based on physical activity[15]. Air cushion consists of an air-filled beanbag, whichcan calculate several ambient and physical parameters. EmfitBed Sensor consists of Emfit foil electrodes, which locatesunder a mattress to calculate parameters like respiration,heart rate, and body movement.
Nowadays, mobile devices are commonly used in every-day routine, which also provides several apps to monitorthe sleep of patients. A system called ubiquitous architectureuses heart rate signals, sound signals, and accelerometer datafor sleep monitoring. This idea works combining with the
monitoring system through a smartwatch or smartphone. Italso suggests an innovative and intelligent algorithm for thesignal organization.
Even though, the abovementioned methods and toolshave their benefits for analyzing patient’s sleep. There aremany drawbacks as well. Most of them are not groundedon the IoT and machine learning. The IoT model consistsof many sensing devices, data transfer protocols, and cloudcomputing tools, which is trending and emerging nowadays.Data processing is performed on devices like mobile devices,which requires a lot of energy that is why such models canonly be feasible for a little time.
There are many studies that focus on sleep quality mon-itoring, commonly based on wearable technology integratedinto handheld devices. Such systems are good to monitorphysiological factors, i.e., heartbeat and oxygen level. Thesesystems are not suitable for long-term sleep quality monitor-ing. Several of the technologies are based on mobile phoneprocessing. For this reason, available systems cannot be usedat home because such monitoring requires a lot of process-ing. Such processing can have a large influence on mobilephone usage. A mobile phone cannot be used as a processingdevice for long-term sleep quality monitoring. Due to thesefactors, there is a need to use a system that can be used forlong-term sleep quality monitoring.
In this paper, we will use a personal computer as an alter-native to a mobile phone to perform complex processing andanalysis to measure the sleep quality of patients. The reasonbehind using the computer is that we do not need too muchmobility during sleep as well as mobile phone requires a lot ofenergy for processing data. Previous studies proposed thesystems that are costly as well. These systems comprise ofthose components that are not commercially available inthe market. The proposed sleep observing system consistsof commercially available sensors and an ARDUINO con-troller. This system monitors the ambient factors of patientand physical movement during sleep. The main purpose ofthis study is to propose a sleep observing system, which canbe used for patients at homes or in hospitals cost-effectively
Sleep monitoring
Brainactivity
Bed based
Movementbased
Autonomicsignals
Figure 1: Categories of home-based sleep assessment technologies [7].
2 Journal of Sensors
and can do monitoring in more than one day/night. The pro-posed system consists of sensors, which are easily available inthe market.
The proposed approach has the following key features.
(i) This approach uses three sensors: an accelerometer,a microphone, and a pulse oximeter
(ii) This approach uses an intelligent random forestmethod to predict the sleeping quality of the person
(iii) This approach is low cost as it uses very cheap andeasily available sensors for monitoring sleep
(iv) The proposed approach can be effectively used athome or in the hospital, to monitor the patient’ssleep patterns during sleep
(v) The proposed system is intelligent enough that itworks accurately with a minimum error rate
This system contributes to medical science technology byhelping people to enjoy better sleep. The main objective ofthis work is to offer a system that should be inexpensive aswell as easy to use for patients with a better level of accuracy.This system employs an intelligent technique of analyzing thesleep patterns that is not previously used in research work.This paper is aimed at proposing a low-cost and intelligentmethod of monitoring sleep patterns using IoT. The rest ofthe paper is structured into a set of units: unit 2 discussesthe related work of sleep monitoring technologies andmethods. Unit 3 consists of the structural design and func-tioning of the proposed methodology. Unit 4 describes theimplementation and experiments. Unit 5 entails the resultsand discussion, whereas unit 6 concludes the whole research.
2. Literature Review
Sleep analysis methods are very useful in monitoringpersons’ health and fitness. The paper [16] stated thatelectrocardiogram-based EDR (electrocardiographicallyderived respiration) signal is used to determine the heartbeatand respiration of patients during apnea. Actual respiratorysignals provide an accuracy of about 85%. Chest movementcan be determined to monitor the breathing patterns of the
patient. Other than that, movement of the chest can be usedto detect the breathing phase. This pattern provides infor-mation on ontogenetic alteration [17]. The continuity ismeasured using the sleep duration of the patient, whichconsists of noninterrupt sleep phases. A person’s physicalmovement during sleep can be measured with two impor-tant factors, which are termed as movement time (MT)and movement events (ME).
Polysomnography (PSG) is considered as the “medicalgold standard” to monitor sleep stages and sleep patterns ofa person [18]. PSG is conducted in a fully controlled atmo-sphere like a sleep lab. This method diagnoses several sleep-related problems, which include breathing problems andsleep apneas. In PSG, sensors are attached to the patient’sbody. These sensors record psychological and biologicalparameters, i.e., brain activity, heartbeat, and oxygen satura-tion during sleep. The sleep monitor converts this sleep datainto different sleep quality categories accordingly. PSG is lim-ited to short-term sleep sensing since it is performed in a laband thus may not be an accurate representation of a patient’stypical sleep habits. TheWatchPAT is easy-to-use device thatcan be moved easily. This device records Peripheral ArterialTone (PAT) and nervous system signals during sleep. Nolab is required in this sleep monitoring mechanism. Eventhough this device provides sleep apnea monitoring in ourhomes, but still this is not a very useful method, as a userhas to wear the device at night. [19]
EEG is known as an authentic sleep monitor, but thereare also other sleep sensors available in the market, whichare easy to use [20]. Sleep monitors such as Zeo measuressleep patterns by calculating the signals in the brain. Theseelectrical signals provide information of the nervous systemof a patient during sleep. This device consists of a headbandthat a user wears during the night, but there are also thechances of a sense of uncomfortable being felt by the userdue to the sensors on the body during sleep [21]. To over-come this issue, several devices were introduced, which areless disturbing. The body movement of patients can be mea-sured through an easy technique called actigraphy. Thisstudy provides the quality of sleep using body movement[5]. It is very easy to calculate the physical movement of apatient using an accelerometer [22]. Due to this reason, acti-graphy is considered an easy method to calculate sleep
Table 1: Comparison of accuracy in various sleep monitoring technologies.
Sleep monitoring technologies Types Population Accuracy Reference
Brain activity signaliBrain (NeuroVigil) N/A 84% [8]
Zeo 26 75% [9]
Autonomic signals Heally recording system 6 80% [10]
Movement
SleepTracker 18 >90% [10]
WakeMate N/A 95-98% [10]
Air cushion 882.6% in NREM sleep38.3% in REM sleep
[11]
Emfit bed sensor 17 71% with PSG data [11]
Bed-based sleep monitorsHome Health Station (TERVA) N/A 86% to 98% [12]
SleepMinder (BiancaMed) 153 78% [13]
3Journal of Sensors
quality using different commercially available devices such asFitbit and jawbone. Mobile phones can also be used to easethis process: all instruments, which are based on a built-ingyroscope. Continuously, monitored accelerometer recordsare categorized into different classes [23]. These classes arebased on the type of study, for example, rotation, sitting,and twisting. However, the user has to carry a band whilesleeping during which a mobile phone is also needed. Tracingonly one physiological factor is also the disadvantage of thisapproach. This can cause the wrong result due to overrateor underrate values of some parameters of sleep such as sleepquality and sleep time [24].
It has been believed that the sound sleep could be moni-tored for grownups through actigraphy [25], but variouslimitations have been observed for use of kids, old peoples,and persons with sleep abnormalities. In modern research,community people are focusing more on noncontact sleepmonitors, which work by obtaining the psychological andphysiological parameters related to a person’s sleep. In [26],Lullaby was introduced which monitors environmentalfactors that can affect the quality of sleep. The proposedsystem consists of several sensors that include the environ-mental sensors and physical movement recorders. In manypieces of researches, sensors were embedded in smartphonesto perform the sleep monitoring. iSleep [27] records thepatient’s sound using a built-in microphone amplifier. Thesesounds include snoring patterns and the body’s physicalactivity. Sleep Hunter introduced by Gu et al. [28] consistsof a mobile phone. This smartphone is used to monitor thephysiological and environmental factors to monitor sleepstages using a built-in microphone, accelerometer, and lightsensor. Recording the sleep-related parameters can cause pri-vacy issues as sleep is considered as a private activity [26].
Medical research shows that fundamental signals varyfrom person to person during sleep, which includes wakeful-
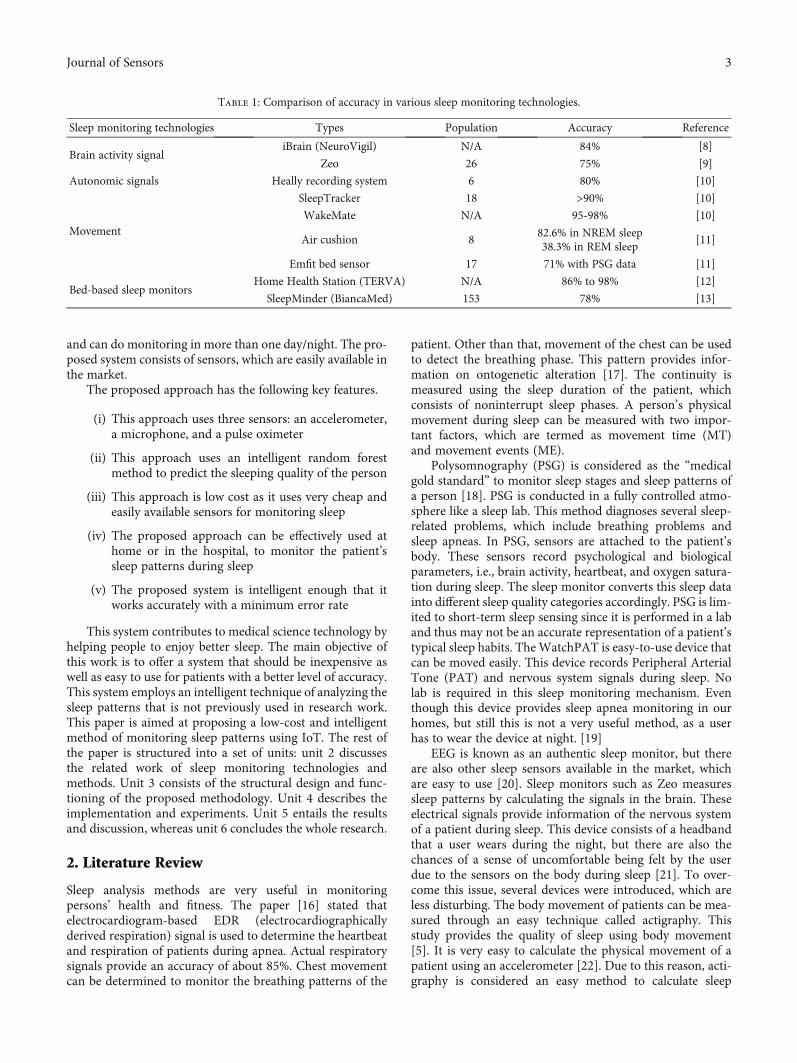
ness, REM, and non-REM [29]. For this reason, respiratorysignals and heartbeat parameters can be considered as signsof sleep stages evolution. Recently, developed sensors calledAura consist of a bed, which is pressure sensitive. This bedrecords the physical movements and biological parameters.However, a limitation has been seen in these kinds ofsensors, as they are very costly and not easily available touse. Figure 2 outlines the comparison of various sleep sensingtechnologies [30–33].
In this research, a smart and intelligent sleep monitoringsystem has been proposed which monitors the patient’s vitalelements like a heartbeat, oxygen saturation, bodymovement,and snoring patterns. By detecting variations in vital signs, theproposed systems classify them into different sleep qualityclasses. The proposed system is efficient in terms of resultaccuracy and cost as compared to other devices and systems.
3. Design of Proposed System
The designed system is smart and intelligent enough that ithas been used for the assessment of a person’s sleep. Throughthis system, it can be identified that when a person is sleepingpeacefully and when he is not peaceful. Using real-time dataof patients, we can propose that whether a person had peace-ful sleep or not. Ambient data of patients is recorded fromsensors and then send to a computer system for storage andanalysis. An algorithm called the random forest then analyzesthe data. This algorithm intelligently classifies the data intofive different categories. These categories are “peaceful, verypeaceful, medium, un-peaceful and very un-peaceful.”“Peaceful” means the patient is sleeping peacefully [34].“Very peaceful”means the patient is getting very comfortablesleep. The “Medium” category means the patient is havingnormal sleep. The “Un-peaceful” category suggests that thepatient is unpeaceful during sleep. The “Very un-peaceful”
Sleep sensing
Diagnostic
Contact
PSG
Daily tracking
Contactless
Dopple sleep
Sleep stage mining
Sleep hunter
Sleep stage mining
Contact
Aura
Sleep stage mining
Zeobrain activity
Sleep stage mining
FitBit, jawbone
Sleep stage mining
Figure 2: Comparison of different state of the art sleep monitoring methodologies with respect to their usage, availability, affordances,prediction methodologies, and forecasted sleep variables [3].
4 Journal of Sensors

category indicates the very restless sleep of the patient. Thestructural design of the projected system is shown inFigure 3 as given below.
The proposed system works with external sensors, whichare communicating with a microcontroller. This is a three-layer architecture; in the first step, data is transferred fromsensors to the Arduino microcontroller. In the second step,the Arduino microcontroller sends this data to the computersystem. Data is stored in the file and used for training andtesting of the classifier, which is trained with this data. Afterthat, in a real-time environment, the patient’s data iscollected, and the system tells about the quality of sleep.
3.1. Data Collection from Sensors. The first step in thisapproach is to collect data from the sensors. This dataincludes the heart rate, SPO2 (peripheral capillary oxygensaturation), snoring detection, and accelerometer data. Allsensors are connected to the microcontroller. The followingFigure 4 shows how the system works in real-time.
The Figure 4 represents the hardware integration of theproposed system. The accelerometer and pulse oximeter areconnected to the microcontroller. The microphone is alsoattached to the Arduino microcontroller, which serves as a
basis for the whole system. The microcontroller is thenattached to the computer system. The data recorded fromsensors forwarded to the microcontroller. The microcontrol-ler further sends data to the computer system. The computerprocesses the data using an intelligent classifier named asrandom forest. This model makes the predictions andpresents the result to the user mobile.
3.2. Supervised Model. In supervised modelling, we know thelabels of input data. The whole data is being classified withinthe set of labels that are available concerning the data. Firstly,we train the algorithm with the input dataset, which islabelled data (training data). Based on this, we test the modelusing test data. The algorithm makes predictions appropri-ately on input data and estimates the ground truths itera-tively until the desired level of accuracy is reached. Theworking of the model is explained in Figure 5.
In Figure 5, supervised learning model working startswith two values. One value is the original data, and secondis its attribute. Attribute is the classified value (class) whichis assigned to the instances. This data is further divided intotwo sets, i.e., training data and test data. This data is passedto the model builder which prepares the data for modeling.
Sleep monitoring system
Sensingsystem
Randomforestmodel
OutputSPO2
Figure 3: Architecture of sleep monitoring system.
1. Reading through sensors
ADXL345accelerometer
MAX30100pulse oximeter
MAX9814microphone
amplifier
2. Recording input
3. Random forestprocessing
4. Resultsvisualization
Environmentsetups
Decisiontree T2
Decisiontree Tf
Decisiontree T1
Random forest
Figure 4: Hardware component integration of sleep monitoring system.
5Journal of Sensors
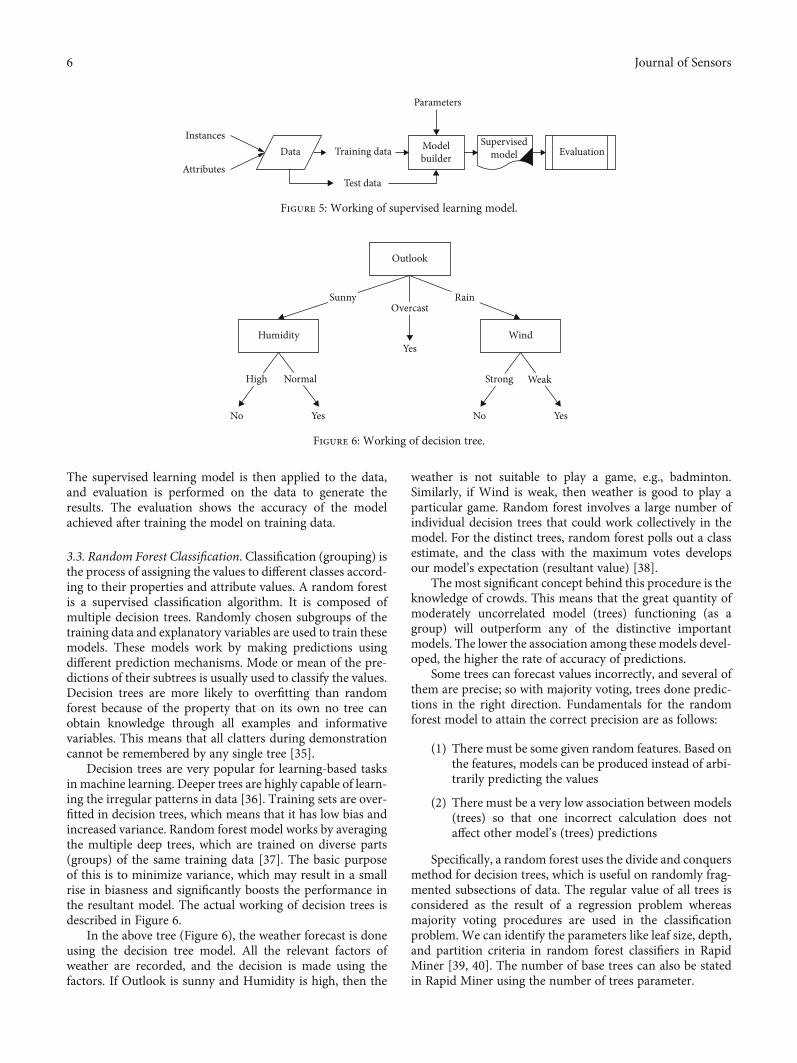
The supervised learning model is then applied to the data,and evaluation is performed on the data to generate theresults. The evaluation shows the accuracy of the modelachieved after training the model on training data.
3.3. Random Forest Classification.Classification (grouping) isthe process of assigning the values to different classes accord-ing to their properties and attribute values. A random forestis a supervised classification algorithm. It is composed ofmultiple decision trees. Randomly chosen subgroups of thetraining data and explanatory variables are used to train thesemodels. These models work by making predictions usingdifferent prediction mechanisms. Mode or mean of the pre-dictions of their subtrees is usually used to classify the values.Decision trees are more likely to overfitting than randomforest because of the property that on its own no tree canobtain knowledge through all examples and informativevariables. This means that all clatters during demonstrationcannot be remembered by any single tree [35].
Decision trees are very popular for learning-based tasksin machine learning. Deeper trees are highly capable of learn-ing the irregular patterns in data [36]. Training sets are over-fitted in decision trees, which means that it has low bias andincreased variance. Random forest model works by averagingthe multiple deep trees, which are trained on diverse parts(groups) of the same training data [37]. The basic purposeof this is to minimize variance, which may result in a smallrise in biasness and significantly boosts the performance inthe resultant model. The actual working of decision trees isdescribed in Figure 6.
In the above tree (Figure 6), the weather forecast is doneusing the decision tree model. All the relevant factors ofweather are recorded, and the decision is made using thefactors. If Outlook is sunny and Humidity is high, then the
weather is not suitable to play a game, e.g., badminton.Similarly, if Wind is weak, then weather is good to play aparticular game. Random forest involves a large number ofindividual decision trees that could work collectively in themodel. For the distinct trees, random forest polls out a classestimate, and the class with the maximum votes developsour model’s expectation (resultant value) [38].
The most significant concept behind this procedure is theknowledge of crowds. This means that the great quantity ofmoderately uncorrelated model (trees) functioning (as agroup) will outperform any of the distinctive importantmodels. The lower the association among these models devel-oped, the higher the rate of accuracy of predictions.
Some trees can forecast values incorrectly, and several ofthem are precise; so with majority voting, trees done predic-tions in the right direction. Fundamentals for the randomforest model to attain the correct precision are as follows:
(1) There must be some given random features. Based onthe features, models can be produced instead of arbi-trarily predicting the values
(2) There must be a very low association between models(trees) so that one incorrect calculation does notaffect other model’s (trees) predictions
Specifically, a random forest uses the divide and conquersmethod for decision trees, which is useful on randomly frag-mented subsections of data. The regular value of all trees isconsidered as the result of a regression problem whereasmajority voting procedures are used in the classificationproblem. We can identify the parameters like leaf size, depth,and partition criteria in random forest classifiers in RapidMiner [39, 40]. The number of base trees can also be statedin Rapid Miner using the number of trees parameter.
Instances
AttributesData Training data Model
builderSupervised
model Evaluation
Parameters
Test data
Figure 5: Working of supervised learning model.
SunnyOvercast
High Strong WeakNormal
Yes
YesNo YesNo
Outlook
Humidity Wind
Rain
Figure 6: Working of decision tree.
6 Journal of Sensors

Working with this classifier comprises of four easy andsimple steps as shown in Figure 7.
(1) Initially, random samples are selected from thespecified dataset
(2) For each sample, a decision tree is produced, and theresult is predicted for each decision tree
(3) Voting is accomplished for each projected result
(4) Final calculation results are selected with the mostvotes of the calculation result
Random forest is an organization method, which createsrelations between multiple tree predictors. This relationshows each tree depends upon the value of the vector, whichis selected randomly. This random vector is scattered betweenall trees in the forest in the same manner. So, the basic mech-anism is, a random vector say θk is generated which is notrelated to previous randomvectors. This randomvector is dis-tributed among all trees. Each tree is expanded based on thetraining set and vector θk. It is a collection of randomly dis-tributed classifiers which is denoted as fhðx, θkÞ, k = 1,⋯gin which x is the input value which is to be classified [31].
Strength and correlation were two constraints to measurethe correctness of each classifier and need between them.Random forest is created by obtaining the input values oneach node. This random forest is based on random features.In the proposed methodology, the random forest model has21 random subtrees. Every subtrees is accumulated togetherwhile considering five random classes (peaceful, very peace-ful, medium, unpeaceful, and very unpeaceful). Random fea-tures and trees obtained the optimal results by consideringthe different values and features that are estimated by themodel. Classification accurateness is used as a suitable fittingmethod. Consequently, 21 subtrees provided the finest preci-sion results.
3.4. Performance Criteria of Random Forest Classification.The performance of machine learning methods can bedefined using different techniques. The most commonly usedtechnique is to partition the complete data into differentparts. We divided the data into three parts: training set, vali-
dation set, and testing set. These sets were selected randomly.First of all, data is trained using the training dataset; classifierparameters are improved using the validation set, and lastly,unseen data is tested with this classifier. Errors and inaccura-cies of the model were identified using the test data. Nowa-days, this approach is not considered as accurate. Anotherreason is training samples are not so much demonstrativebecause there must be one class which have equally dividedinto portion in training and test set.
To overcome this problem, a more well-organized proce-dure is cross-validation. In this method, the multiple folds ofdata are produced, as these folds are slices of supplied data.These folds are used for training, testing, and validation ofthe model [32]. This process is repeated any number of timesand in each training and testing elements of folds change.This process is repeated according to the number of foldsdefined [33]. In the proposed methodology, 10-fold cross-validation was performed on data. In this, the dataset isdistributed into 10 folds. Training and testing are performed10 times; in each iteration, the model is tested with onefoldfrom all folds called k. Model is trained with k-1 folds. Afterthat, the mean accurateness of cross-validation is obtainedwith the following equation:
CVAE = 1k〠K
i=1Ei: ð1Þ
In this equation (1), CVAE means cross-validation accu-racy error rate, where k is the total number of folds and Eishows test experiments of every fold [40].
Training set
Test set
Trainingsample 1
Trainingsample 2
Decision tree2
Trainingsample n
Decision treen
Decision tree1
Voting
Prediction
Figure 7: Functional random forest classifier.
Figure 8: Triple axis accelerometer.
7Journal of Sensors
4. Implementation Details
This cost-effective method for sleep analysis was executed inRapid Miner. This system implemented in the lab practicesthe Arduino mega (2560) controller as a central microcon-troller. This controller takes real-time records from sensorsand forwards them to the random forest model in the com-puter system. This model is primarily based on the maincomputer that is attached to the microcontroller. A briefexplanation of the sensors and techniques used in this sleepmonitoring approach is below.
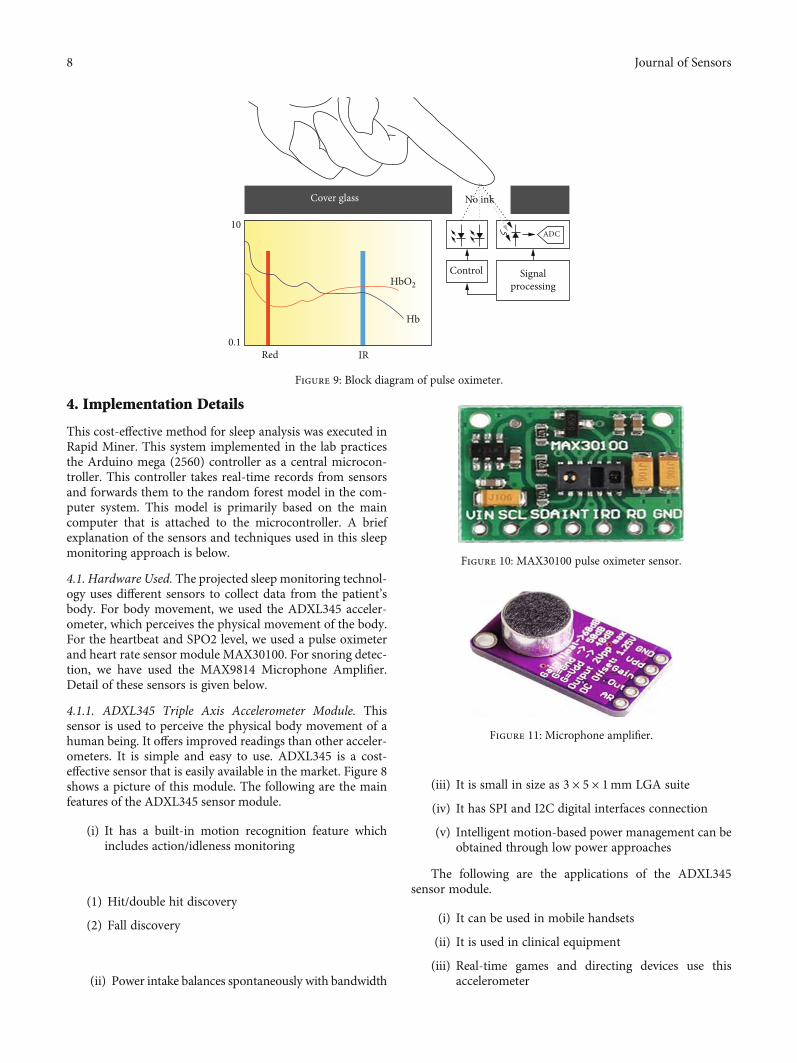
4.1. Hardware Used. The projected sleep monitoring technol-ogy uses different sensors to collect data from the patient’sbody. For body movement, we used the ADXL345 acceler-ometer, which perceives the physical movement of the body.For the heartbeat and SPO2 level, we used a pulse oximeterand heart rate sensor module MAX30100. For snoring detec-tion, we have used the MAX9814 Microphone Amplifier.Detail of these sensors is given below.
4.1.1. ADXL345 Triple Axis Accelerometer Module. Thissensor is used to perceive the physical body movement of ahuman being. It offers improved readings than other acceler-ometers. It is simple and easy to use. ADXL345 is a cost-effective sensor that is easily available in the market. Figure 8shows a picture of this module. The following are the mainfeatures of the ADXL345 sensor module.
(i) It has a built-in motion recognition feature whichincludes action/idleness monitoring
(1) Hit/double hit discovery
(2) Fall discovery
(ii) Power intake balances spontaneously with bandwidth
(iii) It is small in size as 3 × 5 × 1mm LGA suite
(iv) It has SPI and I2C digital interfaces connection
(v) Intelligent motion-based power management can beobtained through low power approaches
The following are the applications of the ADXL345sensor module.
(i) It can be used in mobile handsets
(ii) It is used in clinical equipment
(iii) Real-time games and directing devices use thisaccelerometer
HbO2
Hb
IRRed0.1
10
No inkCover glass
Signalprocessing
ADC
Control
Figure 9: Block diagram of pulse oximeter.
Figure 10: MAX30100 pulse oximeter sensor.
Figure 11: Microphone amplifier.
8 Journal of Sensors
(iv) Private direction-finding equipment
(v) Hard disk drive (HDD) protection can be doneeasily using this sensor
4.1.2. MAX30100 Pulse Oximeter. MAX30100 is a heart ratemonitor which contains two LEDs and an intelligent analogsignal processing unit for pulse rate monitoring. Structureblock diagram of this sensor is shown in Figure 9. Figure 10shows picture of MAX30100 pulse oximeter.
The main features of the MAX30100 sensor are as follows.
(i) The design of this pulse oximeter consists of anincorporated LED, photo sensor, and analog system,which is high in performance
(ii) It is small in size and easy to use
(iii) A low power management system enables anincrease in battery timing for wearable devices
(iv) The sample rate in this device can be programmedaccording to the requirement for power saving
4.1.3. MAX9814 Microphone Amplifier. The MAX9814 is acheap, first-class microphone, which provides the functional-ity of a low noise signal detection. This microphone amplifiermodule provides high sensitivity. This module support 20 to20 kHz frequency. Besides, thanks to the MAX9814 amp, itimplements a spontaneous expansion regulator, escapingirresistible and distortion of the amplifier when sound levelscan change arbitrarily, as in the scenario proposed in thispaper [20].
This microphone amplifier is good to use when audialdata is required. This is useful when the audio frequencychanges rapidly and changing the amp increase is not possi-ble every time. The amount of data produced is 2Vpp; hence,analog/digital conversion is easy with the MAX9814 modulethat ranges up to 3.3V input. Figure 11 shows the amplifiermodule used in this study.
Main features of MAX9814 are as follows:
(i) It has an automatic shut down on low power mode
(ii) It is small in size which saves a lot of space whileusing
(iii) It has an increased range of supporting temperature,which is -40°C to +85°C
(iv) Automatic gain, selectable max from 40dB, 50 dB, or60 dB
Applications of MAX9814 are as follows:
(i) It is used in digital cameras
(ii) It is used in digital video recorders
(iii) It is used in personal digital assistants
(iv) It is widely used in bluetooth devices
(v) It is used in two-way communication devices
(vi) Telephone conferencing and IPphones use this sensor
4.2. Design of the Proposed System. The introduced patient’ssleep quality monitoring system includes patients’ ambientparameter monitor. These parameters include heart rate,SPO2, body movement, and snoring patterns of the patient.All sensors are connected to the Arduino controller. Thesensors are as follows:
(i) Pulse sensor
(ii) Triple axis accelerometer
(iii) Microphone amplifier
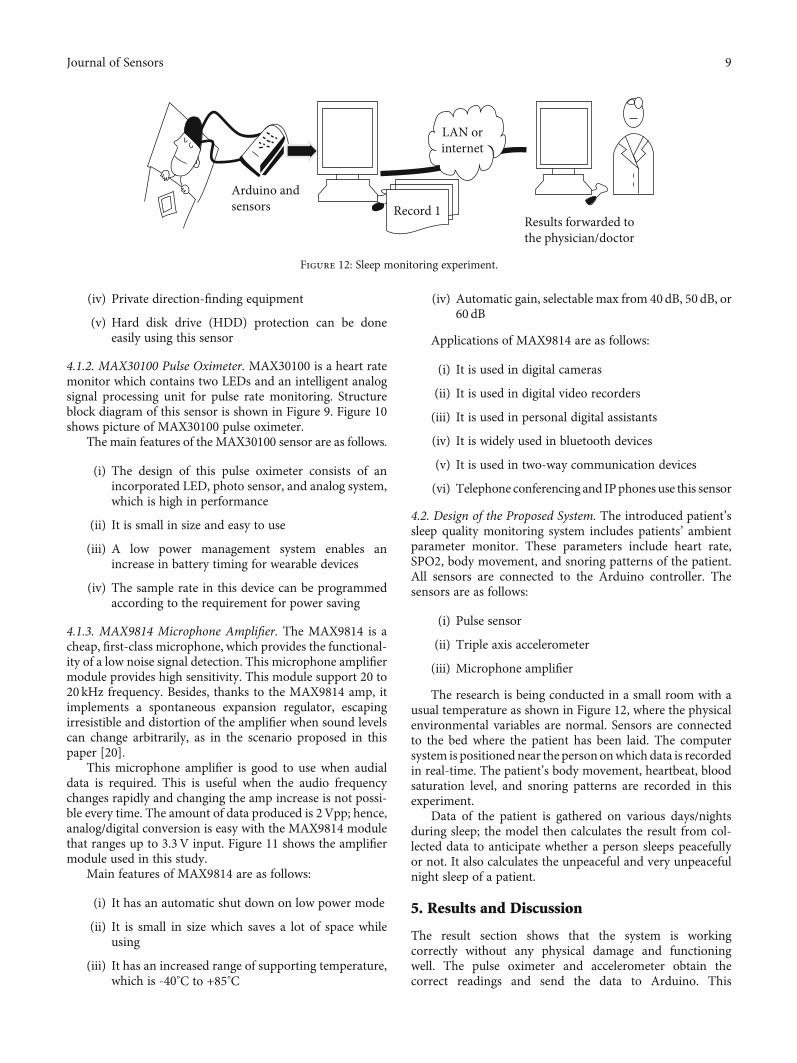
The research is being conducted in a small room with ausual temperature as shown in Figure 12, where the physicalenvironmental variables are normal. Sensors are connectedto the bed where the patient has been laid. The computersystem is positioned near the person onwhich data is recordedin real-time. The patient’s body movement, heartbeat, bloodsaturation level, and snoring patterns are recorded in thisexperiment.
Data of the patient is gathered on various days/nightsduring sleep; the model then calculates the result from col-lected data to anticipate whether a person sleeps peacefullyor not. It also calculates the unpeaceful and very unpeacefulnight sleep of a patient.
5. Results and Discussion
The result section shows that the system is workingcorrectly without any physical damage and functioningwell. The pulse oximeter and accelerometer obtain thecorrect readings and send the data to Arduino. This
Arduino andsensors
Results forwarded tothe physician/doctor
Record 1
LAN orinternet
Figure 12: Sleep monitoring experiment.
9Journal of Sensors
microcontroller communicates with the server and storesthe data in it. The results were shown on the server com-puter as well as on mobile app.
This cost-effective technique of sleep monitoring is anintellectual system applied to the latest and inexpensivetechnology. This system uses intellectual decision-makingrandom forest classification procedure. In the previoussection, we have considered the implementation detailed withall hardware descriptions used the proposed sleep qualitymonitoring system. Now in the testing procedure of the sys-tem, we have employed the sensors (accelerometer, heartbeatoximeter, and microphone amplifier). Input data is collectedfrom the patient and analyzed on the computer, as well ason the mobile so that doctors can take actions according tothe given results.
5.1. Dataset. For experiments, we have used day/night-timesleep data. This dataset consists of sleep patterns of day/-night-time sleep patterns.This real-timedata is initially dividedinto two random subsets. 2/3 part is used for training, and 1/3was used for testing. This process is repeated 10 times so that10 different datasets are obtained for training the model.
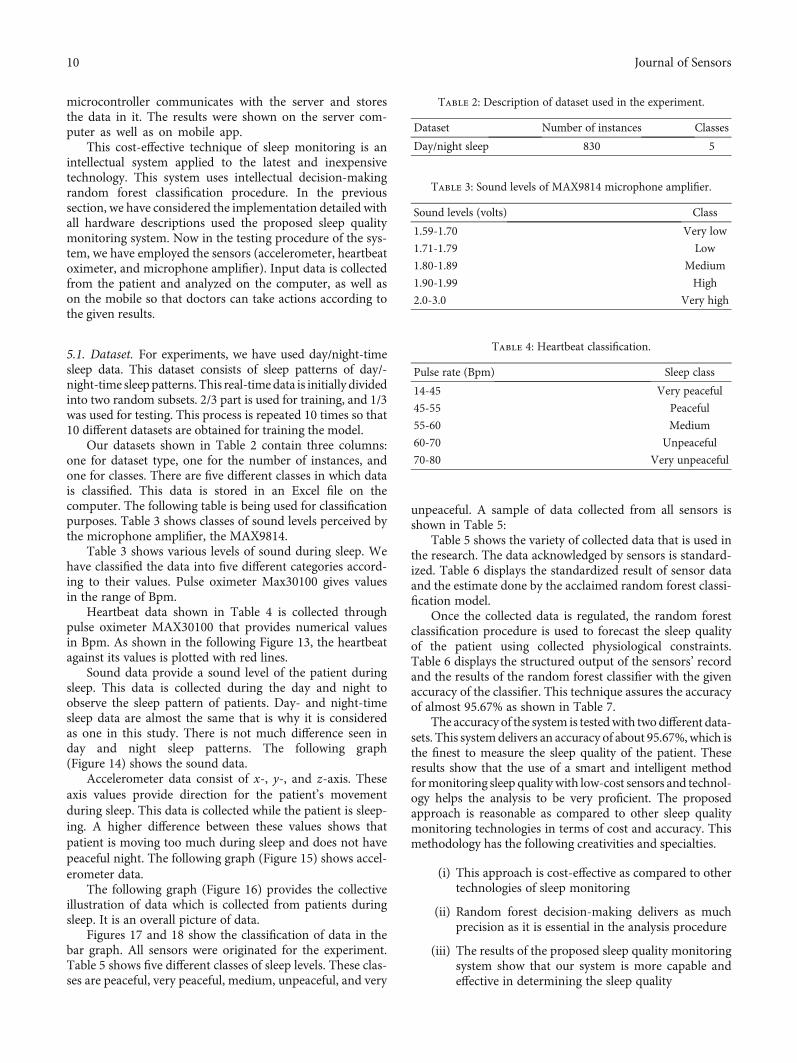
Our datasets shown in Table 2 contain three columns:one for dataset type, one for the number of instances, andone for classes. There are five different classes in which datais classified. This data is stored in an Excel file on thecomputer. The following table is being used for classificationpurposes. Table 3 shows classes of sound levels perceived bythe microphone amplifier, the MAX9814.
Table 3 shows various levels of sound during sleep. Wehave classified the data into five different categories accord-ing to their values. Pulse oximeter Max30100 gives valuesin the range of Bpm.
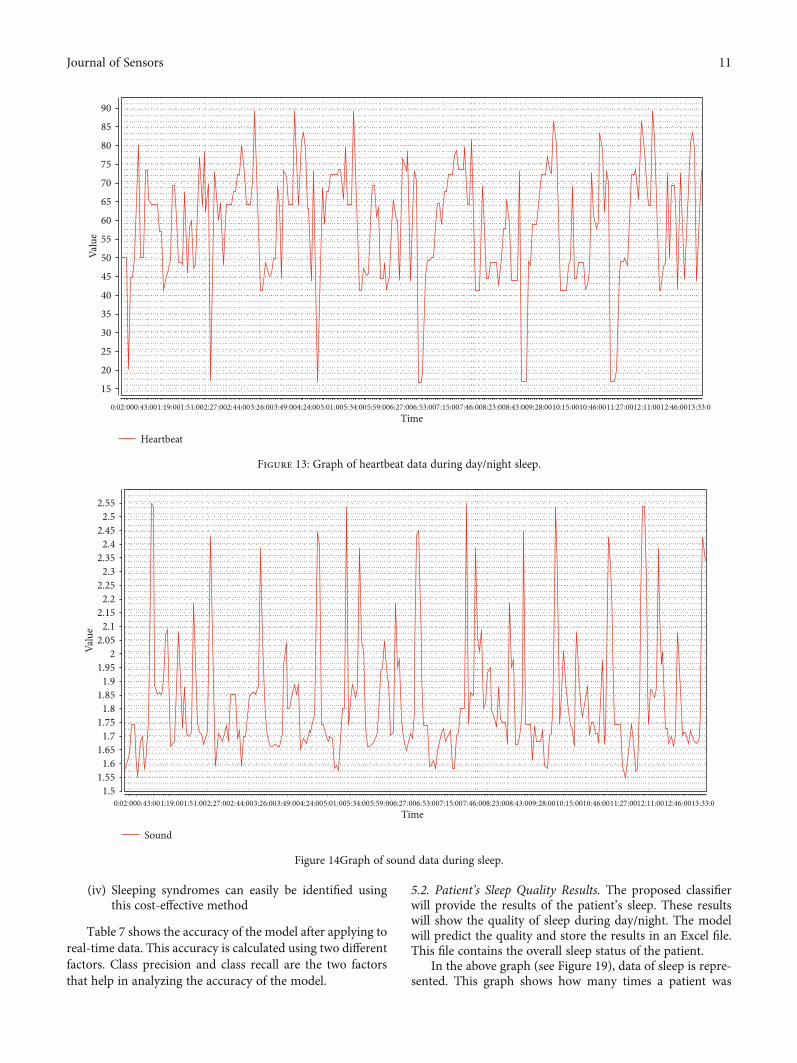
Heartbeat data shown in Table 4 is collected throughpulse oximeter MAX30100 that provides numerical valuesin Bpm. As shown in the following Figure 13, the heartbeatagainst its values is plotted with red lines.
Sound data provide a sound level of the patient duringsleep. This data is collected during the day and night toobserve the sleep pattern of patients. Day- and night-timesleep data are almost the same that is why it is consideredas one in this study. There is not much difference seen inday and night sleep patterns. The following graph(Figure 14) shows the sound data.
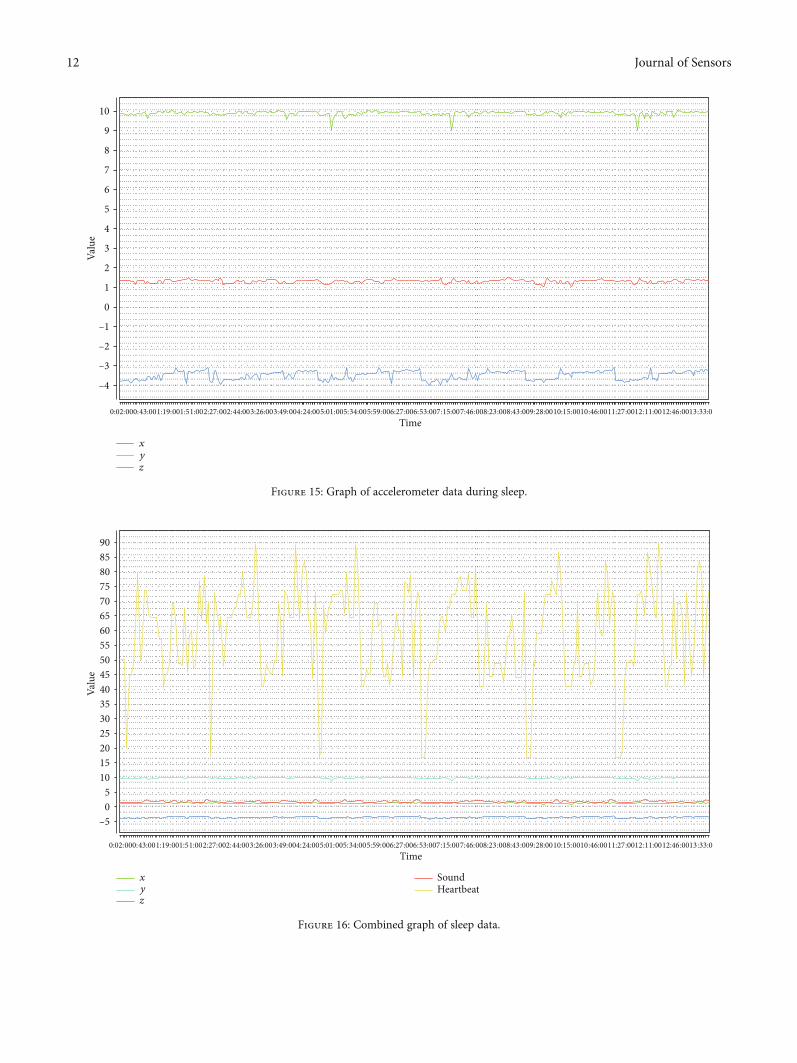
Accelerometer data consist of x-, y-, and z-axis. Theseaxis values provide direction for the patient’s movementduring sleep. This data is collected while the patient is sleep-ing. A higher difference between these values shows thatpatient is moving too much during sleep and does not havepeaceful night. The following graph (Figure 15) shows accel-erometer data.
The following graph (Figure 16) provides the collectiveillustration of data which is collected from patients duringsleep. It is an overall picture of data.
Figures 17 and 18 show the classification of data in thebar graph. All sensors were originated for the experiment.Table 5 shows five different classes of sleep levels. These clas-ses are peaceful, very peaceful, medium, unpeaceful, and very
unpeaceful. A sample of data collected from all sensors isshown in Table 5:
Table 5 shows the variety of collected data that is used inthe research. The data acknowledged by sensors is standard-ized. Table 6 displays the standardized result of sensor dataand the estimate done by the acclaimed random forest classi-fication model.
Once the collected data is regulated, the random forestclassification procedure is used to forecast the sleep qualityof the patient using collected physiological constraints.Table 6 displays the structured output of the sensors’ recordand the results of the random forest classifier with the givenaccuracy of the classifier. This technique assures the accuracyof almost 95.67% as shown in Table 7.
The accuracyof the system is testedwith twodifferent data-sets. This systemdelivers an accuracy of about 95.67%,which isthe finest to measure the sleep quality of the patient. Theseresults show that the use of a smart and intelligent methodformonitoring sleep qualitywith low-cost sensors and technol-ogy helps the analysis to be very proficient. The proposedapproach is reasonable as compared to other sleep qualitymonitoring technologies in terms of cost and accuracy. Thismethodology has the following creativities and specialties.
(i) This approach is cost-effective as compared to othertechnologies of sleep monitoring
(ii) Random forest decision-making delivers as muchprecision as it is essential in the analysis procedure
(iii) The results of the proposed sleep quality monitoringsystem show that our system is more capable andeffective in determining the sleep quality
Table 2: Description of dataset used in the experiment.
Dataset Number of instances Classes
Day/night sleep 830 5
Table 3: Sound levels of MAX9814 microphone amplifier.
Sound levels (volts) Class
1.59-1.70 Very low
1.71-1.79 Low
1.80-1.89 Medium
1.90-1.99 High
2.0-3.0 Very high
Table 4: Heartbeat classification.
Pulse rate (Bpm) Sleep class
14-45 Very peaceful
45-55 Peaceful
55-60 Medium
60-70 Unpeaceful
70-80 Very unpeaceful
10 Journal of Sensors
(iv) Sleeping syndromes can easily be identified usingthis cost-effective method
Table 7 shows the accuracy of the model after applying toreal-time data. This accuracy is calculated using two differentfactors. Class precision and class recall are the two factorsthat help in analyzing the accuracy of the model.
5.2. Patient’s Sleep Quality Results. The proposed classifierwill provide the results of the patient’s sleep. These resultswill show the quality of sleep during day/night. The modelwill predict the quality and store the results in an Excel file.This file contains the overall sleep status of the patient.
In the above graph (see Figure 19), data of sleep is repre-sented. This graph shows how many times a patient was
90
85
80
75
70
65
60
55
Valu
e
50
45
40
35
30
25
150:02:000:43:001:19:001:51:002:27:002:44:00 6:003:2 3:49:004:24:005:01:005:34:005:59:006:27:006:53:007 7:46:008:23:008:43:009:28:0010:15:0010:46:0011:27:0012:11:0012:46:0013:33:0:15:00
20
Time
Heartbeat
Figure 13: Graph of heartbeat data during day/night sleep.
2.552.5
2.452.4
2.352.3
2.252.2
2.152.1
2.052
1.951.9
1.851.8
1.751.7
1.651.6
1.551.5
Valu
e
0:02:000:43:001:19:001:51:002:27:002:44:003:26:003:49:004:24:005:01:005:34:005:59:006:27:006:53:007 7:46:008:23:008:43:009:28:0010:15:0010:46:0011:27:0012:11:0012:46:0013:33:0:15:00Time
Sound
Figure 14Graph of sound data during sleep.
11Journal of Sensors
0:02:000:43:001:19:001:51:002:27:002:44:003:26:003:49:004:24:005:01:005:34:005:59:006:27:006:53:007 7:46:008:23:008:43:009:28:0010:15:0010:46:0011:27:0012:11:0012:46:0013:33:0:15:00Time
10
9
8
7
6
5
4
3
2
1
0
–1
–2
–3
Valu
e
–4
x
y
z
Figure 15: Graph of accelerometer data during sleep.
0:02:000:43:001:19:001:51:002:27:002:44:003:26:003:49:004:24:005:01:005:34:005:59:006:27:006:53:007 7:46:008:23:008:43:009:28:0010:15:0010:46:0011:27:0012:11:0012:46:0013:33:0:15:00Time
9085807570656055
Valu
e
504540353025
–5
1510
50
20
SoundHeartbeat
x
y
z
Figure 16: Combined graph of sleep data.
12 Journal of Sensors

50.047.545.042.540.0
35.032.530.0
37.5
25.022.520.0
27.5
Freq
uenc
y
15.012.510.0
17.5
5.02.50.0
15 20 25 30 35 40 45 50 55Heartbeat
60 65 70 75 80 85 90
7.5
MediumUnpeacefulVery peaceful
PeacefulVery unpeaceful
Figure 17: Heartbeat data classification graph.
50.047.545.042.540.0
35.032.530.0
37.5
25.022.520.0
27.5
Freq
uenc
y
15.012.510.0
17.5
5.02.50.0
1.551.50 1.60 1.65 1.70 1.75 1.80 1.85 1.90 1.95 2.00 2.05 2.10 2.15 2.20 2.25 2.30 2.35 2.40 2.45 2.552.50Sound
7.5
MediumUnpeacefulVery peaceful
PeacefulVery unpeaceful
Figure 18: Sound data classification graph.
13Journal of Sensors

restless or peaceful. The following Figure 20 shows the resultof the sleep analysis.
5.3. Error Rate of Model. The real-time scenario model pre-dicted the values into five classes. The error rate of the predic-
tion is calculated by finding the difference between true labelsand predicted labels. As the true labels are manually derivedby analyzing the whole data, so the following graph(Figure 21) shows the number of true and false predictionsmade by the classifier.
Table 5: Sensors data concerning their classes.
Sr. no. Sound level (volts) Heart rate (Bpm)Accelerometer (x-, y-, z-axis)
Sleep quality levelx y z
1 1.79 17.02 1.33 9.77 -3.73 Medium
2 1.74 17.02 1.29 9.81 -3.77 Medium
3 1.64 50.01 1.33 9.84 -3.74 Peaceful
4 1.59 72.34 1.33 10 -3.73 Very unpeaceful
5 2.55 73.45 1.22 9.89 -3.77 Unpeaceful
Table 6: Standardized results of data and estimate done by random forest model.
Sr. no. Sound levels Heartbeat Accelerometer Random forest decision Accuracy
1 Very low Very peaceful Very peaceful Very peaceful 100%
2 Low Very unpeaceful Peaceful Peaceful 90%
3 Low Peaceful Peaceful Peaceful 100%
4 Very high Very unpeaceful Peaceful Peaceful 91%
5 Very low Medium Unpeaceful Medium 91%
Table 7: Accuracy of the proposed model.
True medium True unpeaceful True very peaceful True peaceful True very unpeaceful Class precision
Pred. medium 49 0 0 0 0 100.00%
Pred. unpeaceful 0 50 0 0 0 50.00%
Pred. very peaceful 0 0 2 2 0 93.42%
Pred. peaceful 4 5 1 142 0 100.00%
Pred. very unpeaceful 0 0 0 0 22
Class recall 92.45% 90.91% 66.67% 98.61% 100.00%
Accuracy: 95.67%.
0
50
100
150
200
250
300
350
400
450
Medium Peaceful Unpeaceful Very peaceful Very unpeaceful
Sleep quality
Figure 19: Predictions of sleep data collected in real-time.
14 Journal of Sensors

5.4. Mobile Application. A small android app is also devel-oped which shows the status of a patient’s sleep quality. Thisapp aids in effectively visualizing the sleep quality of thepatient. Calculated results accessed by the app and shownin a pie chart will make it easy to know the overall sleep statusof the patient. A screenshot of the app is shown in Figure 22.
In Figure 22, the patient’s sleep data is shown in a piegraph, as the graph depicts that patient’s sleep data is catego-rized into five different classes. Sleep quality for that patient ispeaceful as shown in the graph. The peaceful sleep has beenrepresented in blue colour in this graph.
6. Conclusion
In this paper, the proposed system sensed the patient’s sleeppatterns using different sensors, which are cheap and easy touse. These sensors include an accelerometer, a pulse oxime-ter, and a microphone amplifier. This data transmittedthrough Arduino to the server for analysis and results with
great effects and a small cost. These sensors were operatedthrough the microcontroller. The heartbeat is calculated byplacing the finger on it. These recorded values are stored ina computer system. Moreover, the results were shown onthe computer screen as well as on a mobile phone.
To determine the human body movement, ADXL345senses data and transmits to the receiving module which isa microcontroller. It transfers the data to the computer. Therecorded data in the computer will be presented to a specialistor surgeon for advanced analysis to deliver better treatment.
The human voice was recognized for snoring detection.MAX30100 sensor is used which measure the voice toidentify if a person has peaceful sleep or is feeling discomfortduring sleep.
The intelligent random forest classification method wasused for the classification and predictions of data. Resultsshow that this classifier gives accurate results, which are farmore reliable than other models. This intelligent and smartsleep quality monitoring system projects the sleep of patientsinto different classes with an accuracy of 95%. The researchedresult shows that the sleep monitoring system is accurate,user-responsive, consistent, inexpensive, and easy to use formonitoring patient’s sleep with cost-effective technology.
The limitation of the proposed system is that it workswith three sensors by assembling the four parameters, asmore parameters help in better sleep pattern recognition.
In this study, three sensors were used with the Arduinomicrocontroller. In the future, more sensors will be used forthis purpose, which will provide the results with greateraccuracy. The following issues could also be highlighted forresearch in the future:
18%
52%
19%
3%8%
Patient’s sleep
MediumPeacefulUnpeaceful
Very peacefulVery unpeaceful
Figure 20: Analysis of patient’s sleep.
61
753
0
100
200
300
400
500
600
700
800
False True
Error
Total
Figure 21: Rate of true and false predictions in sleep data.
Figure 22: Android app showing the quality of patient’s sleep.
15Journal of Sensors
(i) A portable patient’s sleep quality monitoring systemcan be proposed through wireless sensors andmicrocontrollers
(ii) Raspberry Pie can be used in the replacement ofArduino for the independent working of the system,in which results could be shown on a mobile app
Data Availability
The datasets used in the experiments and discussed in thepaper will be available if requited.
Conflicts of Interest
The authors declare no conflict of interest.
References
[1] K. O. Takuji Suzuki, K.-i. Kameyama, M. Takahashi, andM. Takahashi, “Development of a sleep monitoring systemwith wearable vital sensor for home use,” BioDevices, pp.326–331, 2009.
[2] A. G. Harvey, K. Stinson, K. L. Whitaker, D. Moskovitz, andH. Virk, “The subjective meaning of sleep quality: a compari-son of individuals with and without insomnia,” Sleep, vol. 31,no. 3, pp. 383–393, 2008.
[3] R. Haakma and R. Beun, “Unobtrusive sleep monitoring,”Measuring Behavior (Vol. 2012, p. 122), 2012.
[4] S. Ancoli-Israel, R. Cole, C. Alessi, M. Chambers,W. Moorcroft, and C. P. Pollak, “The role of actigraphy inthe study of sleep and circadian rhythms,” Sleep, vol. 26,no. 3, pp. 342–392, 2003.
[5] A. Sadeh, M. Sharkey, and M. A. Carskadon, “Activity-basedsleep-wake identification: an empirical test of methodologicalissues,” Sleep, vol. 17, no. 3, pp. 201–207, 1994.
[6] Y.-T. Peng, C.-Y. Lin, M.-T. Sun, and C. A. Landis, “Multi-modality sensor system for long-term sleep quality monitor-ing,” IEEE Transactions on Biomedical Circuits and Systems,vol. 1, no. 3, pp. 217–227, 2007.
[7] A. Kealy, K. McDaid, J. Loane, L. Walsh, and J. Doyle, “Deriva-tion of night time behaviour metrics using ambient sensors,”in 2013 7th International Conference on Pervasive ComputingTechnologies for Healthcare and Workshops, pp. 33–40, Ven-ice, Italy, 2013.
[8] P. S. Low, S. S. Shank, T. J. Sejnowski, and D. Margoliash,“Mammalian-like features of sleep structure in zebra finches,”Proceedings of the National Academy of Sciences, vol. 105,no. 26, pp. 9081–9086, 2008.
[9] J. R. Shambroom, S. E. Fábregas, and J. Johnstone, “Validationof an automated wireless system to monitor sleep in healthyadults,” Journal of sleep research, vol. 21, no. 2, pp. 221–230,2012.
[10] W. Karlen, C. Mattiussi, and D. Floreano, “Sleep and wakeclassification with ECG and respiratory effort signals,” IEEETransactions on Biomedical Circuits and Systems, vol. 3,no. 2, pp. 71–78, 2009.
[11] T. Watanabe and K. Watanabe, “Noncontact method for sleepstage estimation,” IEEE Transactions on Biomedical Engineer-ing, vol. 51, no. 10, pp. 1735–1748, 2004.
[12] B. H. Jansen and K. Shankar, “Sleep staging with movement-related signals,” International Journal of Bio-Medical Comput-ing, vol. 32, no. 3-4, pp. 289–297, 1993.
[13] A. Zaffaroni, P. De Chazal, C. Heneghan, P. Boyle, P. R.Mppm, and W. T. McNicholas, “SleepMinder: an innovativecontact-free device for the estimation of the apnoea-hypopnoea index,” in 2009 annual international conferenceof the IEEE engineering in medicine and biology society,pp. 7091–9094, Minneapolis, MN, USA, 2009, September.
[14] R. N. Bashir, I. S. Bajwa, and M. M. Ali Shahid, “Internet ofThings and Machine-Learning-Based leaching requirementsestimation for saline soils,” IEEE Internet of Things, vol. 7,no. 5, pp. 4464–4472, 2020.
[15] J. M. Kelly, R. E. Strecker, and M. T. Bianchi, “Recent develop-ments in home sleep-monitoring devices,” ISRN Neurology,vol. 2012, 10 pages, 2012.
[16] W. H. M. Saad, C. W. Khoo, S. I. Ab Rahman, M. M. Ibrahim,and N. H. M. Saad, “Development of sleep monitoring systemfor observing the effect of the room ambient toward the qualityof sleep,” MS&E, vol. 210, no. 1, article 012050, 2017.
[17] S. Coussens, M. Baumert, M. Kohler et al., “Movement distri-bution: a new measure of sleep fragmentation in children withupper airway obstruction,” Sleep, vol. 37, no. 12, pp. 2025–2034, 2014.
[18] M. H. Silber, S. Ancoli-Israel, M. H. Bonnet et al., “The visualscoring of sleep in adults,” Journal of Clinical Sleep Medicine,vol. 3, no. 2, pp. 22–22, 2007.
[19] H. Sattar, I. S. Bajwa, R. ul Amin et al., “Smart wound hydra-tion monitoring using biosensors and fuzzy inference system,”Wireless Communication and Mobile Computing, vol. 2019,article 8059629, pp. 1–15, 2019.
[20] F. Ebrahimi, M. Mikaeili, E. Estrada, and H. Nazeran, “Auto-matic sleep stage classification based on EEG signals by usingneural networks and wavelet packet coefficients,” ConferenceProceedings: Annual International Conference of the IEEEEngineering in Medicine and Biology Society, vol. 2008,pp. 1151–1154, 2008.
[21] E. K. Choe, S. Consolvo, N. F. Watson, and J. A. Kientz,“Opportunities for computing technologies to support healthysleep behaviors,” Paper presented at the Proceedings of the SIG-CHI Conference on Human Factors in Computing Systems,2011.
[22] H. Sattar, I. S. Bajwa, and U. Shafi, “An IoT-based intelligentwound monitoring system,” IEEE Access, vol. 2019, no. 7,pp. 144500–144515, 2019.
[23] B. Sarwar, I. S. Bajwa, N. Jamil, S. Ramzan, and N. Sarwar, “Anintelligent fire warning application using IoT and an Adaptiveneuro-fuzzy inference system,” Sensors, vol. 19, no. 14, article3150, 2019.
[24] L. de Souza, A. A. Benedito-Silva, M. L. N. Pires, D. Poyares,S. Tufik, and H. M. Calil, “Further validation of actigraphyfor sleep studies,” Sleep, vol. 26, no. 1, pp. 81–85, 2003.
[25] A. Sadeh, P. J. Hauri, D. F. Kripke, and P. Lavie, “The role ofactigraphy in the evaluation of sleep disorders,” Sleep, vol. 18,no. 4, pp. 288–302, 1995.
[26] M. Kay, E. K. Choe, J. Shepherd et al., “Lullaby: a capture &access system for understanding the sleep environment,” Pro-ceedings of the 2012 ACM conference on ubiquitous computing,pp. 226–234, 2012.
[27] T. Hao, G. Xing, and G. Zhou, “iSleep: unobtrusive sleep qual-ity monitoring using smartphones,” Proceedings of the 11th
16 Journal of Sensors
ACM Conference on Embedded Networked Sensor Systems, pp.1–14, 2013.
[28] W. Gu, Z. Yang, L. Shangguan, W. Sun, K. Jin, and Y. Liu,“Intelligent sleep stage mining service with smartphones,” Pro-ceedings of the 2014 ACM International Joint Conference onPervasive and Ubiquitous Computing, pp. 649–660, 2014.
[29] N. USA, “A Good Night's Sleep,” National Institute on Aging,2020, https://www.nia.nih.gov/health/good-nights-sleep.
[30] A. H. Sodhro, A. S. Malokani, G. H. Sodhro, M. Muzammal,and L. Zongwei, “An adaptive QoS computation for medicaldata processing in intelligent healthcare applications,” NeuralComputing and Applications, vol. 323, pp. 723–734, 2019.
[31] A. Alkhayyat, A. A. Thabit, F. A. Al-Mayali, and Q. H. Abbasi,“WBSN in IoT health-based application: toward delay andenergy consumption minimization,” Journal of Sensors,vol. 2019, 14 pages, 2019.
[32] A. A. Thabit, M. S. Mahmoud, A. Alkhayyat, and Q. H. Abbasi,“Energy harvesting Internet of Things health-based paradigm:towards outage probability reduction through inter–wirelessbody area network cooperation,” International Journal of Dis-tributed Sensor Networks, vol. 15, no. 10, Article ID1550147719879870, 2019.
[33] D. Abdulmohsin Hammood, H. A. Rahim, A. Alkhayyat, andR. B. Ahmad, “Body-to-body cooperation in internet of medi-cal things: toward energy efficiency improvement,” FutureInternet, vol. 11, no. 11, p. 239, 2019.
[34] M. Safdar Malik, I. S. Bajwa, and S. Munawar, “An intelligentand secure IoT based smart watering system using fuzzy logicand blockchain,” Computers and Electrical Engineering,vol. 77, no. 1, pp. 109–119, 2018.
[35] L. Breiman, “Bagging predictors,” Machine learning, vol. 45,no. 1, pp. 5–32, 2001.
[36] A. H. Sodhro, S. Pirbhulal, and V. H. C. de Albuquerque,“Artificial intelligence-driven mechanism for edgecomputing-based industrial applications,” IEEE Transactionson Industrial Informatics, vol. 15, no. 7, pp. 4235–4243, 2019.
[37] Y. Lin, X. Jin, J. Chen, A. H. Sodhro, and Z. Pan, “An analyticcomputation-driven algorithm for Decentralized MulticoreSystems,” Future Generation Computer Systems, vol. 96,pp. 101–110, 2019.
[38] A. S. More and D. P. Rana, “Review of random forest classifi-cation techniques to resolve data imbalance,” in 2017 1st Inter-national Conference on Intelligent Systems and InformationManagement (ICISIM), pp. 72–78, Aurangabad, India, 2017,October.
[39] B. Sarwar, I. S. Bajwa, S. Ramzan, B. Ramzan, and M. Kausar,“Design and application of fuzzy logic based fire monitoringand warning systems for smart buildings,” Symmetry, vol. 10,no. 11, p. 615, 2018.
[40] N. A. Diamantidis, D. Karlis, and E. A. Giakoumakis, “Unsu-pervised stratification of cross-validation for accuracy estima-tion,” Artificial Intelligence, vol. 116, no. 1-2, pp. 1–16, 2000.
17Journal of Sensors