Embed Size (px)
Citation preview

IoT Network Quality/Reliability
© 2016 InterDigital, Inc. All Rights Reserved.
IEEE PHMJune 19, 2017
Byung K. Yi, Dr. of Sci. Louis Kerofsky, PhD.Executive V.P. & CTO, Director of Partner DevelopmentInterDigital Communications, Inc InterDigital Communications, Inc.
Purpose:
• Provide information and directions for IoT Network Developer which would help him/her to put “Engineering Quality and Reliability” concepts at the early stage of IoT system development. It starts with fundamentals of “Reliability Theory”
• To the end, it provides design goals and guidelines for those, performance, safety, maintenance and cost factors which together form the working elements of reliability engineering, system engineering, quality engineering, and most importantly cost effectiveness.
• An effective quality/reliability engineering program begins with recognition that the “Quality/Reliability” is a function of the design parameters as well as “a life cycle cost.”
© 2016 InterDigital, Inc. All Rights Reserved.2
Reliability: “Quality in the time domain”
• Classical definition: The probability than a device will perform the intended functions satisfactorily for a specific period of time under the stated set of use condition
• In order for an item to be “reliable,” it must do more that meet an initial factory performance or quality specification, it must also operate satisfactorily for an acceptable period of time in the field for which it is intended.
• Reliability elements: probability, performance requirements, time and use conditions.
• Def: The Reliability of a component at time t, Say R(t), is defined as
R(t)=P[T>t], where T is life length of the component
R is reliability function
© 2016 InterDigital, Inc. All Rights Reserved.3
Reliability: “Quality in the time domain”
• Equally, the probability that that the component dose not fail during the interval [0,t]
• In terms of the pdf of T, say f, we have
• 𝑅 𝑡 = 𝑡
∞𝑓𝑇 𝑠 𝑑𝑠
• In terms of cdf of T• R(t) = 1 − 𝑃 𝑇 ≤ 𝑡 = 1 − 𝐹 𝑡
• Def: The failure Rate z(t) (sometimes called hazard fn):
• 𝑧 𝑡 =𝑓(𝑡)
1−𝐹(𝑡)=
𝑓(𝑡)
𝑅(𝑡), defined for F(t)<1
• Interpret z(t) is the conditional probability• 𝑃(𝑡 ≤ 𝑇 ≤ 𝑡 + ∆𝑡|𝑇 > 𝑡)
© 2016 InterDigital, Inc. All Rights Reserved.4
Reliability: “Quality in the time domain”• 𝑃(𝑡 ≤ 𝑇 ≤ 𝑡 + ∆𝑡|𝑇 > 𝑡): Probability that item will fail during the next ∆𝑡 time units
given the item is functioning at time t,
𝑃 𝑡 ≤ 𝑇 ≤ 𝑡 + ∆𝑡 𝑇 ≥ 𝑡 =𝑃(𝑡≤𝑇≤𝑡+∆𝑡)
𝑃(𝑇≥𝑡)=
𝑡𝑡+∆𝑡
𝑓 𝑠 𝑑𝑠
𝑅(𝑡)=
∆𝑡 𝑓(ξ)
𝑅(𝑡)≅ ∆𝑡𝑓(ξ)/R(t)
Where t≤ξ≤ 𝑡 + ∆𝑡
It represents the proportion of the items that will fail between t≤ξ≤ 𝑡 + ∆𝑡.
• © 2016 InterDigital, Inc. All Rights Reserved.5
Terminology:
• Probability: Quantitative term which expresses the likelihood of an event’s occurrence (or non occurrence) as a value between 0 and 1
• Performance: Criteria which is clearly describe or define what is considered to the satisfactory operation
• Time: The measure of period during which one can expect satisfactory performance
• Use condition: The environmental conditions which one expects an item to function.
© 2016 InterDigital, Inc. All Rights Reserved.6
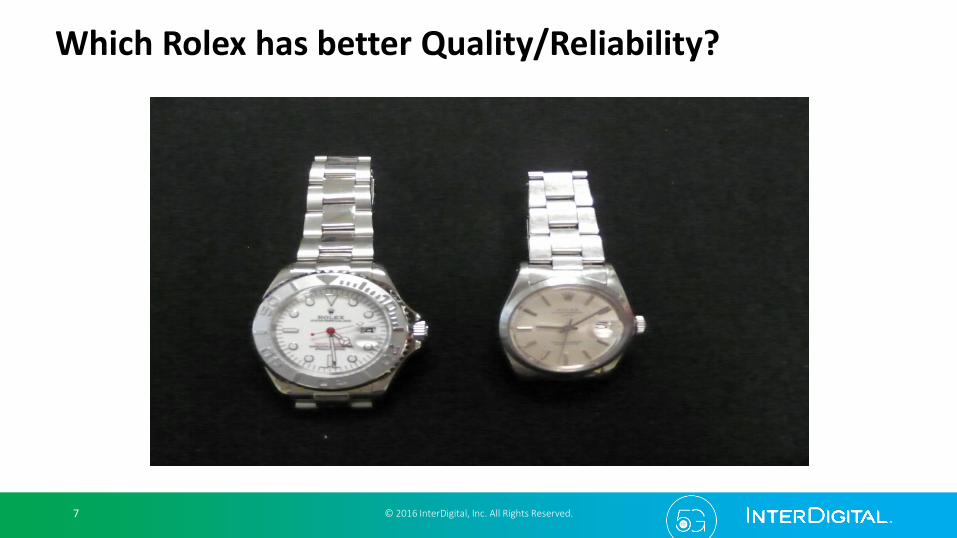
Which Rolex has better Quality/Reliability?
© 2016 InterDigital, Inc. All Rights Reserved.7

Life Characteristic Curve
© 2016 InterDigital, Inc. All Rights Reserved.8
Increasing Age(Hours/ Cycles)
Failure Rate(λ)
Tb Tw
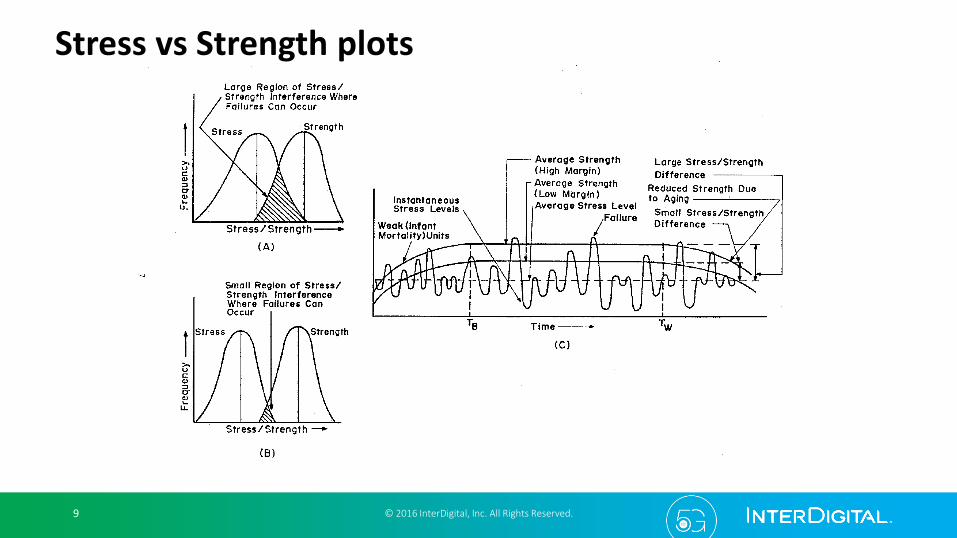
Stress vs Strength plots
© 2016 InterDigital, Inc. All Rights Reserved.9

The Weibull Distribution
© 2016 InterDigital, Inc. All Rights Reserved.10
onDistributi Normalely Approximat:6.3
onDistributi Lognormalely Approximat:5.2
onDistributiRayleigh :2
onDistributi lExponentia :1
,0
85.0,0
:
:
0exp)(1
parameterscalethe
parametershapethe
xxx
xf X
I. Infant Mortality period
• An initial development stage exhibits a high failure rate (“infant Mortality”, “burn-in” or debugging period: Product Conformance Test, ATP, Integration Testing )
• Tb Should be coincident with a product launch and the failure rate at time Tb should be a design element
• e.g.: “Manufacturability”
© 2016 InterDigital, Inc. All Rights Reserved.11
II. Useful Life Period
• The device population reaches its lowest failure rate level, which is marked by a constant failure rate(Exponential failure distribution)
• The period between Tb and Tw is the most significant period for Quality/ Reliability prediction and assessment activities
© 2016 InterDigital, Inc. All Rights Reserved.12
III. Wear-out Period
• The final life period occurs when the item population reaches the point where the failure rate starts to increase noticeably (Tw)
• Deterioration of the design strength of device as a consequence operation and exposure to environment stresses.
• ex.: flex cable, RF system including antenna, display, battery life, and cracking plastics
© 2016 InterDigital, Inc. All Rights Reserved.13
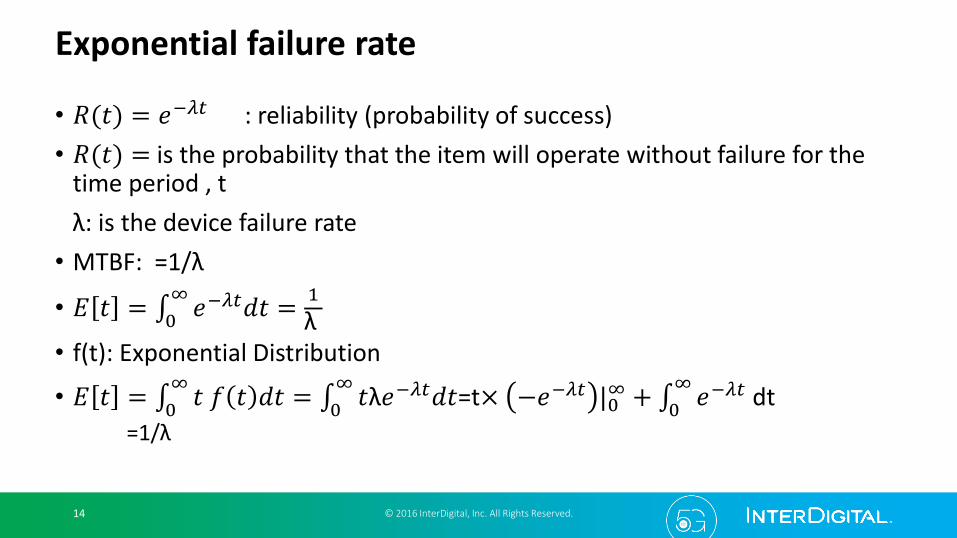
Exponential failure rate
• 𝑅(𝑡) = 𝑒−𝜆𝑡 : reliability (probability of success)
• 𝑅(𝑡) = is the probability that the item will operate without failure for the time period , t
λ: is the device failure rate
• MTBF: =1/λ
• 𝐸 𝑡 = 0
∞𝑒−𝜆𝑡𝑑𝑡 =
1
λ• f(t): Exponential Distribution
• 𝐸 𝑡 = 0
∞𝑡 𝑓 𝑡 𝑑𝑡 = 0
∞𝑡λ𝑒−𝜆𝑡𝑑𝑡=t× −𝑒−𝜆𝑡 |0
∞ + 0
∞𝑒−𝜆𝑡 dt
=1/λ
© 2016 InterDigital, Inc. All Rights Reserved.14
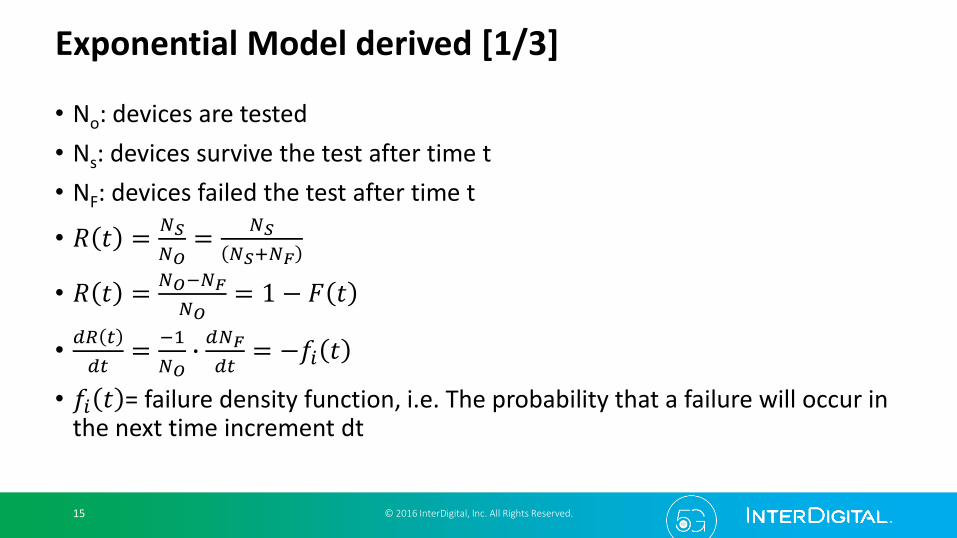
Exponential Model derived [1/3]
• No: devices are tested
• Ns: devices survive the test after time t
• NF: devices failed the test after time t
• 𝑅 𝑡 =𝑁𝑆
𝑁𝑂=
𝑁𝑆
𝑁𝑆+𝑁𝐹
• 𝑅 𝑡 =𝑁𝑂−𝑁𝐹
𝑁𝑂= 1 − 𝐹 𝑡
•𝑑𝑅 𝑡
𝑑𝑡=
−1
𝑁𝑂∙
𝑑𝑁𝐹
𝑑𝑡= −𝑓𝑖 𝑡
• 𝑓𝑖 𝑡 = failure density function, i.e. The probability that a failure will occur in the next time increment dt
© 2016 InterDigital, Inc. All Rights Reserved.15
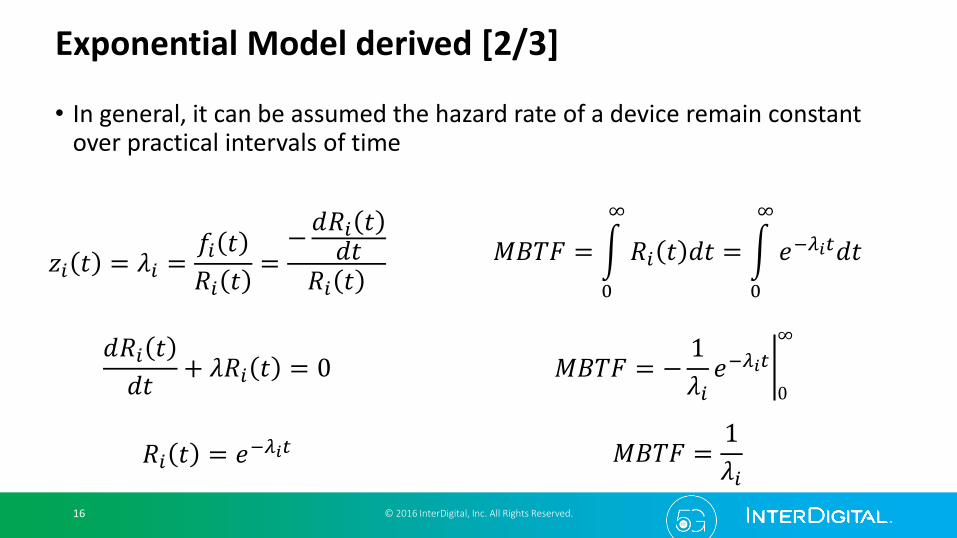
Exponential Model derived [2/3]
© 2016 InterDigital, Inc. All Rights Reserved.16
𝑧𝑖 𝑡 = 𝜆𝑖 =𝑓𝑖 𝑡
𝑅𝑖 𝑡=
−𝑑𝑅𝑖 𝑡
𝑑𝑡𝑅𝑖 𝑡
𝑑𝑅𝑖 𝑡
𝑑𝑡+ 𝜆𝑅𝑖 𝑡 = 0
𝑀𝐵𝑇𝐹 = න
0
∞
𝑅𝑖 𝑡 𝑑𝑡 = න
0
∞
𝑒−𝜆𝑖𝑡𝑑𝑡
𝑅𝑖 𝑡 = 𝑒−𝜆𝑖𝑡 𝑀𝐵𝑇𝐹 =1
𝜆𝑖
𝑀𝐵𝑇𝐹 = −1
𝜆𝑖𝑒−𝜆𝑖𝑡
∞
0
• In general, it can be assumed the hazard rate of a device remain constant over practical intervals of time

Exponential Model derived [3/3]
• The hazard rate z(t) is defined as the ratio of functional failure rate to the fractional surviving quantity, that is, number of the original population still operation at time t or simply the conditional probability of failure Ns: devices survive the test after time t
© 2016 InterDigital, Inc. All Rights Reserved.17
𝑧 𝑡 =𝑓(𝑡)
𝑅(𝑡)=
𝑓(𝑡)
1 − 𝐹(𝑡)
𝑧 𝑡 =𝑓(𝑡)
1 − 0
𝑡𝑓(𝑠) 𝑑𝑠
𝑓 𝑡 = 𝜆𝑒−𝜆𝑡
𝑧 𝑡 =𝜆𝑒−𝜆𝑡
1 + 𝑒−𝜆𝑠0𝑡
𝑧 𝑡 =𝜆𝑒−𝜆𝑡
1 − 0
𝑡𝜆𝑒−𝜆𝑠 𝑑𝑠
𝑧 𝑡 =𝜆𝑒−𝜆𝑡
1+𝑒−𝜆𝑡−1= 𝜆
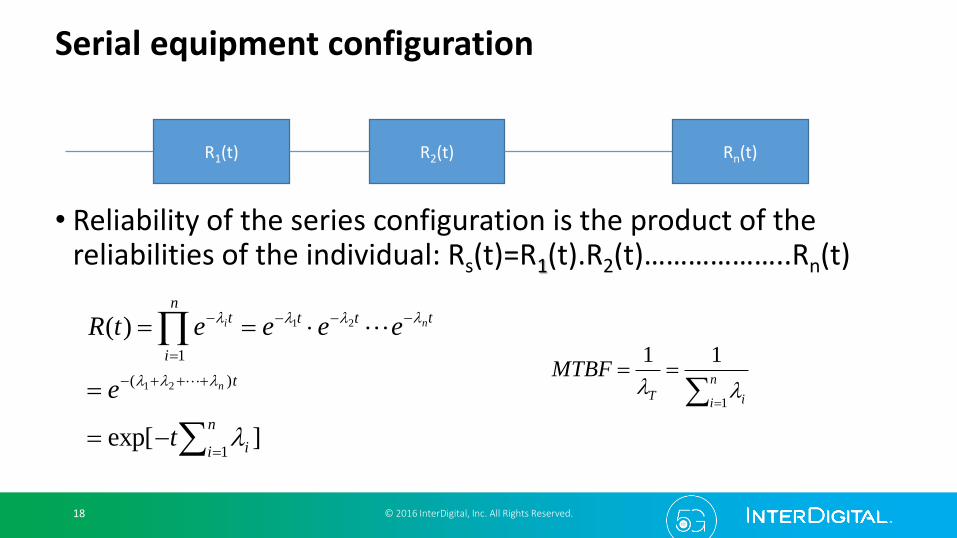
Serial equipment configuration
• Reliability of the series configuration is the product of the reliabilities of the individual: Rs(t)=R1(t).R2(t)………………..Rn(t)
© 2016 InterDigital, Inc. All Rights Reserved.18
R1(t) R2(t) Rn(t)
n
i iT
MTBF
1
11
]exp[
)(
1
)(
1
21
21
n
i i
t
tttn
i
t
t
e
eeeetR
n
ni
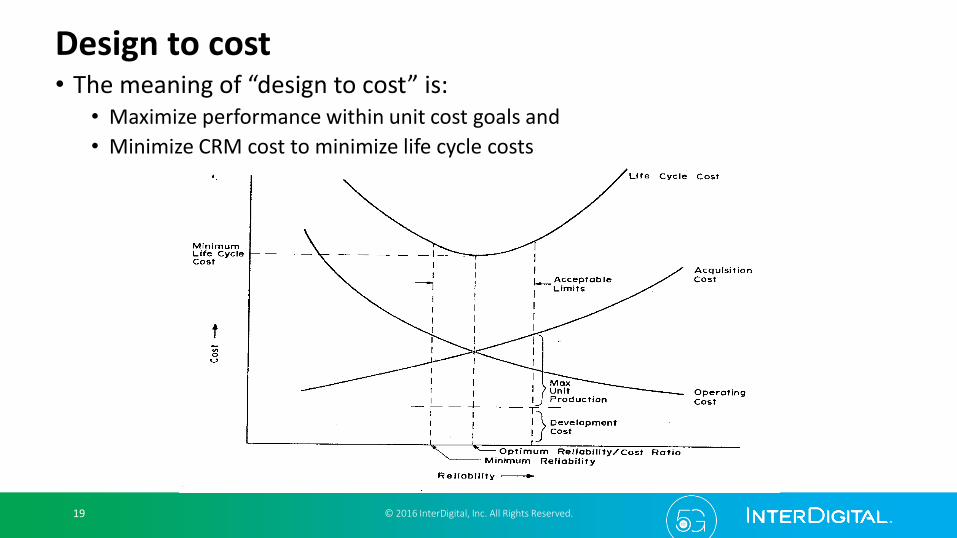
Design to cost
© 2016 InterDigital, Inc. All Rights Reserved.19
• The meaning of “design to cost” is:• Maximize performance within unit cost goals and
• Minimize CRM cost to minimize life cycle costs
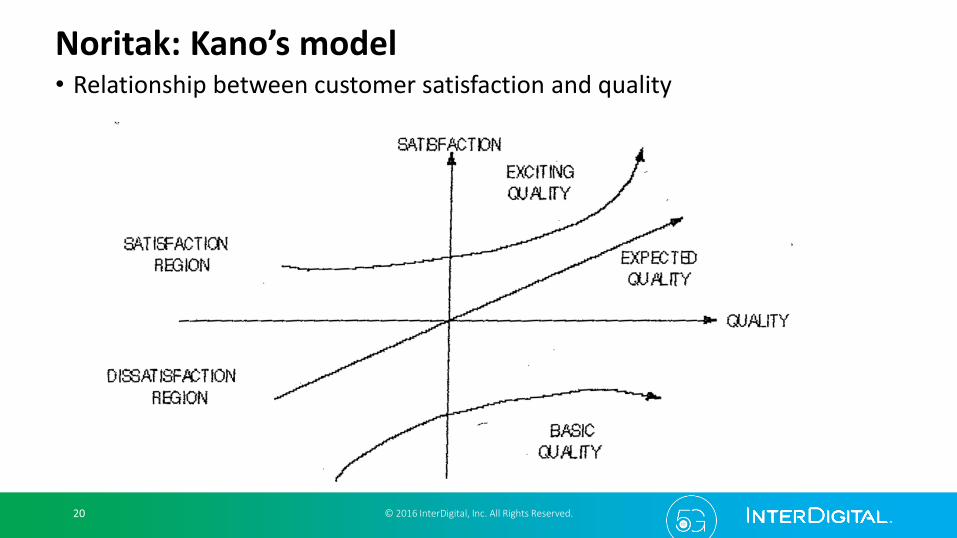
Noritak: Kano’s model
© 2016 InterDigital, Inc. All Rights Reserved.20
• Relationship between customer satisfaction and quality

Basic level of quality
© 2016 InterDigital, Inc. All Rights Reserved.21
• The quality that customers assume the product would have. They take for granted.
• e.g.: Voice Quality.; RF Performance, sms/mms expected level of quality:
• The expected quality that customers explicitly consider.
• e.g.: Battery life, image quality
• Exciting level of Quality
The exciting level of quality comes from “innovation” the customer receives more than they expected
• e.g.: Touch screen
“To be a leader in a industry, constant innovations are required”
Quality Function Development (QFD)s [1/2]
© 2016 InterDigital, Inc. All Rights Reserved.22
• Benchmarking involves research into the best practices at the process level.
• Benchmarking should never be the primary strategy for improvement
• Competitive analysis is an approach to goal setting or “industry standard.” Competitive analysis virtually guarantees second rate quality.• e.g. Apple i-phone, mechanical watch
• Long term quality goal setting is turned out to be not to set them at all or ad hoc approach • e.g. Crisis management
Quality Function Development (QFD)s [2/2]
© 2016 InterDigital, Inc. All Rights Reserved.23
• QFD is a customer driven process for product planning, development and deploy
• 4 phases of QFD
• Organization phase
• Descriptive phase
• Breakthrough phase
• Implementation Phase
Conclusions: How to design a Reliable IoT Physical System
© 2016 InterDigital, Inc. All Rights Reserved.24
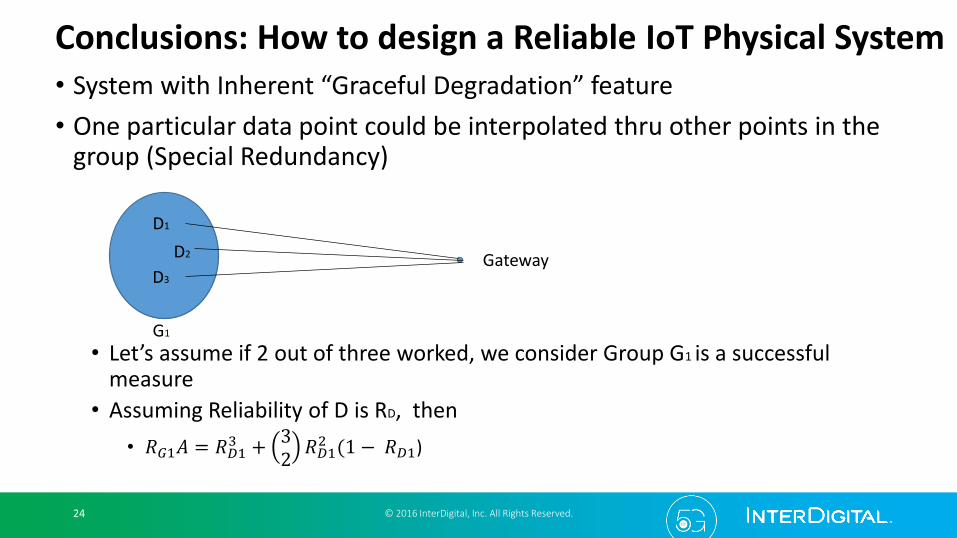
• System with Inherent “Graceful Degradation” feature
• One particular data point could be interpolated thru other points in the group (Special Redundancy)
• Let’s assume if 2 out of three worked, we consider Group G1 is a successful measure
• Assuming Reliability of D is RD, then
• 𝑅𝐺1𝐴 = 𝑅𝐷13 +
32
𝑅𝐷12 (1 − 𝑅𝐷1)
D1
D2
D3
G1
Gateway
Conclusions: How to design a Reliable IoT Physical System
© 2016 InterDigital, Inc. All Rights Reserved.25
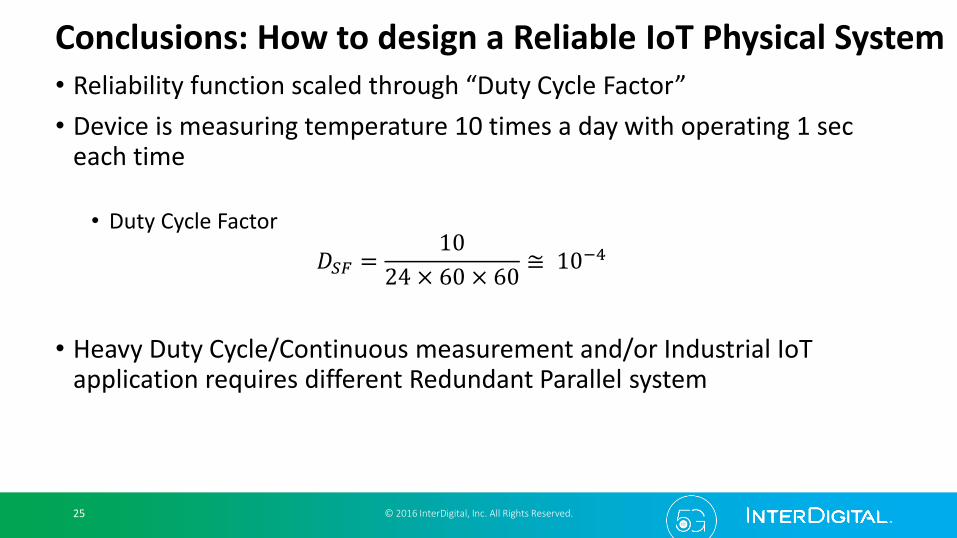
• Reliability function scaled through “Duty Cycle Factor”
• Device is measuring temperature 10 times a day with operating 1 sec each time
• Duty Cycle Factor
𝐷𝑆𝐹 =10
24 × 60 × 60≅ 10−4
• Heavy Duty Cycle/Continuous measurement and/or Industrial IoTapplication requires different Redundant Parallel system
Conclusions: How to design a Reliable IoT Physical System
© 2016 InterDigital, Inc. All Rights Reserved.26
• IoT reliability could be considered as two separate elements: Devices and Data
• Device is inherently unreliable, uncertain, error prone in IoT environment dynamics
• Challenges would be how to introduce the notion of the Guaranteed Quality of Information (GQoI) based on the services provided.
• Current design should be future proven for all dynamic changes of the environment in which the system operates
Thanks!
© 2016 InterDigital, Inc. All Rights Reserved.27
Appendix: One Equation good to have in your pocket
© 2016 InterDigital, Inc. All Rights Reserved.28
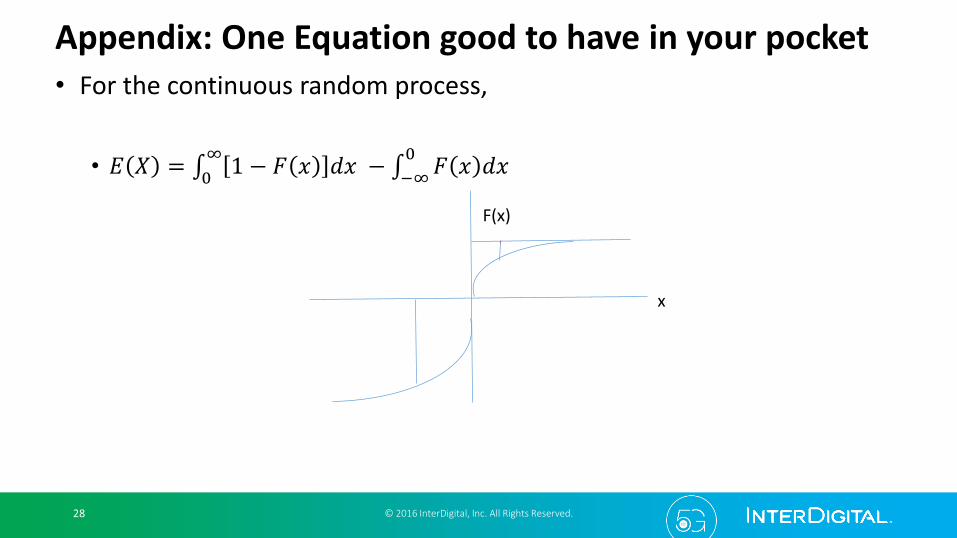
• For the continuous random process,
• 𝐸 𝑋 = 0
∞1 − 𝐹 𝑥 𝑑𝑥 − ∞−
0𝐹 𝑥 𝑑𝑥
x
F(x)