Embed Size (px)
Citation preview

1
Iowa Comparative Risk Assessment
Relation to
Iowa’s Energy Choices
Prepared by:
Dr. William Stigliani
Center for Energy and
Environmental Education
University of Northern Iowa
January, 1999

2
EXECUTIVE SUMMARY
This report provides an overview of the role energy choices has in influencing Iowa’s
Comparative Risk Assessment Project by highlighting the interconnectedness of Iowa’s
environment, economy and energy choices. By choosing to take the road of energy efficiency
and development of homegrown, renewable resources, the state could move toward greater
economic prosperity and stability, as well as a healthier environment. The vision is one in which
Iowans use their natural resources efficiently and wisely.
Currently, Iowa imports 98 percent of the energy we use, in the form of coal, oil, natural gas and
nuclear energy. Although the state possesses vast potential for renewable energy, only about 2
percent of our energy now comes from those sources. Iowa’s energy bill amounts to $5.2 billion
per year, and two-thirds of that amount leaves the state.
Energy efficiency and increased use of renewable energy can have important economic and
environmental benefits for Iowa. Using energy more efficiently reduces the economic drain on
the state and increases competitiveness. Less energy consumption also means less environmental
impact. The development of homegrown, renewable resources could create industries, jobs and
income for Iowa, while enhancing the environment.
This potential is coupled with the expected changes in the energy industry. These changes could
have broad and significant impacts on Iowa’s energy policies and goals. Like the telephone
industry, energy utilities have been moving toward a more competitive structure. Changes have
already been made in the natural gas industry allowing large customers, such as industries, to
purchase natural gas directly from the producers and creating a competitive environment.
Discussion of similar changes are occurring for the electric industry. Part of this discussion
involves the future of energy efficiency and alternative energy programs in what is expected to be
a more competitive utility arena. Iowa’s policy-makers must cautiously and prudently steer the
state through these complex and important issues.
The imminent restructuring of the utility industry does little to change the fact that energy is
absolutely essential to Iowa’s economy. Stable energy prices and supplies are a positive part of
the foundation for stimulating economic growth, developing new industries and generating jobs
and export opportunities. However, Iowa’s pattern of energy use can also negatively affect
economic prosperity.
In particular, dollars wasted on inefficient energy use represent a lost economic opportunity.
Based on the model of the economy developed by the Regional Economic Modeling Institute,
dollars spent on coal and petroleum usage leave the state more quickly than those dollars
invested in efficiency measures. Iowa can benefit more by capitalizing on energy efficiency and
developing indigenous resources than by continuing to pay for imported energy.

3
Similarly, the ways we produce and use energy can contribute to either damaging or enhancing
the environment. Fossil fuels produce emissions such as sulfur dioxide which causes acid rain,
nitrous oxides which produce smog, and carbon dioxide the most prominent greenhouse gas.
Cleaner, renewable fuels mitigate emissions and can have other environmental benefits as well.
For example, energy crops such as switchgrass or hybrid poplars also provide wildlife habitat,
erosion control and water filtration.
Emissions levels are an indicator of the extent to which environmental impacts from energy use
are gauged. The trend in carbon dioxide emissions over the past 20 years has been upward as the
reliance on fossil fuels has increased.
With their economic and environmental benefits, the twin approaches of efficiency and
renewable resource usage can contribute to a more stable, diverse and reliable energy mix in
Iowa. Developing policy options and discussing actions Iowa can take to utilize energy more
wisely is the premise on which this report is developed. The following chapters explore some of
the challenges facing and options available to policy-makers to steer Iowa toward a sustainable
energy future.

4
I. Energy in Agriculture
Summary of impacts of energy in agriculture on Iowa’s energy balance, the economy, and
environment. This first section presents a discussion of five components of agricultural production
related to energy. Specifically these include: fertilizer-N; animal manure; corn ethanol; poplar
plantation; and switchgrass. A detailed discussion is given below in parts I.A through I.C. Table
I.1 summarizes the overall results of the analysis.
Each of the five issues related to these components (see column two of the table) would have a
positive effect on the state's energy balance. Over the last 15 years, reductions in fertilizer-N use
have paid the biggest dividends with respect to energy savings (equivalent to 150 million gallons of
gasoline per year). The principal reason for this is the large energy input required for synthesizing
the fertilizer. This reduction measure has also provided the highest economic benefit; a $26 million
investment resulted in farmers saving approximately $360 million. With respect to environmental
impacts, fertilizer-N reductions lowered nitrogen pollution of water, an important step in improving
Iowa’s aquatic environment, and reduced emissions of greenhouse gases, whose impacts are related
to the global environment. Production and use of fertilizer-N are costly with respect to greenhouse
gas emissions because fossil fuels used in its production release the greenhouse gas CO2, and when
excess fertilizer-N undergoes microbial decomposition, the greenhouse gas N2O is emitted. An
important issue for the future is whether further reductions in Iowa's fertilizer-N use can be
achieved. If corn production increases in the coming years, a quite plausible scenario, gains in
reduced application rates per acre may be offset by increases in the number of acres planted.
Hog manure can be recycled either as a fertilizer or as methane gas. Both of these options would
result in a positive energy balance and a benefit for the environment. The main obstacle for either
measure is the relatively high costs required to enact them. If the economic deficit can be solved, a
major nuisance waste can be transformed into a valuable resource.
Corn ethanol production provides a source of renewable energy, which would be even larger if the
energy inputs to produce it can be reduced. It is also expensive and causes all of the environmental
problems resulting from growing corn. On the positive side, gasoline mixed with ethanol burns
cleaner, and thus improves air quality, particularly in large urban centers.
Biomass produced from poplar and switchgrass could provide another source of renewable energy
in Iowa. Their energy production potential is probably higher than that of ethanol, and their impact
on the environment more positive. Because they can be planted on marginal, erodible soils, they
can protect the soils and buffer against nitrate pollution. Both sources can be grown on former CRP
lands, and both could provide more in-state jobs than any of the other alternatives. Switchgrass
seems to be especially appealing because it can be planted and harvested with conventional farming
equipment. Thus, growing switchgrass would provide an alternative means of revenue for farmers
in areas such as southern Iowa, where agricultural productivity is lower than in other regions of the
state. Obstacles to implementing these sources are economical. Start-up funds will be needed to
5
develop an infrastructure for farming, production, and distribution of the biomass fuel. Currently,
costs of production are about the same as their market value.
Table I.1
Energy in Agriculture
Impacts on Energy, Economy, and the Environment
Source Issue Energy Impact Economic Impact Environmental Impact
Fertilizer-N Reduction in
use.
Reductions in use over period
1985-1995 saved equivalent of
1.5 billion gallons of gasoline
(150 million gallons/yr).
Fertilizer management
education program cost $26
million; farmers saved $360
million.
Reduced water pollution & nitrate in
drinking water; reduced greenhouse
gas emissions = 23.5 million tons CO2
(2.4 million tons/ yr).
Animal
manure
Conversion
to methane.
Energy resource equivalent to
12.7 million gallons of
gasoline/yr.
Methane is more expensive
to produce than
conventional natural gas;
residues can also be sold as
fertilizer.
Reduces water pollution and stench;
reduces greenhouse gas emissions =
2.0 million tons CO2/yr.
Corn ethanol Costs &
benefits.
Provides renewable source of
energy equivalent to 51 million
gallons of gasoline/yr; reduces
dependence on foreign oil.
Costs of production are
high, about $2.55 per
gallon, compared to $0.70
for conventional gasoline.
Corn production causes water pollution
& erosion, pesticides & nitrate in
drinking water; ethanol reduces toxicity
and smog from gasoline combustion;
reduces greenhouse gas emissions =
0.45 million tons CO2/yr.
Poplar
plantation
Viable energy
source for
future?
Could provide renewable source
of energy equivalent to 84
million gallons of gasoline/yr.
Production cost is about
equal to market price;
source of income for
marginal, highly erodible,
former CPR farm land; high
potential for in-state
employment.
Decreased erosion and nitrate
pollution; less air pollution in co-fired
coal power plants; reductions in CO2
emissions = 0.74 million tons.
Switchgrass Viable energy
source for
future?
Could provide renewable source
of energy equivalent to 84
million gallons of gasoline/yr.
Production cost is about
equal to market price;
source of income for
marginal, highly erodible,
former CPR farm lands;
high potential for in-state
employment.
Decreased erosion and nitrate
pollution; less air pollution in co-fired
coal power plants; reductions in CO2
emissions = 0.74 million tons.
I.A. Nitrogen fertilizer (fertilizer-N)
1. Energy embodied in fertilizer-N. Farming requires a variety of agrochemical inputs including
fertilizers, pesticides, and lime. Production of each of these chemicals requires energy for synthesis
and refinement. In considering energy inputs for agricultural production, it is necessary to consider
the energy embodied in these chemicals along with energy for operating farm equipment, human
labor, and other energy costs. Table I.2 shows the energy inputs for producing 125 bushels of corn
on an acre of farmland in units of gallons of gasoline equivalents (gge). One may observe that the
input energy of fertilizer-N is the highest by far, contributing more than 40% of the total. Adding a
ton of nitrogen to the soil, typically enough for about 15 acres, costs about 720 gge. In 1995,

6
farmers added 833,477 tons of nitrogen from fertilizer-N to Iowa farmland (Ney et al., 1996). The
energy needed to produce the fertilizer was about 600 million gge, corresponding to about 27% of
the total gallons of gasoline Iowans consumed for transportation in 1995 (IDNR, 1996a). The table
also shows that the energy embodied in the corn crop (379.2 gge) is 3.15 times greater than the total
energy inputs. The crop energy, however, refers to the theoretical energy available from the entire
plant, including the stalk, husks, corncob, etc. The energy extractable as ethanol from the kernel
portion constitutes only about 40% of the total harvested energy. Ethanol fuel will be discussed in
more detail in a later part of this section.
Table I.2
Input/Output Energy per Acre in Corn Production
(yield = 125 bushels/acre)
Type of Input Energy Input
(gallons of gasoline equivalents)
Input Energy (%)
Labor 0.1 0.1
Machinery 22.7 18.9
Fuel 19.2 16.0
Fertilizer-N 48.9 40.7
Fertilizer-P 7.2 6.0
Fertilizer-K 2.7 3.1
Lime 2.1 1.7
Corn seed 8.0 6.6
Insecticide 2.3 1.9
Herbicide 3.1 2.5
Electricity 1.5 1.3
Transport 1.4 1.1
Total Energy Inputs 120.2 100.0
Energy in Corn (Output) 379.2
Output/Input ratio 3.15
Source: Pimentel, 1992.
2. Environmental impacts of fertilizer-N. Fertilizer-N is a major source of aqueous pollution in
Iowa and the United States in general. Runoff from agricultural lands (so-called nonpoint source
pollution) is estimated to cause 64% of all river pollution with sedimentation as the largest impact,
and 57% of all lake pollution, where nutrient-enrichment is the largest impact (National Research
Council, 1993). Nitrogen is transported to the aquatic environment via leaching through the soil to
groundwater, or via runoff and erosion to surface waters. Data from Big Spring Basin in Iowa
traces the relationship between residual nitrogen and groundwater nitrate concentrations over time
(Figure I.1). Nitrogen serves to "fertilize" aqueous environments, whose biomass production would
otherwise be limited due to relatively low concentrations of natural sources of nitrogen. It is well
documented that nitrogen has caused algal blooms, fish death, and other manifestations of aqueous
eutrophication (see Technical Committee on Ecological Systems, 1997).
7
Figure I.1: Trends in amount of fertilizer-N and manure-N applied in relation to annual average nitrate
concentration in groundwater in Big Spring Basin, Iowa. Source: Hallberg (1989).
With respect to human health, nitrate levels in drinking water above the federal EPA standard of 10
parts per million (ppm) can cause methemoglobinemia, a potentially fatal condition in infants (the
so-called "blue baby" syndrome). Several days' worth of infant formula mixed with water
contaminated with nitrate at levels over 10 ppm can cause this illness in infants under four months
old. As shown in Table I.3, the populations of Iowans exposed to drinking water with nitrates
above the 10 ppm limit are sizable (6.3% of entire population) and a reason for concern, particularly
for the infant population.
Another, more subtle, impact of the use of fertilizer-N concerns the greenhouse gas nitrous oxide
(N2O). Climatologists believe that N2O, along with carbon dioxide (CO2), methane (CH4), and the
chlorofluorocarbons (CFCs), may have a substantial impact on global climate within the next 100
years (IPCC, 1990). Figure I.2 shows the relative contributions these four molecules made to the
greenhouse effect during the 1980s.

8
Table I.3
Iowa's Population Exposed to Excessive Levels of Nitrate-Nitrogen
in Public and Well-Water Drinking Supplies
Source of Supply Pubic Supplies in Violationa
(nitrate above 10 ppm)
Wells Contaminated (%)
(nitrate above 10 ppm)
Population
Affected
Public supplier 137 - 52,970
Well water - 18.3% 124,771
a Refers to systems that violated federal nitrate standards at least once since 1985.
Source: Environmental Working Group (1996).
Figure I.2: The contribution from each of the human-made greenhouse gases to the global atmospheric heat
balance in the 1980s. Source: IPCC (1990).
Excess nitrogen not taken up by crops eventually undergoes a natural process called denitrification,
by which bacteria break down the nitrogen-containing substrate in the fertilizer, and release the
nitrogen as N2, the same benign gas that comprises 80% of earth's atmosphere. A small portion,
however, typically around 5%, is released to the atmosphere as N2O. Although N2O currently
contributes under 10% to the greenhouse effect, its atmospheric concentration is rising at a rate of
0.25% per year, and, as shown in Figure I.3, its steep rise since about 1950 appears to track the
global consumption of fertilizer-N.
It is estimated that in 1995, over 15,000 tons of N2O were emitted to the atmosphere from Iowa
farmlands (Ney et al., 1996). Iowa's contribution to the global rise in atmospheric N2O, currently
about 1%, is relatively small, but not insignificant. Although CO2 is the major greenhouse gas
because of its relatively high atmospheric concentration, currently more than 1,000 times greater
than the concentration of N2O, on a per molecule basis N2O is a much more potent enhancer of the
9
greenhouse effect. Each N2O molecule has the same potency as 270 CO2 molecules. Therefore,
Iowa's annual emission of about 15,000 tons of N2O corresponds to an equivalent amount of 4.1
million tons of CO2. This is the amount of CO2 that would be emitted by combustion of 460
million gallons of gasoline.
Figure I.3: Global increase in atmospheric N2O concentrations (left) compared to global consumption of
fertilizer-N (right). Sources: IPCC (1990); Spiro and Stigliani (1996).
3. Trends in the use of fertilizer-N in Iowa. As shown in Table I.4, rates of fertilizer-N inputs for
corn in Iowa declined by 15-20% over the period from 1985 to 1995. This trend is the result of a
concerted effort, began in 1982, between farmers and state agencies for improving fertilizer
management. The primary factors behind these actions have been concern about nitrogen's impact
on aquatic systems and soil erosion. Importantly, the table also shows that over this time there was
no noticeable reduction in crop yield owing to reduced fertilizer application. Rather, climatic
conditions appear to have had the biggest influence. The years 1988 and 1993 were years of
drought and floods, respectively; 1992 and 1994 were years of ideal weather during the growing
season.
Trends for the future use of fertilizer-N cannot be assessed with certainty. Ney et al. (1996) assume
that further reductions in inputs will be negligible, at least until the year 2000, because of changes
in the Federal Farm Bill and current scarcity of corn inventories. In 1995 there were approximately
2 million acres in the Conservation Reserve Program, and a significant fraction of that land may
come back into production. This increased acreage of farm land is likely to offset further reductions
in application rates of fertilizer-N. Moreover, world demand for grains and soy bean is increasing
and may continue to do so into the foreseeable future. One reason for this is China's increasing

10
grain needs as the Chinese diet becomes more meat-oriented (Brown, 1995). Given the above
discussion, it seems likely that consumption of fertilizer-N will not decline appreciably within the
next decade, and could in fact increase substantially without further management and public
education programs.
Table I.4
Fertilizer-N Inputs Compared to Corn Crop Yields
Year Pounds Nitrogen per Acre Bushels per Acre
1985 145 126
1986 131 135
1987 132 130
1988 139 84
1989 128 118
1990 127 126
1991 120 117
1992 118 147
1993 114 80
1994 121 152
1995 120 123
Source: Ney et al. (1996)
4. Impacts of reduction of fertilizer-N use in Iowa. The record of reduced inputs of fertilizer-N
accomplished over the period from 1985 to 1995 provides tangible documentation of how energy,
economy, and environment can work in unison when wise choices are made that consider all three
aspects. Over the documented period, Iowa farmers consumed approximately 2.1 million tons less
fertilizer-N than they would have without the reduction management plan in place (Ney et al.,
1996). Four major benefits have accrued from these measures: (1) the management plan cost $26
million, but farmers saved over $360 million in fertilizer-N costs, with no apparent change in crop
yield; (2) the fertilizer-N input energy was reduced by about 1.5 billion gge, an amount equal to
nearly 75% of Iowa's transportation-energy consumption in one year; (3) nitrogen pollution in
Iowa's aquatic environments, while still severe, would have been worse without the reduced
nitrogen inputs; (4) emissions of the greenhouse gas N2O were reduced by nearly 40 thousand tons,
corresponding to an equivalent savings in CO2 emissions of 10.8 million tons, and another 13.3
million tons of CO2 were avoided in the production of the fertilizer-N, leading to an overall
11
greenhouse gas reduction of 23.5 million tons, an amount that would be released by burning 2.6
billion gallons of gasoline.
I.B. Animal manure
1. Energy embodied in animal manure. Animal manure is a potentially rich source of energy,
particularly in a farm state such as Iowa where billions of pounds are generated annually. Manure
can be dried and then burned as a fuel, or alternatively, it can undergo anaerobic fermentation to
produce the biogas methane. The latter process appears to be the more practical option for Iowa.
Methane is a high-quality energy source. A pound of it has more embodied energy than a pound of
coal or gasoline, and it has nearly twice as much energy as a pound of ethanol.
Production of manure in Iowa in 1990 is shown in Table I.5. An annual load of a total of about
9,000 kilotons (18 billion pounds), cattle and pigs are the dominant sources, generating nearly two-
thirds and one-third of the total, respectively. The situation is quite different with regard to
methane generation, where hog manure contributes about 87% of the total, and cattle a scant 11%.
The reason for this difference is the way the manure is managed. Eighty-seven percent of cattle
manure is deposited on pasture land, where, in direct contact with the atmosphere, the main
bacterial decomposition product is carbon dioxide (CO2) rather than methane (CH4), which is
formed under anaerobic conditions.
Table I.5
Generation of Manure and Methane Gas in Iowa (1990)
Type of Animal Manure Generated
kilotons (% total)
Methane Emissions
tons (% total)
Cattle 5,975 (65.3) 13,457 (11.4)
Hogs 2,905 (31.8) 102,319 (86.8)
Poultry 133 (1.4) 1,773 (1.5)
Sheep 127 (1.4) 208 (0.2)
Others 9 (0.1) 180 (0.2)
Total 9,149 (100) 117,937 (100)
Source: Ney et al. (1996)
Hog manure in Iowa is generated by both small and large producers (greater than 5,000 animals),
and is disposed of in various ways. Table 1.6 shows the method of disposal, and the associated
methane generated. Anaerobic lagoons are particularly effective methane emitters. Even though
only 3% of the manure is stored there, they release 22% of the total methane. Pit storage greater
12
than 1 month releases 65% of the methane from 41% of the manure. On the other hand, drylot
storage appears to emit the least amount of methane per ton of manure stored (31% stored, versus
2.7% methane emitted).
Table I.6
Methods of Disposal of Hog Manure and Amounts of Methane Generation
Anaerobic
Lagoon
Drylot Pit Storage
(< 1 month)
Pit Storage
(> 1 month)
Other
Destination (%) 3 31 11 41 14
Methane Emission (tons) 22,354 2,732 9,426 66,838 969
Source: Ney et al. (1996)
Total energy embodied in the methane can be calculated based on a conversion factor of 1 ton of
methane = 389.3 gge. Thus, the emission of 102,319 tons of methane from hog manure = 39.8
million gge. This methane can be captured as an energy source, but in practice the actual energy
that can be extracted is much lower. Ney et al. (1996) report that methane capture is only feasible
for large hog producers, and that the maximum harvest is about 32,460 tons from 922,000 tons of
manure (32%). Even so, this capture would yield energy equivalent to 12.7 million gallons of
gasoline. This measure could follow the example of large landfills in Iowa, where regulations
already require methane capture. A new operation near Des Moines, the Metro Methane Gas
Recovery Facility, in partnership with the Waste Management Authority of Iowa and MidAmerican
Energy Company extracts landfill gas as an energy source to produce up to 4,777 kilowatt of
electricity each hour--enough to supply power to nearly 5,000 homes. Total emissions of methane
from Iowa's landfills, estimated at 173,000 tons, are roughly comparable to emissions from manure.
2. Environmental impacts of animal manure. Animal manure, if managed correctly, is an excellent
fertilizer. It adds organic matter to the soil, improves its structure and tilth, and increases its ability
to hold water and nutrients as well as resist compaction and crusting (National Research Council,
1993). Moreover, it contains relatively high concentrations of the three major crop nutrients:
nitrogen (about 4% of dry weight of manure); phosphorus (about 1%); and potassium (about 2%).
Compared to synthetically-made "NPK" fertilizer, application of manure is much closer to the
natural cycle whereby nutrients and organic matter are returned to the soil in proper proportions that
enhance its quality and integrity.
The barrier to increased use of manure is economic; synthetic fertilizers, and in particular fertilizer-
N, are cheaper than the judicious use of manure, which would have to be diluted and spread over
wide areas of farmland. Simply disposing of it as a waste product is the least expensive option, but
this can lead to serious degradation of both surface waters and groundwater. Likely sources of

13
pollution are runoff and leaching from manure and wastewater applied to the land, open and
unpaved feedlots, holding ponds, storage lagoons, and drylot stockpiles.
In 1996, over 730,000 fish were killed in Iowa's lakes, streams, and rivers from ten accidental spills
(Figure I.4). The source of three of these spills was manure from hog confinements. In just one
episode in Little Buffalo Creek in Winnebago and Kossuth counties, nearly 587,000 fish were
killed. Combined kills from hog and cattle manure accounted for more than 90% of the total. The
three spills of ammonia from industrial plants killed nearly 64,000 fish (9% of the total). Two of
the three facilities are agroindustrial plants that manufacture fertilizer-N.
Figure I.4: Ten fish kills investigated by the Iowa Department of Natural Resources, Fisheries Bureau, from
June to October 1996. Source: Iowa Department of Natural Resources, Fisheries Bureau (1997).

14
Another problem of stockpiling huge quantities of manure is the stench that can be smelled miles
downwind from the confinement lots, adversely affecting air quality in nearby towns. Citizens in
such small towns as Dumont and Ainsworth, Iowa, have voiced a number of complaints, including
the nauseating smell that has spoiled after-dinner walks that had once been a tradition on warm
sunny evenings, and fears that real estate will be devalued as these communities become less
appealing to prospective buyers (Dahlquist Associates, 1996; Kuhn Communications, 1997).
A third problem is that methane is one of the four major greenhouse gases. As was shown in Figure
I.2, it is estimated that, during the 1980s, it contributed about 15% to the radiative heat balance that
determines the greenhouse effect. Its atmospheric concentration has been increasing globally at a
rate of about 1% per year. Scientists estimate that domesticated animals account for about 15% of
global methane emissions annually, and the increasing concentration of methane can be accounted
for, in part, by the rise in the global animal population (IPCC, 1990). The reason why burning CH4
as a fuel is a benefit for the environment, even though its combustion product is the greenhouse gas
CO2, is that, as with N2O, CH4 is a much more potent greenhouse gas. A ton of methane has the
same greenhouse gas potential as 60 tons of CO2. Thus, if, as suggested above, 32.5 thousand tons
of methane can be captured from hog lot manure and utilized as a fuel rather than a waste, it would
be equivalent to reducing CO2 emissions by 2.0 million tons.
3. Trends in manure generation. According to Ney et al. (1996), the animal population in Iowa is
expected to grow very slowly, perhaps around 0.05% per year. While the total population may not
increase significantly up to the year 2010, the percentage of hogs in large confinement operations
are increasing as smaller producers go out of business. In the period 1991 to 1996 alone, hog
confinements with 1,000 head or higher increased in Iowa by about 78% (Lawrence et al., 1997.
This development, in principle, could allow more methane to be captured, since the capturing
process is more feasible at large operations. Currently, however, no significant methane collection
has been undertaken, and manure remains an untapped energy resource.
4. Impacts of capturing methane from hog manure in Iowa. Methane capture would have a positive
effect on Iowa's energy balance. It would provide a high quality, renewable, in-state source of
energy with a capacity equivalent to as much as 12.7 million gallons of gasoline. The methane
could be used for on-farm needs, or sold to natural gas distributors.
In terms of economics, the cost of methane produced from manure is significantly more expensive
than is the cost of conventional natural gas. Hence, everything else being equal, there would be no
incentive for hog producers to collect the methane. Other considerations would have to be included
in a comprehensive manure management plan. As described above, manure has great potential
value as a fertilizer. Several analysts have estimated the national monetary value of the nitrogen,
phosphorus, and potassium contained in manure. These results are provided in Table I.7, which
also includes the average of the three analyses. Based on the average numbers, the last line of the
table calculates the monetary value of nutrients contained in 922,000 tons of Iowa hog manure.
This latter number is based on the estimate of Ney et al. (1996) for the maximum feasible tonnage
of hog manure that could be exploited for methane capture. As indicated in the table, the total

15
nutrient value is estimated to be about $19 million. Thus, one possible management strategy would
be to recover some of the expense of methane capture by selling nutrients as a by-product.
Table I.7
Economic Value of Nitrogen, Phosphorus, and Potassium in Manure
Millions of Tons Nutrient Value (millions of dollars)
Source Total Manure Nitrogen Phosphorus Potassium
Cross and Byers
(1990)
143 1,611 668 895
Van Dyne and
Gilbertson (1978)
102 1,016 334 524
National Research
Council (1993)
124 1,387 498 -
U.S. Average 123 1,338 500 710
Hog manure
(Iowa)
0.922 10.0 3.8 5.3
With regard to environmental benefits, methane capture as a goal is important because the manure
would be managed as a resource, and not as a waste. Methane would be generated in airtight
digesters, and the manure would be more carefully handled so the probability of leaks to the
environment would be less likely. Moreover, the process would mitigate the stench problem, and
the residue remaining in the digester could be sold as fertilizer. Finally, as noted above, securing
methane as a fuel, rather than releasing it as a pollutant vented to the atmosphere, would lessen
Iowa's contribution to the global greenhouse effect. The potential exists for reductions equivalent
to 2.0 million tons CO2 per year.
I.C. Energy crops: corn, poplars, and switchgrass
1. Energy embodied in energy crops. (a) Energy can be extracted from corn in the form of liquid
ethanol, and blended with gasoline in various proportions. This gasohol product is most commonly
sold as a 10% blend. Controversy has arisen, however, about the overall benefit of ethanol as a
renewable fuel. Critics claim that energy required to produce it is comparable to the energy stored
in the finished ethanol product. In Table I.2, we observed that the energy in the harvested corn
plant is 3.15 times the combined energy inputs. When we consider that only 40% of the plant
energy is stored in the corn kernel from which ethanol is produced, the output/input ratio is reduced
to 1.26. Thus, it appears to be the case that the inherent value of ethanol as a renewable fuel is
somewhat reduced because of the high input energy required in its production. However, the
technology for ethanol production is improving rapidly, and as efficiency improves, so do the
16
benefits of using corn-ethanol. A recent study by the U.S. Department of Agriculture estimates that
corn ethanol production creates 24% more energy than it uses. Moreover, the study found that
ethanol can replace petroleum imports by a factor of 7 to 1 because abundant domestic feedstocks
such as natural gas are used in its production (U.S. Department of Agriculture, as reported in Ney et
al., 1996).
On a volume basis, the energy content of pure ethanol is considerably lower than that of gasoline; a
gallon of ethanol has only 66% as much energy as a gallon of gasoline. If the input energy of
production is taken into account, the net energy per gallon of ethanol equals the energy in 0.13
gallons of gasoline. In 1994, Iowa produced 1.9 billion bushels of corn, with more than 170 million
bushels (9%) used for ethanol production (IDNR, 1996b). From that amount, about 400 million
gallons of ethanol were produced, the energy equivalent of 264 million gge. Net energy gained
(subtracting the input energy) is 51 million gge.
(b) Poplar plantations exist in Iowa as demonstration projects, and are not yet a major source of
energy. A poplar tree buffer strip at Amana, established in 1988 by the University of Iowa, has
produced 7.5 tons of dry matter per acre per year after the third season (Ney et al., 1996). The trees
coppice (grow back from the cut stump) so there is no need for replanting. However, harvesting
equipment not normally used in conventional farming would be required. As a long-term strategy,
trees can be grown on a 6-year rotation thereby renewing the energy crop. The biomass could be
co-fired with coal at power plants, or gasified for use in heating hog confinements, home heating, or
corn drying.
Energy produced per acre from 7.5 tons of dry matter is about 1,100 gge. The total energy obtained
by this source will depend on the amount of land available. The most likely lands are marginal,
highly erodible lands, much of which are currently lying fallow under the Conservation Reserve
Program (CRP). CPR lands constitute about 2.0 million acres (5.6% of Iowa's total land area), and
this land will become available as CPR contracts expire in the near future. Even if a fraction of
these lands were to be set aside for poplar biomass production, it could provide a sizable
contribution of renewable energy for the state. Ney et al. (1996) suggest that up to the year 2010,
fuels derived from poplar/switchgrass could generate between 35 to 100 MW per year of electricity.
Table I.8 provides information on the land and fuel requirements for generating this electricity.
The table shows that poplar grown on less than 4% of CRP lands could provide 100 MW of
electricity per year. This corresponds to about 2.6% of the total electricity generated in Iowa in
1994 (3,880 MW).

17
Table I.8
Biomass and Land Requirements for Electricity Generation
from Poplar Plantations and Switchgrass
Electricity Generated
(KW)
Biomass Required
(tons per years)
Land Required
(Acres)
Percent of
CRP Land
Poplar Plantation
35 200,000 27,000 1.4
100 570,000 76,000 3.8
Switchgrass
35 200,000 57,000 2.9
100 570,000 163,000 8.2
(c) Switchgrass, an indigenous Iowa prairie grass, is an alternative biomass fuel to poplar. Near
Centerville, Iowa, a program is underway to determine the feasibility and economics of growing
switchgrass as a renewable Iowa fuel source. It has the advantage over poplar because it is planted
and harvested with traditional farm equipment. With a yield of about 3.5 tons dry matter per acre
per year, the productivity of switchgrass is about 47% that of poplar. Most likely, this crop would
be harvested on the same type of marginal land as poplar. As shown in Table I.8, switchgrass
biomass, harvested from a land coverage equivalent to about 8% of CRP lands, could produce
about 100 MW of electricity per year.
Chariton Valley RC & D, Inc. and IES Utilities are promoting the production and use of
switchgrass in southern Iowa as a source of biomass for electricity generation. The results of a
feasibility study indicated that co-firing switchgrass with coal is the most practical, economical way
to establish a biomass energy industry. Relatively low cost modifications at the existing IES
Utilities facility would allow a biomass capacity of 35 MW. The facility would use an estimated
57,000 acres (200,000 tons) of biomass annually (reported in Ney et al., 1996).
2. Environmental impacts of energy crops. (a) The enterprise of corn production in general,
whether it be for ethanol or food crop, requires high inputs of fertilizers and pesticides (see Table
I.2). Therefore, it is associated with all the problems created by use of fertilizer-N. As mentioned
earlier, these include contamination of ground and surface waters, eutrophication of lakes and
streams, high concentrations of nitrate in drinking water. Pesticides build up in the food chain and
contaminate fish. Humans are also exposed to pesticides in foods and drinking water (see
Technical Committee on Human Health, 1997). Finally, corn production contributes significantly
to erosion, which depletes Iowa's rich soil resource, and causes off-site damage to water systems
through siltation.

18
On the positive side, the use of ethanol as an additive in gasoline offers several advantages. Firstly,
it has a high octane number, and its use would replace the so-called BTX (benzene, toluene, and
xylene) additives as an octane booster. Benzene is a proven human carcinogen, and xylene is a very
active smog inducer. Ethanol does not pose a risk to human health, and it does not actively enhance
smog formation. Also, ethanol combustion reduces emissions of carbon monoxide, a chemical
highly toxic to humans. Finally, burning ethanol in gasoline creates no net atmospheric build up of
the greenhouse gas CO2. This is so because corn takes in atmospheric CO2 during photosynthesis,
and releases an equivalent amount when burned in the form of ethanol. Even if the production of
ethanol requires 75% of its embodied energy, there would still be a substantial net reduction of CO2
emissions, estimated at about 0.45 million tons.
(b) Poplar plantations, as is the case with corn, require agrochemical inputs of fertilizer and
pesticides. Therefore, they contribute to water pollution and other problems noted above for corn
production. However, input levels of these chemicals are not as high as in the case of corn, so the
associated problems will be less severe.
In other ways, poplar plantations could be beneficial to the environment. They can be used as
buffer strips to decrease erosion and nitrate runoff from highly erodible lands. They can be used in
coal-fired power plants to reduce air pollution. According to Ney et al. (1996), if 5% of the coal in
a conventional 20 MW power plant were replaced by poplar biomass, sulfur emissions would be
reduced by 5% and NOx by 1-2%. Since these pollutants are now regulated more stringently under
the Clean Air Act Amendments of 1990, poplar biomass offers an alternative means for reducing
emissions. Also, for the same reasons given above for ethanol, use of poplar biomass will reduce
emissions of CO2. If poplar biomass produced 100 MW of electric power per year, net CO2
emissions would be reduced by 0.74 million tons annually.
(c) Switchgrass has similar environmental impacts as poplar. It requires about 60 pounds of
fertilizer-N per acre per year, which is about half that required for corn (see Table I.4). Thus, its
production may be associated with some problems caused by fertilizer-N, but the effects will likely
be less severe.
Switchgrass production can thrive on highly erodible lands such as occur in southern Iowa, and
establishing switchgrass plantations on these soils will reduce erosion and improve water quality.
Its adoption as a co-fired fuel with coal to produce electricity would have significant benefits for air
quality and reducing emissions of CO2. A study by the Iowa Department of Natural Resources
(IDNR, 1994) estimates that energy derived from switchgrass grown on 2.8 million acres (about 8%
of Iowa's land) would reduce CO2 emissions annually by 14.3 million tons, NOx by 0.05 million
tons, SO2 by 0.5 million tons, and particulates by 0.06 million tons.
3. Trends in use of energy crops. (a) Ethanol from corn has been used as an additive to gasoline for
about 20 years. Figure I.5 shows the percentage of ethanol-blended gasoline sold in Iowa from
1980 to 1994. Over this time period, gasoline consumption remained approximately constant at
1,400 million gallons. The percentage of ethanol-blend gasoline consumed grew substantially in
19
the early 1980s, when it jumped from about 10% to about 40%. Since then, consumption has
ranged between 30% to 40%. Future trends in ethanol consumption are quite uncertain. Firstly,
current prices of corn are at near record levels, more than $3 per bushel. This will raise the price of
ethanol fuel production, which is already subsidized by federal and state funds. It is not clear
whether these subsidies will continue. On the other hand, ethanol fuels may be in more demand as
a result of the Clean Air Act Amendments of 1990, particularly in large urban areas around the
country seeking to meet the mandated ambient air quality standards for ozone (a primary ingredient
of smog formation). But ethanol must compete in the market with MTBE, another fuel additive
promoted by the petrochemical industry. Thus, it is difficult at this time to forecast future trends for
ethanol consumption.
Graph 58: Ethanol Consumption as a Percentage of Total Motor
Fuels Consumed in Iowa: 1980-1994
0%
10%
20%
30%
40%
50%
19
80
19
81
19
82
19
83
19
84
19
85
19
86
19
87
19
88
19
89
19
90
19
91
19
92
19
93
19
94
% o
f M
oto
r Fu
el
Source: Iowa Department of Revenue and Finance, Iowa Department of Natural Resources
Figure I.5: Percentage of gasoline consumed in Iowa that was ethanol-gasoline blend.
Source: IDNR (1966a).
(b) Poplar plantations are not as yet a significant energy source in Iowa. The use of poplar biomass
in the future will be determined by its cost relative to costs of alternative fuels, by air quality
standards that could affect the mix of fuels consumed, and by the availability of land on which to
site the plantations. With respect to the latter, we mentioned earlier that marginal, former CRP
lands are good candidates for establishing the plantations. As was shown Table I.8, 76,000 acres
dedicated to poplar-tree harvesting by the year 2010, could provide 100 MW of electricity.
(c) Future trends in switchgrass production for energy generation will be affected by much the same
factors as for poplar plantations. Because of lower productivity (3.5 tons/acre for switchgrass,
compared to 7.5 tons/acre for poplar), more land would have to be dedicated for switchgrass
biomass production. As shown in Table I.8, it is estimated that 163,000 acres would be required to
meet the goal of generating 100 MW of electricity from switchgrass by the year 2010.

20
4. Impacts of expanded use of energy crops in Iowa. (a) Production of Iowa corn-ethanol is about
400 million gallons per year. This production has had a positive, though relatively small effect on
Iowa's energy balance. Iowa consumes about 1,400 million gallons of gasoline per year for
transport in the state. Except for the ethanol contained in the ethanol-blended gasoline, all of Iowa's
gasoline supply is imported. It is estimated that of the 400 million gallons of ethanol produced, 56
million gallons are consumed in-state, and 344 million gallons are exported. We estimate that the
net energy saved, after taking into account the energy costs of producing the ethanol, is about 50
million gge per year. Thus in total, ethanol production within Iowa provides energy equivalent to
about 3.6% of the energy embodied in the imported gasoline.
With respect to economic costs and benefits, ethanol production is expensive. Pimentel (1992)
estimates that the true production cost, including state and federal subsidies of about $0.79 per
gallon, is $2.55 a gallon, as compared with gasoline, which costs about $0.70 per gallon. On the
other hand, Ney et al. (1996) estimate that ethanol use saves consumers $98 million in oil and gas
purchases within Iowa. Another benefit for the state is that it has created 12,000 jobs in the ethanol
industry.
With respect to the environment, as mentioned above, there are pluses an minuses. Ethanol
production requires high inputs of agrochemical which cause contamination of water, and increased
erosion. On the positive side, its use in blended gasoline improves air quality, and reduces net
emissions of the greenhouse gas CO2.
(b) Poplar biomass produced on hundreds of thousands of acres of marginal agricultural land would
have a positive impact on Iowa's energy balance. It can be co-fired with coal in electricity
production. Since all of Iowa's coal is imported from Wyoming, poplar biomass fuel reduces Iowa's
dependence on fuels from out of state.
With respect to economics, Ney et al. (1996) estimate biomass poplar fuel is already at the break
even point, i.e., the costs of production are about equal to the selling cost of the fuel. The Electric
Power Research Institute (EPRI) indicates that poplar biomass is worth about $1.96 per million
BTU when co-fired with coal. On a per acre basis, this translates into a fuel value of about $250,
not much lower than that for corn acreage on fertile Iowa farmland. (Poplar can grow well on
erodible, low quality farm land.) If the capital costs of land and trees were $2781/acre, annualized
over a 30 year project lifetime with an 8.0% annual interest rate, the annualized cost would be about
$250 per acre, the same as the annual income. If the value of the woody crop increases, or the
capital cost decreases, the poplar-based biomass industry would produce income for Iowa and its
farmers, particularly in areas with marginal lands.
In terms of environmental considerations, the production of poplar biomass requires use of
fertilizers and pesticides, with their associated environmental problems. But the plantations on
highly erodible land may increase soil quality. Furthermore, the fuel is relatively clean and co-fired
with coal, it may lead to better air quality. Also, its use should reduce net emissions of CO2,
calculated to be about 0.74 million tons CO2 for 570 thousand tons of biomass consumed.

21
(c) Switchgrass as a fuel has many of the same advantages as poplar trees, with respect to impacts
on Iowa's energy balance, the economy, and the environment. Its cost of production is estimated to
be $36.17 per ton of dry biomass, comparable to the cost of poplar biomass (Cooper, 1995).
Perhaps the most attractive feature of a switchgrass industry in Iowa is its ability to utilize marginal
farmland, particularly in southern Iowa. After CRP contracts expire this new industry offers the
hope of improving the local farm economies in these regions. There appears to be a lot of support
for this idea among industry, government and farmers. Chariton Valley RC &D, Inc. is promoting
this initiative along with IES Utilities, the U.S. Departments of Agriculture and Energy, the Iowa
Farm Bureau, and John Deere Ottumwa Works.
In a 1995 study on the Iowa economy conducted by Hagler-Bailly Consultants (1995), it was
reported that biomass production for electric power and energy efficiency programs were good
investments. Investing $80 million in energy efficiency programs would result in 25 job-years per
million dollars invested, $14 million per year in new income for Iowans, and $1.50 of additional
disposable income per dollar invested. Biomass energy production from switchgrass created 84
job-years per million dollars invested and $1.45 of additional disposable income per dollar invested.
The job impact of biomass energy is particularly high, compared to energy efficiency and wind
energy, because it creates a demand for a product which is produced entirely in Iowa.
22
II. Electrical Power
Summary of the impacts of energy efficiency and renewable resources on the generation of
electricity in Iowa: energy, economics, and environment. Table II.1. presents the results of the
analysis given in greater detail in parts II.A through II.C. Energy efficiency measures have a
favorable impact on all aspects of energy supply and service. Every kilowatt hour of electricity
saved through energy efficiency saves the energy equivalent to about three kilowatt hours of
primary energy. This is so because of the Second Law of Thermodynamics, which states that energy
can never by used with 100% efficiency; some fraction of the energy, lost as waste heat, cannot be
converted to useful work. In Iowa in 1992, an input energy of 321.7 trillion BTUs were required to
produce 109.8 trillion BTUs, a conversion efficiency corresponding to 34.1%. Thus, in 1994
energy efficiency measures saved 234 million kWh of delivered electricity, plus the equivalent of
around 468 million kWh of energy lost to the environment as waste heat. The total energy saved
through efficiency measures in 1994 was the equivalent of 30.5 million gallons of gasoline, enough
gasoline to supply Iowa's entire transportation needs for eight days.
Table II.1
Efficiency and Renewable Sources of Energy in Electricity Production
Impacts on Energy, Economy, and the Environment
Issue Energy Impact Economic Impact Environmental Impact
Energy
efficiency
Measures in 1994 alone saved
234 million kWh, 0.7% of all
generated power; total energy
savings including natural gas =
30.5 million gallons gasoline
equivalents/yr.
$76.1 million invested in 1994 saved $18.67
million in energy costs/yr, for a payback period
of 4.1 years; if program continued for ten years,
would: (1) increase gross state product $30 to
$116 million; (2) increase disposable income
$50 to $128 million; (3) create 2,100 to 5,000
job years; also new demand for electricity until
2010, forecasted to grow by about 0.8%.yr,
could be met by continued efficiency
improvements rather than investing in new
capacity.
For measures adopted in 1994 alone,
atmospheric emissions of CO2 were
reduced by 283,689 tons/yr; SO2
emissions by 9,433/yr; and NO
emissions by 728 tons/yr.
Wind power In-state renewable resource equal
to six times Iowa's electricity
demand; feasible generation of
210 MW by 2010 = 110 million
gallons gasoline equivalents/yr.
At 5¢ to 7¢/kWh, wind power is more
expensive than existing coal-fired plants
(2¢/kWh); rather than purchasing out-of-state
coal, wind power provides jobs and income
within Iowa; CO2 allowance trading and/or
improved efficiency of conversion could lower
costs of wind generation; public may be willing
to pay more for in-state wind power; impact of
utility industry deregulation is uncertain.
Avoids impacts related to coal mining
(scarring landscapes, acid mine
drainage, miners' diseases); avoids air
pollution = 1.2 million tons CO2/yr,
40 thousand tons SO2/yr, 3.1
thousand tons of NO/yr.
Biomass
(Poplar &
Switchgrass)
In-state renewable resource;
feasible generation of 100 MW
by 2010 = 52.4 million gallons
gasoline equivalents/yr.
Costs about 5¢/kWh compared to 2¢/kWh for
coal-fired generation; source of income for
owners of marginal, highly erodible, former
CPR farm lands; high potential for in-state
employment.
Avoids impacts related to coal
mining; decreases erosion and
aqueous nitrate pollution; reduces air
pollution in co-fired coal power
plants = 0.57 million tons CO2/yr, 19
thousand tons of SO2/yr, 0.75
thousand tons NO/yr.

23
In economic terms, the measures adopted in 1994 suggest that customers can pay for the up-front
costs of improving energy efficiency from the savings accrued from lower utility bills. The average
payback time is less than five years. Efficiency also benefits the utilities because it forestalls the
time when demand must be met by increasing capacity, requiring construction of expensive new
power plants. Moreover, saving money on energy means less cash goes out-of-state for purchasing
coal. This increases disposable incomes and creates jobs within Iowa.
With regard to the environment, energy not consumed reduces out-of-state pollution incurred
during coal mining, and avoids emissions of air pollutants in Iowa. An often unappreciated point is
that the greenhouse gas CO2 generated from combustion of coal weighs more than the coal itself.
In 1992, 11.5 million tons of coal were consumed to supply electricity in Iowa, and 28.6 million
tons of CO2 were emitted to the atmosphere (data from Ney et al., 1996). Coal combustion also
generates emissions of SO2 and NO, which are major air pollutants now stringently regulated under
the 1990 Clean Air Act Amendments.
Wind energy is a vast resource in Iowa, and tapping even a small percentage of it would make a
dramatic change in the state's energy balance. If 5% of in-state wind energy were harnessed, it
would supply approximately 30% of Iowa's electricity needs, a measure which would allow the
state to import approximately 3.5 million tons of coal less than is currently required. Moreover, a
burgeoning wind power industry would create jobs and increase revenues in Iowa. Despite these
advantages, wind energy is expensive relative to coal. Moreover, as the utility industry undergoes
deregulation, there is a large uncertainty about costs of electricity in the future, and the implications
for investment in renewable energies. An increase in utility rates in Iowa would tend to favor wind,
but a decrease would favor coal. Technological advances in design of wind turbines may make
them more efficient and more cost competitive in the future. There seems to be significant grass-
root support in the state for development of wind energy despite its higher cost.
With respect to the environment, it appears that wind power has considerably lower impacts than
coal-powered generation. As with the case of energy efficiency, wind power avoids pollution at the
coal mine, and does not contribute to emissions of CO2, SO2, and NO.
Biomass from poplar and switchgrass has the advantage that, like wind, it is a renewable, in-state
energy source. Its maximum potential for electricity generation is probably on the order of 5% to
10% that of wind. About 2 million acres of land released from the CRP will be available for
development in the near future. If 10% of this land were devoted to energy crops, biomass could
provide about 4% to 8% of Iowa's demand for electricity. At a cost of 5¢/kWh, the major deterrent
to development of this resource is once again economic. On the other hand, biomass plantations
can thrive even on marginal agricultural lands, and their implementation could provide income and
jobs in areas of the state in need of economic development. There would be environmental benefits
associated with this enterprise as well. Plantation of energy-crops would serve to reduce erosion,
and planting buffer strips adjacent to surface waters would protect them from siltation and runoff.
There would also be reductions in emissions of air pollutants.
24
II.A. Overview of electricity use in Iowa
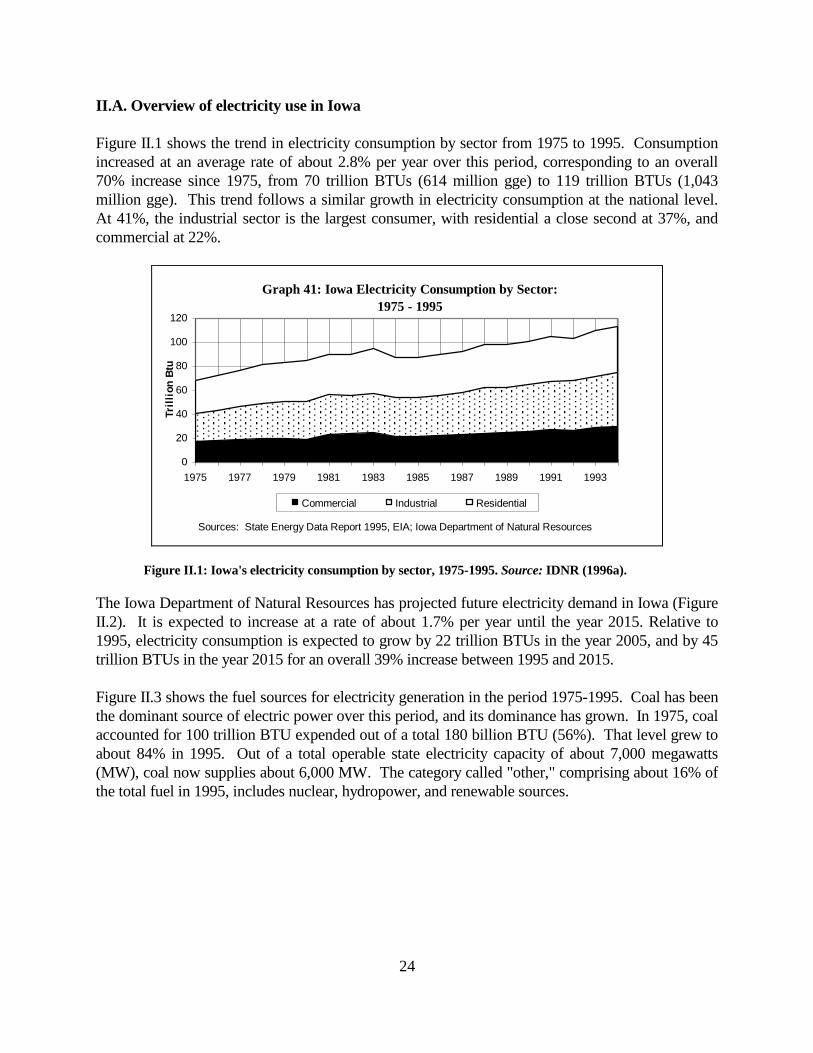
Figure II.1 shows the trend in electricity consumption by sector from 1975 to 1995. Consumption
increased at an average rate of about 2.8% per year over this period, corresponding to an overall
70% increase since 1975, from 70 trillion BTUs (614 million gge) to 119 trillion BTUs (1,043
million gge). This trend follows a similar growth in electricity consumption at the national level.
At 41%, the industrial sector is the largest consumer, with residential a close second at 37%, and
commercial at 22%.
Graph 41: Iowa Electricity Consumption by Sector:
1975 - 1995
0
20
40
60
80
100
120
1975 1977 1979 1981 1983 1985 1987 1989 1991 1993
Tri
llio
n B
tu
Commercial Industrial Residential
Sources: State Energy Data Report 1995, EIA; Iowa Department of Natural Resources
Figure II.1: Iowa's electricity consumption by sector, 1975-1995. Source: IDNR (1996a).
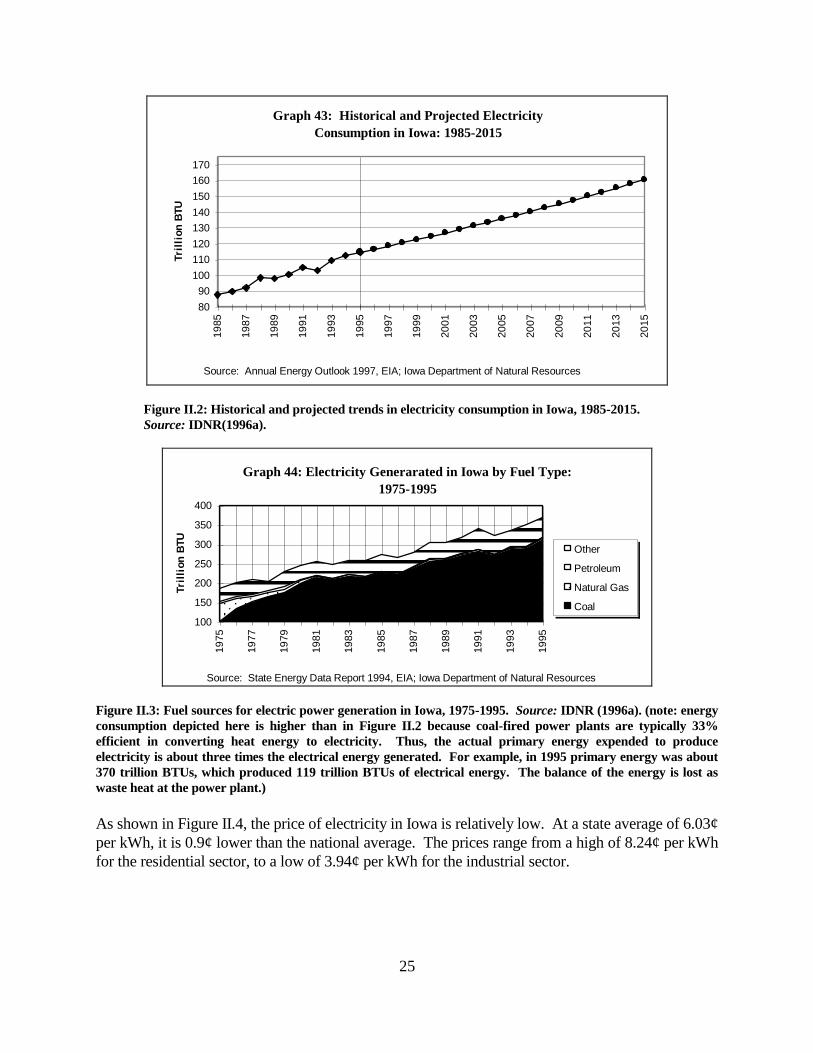
The Iowa Department of Natural Resources has projected future electricity demand in Iowa (Figure
II.2). It is expected to increase at a rate of about 1.7% per year until the year 2015. Relative to
1995, electricity consumption is expected to grow by 22 trillion BTUs in the year 2005, and by 45
trillion BTUs in the year 2015 for an overall 39% increase between 1995 and 2015.
Figure II.3 shows the fuel sources for electricity generation in the period 1975-1995. Coal has been
the dominant source of electric power over this period, and its dominance has grown. In 1975, coal
accounted for 100 trillion BTU expended out of a total 180 billion BTU (56%). That level grew to
about 84% in 1995. Out of a total operable state electricity capacity of about 7,000 megawatts
(MW), coal now supplies about 6,000 MW. The category called "other," comprising about 16% of
the total fuel in 1995, includes nuclear, hydropower, and renewable sources.
25
Graph 43: Historical and Projected Electricity
Consumption in Iowa: 1985-2015
80
90
100
110
120
130
140
150
160
170
19
85
19
87
19
89
19
91
19
93
19
95
19
97
19
99
20
01
20
03
20
05
20
07
20
09
20
11
20
13
20
15
Tri
llio
n B
TU
Source: Annual Energy Outlook 1997, EIA; Iowa Department of Natural Resources
Figure II.2: Historical and projected trends in electricity consumption in Iowa, 1985-2015.
Source: IDNR(1996a).
Graph 44: Electricity Generarated in Iowa by Fuel Type:
1975-1995
100
150
200
250
300
350
400
19
75
19
77
19
79
19
81
19
83
19
85
19
87
19
89
19
91
19
93
19
95
Tri
llio
n B
TU
Other
Petroleum
Natural Gas
Coal
Source: State Energy Data Report 1994, EIA; Iowa Department of Natural Resources
Figure II.3: Fuel sources for electric power generation in Iowa, 1975-1995. Source: IDNR (1996a). (note: energy
consumption depicted here is higher than in Figure II.2 because coal-fired power plants are typically 33%
efficient in converting heat energy to electricity. Thus, the actual primary energy expended to produce
electricity is about three times the electrical energy generated. For example, in 1995 primary energy was about
370 trillion BTUs, which produced 119 trillion BTUs of electrical energy. The balance of the energy is lost as
waste heat at the power plant.)
As shown in Figure II.4, the price of electricity in Iowa is relatively low. At a state average of 6.03¢
per kWh, it is 0.9¢ lower than the national average. The prices range from a high of 8.24¢ per kWh
for the residential sector, to a low of 3.94¢ per kWh for the industrial sector.

26
Graph 46: Ratio of Iowa to U.S. Average Cents per kWh: 1995
0.00
1.00
2.00
3.00
4.00
5.00
6.00
7.00
8.00
9.00
All Sectors Residential Commercial Industrial Other
Ce
nts
pe
r k
Wh
75.0%
80.0%
85.0%
90.0%
95.0%
100.0%
Iowa U.S. Ratio of Ia/U.S.
Average Electricity Prices in Iowa and the U.S.
by Sector in Cents per kWh, 1995
All Sectors Residential Commercial Industrial Other
Iowa 6.03 8.24 6.44 3.94 6.13
US 6.89 8.40 7.69 4.66 6.88
Ratio of IA/US 87.5% 98.1% 83.7% 84.5% 89.1%
Figure II.4: Comparison of electricity rates by sector for Iowa and the U.S. Source: IDNR (1996a).
II.B. The role of energy efficiency in electric power generation in Iowa
1. Energy savings from improved energy efficiency. To meet the growing demand for electricity
use in Iowa, energy providers will have two primary choices: either to increase the supply, or to
reduce the demand. The 1990 Iowa Comprehensive Energy Plan, titled Environment, Economy,
Energy: Iowa at the Crossroads states that the objective in energy efficiency is "to meet future
energy demand by increasing efficiency rather than supply." For the past several years, Iowa's
utilities and the IDNR have administered successful programs targeted at reducing the demand for
electricity and natural gas, thus forestalling the need for additional capacity. However, current
discussions about policy and regulatory changes, such as restructuring and deregulation, have cast
the future of such efforts into question. Within this atmosphere of uncertainty, it is useful to review
the successes of energy efficiency programs to date, as a possible motivation for building on these
successes and maintaining the momentum of these programs in the future.
Demand side management (DSM) is defined as any action that manages consumption by an end-use
customer. IDNR and Iowa utilities have actively supported DSM activities with very positive
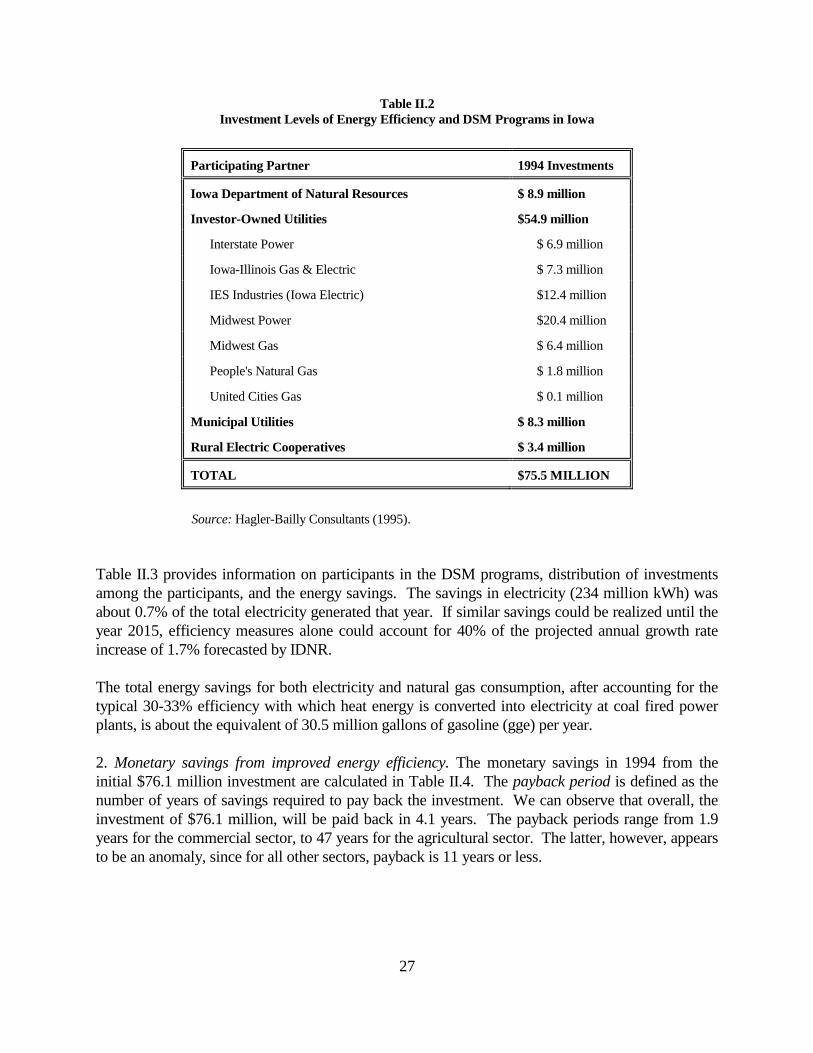
results. Table II.2 shows the investment levels in DSM programs in Iowa for the year 1994, which
totaled $75.5 million.
27
Table II.2
Investment Levels of Energy Efficiency and DSM Programs in Iowa
Participating Partner 1994 Investments
Iowa Department of Natural Resources $ 8.9 million
Investor-Owned Utilities $54.9 million
Interstate Power $ 6.9 million
Iowa-Illinois Gas & Electric $ 7.3 million
IES Industries (Iowa Electric) $12.4 million
Midwest Power $20.4 million
Midwest Gas $ 6.4 million
People's Natural Gas $ 1.8 million
United Cities Gas $ 0.1 million
Municipal Utilities $ 8.3 million
Rural Electric Cooperatives $ 3.4 million
TOTAL $75.5 MILLION
Source: Hagler-Bailly Consultants (1995).
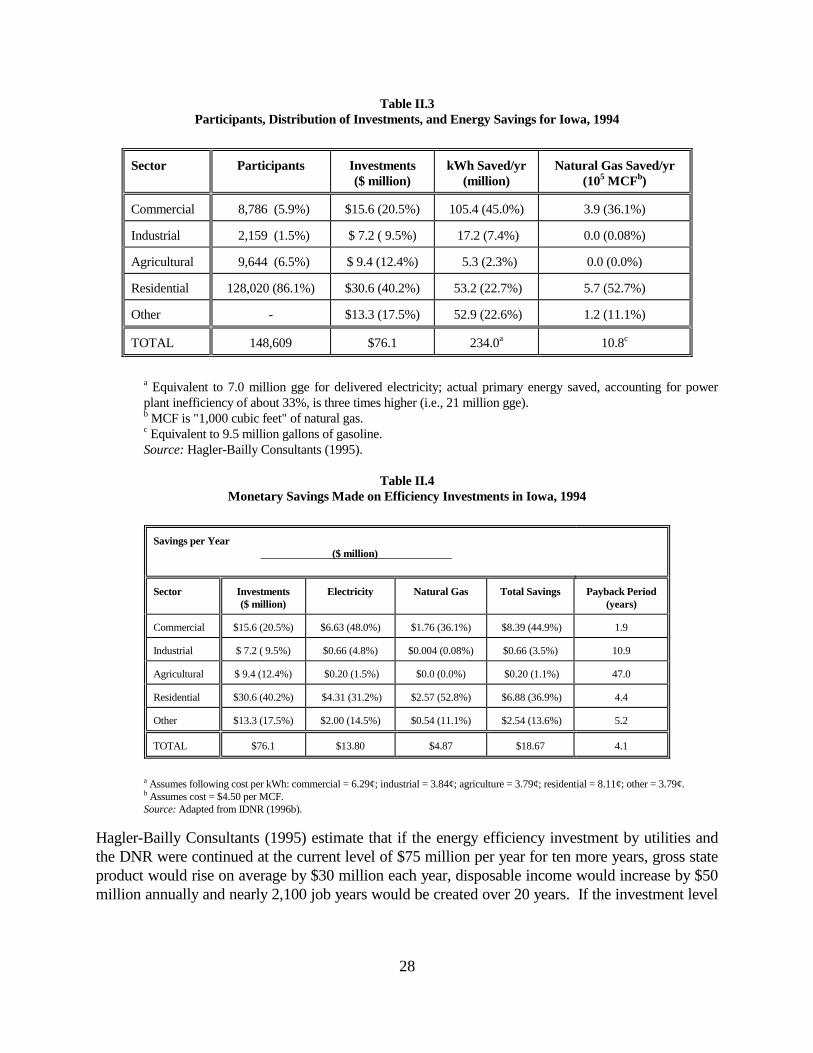
Table II.3 provides information on participants in the DSM programs, distribution of investments
among the participants, and the energy savings. The savings in electricity (234 million kWh) was
about 0.7% of the total electricity generated that year. If similar savings could be realized until the
year 2015, efficiency measures alone could account for 40% of the projected annual growth rate
increase of 1.7% forecasted by IDNR.
The total energy savings for both electricity and natural gas consumption, after accounting for the
typical 30-33% efficiency with which heat energy is converted into electricity at coal fired power
plants, is about the equivalent of 30.5 million gallons of gasoline (gge) per year.
2. Monetary savings from improved energy efficiency. The monetary savings in 1994 from the
initial $76.1 million investment are calculated in Table II.4. The payback period is defined as the
number of years of savings required to pay back the investment. We can observe that overall, the
investment of $76.1 million, will be paid back in 4.1 years. The payback periods range from 1.9
years for the commercial sector, to 47 years for the agricultural sector. The latter, however, appears
to be an anomaly, since for all other sectors, payback is 11 years or less.
28
Table II.3
Participants, Distribution of Investments, and Energy Savings for Iowa, 1994
Sector Participants Investments
($ million)
kWh Saved/yr
(million)
Natural Gas Saved/yr
(105 MCF
b)
Commercial 8,786 (5.9%) $15.6 (20.5%) 105.4 (45.0%) 3.9 (36.1%)
Industrial 2,159 (1.5%) $ 7.2 ( 9.5%) 17.2 (7.4%) 0.0 (0.08%)
Agricultural 9,644 (6.5%) $ 9.4 (12.4%) 5.3 (2.3%) 0.0 (0.0%)
Residential 128,020 (86.1%) $30.6 (40.2%) 53.2 (22.7%) 5.7 (52.7%)
Other - $13.3 (17.5%) 52.9 (22.6%) 1.2 (11.1%)
TOTAL 148,609 $76.1 234.0a 10.8
c
a Equivalent to 7.0 million gge for delivered electricity; actual primary energy saved, accounting for power
plant inefficiency of about 33%, is three times higher (i.e., 21 million gge). b
MCF is "1,000 cubic feet" of natural gas. c
Equivalent to 9.5 million gallons of gasoline.
Source: Hagler-Bailly Consultants (1995).
Table II.4
Monetary Savings Made on Efficiency Investments in Iowa, 1994
Savings per Year
($ million)
Sector Investments
($ million)
Electricity Natural Gas Total Savings Payback Period
(years)
Commercial $15.6 (20.5%) $6.63 (48.0%) $1.76 (36.1%) $8.39 (44.9%) 1.9
Industrial $ 7.2 ( 9.5%) $0.66 (4.8%) $0.004 (0.08%) $0.66 (3.5%) 10.9
Agricultural $ 9.4 (12.4%) $0.20 (1.5%) $0.0 (0.0%) $0.20 (1.1%) 47.0
Residential $30.6 (40.2%) $4.31 (31.2%) $2.57 (52.8%) $6.88 (36.9%) 4.4
Other $13.3 (17.5%) $2.00 (14.5%) $0.54 (11.1%) $2.54 (13.6%) 5.2
TOTAL $76.1 $13.80 $4.87 $18.67 4.1
a Assumes following cost per kWh: commercial = 6.29¢; industrial = 3.84¢; agriculture = 3.79¢; residential = 8.11¢; other = 3.79¢. b Assumes cost = $4.50 per MCF.
Source: Adapted from IDNR (1996b).
Hagler-Bailly Consultants (1995) estimate that if the energy efficiency investment by utilities and
the DNR were continued at the current level of $75 million per year for ten more years, gross state
product would rise on average by $30 million each year, disposable income would increase by $50
million annually and nearly 2,100 job years would be created over 20 years. If the investment level

29
were targeted only at residential efficiency opportunities, the economic return would be even
greater, generating $116 million in gross state product, $128 million in disposable income and more
than 5,000 job years for the same length of time.
3. Environmental benefits from improved energy efficiency. An important point about efficiency in
the electricity sector is that for every kWh that is avoided, three kWhs of energy are saved. The
environmental benefit of avoiding the generation of 234 million kWh in 1994 was a reduction in
atmospheric emissions of carbon dioxide (CO2), sulfur dioxide (SO2), and nitric oxide (NO). The
estimated amounts of reductions for these gases are given in Table II.5. As noted earlier, CO2 is a
greenhouse gas, whose atmospheric build-up may eventually lead to global climate change (IPCC,
1990). SO2 is a precursor of acid rain, and in urban environments is a lung irritant that poses health
risk to asthmatics and the elderly. NO plays a major role in smog formation. Stringent air quality
standards have been set for these gases under the Clean Air Act Amendments of 1990. As electricity
demand continues to grow, one cost-effective means for holding emissions within those standards
is to increase demand-side efficiency.
There is also a benefit from reducing emissions of methane. From Table II.3, the estimated
reduction in 1994 was about 1.1 million MCF. In 1992, the latest year for which data are available,
Iowa consumed 231 million MCF (Ney et al., 1994). One may estimate, therefore, that the energy
savings from efficiency was on the order of 0.5%. Compared to oil and especially coal, methane is
a relatively clean fuel. Sulfur and nitrogen content is usually negligible. Also, methane during
combustion generates less CO2 per unit of energy produced than either coal or oil: about 25% less
than oil, and 40% less than coal. Nevertheless, in 1992 methane provided 24% of Iowa's energy
consumption, and generated 13.9 million tons of CO2, the latter equivalent to 17% of all Iowa's CO2
emissions (Ney et al., 1996). By avoiding the consumption of 1.1 million MCF in 1994, 66
thousand tons less of CO2 were emitted.
Table II.5
Estimated Reductions in Atmospheric Emissions of CO2, SO2, and NO
Due to Energy Efficiency Measures in Iowa in 1994
Reductions in Atmospheric Emissions
(tons per year)a
Avoided Electricity Generation
(million kWh)
CO2 SO2 NO
237 283,689 9,433 728
a Emission factors for calculating pollutant emissions: (11.97x10
-4 tons CO2)/kWh; (3.98x10
-5 tons
SO2)/kWh; (3.07x10⁻⁶
tons NO)/kWh
Source: Adapted from Ney et al. (1996).

30
II.C. The role of renewable energy in electric power generation in Iowa
1. The renewable resource base for electricity generation in Iowa. The basis for establishing
markets for renewable sources of energy is provided under Iowa law. Iowa's Alternative Energy
Production Statute (AEP), in place since 1983, states as its goal:
....to encourage the development of alternate energy production facilities and small hydro facilities in
order to conserve our finite and expensive energy resources and to provide for their most efficient use.
After years of debate, final rules were promulgated in 1992, which established a set buy-back rate
and the requirement for the purchase of 105 MW of capacity from independent producers of
renewable energy. A deadline was not written into the legislation, and few purchases have been
made to date. By the end of 1996, utilities had contracted for just 15.8 MW, 15% of the required
105 MW. These contracts were with a variety of small, disparate entities producing power from
wind, biomass, and hydro. The wind portion of these purchases involved a capacity of only 0.381
MW.
One factor that makes wind energy an attractive option in Iowa is the size of the resource.
According to a study by Battelle Pacific Northwest Labs, the potential supply of wind energy for
electricity generation is more than six times higher than the in-state demand. Given that Iowa's
operable electricity capacity is around 7,000 MW, and that the state consumes about 4,000 MWy of
energy per year, the wind resource is estimated to be about 30,000 MWy per year.
Although only a puny amount of wind energy has been harnessed to date (about 0.001 %), its use
will escalate rapidly in the next few years. The Cedar Falls Utility and six other municipal Iowa
utilities have entered into a collaborative agreement with the U.S. Department of Energy and the
Electric Power Research Institute (EPRI) to purchase electricity from a new 2.25 MW wind farm
near Algona, Iowa. Additionally, Mid American, a large investor-owned Iowa utility, will purchase
50 to 60 MW of capacity from a new, state-of-the-art wind project in northwestern Iowa. Relative
to total in-state electricity generation, these programs, when they are in place, will still be rather
minor, contributing a scant 0.9% of Iowa's needs. But the size of these operations is large enough
to test the feasibility of scaling-up wind power's contribution in the next several decades.
The potential for electricity production from biomass fuel was discussed earlier (see Table I.8). Up
to the year 2010, 100-200 MW capacities may be feasible, using poplar trees/switchgrass as the
source of the fuel. Several hundred thousand acres of land would be needed to support this
enterprise, and former CRP lands would be the most likely areas of implementation.
2. Economic considerations of renewable fuels. One reason for the continuing interest in wind
energy is its declining cost of electricity generation. In several recent studies, researchers conclude
that the overall production cost is now between 5-7¢/kWh, a reduction from about 25¢/kWh in the
early 1980s. Wind power is still more expensive than existing coal fired power plants in Iowa that
burn Wyoming coal at a cost of $75 per ton, a price that allows electricity to be produced at less
31
than 2¢/kWh. For new coal-fired plants, however, the cost may be as much as 4¢/kWh (Ney et al.,
1996). As noted above, Iowa's electricity rates are relatively low. If the effect of deregulation were
to make the rates more uniform among the states, thus raising rates in Iowa, wind could be more
cost competitive, especially for new generating facilities. However, it could work the other way. If
competition lowers rates throughout the nation, renewable energy options will be less attractive.
Thus, it is very difficult to estimate the extent to which wind energy will be adopted in the future.
Ney et al. (1996) suggest an adoption of 105 MW capacity by the year 2000, and a doubling to 210
MW by the year 2010.
The economic situation is much the same for biomass from poplar and switchgrass. Ney et al.
(1996) estimate a generating cost of 5¢ per kWh. Thus, for biomass to become economically viable
the capital costs of producing it must decrease.
Environmentalists would argue that in pricing coal at 2¢/kWh, no accounting has been made of the
environmental costs of coal production and consumption. These costs include the scaring of the
landscape from strip mining of coal, the health impacts on coal miners, the potential for global
climate change from emissions of CO2 generated during combustion, urban smog from emissions
of nitric oxide (NO), acid rain and aggravation of lung disease from exposure to sulfur dioxide
(SO2). As reported in Ney et al. (1996), the Minnesota Public Utilities Commission voted in
September 1996 to accept a $0.28-$2.92 per ton of CO2 valuation for the global warming impact of
carbon emissions from utility power plants. This is the first time in the U.S. that a dollar value has
been imposed on CO2 emissions from electricity production. It begins to establish a market value
for CO2 that would be necessary in an emissions trading scheme. Such a scheme could be
analogous to the SO2 allowance system that was established following the 1990 Clean Air Act
Amendments.
For this arrangement to work, the program would have to be national in scope. Allowance would
be allocated to each emitter according to its baseline CO2 emissions. Allowances could be
purchased by utilities that exceed their baseline, and plants that operate below their emissions quota
could sell their allowances. The goal is to use market forces to encourage emitters to develop more
cost effective measures to control CO2, and to stimulate entrepreneurs to develop innovative new
CO2 emission control technologies.
If such a scheme were in place, the economics of electricity generation from both wind and biomass
would improve, since energy providers using these sources would be in a position to sell CO2
emissions allowances. As an example, let us assume that electricity from wind has a generating
capacity of 210 MW in the year 2010. The amount of CO2 avoided can be estimated relative to the
amount of CO2 emissions that would have been generated from an equivalent 210 MW coal-fired
power plants. The CO2 avoided can then be traded at the rate of $0.28-$2.92 per ton CO2. Data are
presented in Table II.6.

32
Table II.6
Amounts of CO2 Emissions Avoided and Estimated Revenues from Trading Allowances
from Use of 210 MW Wind Energy Generation
Energy Generated
(billion kWh/year)
Emissions Avoided
(million tons CO2/year)
Revenuesa
($ millions)
1.0 1.2 0.34-3.5
a Assumes that CO2 can be traded at $0.28-$2.92 per tons.
As shown, a 210 MW wind energy farm generating a billion kWh per year would avoid about 1.2
million tons of CO2 per year. Using the estimates proposed by the Minnesota Utilities Commission
($0.28-$2.92 per ton CO2), the wind farm could gain between $340,000 to $3.5 million per year
from trading allowances. At 6¢ a kWh, the energy generated would cost about $60 million,
compared to a cost of about $20 million for energy generated from coal at 2¢/kWh. If the wind
generator received the maximum $3.5 million by selling CO2 emission allowances, the electricity
could afford to be sold for $56.5 million at a rate of 5.7¢ per kWh. Thus, even with the emission
allowance in place, wind energy is still an expensive option relative to coal. To make wind power
more competitive, the price per kilowatt hour would have to decline further, either by raising the
per ton price of the CO2 allowance, or through further technological advances that would improve
the efficiency with which wind power could be converted to electricity. The economics of biogas
are more or less similar to that of wind.
Apart from direct comparisons of ¢/kWh, other factors come into play. In using out-of-state coal to
generate electricity, Iowans export money out of Iowa to support coal miners and other personnel
engaged in the coal distribution chain. In contrast, revenues from the sale of electricity from Iowa
sources of wind and biogas provide income to Iowans. Siting of wind turbines will be mostly on
private lands leased to the utilities. One large turbine can generate $2,000 per year for the land
owner (W. Winterhof, private communication, Aurelia, Iowa). As noted earlier biomass from
poplar and switchgrass can be harvested on marginal agricultural lands in economically depressed
areas. Much of this land will become available as the contracts for CRP lands expire.
Another consideration is that customers may be willing to pay more for electricity generated from
renewable in-state sources. A recent survey, commissioned by Cedar Falls Utilities, assessed
customer interest in using wind-generated electricity (Kramer et al., 1997). The sampling plan
consisted of interviewing a statistically significant 400 utility residential customers. Table II.7
compares customer preferences for increasing, maintaining, of decreasing the use of coal and wind
energy. As the table shows, all other concerns being equal, 90% of the customers favored
increasing wind-generated electricity, while only 15% favor increasing the use of coal-generated
power. This finding is almost identical to the study by Palmer (1996) in the town of Searsburg,
Vermont, where 89.1% of the citizens favored an increase in wind energy.. It is also in line with

33
other studies that tend to support high public interest in using renewable energy sources ( Gipe,
1995; Sustainable Energy Budget Coalition, 1994).
Table II.7
Comparisons of Preferences for Use of Coal and Wind Power
Cedar Falls, Iowa
Source Increase Use No Change Decrease Use
Coal 14.9% 31.7% 53.4%
Wind 90.2% 7.8% 2.1%
Source: Kramer et al. (1997)
The respondents were also asked about their willingness to pay higher utility bills to support the use
of wind power. Table II.8a shows the response for an additional payment of $20/month. About
one-third (36.9%) said they would be willing to pay this amount. An additional one-fifth (20.0%)
said they were willing to pay the $20 rate provided there was a decrease in other energy costs and/or
the rate was restricted to a fixed time period (i.e., not a permanent cost).
Table II.8a
Willingness of Customers to Pay Higher Utility Bills to Support Wind Power
Cedar Falls, Iowa
Pay extra $20 per month? Response
Yes-Maybe 15.2%
Yes-But only if... 4.6%
Yes-No qualifications 36.9%
No 43.0%
Source: Kramer et al. (1997)
The participants who qualified their support for paying an extra $20 per month, and those that
answered an unqualified "no" were asked if they would be willing to pay an extra $10 per month.
The results are shown in Table II.8b. One may observe that from this sub-group, nearly two-thirds
of the respondents indicated their willingness to pay the extra $10 cost.

34
Table II.8b
Willingness of Customers to Pay Higher Utility Bills to Support Wind Power
Cedar Falls, Iowa
Pay extra $10 per month? Response
Yes 63.0%
No 37.6%
Source: Kramer et al. (1997)
3. Environmental benefits from use of renewable sources of electricity generation. Wind energy is
a clean technology with relatively low environmental impacts. Wind turbines pose a danger to
birds flying into the spinning propellers, and they are somewhat noisy. Some have complained
about the spoiling of vistas dotted with rows of wind turbines. These problems, however, can be
solved in part by improved designs that enhance their attractiveness and reduce noise. With respect
to bird mortality, studies from the Netherlands, Denmark, and the U.S. show that the total impact
on birds is negligible compared to the impacts from road traffic. Moreover, it has been reported
that falcons are nesting and breeding in cages attached to two Danish wind turbines (Danish Wind
Turbine Manufacturers Association, 1997).
Compared to coal-fired electricity, one advantage of wind is the lack of any problems associated
with mining. Coal-mining scars the landscape, generates acid-mine drainage, and causes "black
lung" disease among coal miners. Another advantage of wind energy is that there are no emissions
of air pollutants, while coal emits CO2, SO2, and NO. Table II.9 shows the tonnage of these three
gases emitted per year from a 210 MW coal-fired power plant. These quantities are equivalent to
the tonnage that would be avoided by replacing the coal-generated power by wind power.
Table II.9
Estimated Atmospheric Emissions per Year of CO2, SO2, and NO
from 210 MW Coal-Fired Power Plant
Magnitude of Atmospheric Emissions
(thousand tons per year)a
Electricity Generation
(billion kWh)
CO2 SO2 NO
1.0 1,197 39.8 3.07
a Emission factors for calculating pollutant emissions: (11.97x10
-4 tons CO2)/kWh; (3.98x10
-5 tons
SO2)/kWh; (3.07x10⁻⁶
tons NO)/kWh

35
According to IDNR (1994) and Ney et al. (1996), burning biogas from poplar/switchgrass would
also reduce air pollution. As renewable fuels, there would be no net CO2 emissions, except for
emissions expended in growing and harvesting the crops. Because of the low sulfur and nitrogen
contents in the biogas, emissions of SO2 and NO would be lower. These energy crops have other
environmental advantages with regard to protecting soil quality on highly erodible lands (see page
17).

36
III. Transportation
Summary of Transportation Sector on energy, economics and the environment. The most important
issues influencing the demand and supply of motor fuels in Iowa are shown in Table III.1. Data,
presented in more detail in the following parts, suggest that, with respect to vehicle fuel efficiency
and level of vehicle occupancy, the trends are pointing in the wrong direction. Considerable
improvements in vehicle fuel efficiency were achieved in the 1970s and 1980s, but recent trends
indicate that these gains will be squandered in the near future, not only in Iowa, but in the nation as
a whole, as vans, light trucks, and heavier cars become the vehicles of choice for a growing number
of consumers. Similarly, declines in both carpooling and family size have resulted in reduced
levels of vehicle occupancy. Moreover, Iowans today drive twice as many miles per year than they
did 25 years ago.
Table III.1
Transportation Energy
Impacts on Energy, Economy, and the Environment
Issue Energy Impact Economic Impact Environmental Impact
Vehicle fuel
efficiency
Transport energy expended over
period 1980-1994 remained
constant at about 1,400 million
gallons gasoline/yr; this was due
to continued improvements in
vehicle efficiency.
Improvements now offset by
expanded use of vans and light
trucks, and increases in vehicle
miles traveled per capita/yr.
As vehicle miles driven/capita/yr increase and
vehicle fuel efficiency declines, citizens will pay
more for fuel; under current prices, it is not likely
this will be an important consideration to the
average consumer; operating costs/yr (mostly for
gas and oil purchase, tires, and maintenance) now
lower in 1975. High gasoline demand in Iowa and
the nation will increase dependence on imports of
foreign oil, which in 1996 was 53% of supply;
DOE forecasts national outflow of $100 billion/yr
for foreign oil in 10 years.
As more fuel is burned, emissions of CO, NO,
and VOCs may increase; CO is very toxic,
and NO and VOCs are major components of
smog; impacts will be somewhat mitigated by
new gasoline formulations and stringent air
quality regulations. Emissions of CO2, a
major greenhouse gas and currently
unregulated, will increase.
Level of
vehicle
occupancy
Average occupancy level
declined from 2.07 in 1972 to
1.62 in 1990; if occupancy level
had remained at 2.07, fuel
consumption in 1990 would
have been 22% lower, saving
304 million gallons gasoline/yr.
Lower occupancy levels result in higher costs for
gasoline; at a cost of $1.30/gallon, the purchase of
304 million extra gallons cost Iowans $395
million. Gasoline prices would have to increase by
51¢/ gallon to offset ongoing decline in carpooling
rate, and $1.31/gallon to restore carpooling rate by
year 2000.
304 million gallons gasoline increased
emissions of CO by 69,000 tons/yr; of NO by
9,000 tons/yr; of VOCs by 12,000 tons/yr; and
of CO2 by 2,800,000 tons/yr.
Alternative
fuels
State ethanol production
potential = 51 million gallons
gasoline/yr; methane production
potential (hog manure, poplars,
and switchgrass) = 180 million
gallons gasoline/yr; total = 17%
of Iowa’s consumption.
Alternative fuel production costs are much higher
than current cost of conventional gasoline; for
ethanol it is $2.55/gallon compared to $0.70/gallon
for refinery gasoline; use of fuels would reduce
dependence on foreign gasoline.
Corn production feedstock for ethanol causes
water pollution and erosion; use in gasoline
reduces smog, and CO2 emissions reduced by
0.45 million tons/yr. Methane from manure
reduces water pollution and stench, and CO2
emissions reduced by 2.0 million tons/yr.
Methane from poplar and switchgrass reduces
erosion on marginal lands; and CO2 emissions
reduced by 1.5 million tons
Future direction in the transport sector is quite uncertain. What seems apparent though, is that it
will be shaped by at least three emerging factors. The first is the increased use of alternative fuels
from domestic sources. These include ethanol-blended fuel, natural gas, propane, and biodiesel.
The fuels will not only wean us away from our dependence on foreign oil, but also will mitigate
37
pollution generated by the transport sector. Obviously, Iowa, as the second leading producer of
ethanol in the U.S., has a large stake in this development.
The second factor is the impact of federal regulations including the Clean Air Act Amendments of
1990, as well as subsequent legislation currently being debated in Washington. Transport is a
major source of urban air pollution, and curtailing its emissions is the main motivation for imposing
stricter air standards. The Clinton Administration has proposed new standards that EPA claims will
protect 70 million people in the U.S., and prevent 15,000 premature deaths each year. Critics claim
hundreds of cities and counties will not be able to comply, and would face economically crippling
penalties (Chemical & engineering news, 1997a, 1997). If the regulations become increasingly
stringent, new solutions will have to be sought to come to compliance under federal law. Even
today, states such as California and Massachusetts are mandating the increased use of “zero
emission” vehicles in highly urban areas, thus stimulating interest in and production of electric
vehicles.
The third factor is new technologies that may radically change the mode and manner of transport.
Super-efficient vehicles achieving on the order of 100 miles per gallon of gasoline are on the
drawing boards of most major auto manufacturers, both in the U.S. and abroad. A very promising
technology of the future is automobiles powered by fuel cells which are characteristically non-
polluting and highly efficient. The likely energy currency for the cells is hydrogen, which can be
produced by the electrolysis of water. This will greatly increase the demand for electricity
generation, which can be met by domestic sources of coal, nuclear, and renewable fuels.
Policies and programs at the state level can influence, to some extent, energy use in the
transportation sector. But national policies and the global evolution of new technologies and
markets will also play a major role in Iowa’s transportation future.
III.A. Overview of the transportation sector in Iowa
As stated in the Iowa Comprehensive Energy Plan (1996), the overarching issues related to the
transportation sector focus on two concerns: (1) our continued dependence on imported oil; and, (2)
the need to manage a transition to more environmentally and economically advantageous energy
choices. These concerns have evolved from the 1970s, when the major preoccupation was adequate
supply. While the supply issue is of course still important, it only addresses one side of the ledger.
Analogous to the utilities' demand side management programs, significant strides can be made in
improving efficiency in various end-use services provided by transport energy. Because of the
complex nature of the transportation sector, it is important to assess supply, demand, economics,
and the environment from a systems approach that considers the entire transportation infrastructure.
Figure III.1 shows trends in Iowa's energy consumption by sector. Over the period from 1974 to
1995, transportation's energy consumption remained constant at 24%-26% of total energy use.
Figure III.2 shows transportation fuel consumption over the same period. Total fuel consumption
38
has remained relatively stable at about 1,400 million gallons per year. Currently about 40% of the
gasoline consumed is an ethanol blend, typically comprising 10% to 15% ethanol.
Graph 4: Iowa Primary Energy Consumption by Sector:
1974 - 1995
0
200
400
600
800
1000
120019
75
19
77
19
79
19
81
19
83
19
85
19
87
19
89
19
91
19
93
19
95
Tri
llio
n B
tu
Transportation
Residential
Industrial
Commercial
Source: State Energy Data Report, 1994, EIA; Monthly Energy Review, June 1997, EIA
Figure III.1: Iowa primary energy consumption by sector, 1973-1994. Source: IDNR (1996a).
Graph 57: Total Motor Fuel Consumption in Iowa by Regular
and Ethanol Mix: 1980-1994
0
500
1,000
1,500
2,000
19
80
19
81
19
82
19
83
19
84
19
85
19
86
19
87
19
88
19
89
19
90
19
91
19
92
19
93
19
94
Mil
lio
ns
of
Ga
llon
s
Regular Ethanol Blends
Sources: Iowa Department of Revenue and Finance; Iowa Department of Natural Resources
Figure III.2: Total motor fuel consumption in Iowa by regular and ethanol mix: 1980-1994. Source:
IDNR (1996a).
39
The constancy of gasoline consumption shown in Figure III.2 masks Iowa's increasing reliance on
automotive transport. Figure III.3 shows the trend in Iowa's per capita vehicle miles traveled over
the period from 1960 to 1990. In 1960 each Iowan traveled about 4,000 miles per year on average.
By 1990, figure rose to about 8,000 miles per year.
Figure III.3: Iowa per capita vehicle miles traveled. Source: Ney et al. (1996).
The per capita vehicle miles traveled was able to increase without an increase in gasoline consumed
because of significant improvements in auto efficiency. In 1970 the U.S. auto fleet averaged about
12 miles per gallon (mpg), by 1986 it was about 16 mpg, and currently it is better than 25 mpg.
But as the demand for transport increases in Iowa, improvements in efficiency will have to keep
pace if our goal is to maintain a stable level of gasoline consumption. However, trends in factors
that strongly influence transport efficiency are pointing in the wrong direction, both in Iowa and
nationally. One problem is the changes that are occurring in the composition of the vehicle fleet.
Figure III.4 shows the trend in ownership according to four types of vehicles for the period from
1982 to 1995. Fuel economy depends to a large extent on the vehicle's weight. Each additional 500
pounds of weight reduces fuel economy by 5%-10%. The figure shows that ownership of small,
compact cars with the highest efficiencies is declining, while the share of large autos has remained
stable at around 40%. Multipurpose vehicles (vans and light trucks) are less efficient than the
conventional "family car." To cover the same distance as a compact auto consuming 10 gallons of
gasoline, a multipurpose auto requires about 14 gallons. It is precisely these kinds of autos that are
enjoying the largest increases in use. Thus, it is not surprising that for the first time since 1973, the
years 1992 and 1993 probably represented two consecutive years of declines in average miles per
gallon (Greene and Fan, 1995).

40
Figure III.4: Trends in the composition of Iowa's vehicle fleet. Source: IDOT (1994).
Another critical factor affecting efficiency is the level of vehicle occupancy. In 1972, the average
occupancy level in an automobile was estimated to be 2.07. By 1990, that had dropped to 1.62, a
decline of 21.7% in two decades. A similar pattern had occurred for light trucks, dropping from
2.02 to 1.72, for a decline of 14.9% (Greene and Fan, 1995). Table III.2 provides the efficiencies of
a variety of modes of transportation. The data show that when the occupancy level is 1.0, the
efficiency of autos (19.0 mpg per passenger) and trucks (13.7 mpg per passenger) pale in
comparison to other means of personal transport. It also shows that gains in vehicle efficiency can
be negated rather easily by decreases in occupancy level. Thus autos today are 21.7% less efficient
than they would be if occupancy rate had remained stable since the 1970s.
Another factor affecting fuel economy and emissions of pollutants is the age of Iowa's vehicle fleet.
As shown in Figure III.5, the number of old vehicles (1982 and older) is a relatively large
percentage of the total. These vehicles do not have efficient emission control devices for carbon
monoxide (CO), nitrogen oxides (NO), and volatile organic compounds (VOCs). Tune-ups are
important for good fuel economy, particularly for older cars. Studies suggest that as much as 50%
of emissions of VOCs and CO are produced by 10% of the cars which have inadequate or
inoperative emission controls. Reducing this percentage further has proven difficult.

41
Table III.2
Efficiencies of Different Modes of Passenger Transport (1990)
Mode of Transport (occupancy) Miles per Gallon Gasoline
per Passenger Bus (a) 34.6
Rail 29.2
Auto (2.07) 39.3
Auto (1.62) 30.8
Auto (1.00) 19.0
Light Truck (2.02) 27.7
Light Truck (1.72) 23.6
Light Truck (1.00) 13.7
Airplane (b) 20.0
High speed rail (b) 76.3
(a) Assumes average load for urban transit bus is 17.
(b) Assumes average load factor is 61% of full capacity.
Source: Adapted from Spiro and Stigliani (1996).
Figure III.5: Trends in the age of Iowa's vehicle fleet. Source: IDOT (1994).

42
B. Transportation and the environment
There is no question that the transportation sector has been vital to America's development as a
prosperous, powerful, and productive nation. But the winds of change are already blowing on the
horizon; the transportation system as we know it is no longer in compliance with the nation's
environmental goals as they are defined in the Clean Air Act Amendments of 1990, and in more
recent proposed tightening of air quality standards for ozone and particulates.
By model year 1998, 2% of the cars from the seven largest manufacturers sold in California must
attain the classification of Zero Emission Vehicles (ZEV). This in essence means electric vehicles.
New York and Massachusetts have recently passed similar requirements. This short deadline has
prompted unprecedented cooperation between auto makers who are starting to market electric cars
and trucks.
In Iowa, several individuals and organizations have been experimenting with electric vehicles. Five
Seasons Transportation in Cedar Rapids is operating electric-powered transit buses in the
downtown area. Waverly Light and Power has converted a pickup to run on electricity. The Ames
Laboratory at Iowa State University has converted a pickup to operate on an electric motor powered
by solar photovoltaic cells which are mounted on the topper. Individuals in Denison and West
Branch Iowa have converted vehicles to use electricity. In general, these converted vehicles can
travel at speeds over 45 mph for between 50 and 80 miles.
As shown in Figures III.6 a,b,c,d, the transportation sector is a major contributor of air pollution
nationally. It is responsible for about 67% of carbon monoxide (CO) emissions, 40% of nitric
oxide (NO) emissions, 35% of volatile organic compounds (VOC) emissions, and 25% of
emissions of particulates less than 10 microns in diameter (size fraction that lodges in the bronchi
of the lungs). These figures apply for the nation as a whole, but the contribution of pollution from
traffic is undoubtedly higher in congested urban areas. Unlike stationary sources of air pollution
(electric power plants, industry), which release their emissions from high smokestacks that carry
them long distances away from urban areas, automobiles and trucks emit pollutants at ground level,
where they concentrate and pose threats to human health. CO causes loss of consciousness at 250
ppm, and death at 750 ppm. New model cars using reformulated gasoline should lead to sharp
declines in concentrations of CO. Nitric oxide and VOCs are not direct air pollutants, in that they
rarely affect health directly. Rather, they are the main ingredients in the formation of
photochemical smog. Although most damage from smog results from the action of ozone and other
oxidants, these oxidants cannot build up without the combined action of NO and VOCs.
Controlling ozone and smog formation requires reducing emissions of these two chemicals.
Although catalytic converters do transform these pollutants to the harmless molecules N2, CO2, and
H2O, the conversion is incomplete, especially with poorly tuned cars, and poor air quality remains a
problem in urban areas of the U.S.

43
(a)
(b)
Figure III.6: Trends in emissions of pollutants by source in the United States, 1940-1989: (a) carbon monoxide;
(b) nitrogen oxides, 1940-1989. Source: U.S. EPA (1991).

44
(c)
(d)
Figure III.6: Trends in emissions of pollutants by source in the United States, 1940-1989: (c) volatile organic
compounds, 1940-1989; (d) particulates, 1985-1989. Source: U.S. EPA (1991).
45
The new ozone standard of 0.08 ppm and the particulate standard, which would require an annual
limit of 15 micrograms per cubic meter, have been proposed by the Clinton Administration. Ozone
and particulates have been packaged together because they cause similar health effects. EPA claims
that the new standards will protect 70 million people in the U.S., and prevent about 15,000
premature deaths each year. For children, EPA says the new standard will reduce respiratory
problems such as asthma attacks, and will result in 1 million fewer incidents of decreased lung
function each year (Chemical & Engineering News, 1997a). The administration's initiative has
been hailed by environmental and public health groups, and blasted by industry and some members
of congress. Critics have claimed that hundreds of cities and 400 counties in the U.S. would not be
able to comply, and would face economically crippling federal penalties. Arguments pro and con
will continue in the future, but over the long-term it seems likely that a new generation of motor
vehicle will prevail, running on alternative fuels, or by electricity from batteries or fuel cells.
Apart from concerns about smog, the transportation system is a large contributor to global
emissions of the greenhouse gas CO2. Combustion of ten gallons of gasoline releases about 190
pounds of CO2, and overall, the transportation sector is responsible for about 25% of the total
greenhouse gas emissions in the United States. At the Earth Summit in Rio de Janeiro in 1992, the
industrialized nations, including the U.S., pledged to reduce CO2 emissions levels to 1990 levels by
the year 2000. The European Union, comprised of 15 prosperous nations of western Europe, have
gone even farther, pledging to reduce emissions by 2010 to 15% lower than the 1990 level. The
United States has been widely criticized for "foot dragging" with regard to doing its share to reduce
greenhouse gas emissions. (Chemical & Engineering News, 1997b).
III.C. A role for alternative fuels?
In addition to environmental problems posed by vehicles using gasoline and diesel fuels, there is the
worry about over-reliance on foreign supplies of petroleum. According to the Energy Information
Administration of the U.S. Department of Energy (as reported in Romm and Curtis, 1996), the
reference scenario for ten years hence is that the Persian Gulf will control two-thirds of the world's
oil for export, earning revenues of $200 billion a year, while the U.S. imports nearly 60% of its oil
at an outflow cost of $100 billion. Given the politically instability around the Persian Gulf, such a
scenario would lead one to pause and evaluate the wisdom of our current energy policies.
Nationally, 70% of the oil imported into the U.S. is consumed in the transportation sector. In Iowa,
petroleum is the dominant transportation fuel, as well as representing 34% of the total energy used
in 1994.
Weaning ourselves away from imported petroleum provides opportunities to develop domestic
transportation fuels and can define a clear role for biomass and other renewable technologies.
Currently, the number of vehicles that run on alternative fuels in the U.S. is low but growing
rapidly. In 1995, an estimated 418,000 vehicles used alternative fuels in the U.S., with the
dominant share being 299,000 liquefied petroleum gas (LPG) vehicles. These vehicles represented
only 0.2% of all vehicles in use.

46
In terms of specific interests in Iowa, alternative fuels include high-blend ethanol (E-85), natural
gas, propane, and biodiesel. Since 1990, Iowa has experienced substantial increases in the number
of alternatively fueled vehicles in the state. By 1995 the number of vehicles fueled by E-85, natural
gas, propane, and biodiesel was 100, 145, 1862, and 27, respectively (IDNR, 1996b). One factor
contributing to the increase was legislation in 1991 requiring that 5% of new vehicle purchases in
1992, and 10% of new vehicles purchases starting in 1994 operate on alternative fuels. In 1991
Iowa became a member of the Governors' Ethanol Coalition which promotes the expanded
production and use of ethanol. The state also joined the National Ethanol Vehicle Coalition, whose
goal is to facilitate the development of a regional ethanol infrastructure to support the expanded use
of high-blend ethanol vehicles throughout the Midwest. The auto industry has also been
supportive; in 1995 General Motors announced its intent to make all of its Model Year 1997 S-
Series pickups flexible fueled to operate on either gasoline or E-85 fuel. MidAmerican Energy, the
Iowa Corn Promotion Board, and the IDNR are working toward developing an alternative fuel
"island." This island will enable fleet operators to fuel both natural gas or high-blend ethanol
vehicles at the same location. It also allows fleet managers to diversify their fleet vehicles at the
location. The following is a description of the status of alternative fuel developments in the state.
Ethanol-blended fuel (see also discussion on pp. 14-20). Iowa's goals in developing a high-blend
ethanol strategy are to: (1) capitalize on the availability of a renewable resource; (2) enhance air
quality by using an environmentally-compatible fuel; (3) reduce dependence on fossil fuels; (4)
generate economic activity; and (5) improve the rural economy (IDNR, 1996b).
In the near term, the most important renewable transportation fuel will probably be ethanol,
particularly for vehicles of less than 8,500 pounds and operating in the Midwest. Iowa is the largest
producer of corn and the second largest producer of ethanol in the nation. In 1994 Iowa harvested
1.9 billion bushels of corn, with more than 170 million bushels used for ethanol production.
An increasing number of vehicles in Iowa's state fleet are operating on E-85 fuel. In 1994 the state's
fleet covered 88,084 miles using E-85, with no major driving or maintenance problems. Although
corn is the current feedstock for ethanol production, emerging conversion technologies offer the
possibility for securing ethanol from other renewable energy crops such as switchgrass. All major
car manufacturers have sanctioned the use of ethanol blended fuel beginning with the model year
1979 and newer vehicles. In addition, both Ford and General Motors are now producing cars
tailored exclusively for use of E-85 fueled vehicles.
From an environmental viewpoint, ethanol-blended fuel has certain advantages. Unlike the
component it is replacing (BTX, see p.17) in the reformulated gasolines, it is non-toxic, reduces
emissions of carbon monoxide, and has low smog-forming potential. As noted earlier (see Table
I.2) the corn used as the feedstock for ethanol requires substantial energy inputs. To maximize the
benefit of ethanol fuel as a replacement for foreign oil, however, domestic sources of fuel should be
used in its production to the extent possible.

47
In developing an infrastructure to support the expansion in use of high-blend ethanol vehicles, the
IDNR is working in collaboration with the Iowa Corn Promotion Board and the Iowa Department
of Agriculture and Land Stewardship to construct commercial refueling sites in the state.
Natural gas. Using natural gas to power automotive transport has the advantage of being a
relatively clean fuel. Upon combustion, it emits virtually no carbon monoxide, and no VOC gases
that are strong smog inducers. Additionally, greenhouse gas emissions are expected to be between
5% and 25% less than emissions from gasoline-powered vehicles (Sperling, 1991). Moreover, the
domestic supply is large enough to last about 30-50 years if it continues to supply about 20% of
total U.S. energy needs. Another advantage is that a transport and storage network, comprised of a
1.2 million-mile underground pipeline system, is already in place. Refueling stations would have to
be built, and they are relatively expensive. Quick-fill stations would cost anywhere from $170,000
to $300,000, depending on the desired capacity. Slow-fill stations are 50% less costly, but they
require about one hour per one gallon fuel equivalent to fill a tank.
There are no serious technical problems to overcome in adopting a fuel system based on methane.
There are a limited number of dedicated natural gas vehicles available, although the majority today
are converted gasoline-fueled autos. There is generally a cost of approximately $2,000 to $3,000 to
convert a vehicle to operate on compressed natural gas. Chrysler offers the Voyager, Caravan and
B Van as dual fuel vehicles. The operating cost of using natural-gas driven vehicles is expected to
be comparable to that of gasoline driven autos.
As we saw in Section I, Iowa has untapped renewable sources of natural gas available from the
processing of hog manure, poplar trees, and switchgrass (see parts IB and IC). These sources could
provide the natural gas equivalent of 100 to 200 million gallons of gasoline equivalents per year,
corresponding to 7% to 14% of Iowa's transport demand. The cost of producing methane from
these sources, however, is high relative to the cost offered by conventional natural gas suppliers.
Propane. There are currently more than 10,000 public propane refueling stations in the U.S. and the
refueling time for propane vehicles is about the same as for gasoline vehicles. Vehicles can be
converted to operate on propane in much the same way as they can for natural gas. There are 75
propane refueling sites in Iowa, although none of these are for commercial use. One disadvantage
is that the fuel must be stored on-board in liquefied form in pressurized tanks.
Biodiesel. Biodiesel is made from a variety of feedstocks including soybean oil, rendered animal
fats, and used vegetable fats and oils. This diversity of sources allows feed stocks for the fuel to be
produced in every region of the U.S. The National Biodiesel Coalition was formed in 1992 to
develop fuel standards for biodiesel, determine its engine performance and emissions in various
blends with diesel fuels, and identify its requirements for commercial acceptance. Currently there
are no commercial refueling sites in Iowa, and the application of biodiesel products is in heavy duty
engines such as snowplows and school buses.

48
The Iowa Department of Transportation (IDOT), in collaboration with the Iowa Department of
Agriculture and Land Stewardship, is testing a diesel blend composed of 20% biodiesel and 80%
petroleum diesel at the Boone Iowa Maintenance Facility. Thus far, 11 heavy duty vehicles have
used the fuel for more than 3,300 hours, and more than 11,000 gallons of the fuel has been
consumed. The IDOT will continue to evaluate the performance of the fuel and may decide to
continue the project beyond the scheduled ending of this pilot phase.
III.D. Options for the future
With respect to policy options for the transportation sector in Iowa, it is important to take into
account the special circumstances for Iowa, which are different from those in more urbanized states.
While Iowa has the nation's highest labor participation rate, the population density is not high
enough to support public transit to any great extent. Almost three quarters of all work trips are in
single occupant vehicles. Iowans' vehicles are on average older and less fuel efficient than is the
case nationally.
Given this context, are there policies with regard to energy choices in Iowa that would increase the
efficiency of the transport sector, decrease air pollution, and save costs and/or promote local
economies? One issue we discussed earlier was the recent trend toward ownership of less efficient
heavy automobiles and light trucks (see Figure III.4). Under the current price structure for gasoline
and maintenance, it is not likely that buyers will be influenced strongly by considering the savings
accrued from using more fuel-efficient models. Today, the variable costs of operating an auto for
10,000 miles is $910 (in 1990 dollars). Most of this money goes to purchasing gasoline and oil,
maintenance, and the cost of tires. In 1975, the same variable costs were $1,566 (in 1990 dollars),
about 72% higher than the current cost (Bureau of Transportation Statistics, 1994). The cost of
gasoline in the U.S. is among the cheapest in the world, so that fuel efficiency is not a major
financial concern to most buyers, not only in Iowa, but on the national level as well.
One policy option for encouraging ownership of energy-efficient autos would be to impose a
significant tax increase on gasoline. There would be, however, some serious disadvantages to this
measure. One is a question of equity. Iowa's poorest citizens, who would least be able to afford to
buy new and well-maintained cars, would be saddled with the expense of higher priced gasoline
without the benefit of a car with superior fuel economy. Another equity problem arises between
rural and urban citizens. For rural Iowans, often the only means of transport is by automobile.
Urban citizens are somewhat buffered against high fuel costs because they can travel by alternative
means. There are buses, trains, and more possibilities for car pooling. Lastly, there is a border
issue. If the price of gasoline in Iowa were significantly higher than in neighboring states, Iowans
living near state borders would cross state lines and fill their tanks out-of-state. This would
undermine the entire rationale for the policy, and would likely cause economic hardship for gas
stations in the border regions.

49
Another important issue is the age of Iowa's automobile fleet (Figure III.5). A large percentage of
the cars are older than 10 years. These cars are less fuel-efficient than newer models, and they emit
far higher levels of pollution. As was noted above, studies have suggested that up to 50% of some
air pollutants is caused by 10% of the automobiles, those that are old, and poorly tuned. But
eventually, these old autos break down and have to be replaced, either by newer second-hand cars
or by new car purchases. An automobile manufactured today gets on average 12 more miles to the
gallon than does a car manufactured ten years ago. About 5% of Iowa's fleet is purchased new each
year, so within the next decade, as the autos from the early 1980s and older are taken out of service,
the average fuel efficiency should increase. Over the long-term however, if vehicle miles traveled
per year continue to increase in Iowa, and if (as indications now suggest) improvements in auto fuel
efficiencies stagnate in the 1990s, there will be an increase in fuel consumed, and an increase in
pollutant emitted.
As an alternative to applying fuel taxes as a stimulant for fuel economy, Johnston (1994) proposed
a revenue neutral rebate scheme for new car purchases. A specified average "miles per gallon"
(mpg) would be established as the baseline for a given year. Autos with fuel efficiencies above the
standard would have to pay a rebate, the charge for which would depend on how much above the
baseline mpg the car in question was rated. Conversely, for autos with fuel efficiencies below the
standard rating, the prospective buyer would receive a rebate. In this scheme, after accounting for
administrative costs, the rebate/fee system is intended to be revenue neutral. Table III.3 provides an
impression for how this system might work in practice.
As was illustrated in Table III.2, the level of occupancy in automobiles exerts a strong influence on
energy efficiency, and occupancy level is declining in Iowa and elsewhere. Reasons for this decline
are smaller family size, more "two-car" families, and perhaps other reasons. "Carpooling" was
taken up avidly in the 1970s as a means for lowering the price of fuel purchase, as well as
conserving the petroleum resource base. Carpooling declined in the 1980s and is even lower now.
Ferguson (1994) analyzed the impact of fuel price on carpooling activity. Comparing the activity
during the high-fuel-price era of the 1970s with the relatively low price era of the 1980s, he
estimated the elasticity of carpooling with respect to gasoline prices to be 0.261. This means that
for a doubling of the gasoline price, carpooling would increase by 26.1%. He further estimated
that gasoline prices would have to increase by 51¢ per gallon to offset the ongoing decline in
carpooling rate, and an increase of $1.31 per gallon to restore the carpooling rate of 1980 (19.7%)
by the year 2000.

50
Table III.3
Example of Rebates and Fees Applied to New Cars Based on Fuel Efficiencies
(for illustrative purposes only)
Auto
(MY 94)
Ave
(mpg)
Price
Fee
(Rebate)
Adjusted
Price
Change
%
Sales
(MY 93)
Revenue
Ford Taurus GL 23.5 $16,140 $507 $16,647 3.14% 409,751 $207,908,646
Honda Accord DX Sedan 26.5 $15,080 ($215) $14,865 -1.43% 329,751 ($70,962,070)
Ford Escort 3dr 29.0 $ 9,035 ($703) $ 8,332 -7.78% 263,622 ($185,369,109)
Chevrolet Lumina Coupe Euro 24.0 $16,875 $374 $17,249 2.22% 218,144 $81,678,281
Chevrolet Cavalier Coupe VL 28.0 $ 8,845 ($518) $ 8,327 -5.86% 212,374 ($110,101,768)
......
......
Net Revenue Generated from Fees $636,017,590
Gross Revenue Generated from Fees $2,127,195,475
Gross Revenue Paid Back to Rebates $1,491,177,886
% of Gross Revenue Paid Back 70%
Source: Johnston (1994)
There are other ways to encourage increased occupancy rates in autos. The Clean Air Act
Amendments of 1990 put regulatory constraints on areas that are out of attainment with federal air
pollution standards. In the non-attainment areas, employers with over 100 workers must introduce
and maintain programs to reduce the number of commute trips so as to increase vehicle occupancy
by 25%. Orski (1993) studied travel patterns in Los Angeles and estimated that only 25% of all
trips were to and from work, and only 40% of the work trips were to employers with more than 100
employees. He therefore calculated that the number of working trips would be reduced by only 2%-
3%. Thus, the plan for targeting large employers to increase vehicle occupancy among their
workers is not likely to reap large benefits.
Currently in Iowa, there are no non-attainment areas for ozone. There is, however, a pro-active
program administered by the Principal Financial Group in Des Moines. This group is concerned
about the financial and environmental effects of their employees commuting to and from work.
The company has a total of 840 employees that commute by bus. New employees visit with bus
line representatives to learn about commuting options, and the $22 monthly bus fee is subsidized by
the company. In addition, the Principal offers ride-share incentives through quarterly drawings for
cash prizes: $25 for two employees per vehicle; $35 for three per vehicle, and $50 for four per
vehicle.
In the long run, energy expended in the transportation sector will be most determined by external
factors. One is the goal of reducing U.S. dependence on foreign supplies of petroleum, which
51
currently supplies over 50% of our needs. Another factor is federal environmental policy, that will
increasingly restrict emissions of air pollutants generated from gasoline-burning vehicles,
particularly in congested, urban areas. A third factor, that is more speculative at the moment, would
be global agreements on restricting emissions of greenhouse gases. In this regard, Western Europe
has been pushing this agenda, which will culminate at a final international meeting to negotiate a
global climate treaty, now scheduled for December 1997 in Kyoto, Japan.
All these factors are likely to drive new technological innovations in transport vehicles; in fact, it is
fair to say such innovations already are in progress, not only in the U.S., but also among our
economic competitors in western Europe and Japan. The advent of electric cars, powered by a new
generation of storage batteries, or by advanced fuel cells may be only decades away from
realization. Also, alternate renewable fuels can play a major role in the new transportation
technologies. The fuel for these technologies may well be ethanol, biogas, or eventually hydrogen
produced by electrolytic splitting of water. Iowa is well-positioned to make contributions to this
effort with its untapped potential in alternative energy crops and wind power.
The Royal Dutch/Shell Group, the world's most profitable oil company and widely viewed in the
petroleum industry as a bench mark for strategic planning, envisions a very large role for renewable
fuels in the future. One of their planning scenarios imagines a time when fossil fuel use has begun
a slow, steady decline, and more than a third of the market for new electricity generation is supplied
from renewable sources, supported by a renewable industry with annual sales of $150 billion
(reported in Romm and Curtis, 1996).

52
References
Brown, L.R. (1995) Who Will Feed China, Worldwatch Environmental Alert Series, W.W. Norton
& Company, New York.
Chemical & Engineering News (1997a) Applause, Censure for Air Standards, July 7, 1997, p.31-
32.
Chemical & Engineering News (1997b) U.S. Takes a Beating for Its CO2 Stance, June 30, 1997,
p.10.
Cooper, J. (1995) Biomass Power for Rural Development-Project Summary, Chariton Valley RC &
D, Inc., Centerville, Iowa.
Cross, F.R., and F.M. Byers (1990) Current Issues in Food Production: a Perspective on Beef as a
Component in Diets for Americans, Texas A&M University, College Station, Texas, and National
Cattlemen’s Association, Englewood, Colorado.
Dahlquist Associates, Inc. (1996) Choices for Iowa’s Environment: Iowa Town Meetings Report
(Phase I), final report to the Iowa Comparative Risk Project, Energy Bureau, Iowa Department of
Natural Resources, Des Moines.
Danish Wind Turbine Manufacturers Association (1997) 21 Frequently Asked Questions About
Wind Energy, http://www.windpower.dk/faqs.htm#anchor.
Environmental Working Group (1996) Pouring it On: Executive Summary, http://www.ewg.org/
pub/home/Reports/Nitrate/NitrateExec.html.
Ferguson, E. (1994) Recent nationwide declines in carpooling. In: Nationwide Personal
Transportation Survey: Travel Mode Special Reports, U.S. Department of Transportation, Federal
Highway Administration, report no. FHWA--PL-94-019, Washington, D.C.
Gipe, P. (1995) Tilting at Windmills: Public Opinion Toward Wind Energy, http://www.igc.apc.
org/awea/faq/aesthetics.html.
Greene, D.L., and Y. Fan (1995) Transportation Energy Intensity Trends, 1972-1992, Paper
presented at the 74th Annual Meeting of the Transportation Research Board, Transportation
Research Board, Washington, D.C.
Hagler-Bailly Consultants (1995) Iowa Comprehensive Energy Plan (draft materials), Boston,
Massachusetts.
53
Hallberg, G.R. (1989) Nitrate in groundwater in the United States. In: Nitrogen Management and
Ground Water Protection, R.F. Follet, ed., Elsevier, Amsterdam, The Netherlands.
IDNR (Iowa Department of Natural Resources) (1996a) Iowa Energy Data, Addendum to the 1996
Energy Plan Update, Energy Bureau, Iowa Department of Natural Resources, Des Moines.
IDNR (Iowa Department of Natural Resources) (1996b) 1996 Energy Plan Update, Energy Bureau,
Iowa Department of Natural Resources, Des Moines.
IDNR (Iowa Department of Natural Resources) (1994) Iowa Biomass Energy Plan, Energy Bureau,
Iowa Department of Natural Resources, Des Moines.
IDOT (Iowa Department of Transportation) (1994) 1994 Vehicle Fleet Summary, Des Moines.
IPCC (Intergovernmental Panel on Climate Change) (1990) Climate Change, the IPCC Scientific
Assessment, sponsored by the World Meteorological Organization, and the United Nations
Environment Programme, Cambridge University Press, Cambridge, U.K.
Johnston, B. (1994), A Pricing Alternative to Achieve a More Efficient and Effective CAFE
Standard, Graduate Research Papers, Public Policy Center University of Iowa, Iowa City.
Kramer, R.E., G.M. Lutz, and J.W. Bronsink (1997) Cedar Falls Utilities Customer Interest in
Using Wind-Generated Electricity, report for Cedar Falls Utilities, Center for Social and Behavioral
Research, University of Northern Iowa, Cedar Falls Iowa.
Kuhn Communications (1997) Choices for Iowa’s Environment: Town Meetings-Phase II, final
report to the Iowa Comparative Risk Project, Energy Bureau, Iowa Department of Natural
Resources, Des Moines.
Lawrence, J.D., T. Bass, and D. Otto (1997) Pork Industry Economics: Trends, Impacts,
Competitiveness (citation not complete).
National Research Council (1993) Soil and Water Quality, an Agenda for Agriculture, National
Academy Press, Washington, D.C.
Ney, R.A., J.L. Schnoor, N.S. Foster, and D.J. Forkenbrock (1996) Iowa Greenhouse Gas Action
Plan, report for Energy Bureau, Iowa Department of Natural Resources, Des Moines.
C.K. Orski (1993) Employee Trip Reduction Program--an Evaluation, Transportation Quarterly,
47(3).
Palmer, J. (1996) Wind Power Scores Well in GMP Public Opinion Survey, Wind Energy Weekly,
#718, October, 14, 1996.

54
Pimentel, D. (1992) Environmental and Economic Benefits of Sustainable Agriculture. In: Neue
Partnerschaften in der Marktwirtschaft oder Ökologische Selbstzerstörung, sponsored by der
Bundesministerium für Land- und Forstwirtschaft, der Österreichischen Gesellschaft für
Biotechnolgie, and, der Österreichischen Vereinigung für Agrarwissenschaftliche Forschung,
Vienna, Austria.
Romm, J.J., and C.B. Curtis (1996) Mideast Oil Forever? The Atlantic Monthly, April, 1996.
Sperling, D. (1991) An incentive based transition to alternative transportation fuels. In: Energy and
the Environment in the 21st Century, J.W. Tester, D.O. Wood, and N.A. Ferrari (eds.), the MIT
Press, Cambridge, Massachusetts.
Spiro, T.G., and W.M. Stigliani (1996) Chemistry of the Environment, Prentice Hall, Upper Saddle
River, New Jersey.
Technical Committee on Ecological Systems (1997) Iowa Comparative Risk Project: Ecological
Technical Assessment, report to Energy Bureau, Iowa Department of Natural Resources, Des
Moines.
Technical Committee on Human Health (1997) Iowa Comparative Risk Project: Human Health
Technical Assessment, report to Energy Bureau, Iowa Department of Natural Resources, Des
Moines.
The Sustainable Energy Coalition (1994) Sustainable Energy Budget Coalition Survey Reveals
Strong Bipartisan Support for Continued Federal Funding of Energy Efficient and Renewable
Energy Programs Offet by Cuts in Nuclear Power, Coal, and Oil, http://www.igc.apc.org/awea/
faq/survey1html.
U.S. EPA (Environmental Protection Agency) (1991) National Air Pollutant Emissions Estimates:
1940-1989, report no. EPA-450/4-91-004), Research Triangle Park, North Carolina, Office of Air
Quality.
Van Dyne, D.L., and C.B. Gilbertson (1978) Estimating U.S. Livestock and Poultry Manure
Production, Report ESCS-12, U.S. Department of Agriculture, Economics, Statistics and
Cooperative Service, Washington, D.C.