Embed Size (px)
Citation preview

Presented at the:
Second Symposium
Innovations in Freight Demand Modeling & Data Improvement
SHRP2 Strategic Highway Research Program
Washington, D.C. USA
October 21-22, 2013
Iowa DOT with Parsons Brinckerhoff
Rail Freight Commodity Models:
A First Generation Effort in Iowa
Outline
2
Evolution of Iowa DOT Activities Statewide Traffic Model
Interest in Truck & Rail Commodity Models
Rail Commodity Architecture
Confidential Rail Waybill in Iowa
FAF3 to County Processing of Commodity Flows
Rail Freight Modeling
Applicability to States, MPOs and Decision Makers
Evolution of
Iowa DOT
Activities
3
History of Statewide Modeling in Iowa
4
First Generation Traffic Model
Developed 2005-2007
Focused on Auto and Truck Traffic
Applied for Planning, Engineering & Safety Studies
Resource for MPO and RPA (Regional Planning Affiliation) Modeling (the DOT serves nine MPOs)
Known as iTRAM
Second Generation Statewide Model
In progress 2012-2014
Provides an update to the 2007 traffic model
Begins an emphasis on freight and commodity movements
5
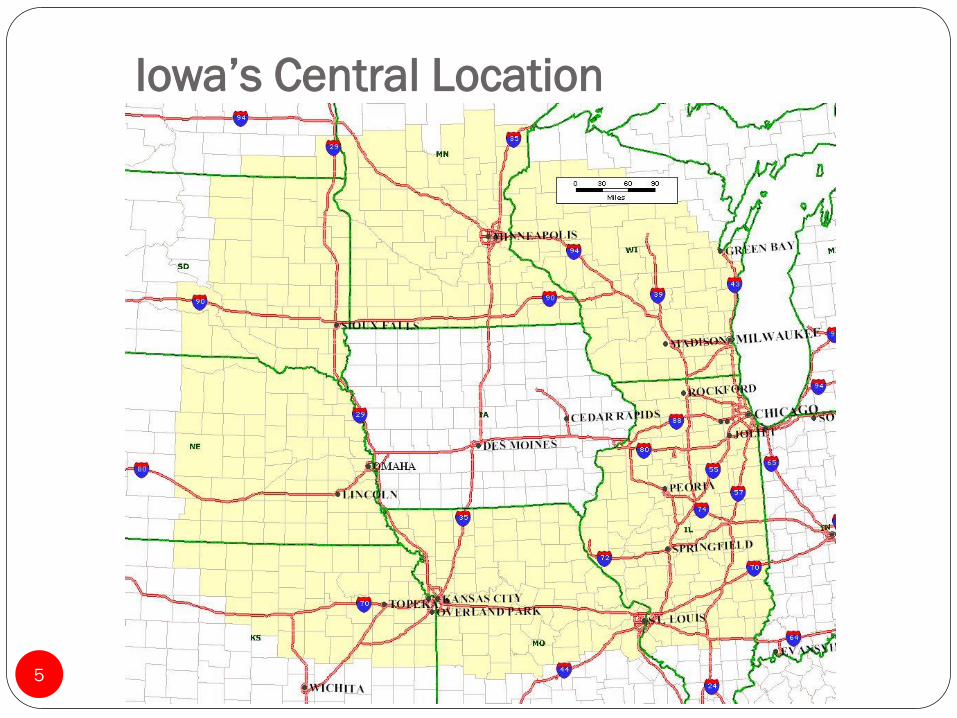
Iowa’s Central Location
6
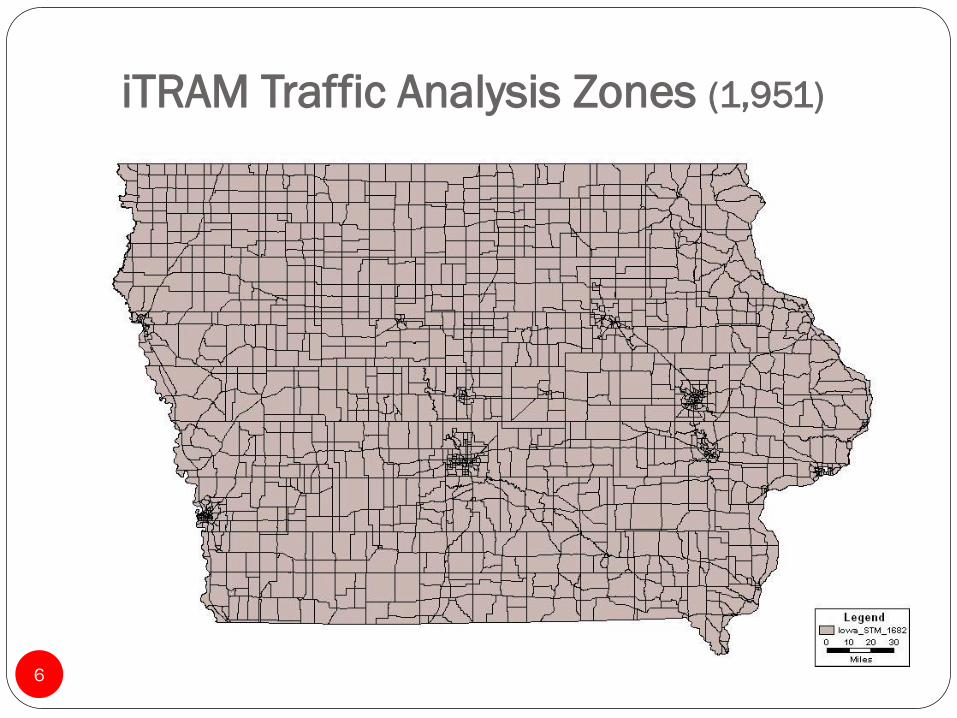
iTRAM Traffic Analysis Zones (1,951)
Interest in Commodity Flow Issues
7
Need for Commodity Flow Models
Estimate Freight Rail Capacity Needs
Serve Passenger Rail Models
Use in Business Decision Making
New Warehouse, Distribution Center Location
Short Line Railroad Planning
Rail Ownership Changes
Study Partners
Iowa DOT: Offices of Systems Planning and Rail
Federal Railroad Administration
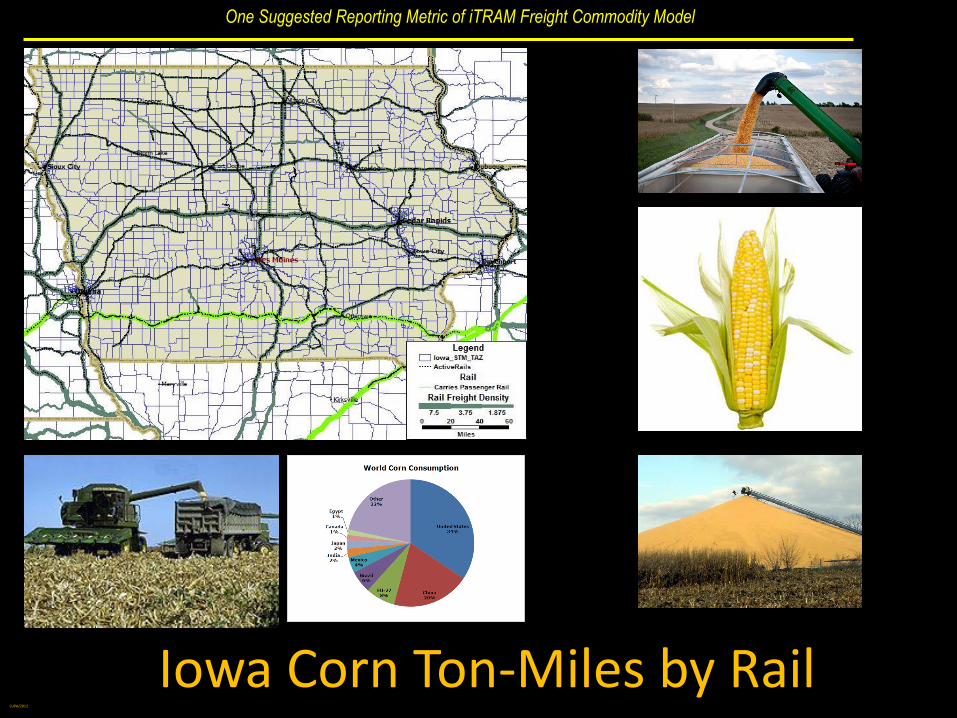
Iowa Corn Ton-Miles by Rail LUPA/2012
One Suggested Reporting Metric of iTRAM Freight Commodity Model
iTRAM
Freight
Commodity
Architecture
9
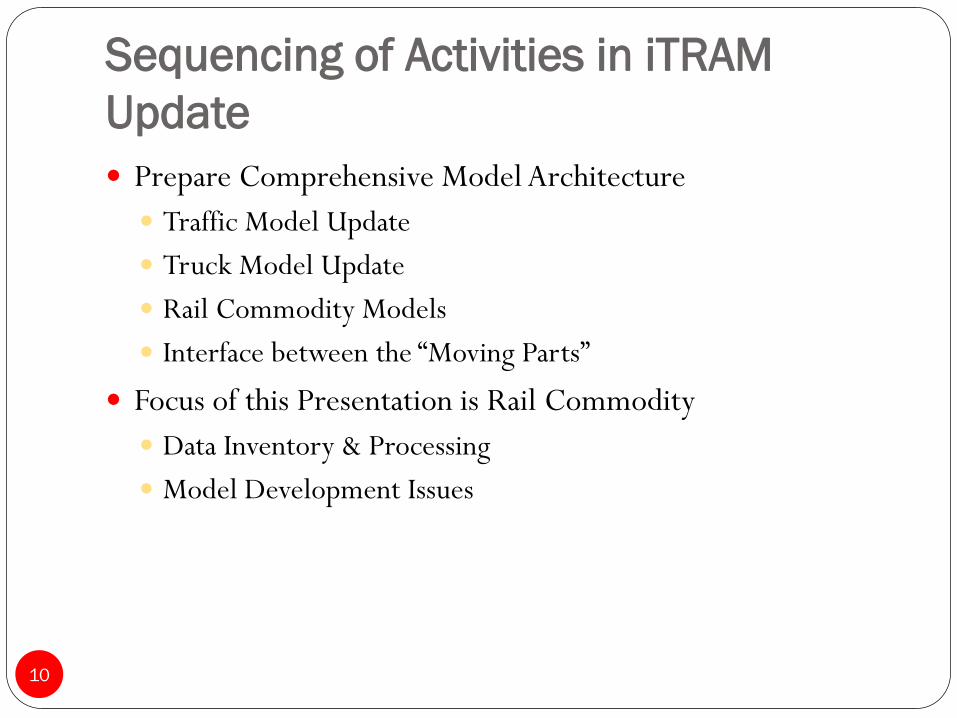
Sequencing of Activities in iTRAM
Update
10
Prepare Comprehensive Model Architecture
Traffic Model Update
Truck Model Update
Rail Commodity Models
Interface between the “Moving Parts”
Focus of this Presentation is Rail Commodity
Data Inventory & Processing
Model Development Issues
11
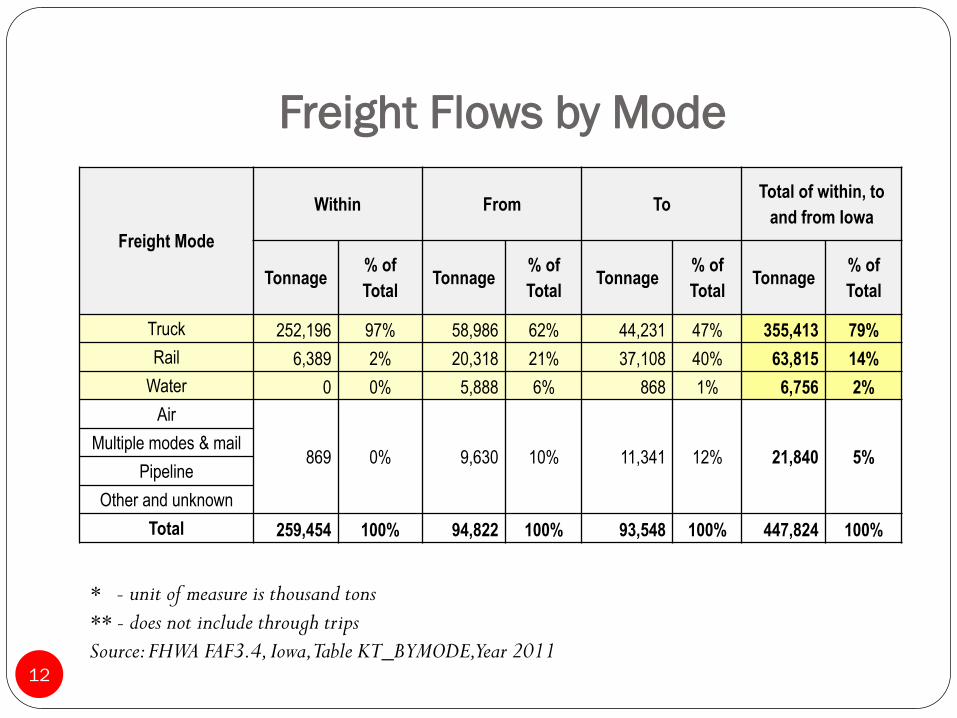
Freight Flows by Mode
12
* - unit of measure is thousand tons
** - does not include through trips
Source: FHWA FAF3.4, Iowa, Table KT_BYMODE, Year 2011
Freight Mode
Within From To Total of within, to
and from Iowa
Tonnage % of
Total Tonnage
% of
Total Tonnage
% of
Total Tonnage
% of
Total
Truck 252,196 97% 58,986 62% 44,231 47% 355,413 79%
Rail 6,389 2% 20,318 21% 37,108 40% 63,815 14%
Water 0 0% 5,888 6% 868 1% 6,756 2%
Air
869 0% 9,630 10% 11,341 12% 21,840 5% Multiple modes & mail
Pipeline
Other and unknown
Total 259,454 100% 94,822 100% 93,548 100% 447,824 100%
Architecture Highlights (Rail)
13
Rail Models produce both Rail and Truck Demand
Network Rail Assignment Deliverables Include:
Freight Rail Assignment
Truck Trip Tables (to and from rail heads)
Approach must be Iowa-centric
Investigate observed rail commodity flows
Address agriculture goods movements, including a variety of
exports and import of fertilizer and other.
Develop future flows of rail commodities
Confidential
Rail
Waybill
14
STB Confidential Rail Waybill
15
Review of the Surface Transportation Board (STB) Carload Waybill Sample Complete file (900 character) compared to the public use version
(247 character) Restricted distribution but used by many states for state
transportation plans
Tabulations by origin-destination and Surface Transportation Commodity Code (STCC) From/To Iowa Through Movements
Rail Network Assignment of Waybill Data Oak Ridge National Laboratory (ORNL) rail network County to county flows
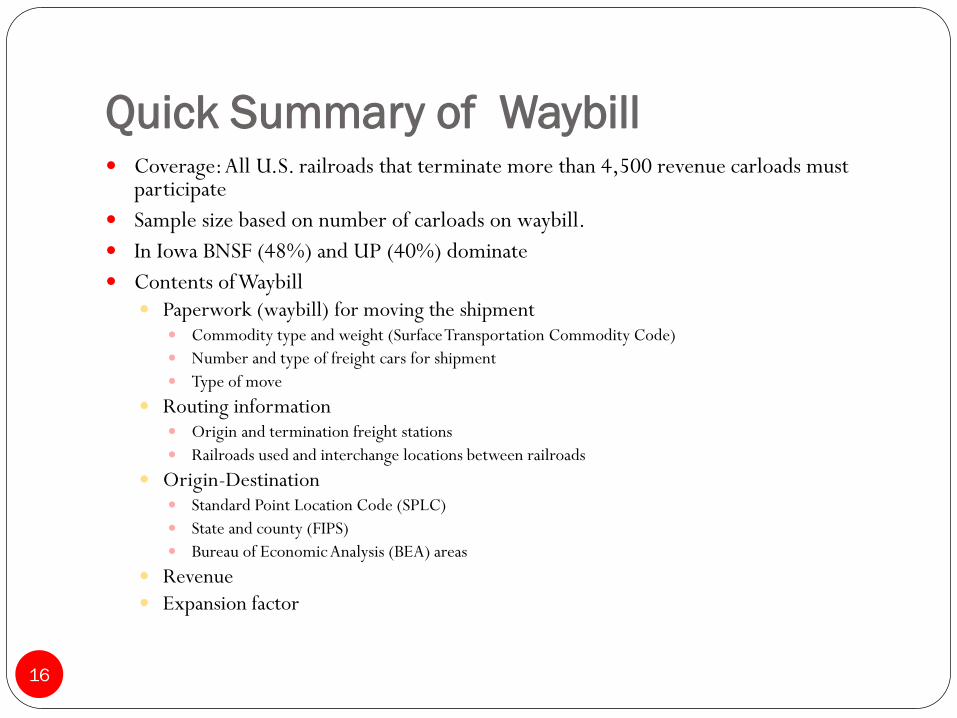
Quick Summary of Waybill
16
Coverage: All U.S. railroads that terminate more than 4,500 revenue carloads must participate
Sample size based on number of carloads on waybill.
In Iowa BNSF (48%) and UP (40%) dominate
Contents of Waybill Paperwork (waybill) for moving the shipment
Commodity type and weight (Surface Transportation Commodity Code)
Number and type of freight cars for shipment
Type of move
Routing information Origin and termination freight stations
Railroads used and interchange locations between railroads
Origin-Destination Standard Point Location Code (SPLC)
State and county (FIPS)
Bureau of Economic Analysis (BEA) areas
Revenue
Expansion factor
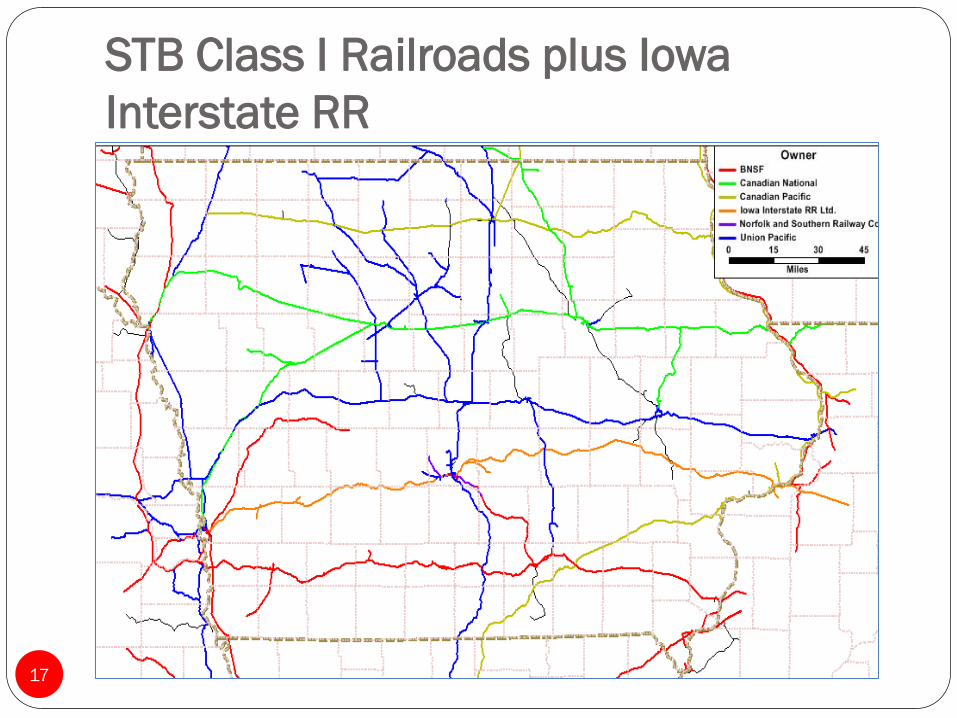
STB Class I Railroads plus Iowa
Interstate RR
17
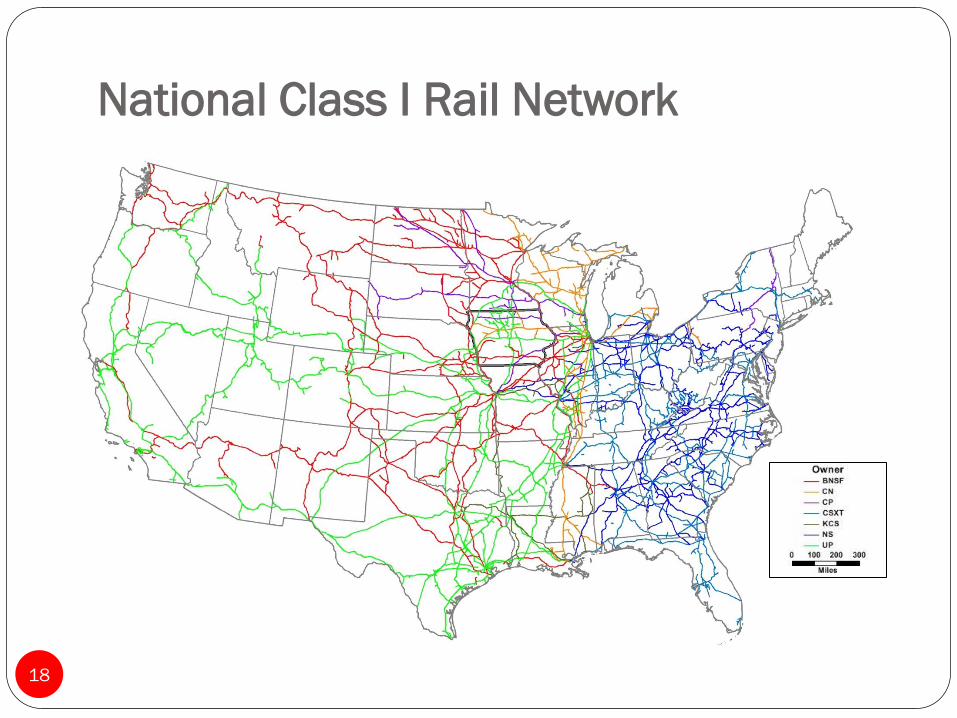
National Class I Rail Network
18
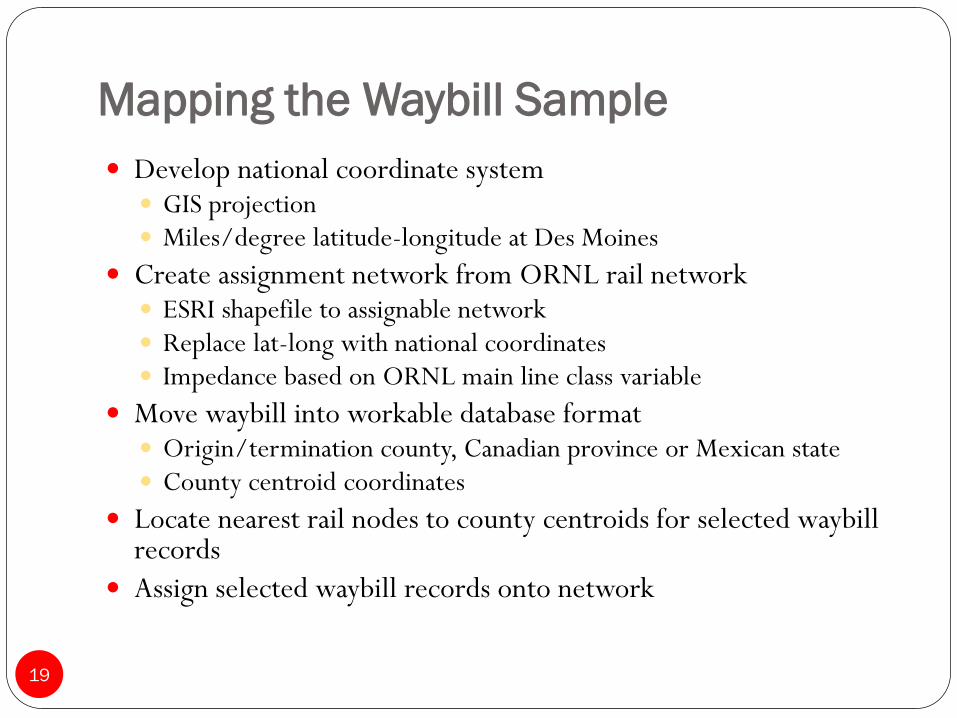
Mapping the Waybill Sample
19
Develop national coordinate system GIS projection Miles/degree latitude-longitude at Des Moines
Create assignment network from ORNL rail network ESRI shapefile to assignable network Replace lat-long with national coordinates Impedance based on ORNL main line class variable
Move waybill into workable database format Origin/termination county, Canadian province or Mexican state County centroid coordinates
Locate nearest rail nodes to county centroids for selected waybill records
Assign selected waybill records onto network
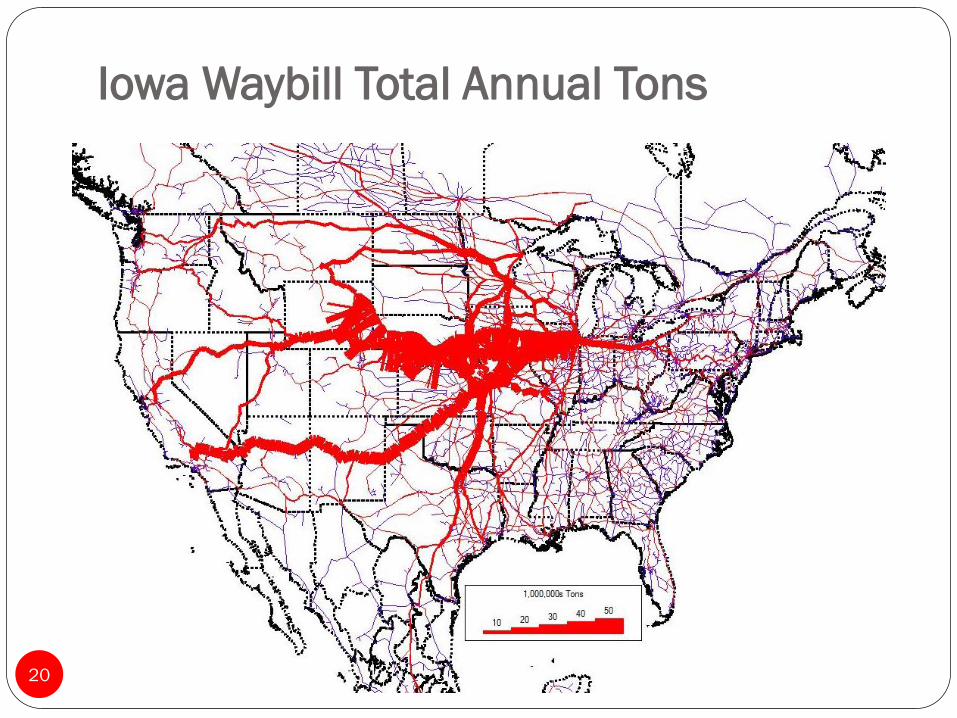
Iowa Waybill Total Annual Tons
20
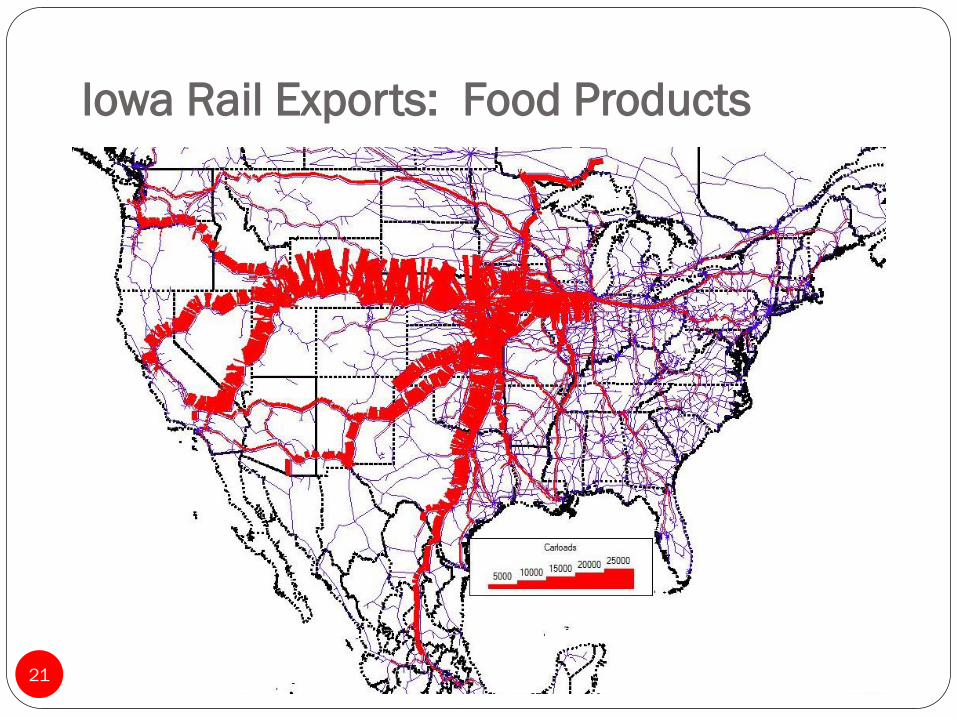
Iowa Rail Exports: Food Products
21
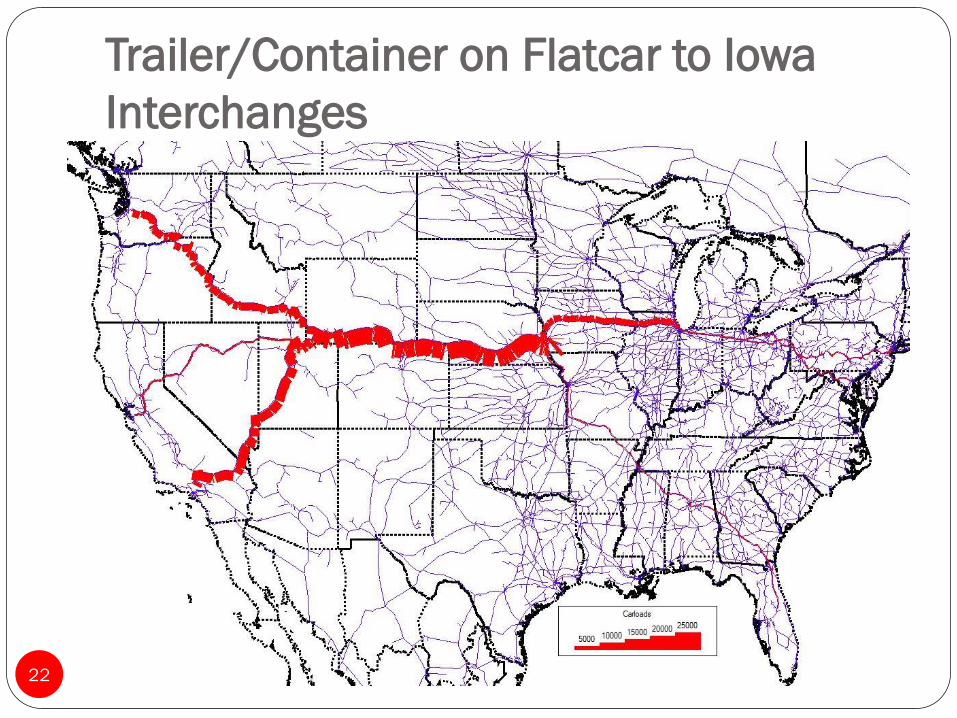
Trailer/Container on Flatcar to Iowa
Interchanges
22
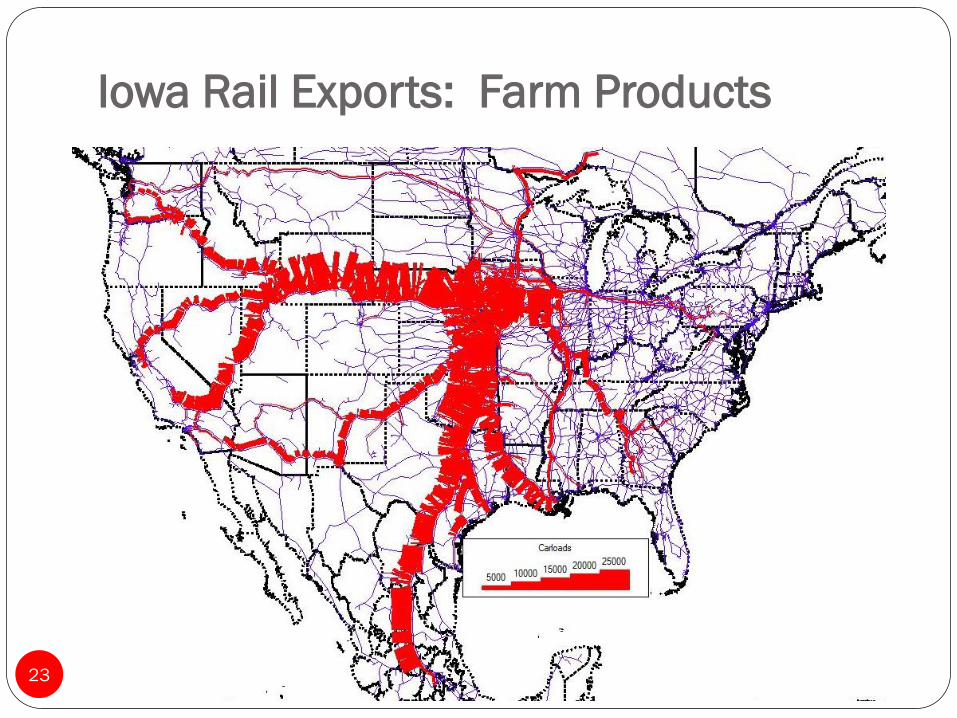
Iowa Rail Exports: Farm Products
23
Next Steps
24
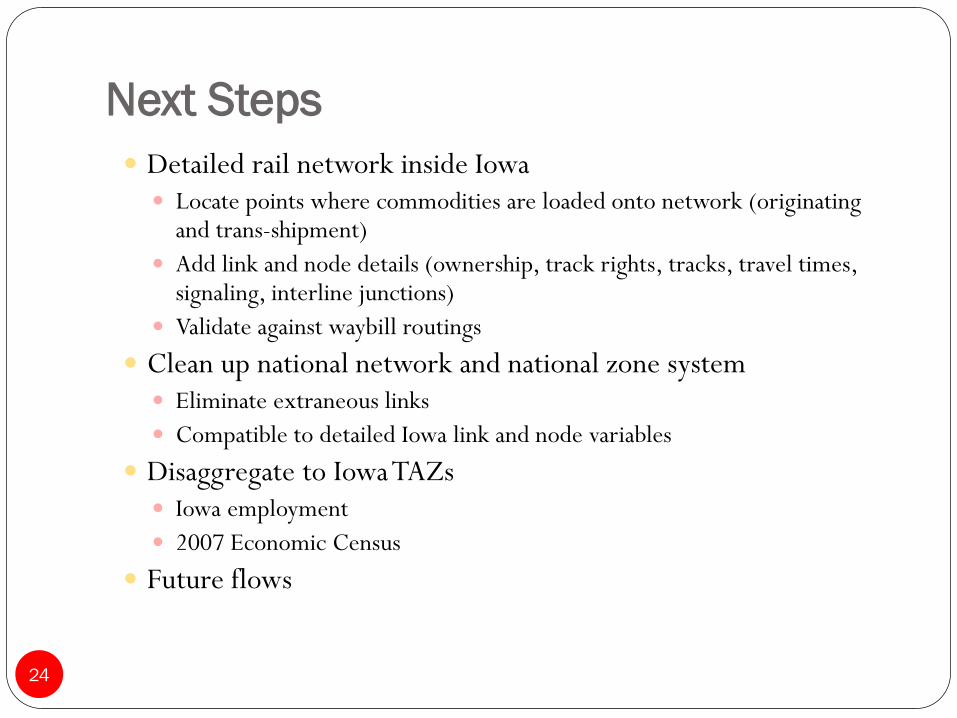
Detailed rail network inside Iowa Locate points where commodities are loaded onto network (originating
and trans-shipment)
Add link and node details (ownership, track rights, tracks, travel times, signaling, interline junctions)
Validate against waybill routings
Clean up national network and national zone system Eliminate extraneous links
Compatible to detailed Iowa link and node variables
Disaggregate to Iowa TAZs Iowa employment
2007 Economic Census
Future flows

FAF3
Processing
to
Counties
25
FAF3 Disaggregation to Counties
26
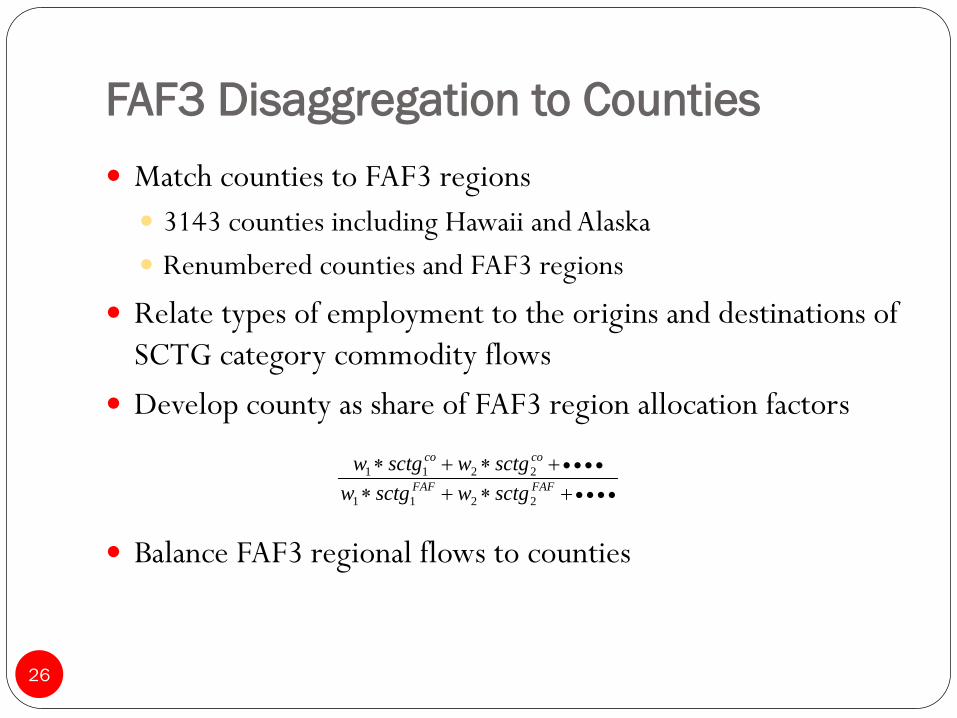
Match counties to FAF3 regions
3143 counties including Hawaii and Alaska
Renumbered counties and FAF3 regions
Relate types of employment to the origins and destinations of
SCTG category commodity flows
Develop county as share of FAF3 region allocation factors
Balance FAF3 regional flows to counties
FAFFAF
coco
sctgwsctgw
sctgwsctgw
2211
2211

Base County Employment Data
27
Bureau of Economic Analysis
Largely developed from state unemployment insurance reporting
(form ES-202)
Employment not covered by unemployment insurance added by BEA
Reported by two digit North American Industry Classification System
(NAICS) at county level
County Business Patterns
Derived from census business establishment surveys and federal
administration records
Subject to data suppression when individual firms can be identified
Reported by six digit NAICS but data suppression increases with
added detail
Commodity-Employment Regressions:
Fuel Oils (SCTG 18)
28
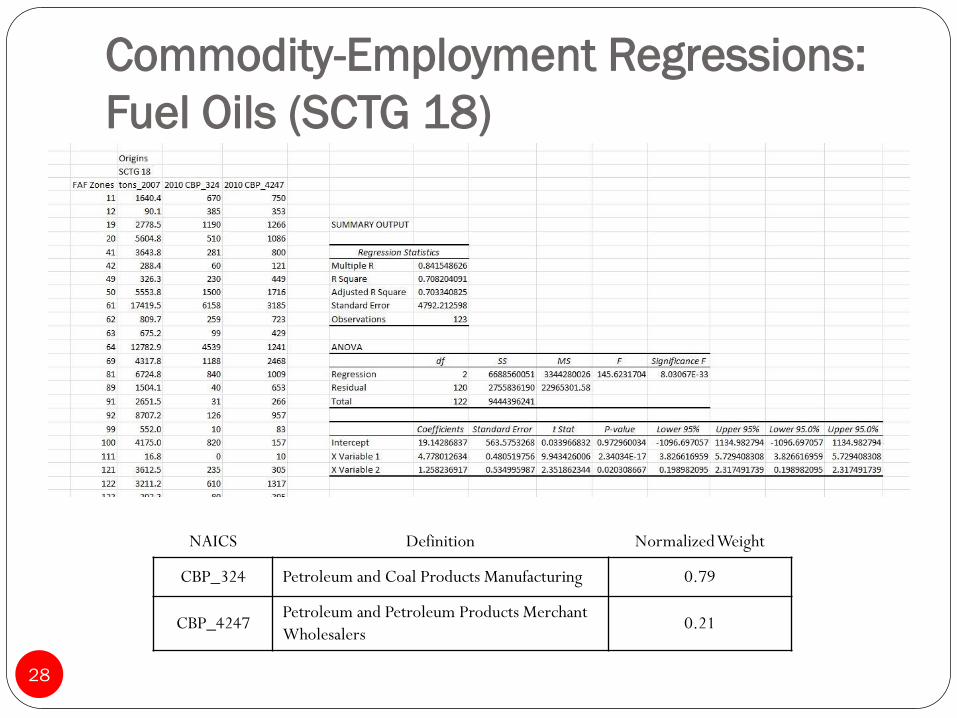
NAICS Definition Normalized Weight
CBP_324 Petroleum and Coal Products Manufacturing 0.79
CBP_4247 Petroleum and Petroleum Products Merchant
Wholesalers 0.21
Three Sets of Commodity Flow Tables
29
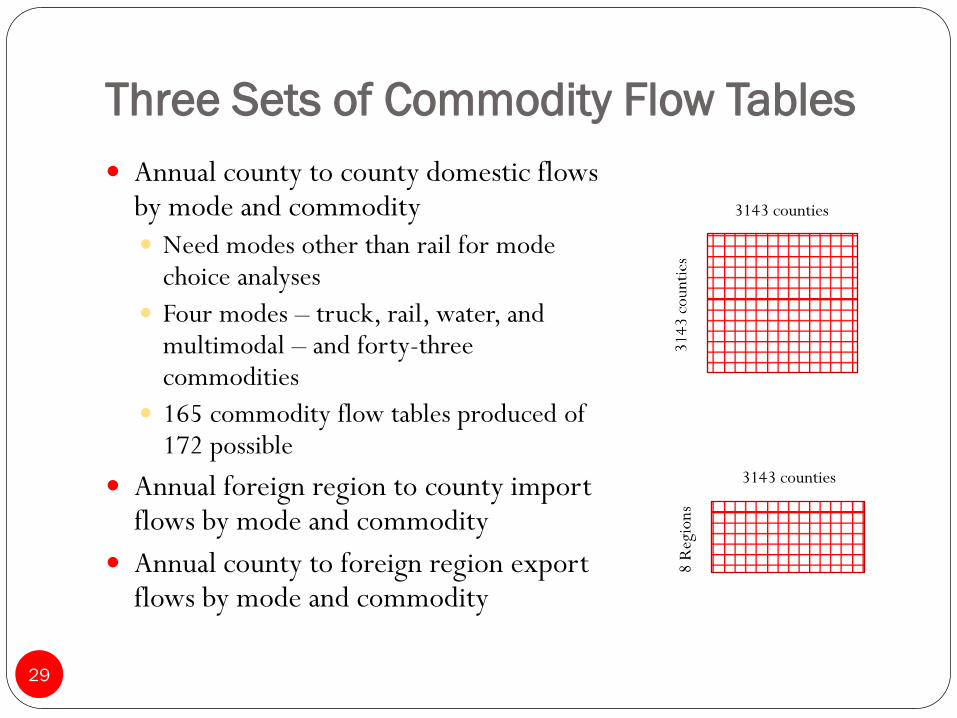
Annual county to county domestic flows by mode and commodity
Need modes other than rail for mode choice analyses
Four modes – truck, rail, water, and multimodal – and forty-three commodities
165 commodity flow tables produced of 172 possible
Annual foreign region to county import flows by mode and commodity
Annual county to foreign region export flows by mode and commodity
3143 counties
3143 counties
Rail
Freight
Modeling
30
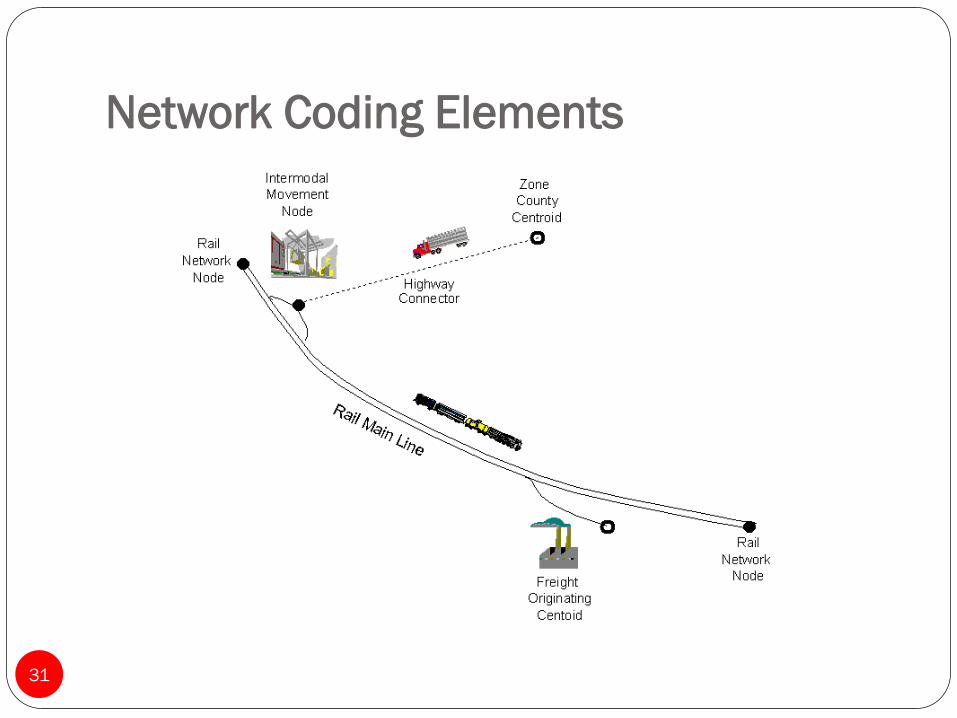
Network Coding Elements
31

Model Components: Base Year and
Future Commodity Flow Tables
32
Annual base year rail commodity flow tables built from Iowa Carload Waybill Sample
Two digit STCC commodity code (max of 38 commodities)
Compare against FAF3
BEA economic areas, counties, points of entry, major generators within Iowa with rail access
Four sets of tables defined by movement
Base and future year commodity flow tables (all modes) built from FAF3
Base: reallocated from FAF3 zones to BEA areas/counties, etc.
Future: IPF base tables using FAF3 growth estimates
Model Components: Commodity Mode
Shares
33
Estimation data set by commodity
Observed flows
Carload Waybill Sample
FAF3 commodity flow tables
Cost to ship commodity by mode per ton per mile
Network skimmed and scaled distances
Application within state
New commodity source or consumption location
Added or removed intermodal facility
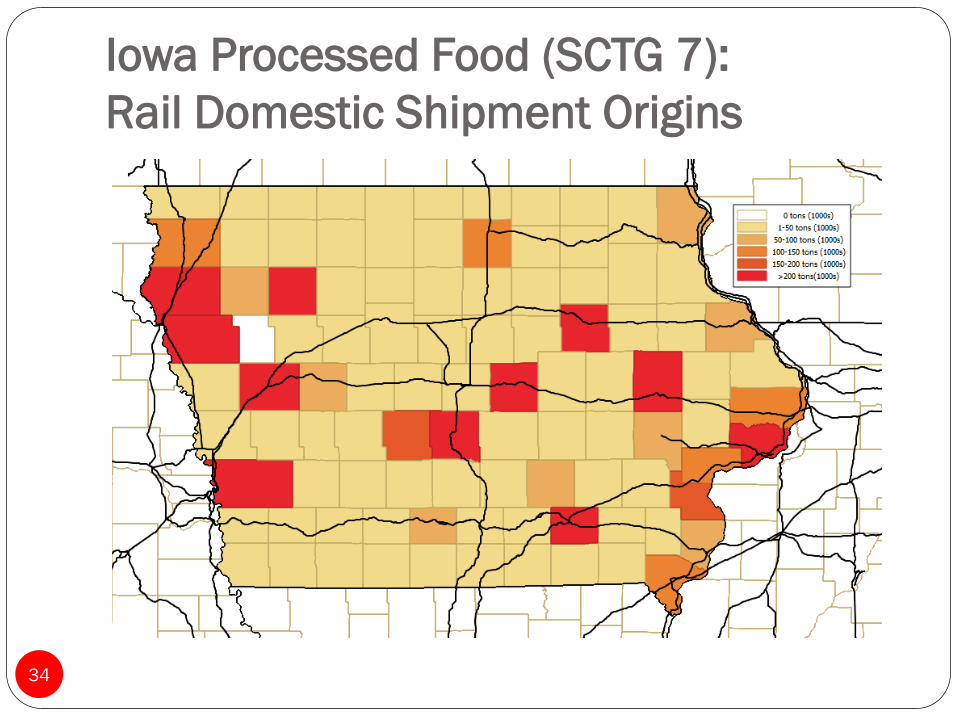
Iowa Processed Food (SCTG 7):
Rail Domestic Shipment Origins
34
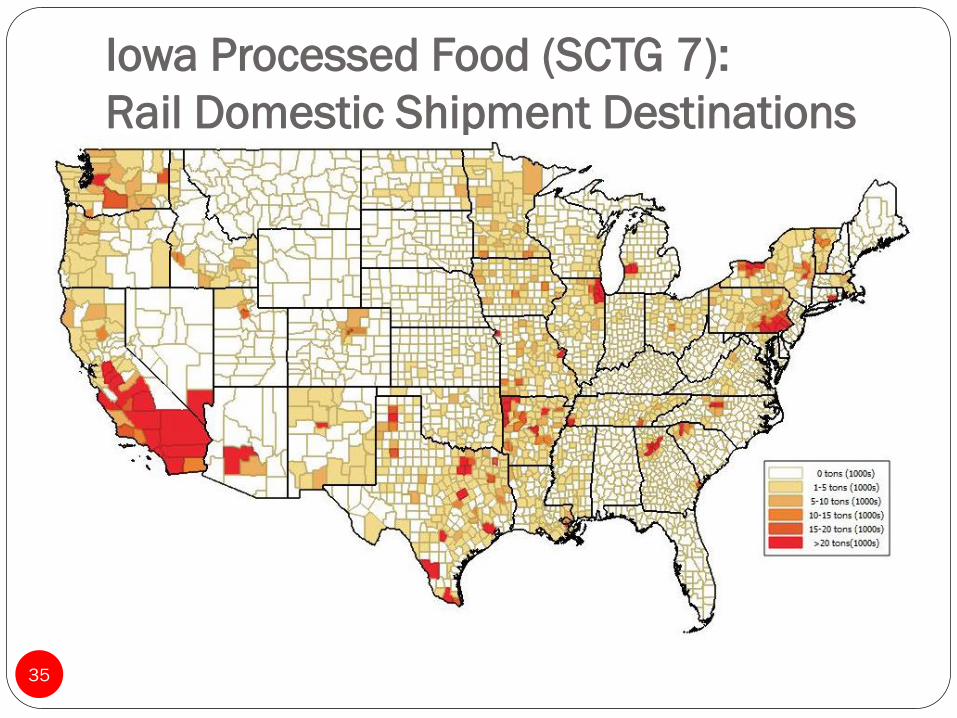
Iowa Processed Food (SCTG 7):
Rail Domestic Shipment Destinations
35
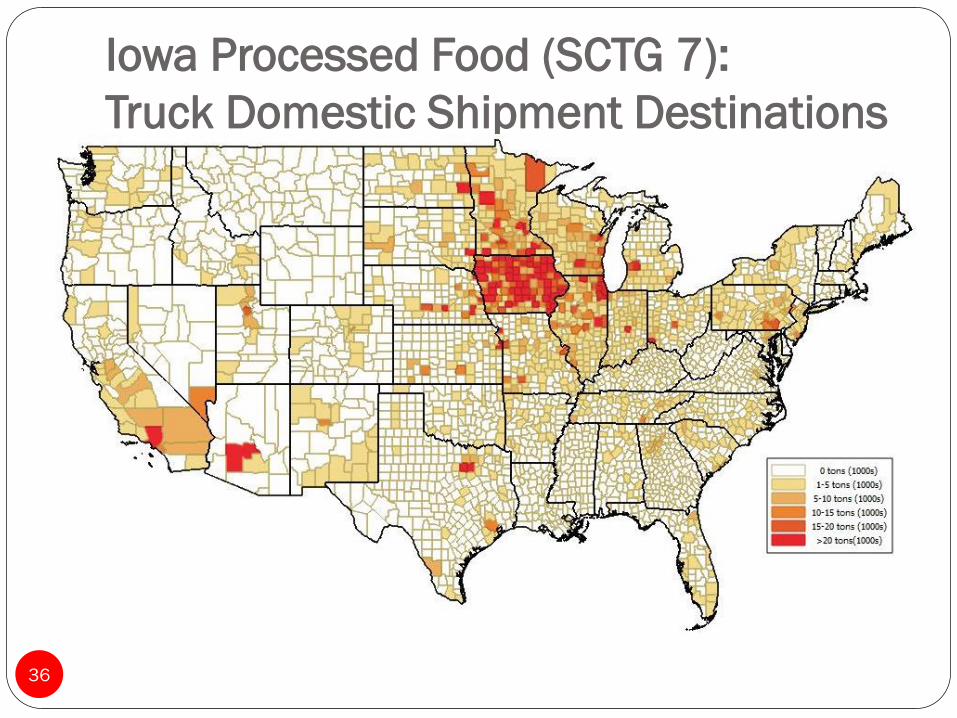
Iowa Processed Food (SCTG 7):
Truck Domestic Shipment Destinations
36
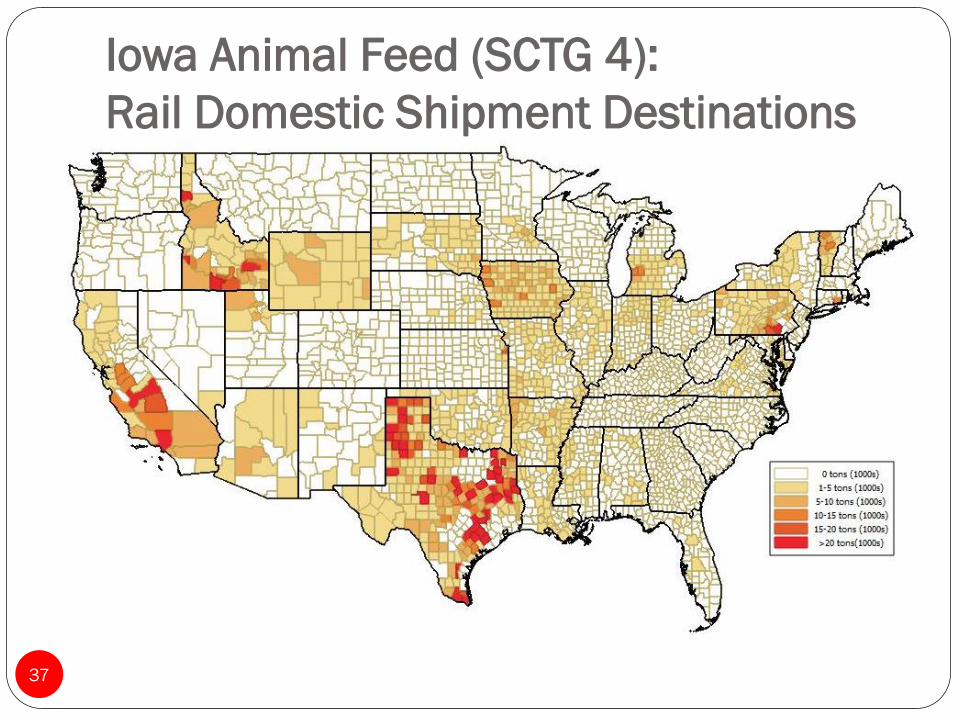
Iowa Animal Feed (SCTG 4):
Rail Domestic Shipment Destinations
37
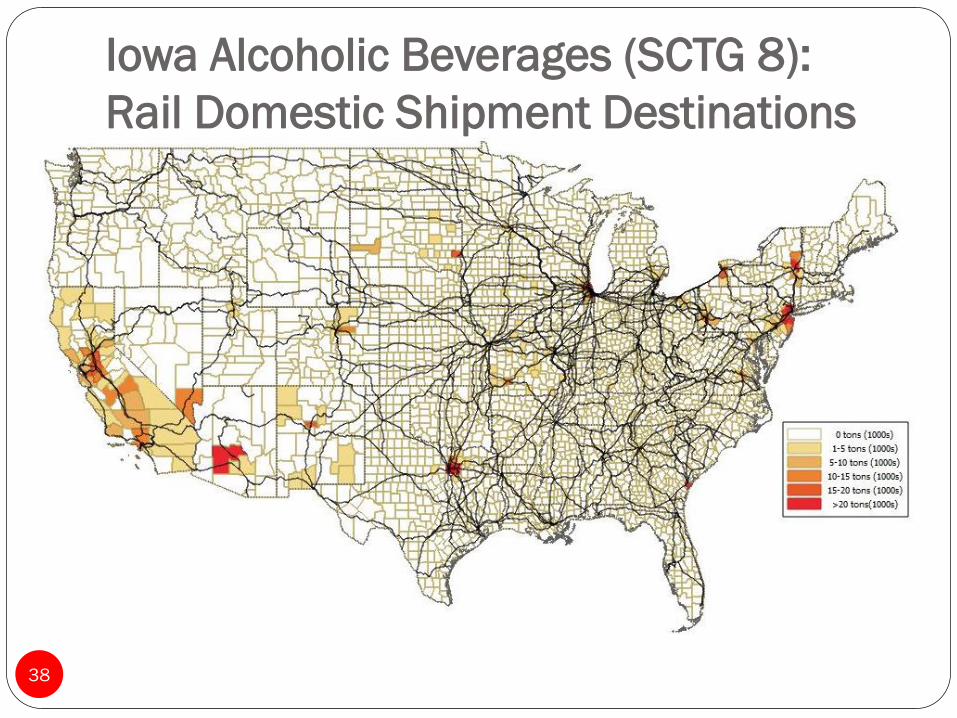
Iowa Alcoholic Beverages (SCTG 8):
Rail Domestic Shipment Destinations
38
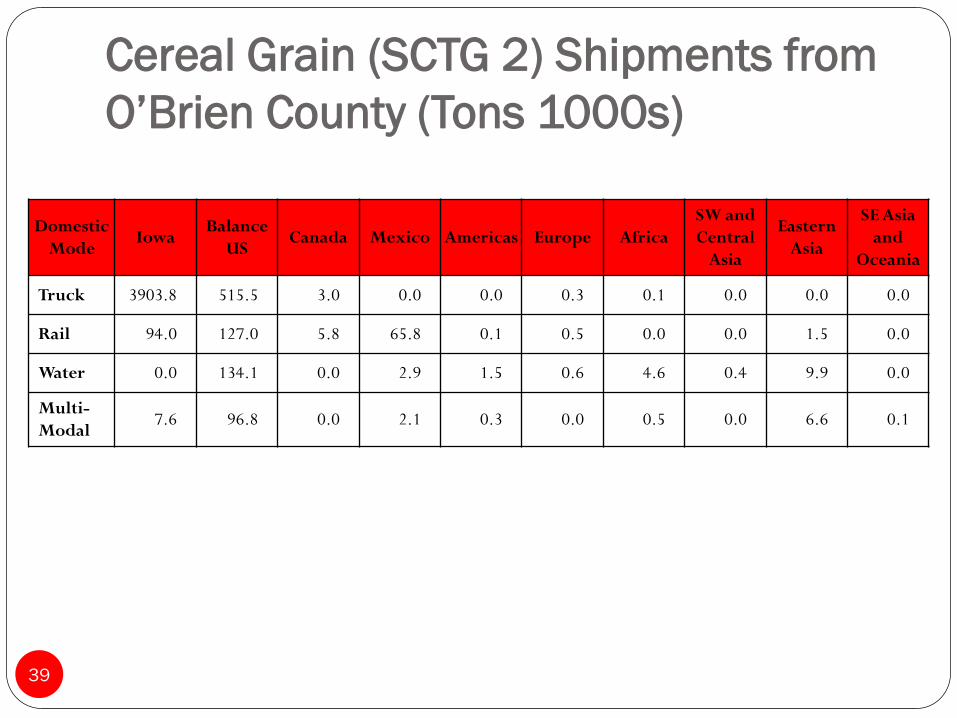
Cereal Grain (SCTG 2) Shipments from
O’Brien County (Tons 1000s)
39
Domestic
Mode Iowa
Balance
US Canada Mexico Americas Europe Africa
SW and
Central
Asia
Eastern
Asia
SE Asia
and
Oceania
Truck 3903.8 515.5 3.0 0.0 0.0 0.3 0.1 0.0 0.0 0.0
Rail 94.0 127.0 5.8 65.8 0.1 0.5 0.0 0.0 1.5 0.0
Water 0.0 134.1 0.0 2.9 1.5 0.6 4.6 0.4 9.9 0.0
Multi-
Modal 7.6 96.8 0.0 2.1 0.3 0.0 0.5 0.0 6.6 0.1
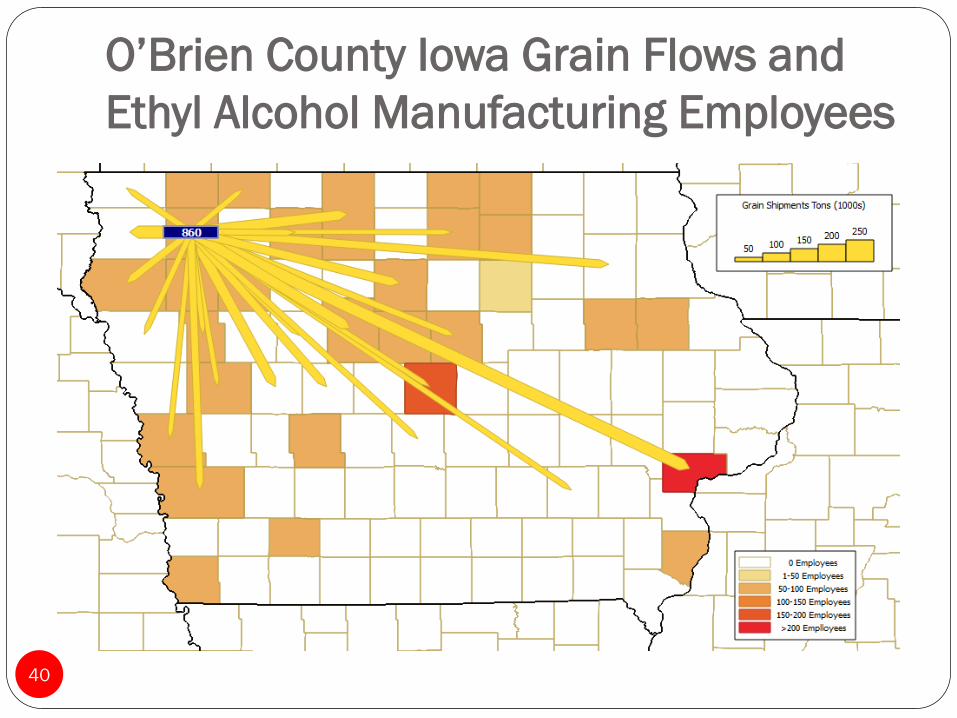
O’Brien County Iowa Grain Flows and
Ethyl Alcohol Manufacturing Employees
40
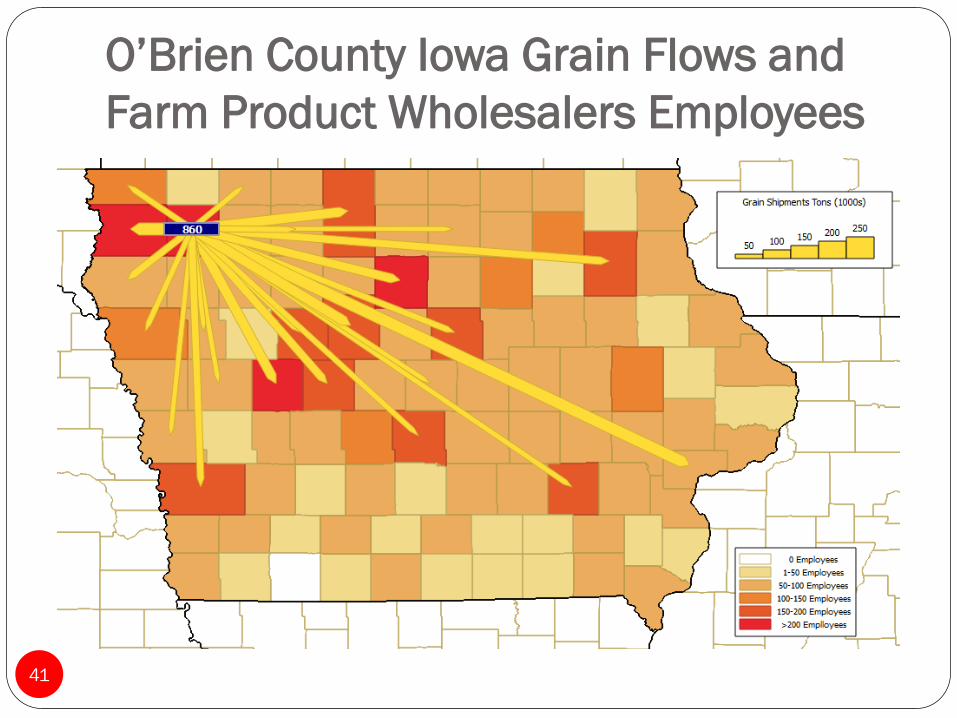
O’Brien County Iowa Grain Flows and
Farm Product Wholesalers Employees
41

Rail Domestic Coal Tons
42
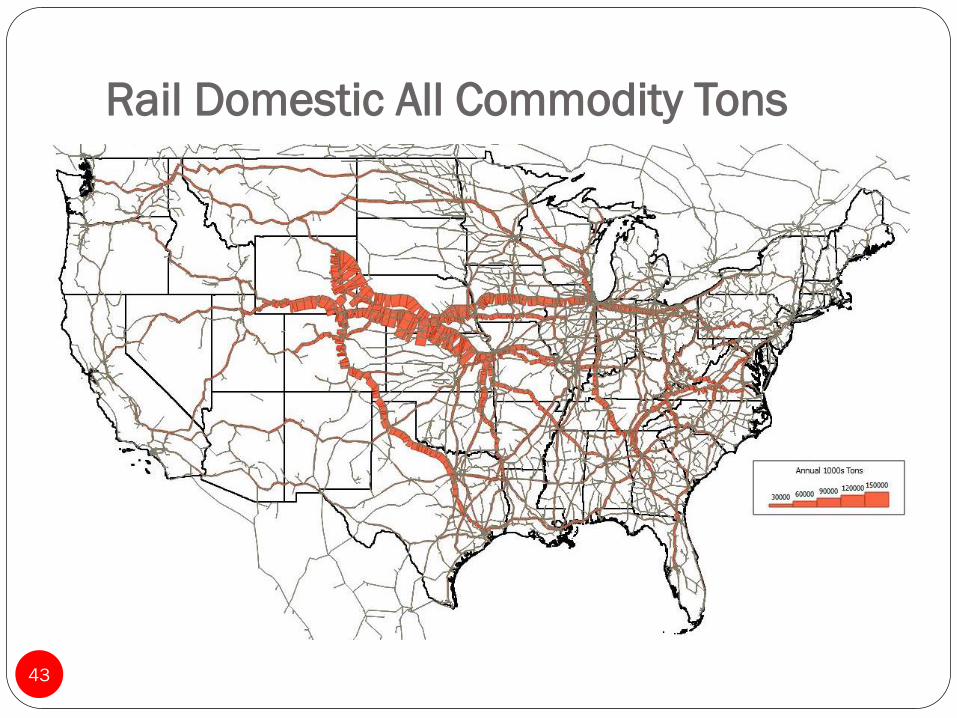
Rail Domestic All Commodity Tons
43
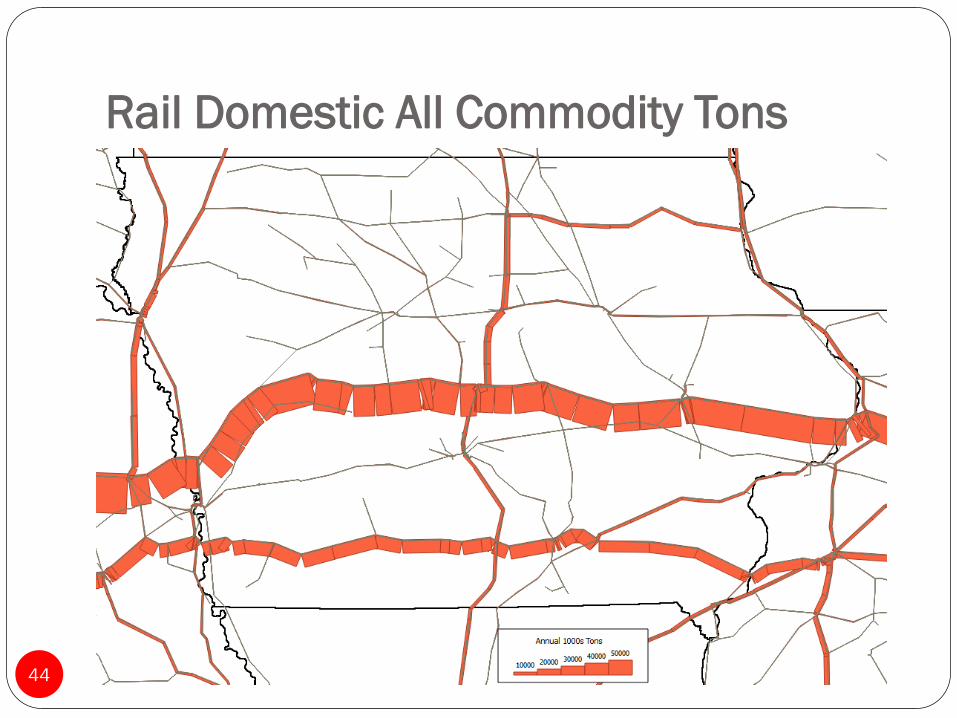
Rail Domestic All Commodity Tons
44
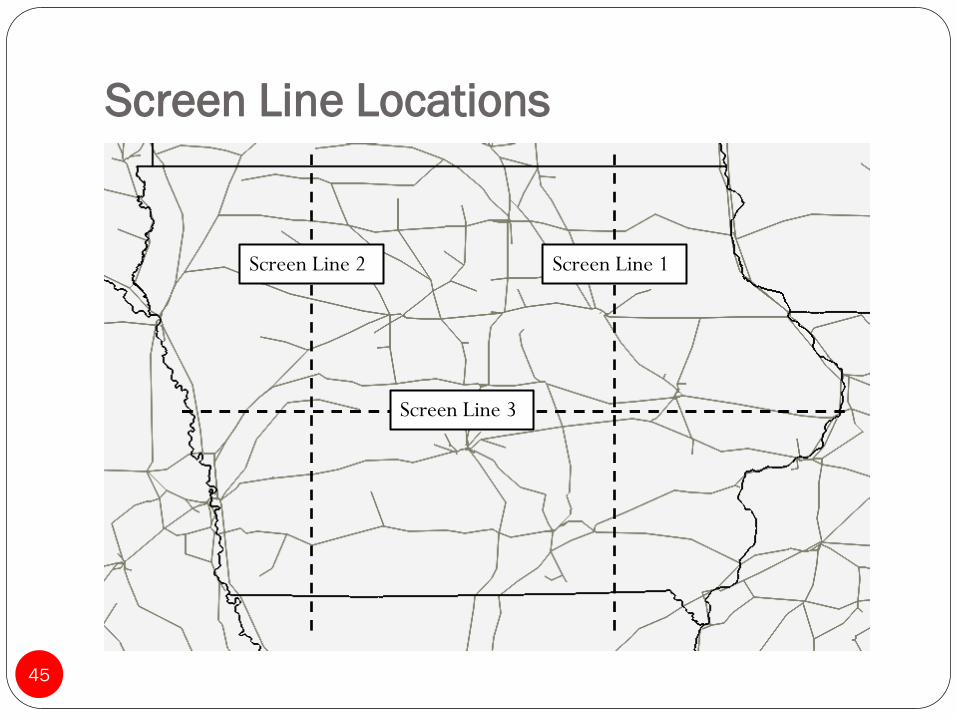
Screen Line Locations
45
Screen Line 1 Screen Line 2
Screen Line 3
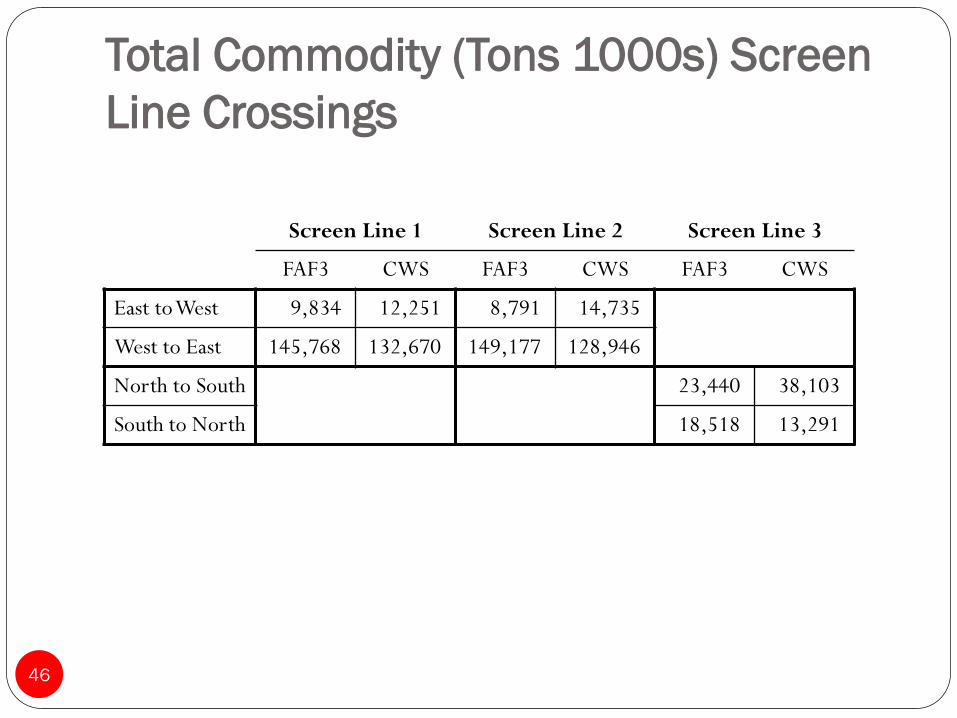
Total Commodity (Tons 1000s) Screen
Line Crossings
46
Screen Line 1 Screen Line 2 Screen Line 3
FAF3 CWS FAF3 CWS FAF3 CWS
East to West 9,834 12,251 8,791 14,735
West to East 145,768 132,670 149,177 128,946
North to South 23,440 38,103
South to North 18,518 13,291
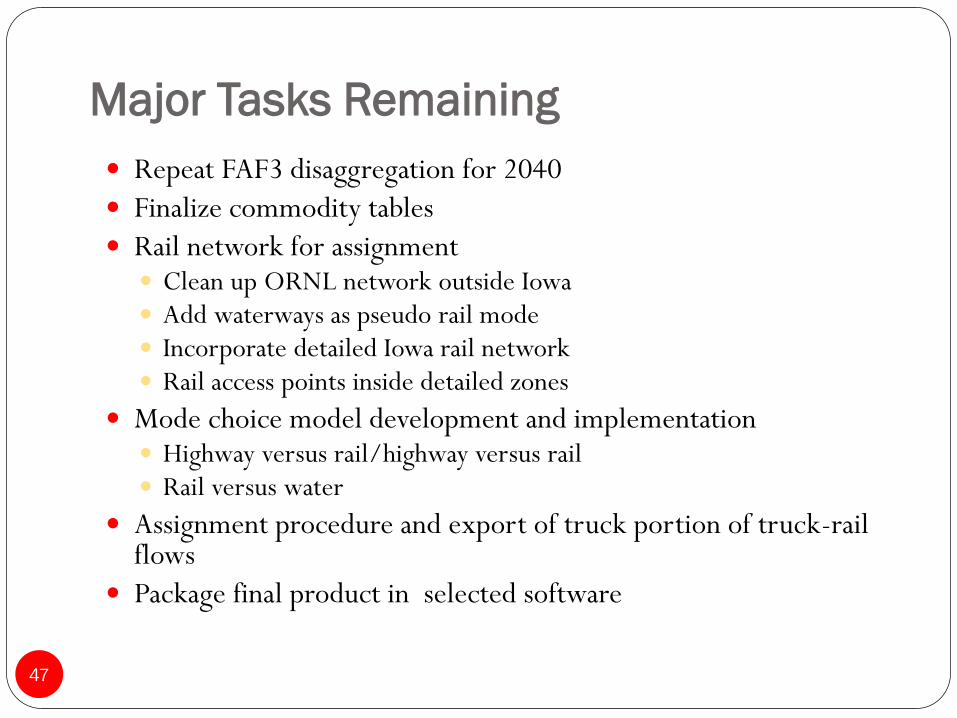
Major Tasks Remaining
47
Repeat FAF3 disaggregation for 2040
Finalize commodity tables
Rail network for assignment Clean up ORNL network outside Iowa Add waterways as pseudo rail mode Incorporate detailed Iowa rail network Rail access points inside detailed zones
Mode choice model development and implementation Highway versus rail/highway versus rail Rail versus water
Assignment procedure and export of truck portion of truck-rail flows
Package final product in selected software
Applicability
to States,
MPOs
and
Decision Makers
48

Uses of the Iowa Rail Commodity
Model
49
Summary statistics: Rail ton-miles by commodity within
Iowa, base and future.
What if Analysis:
Test placement of a new truck-rail intermodal or mega-
warehouse/distribution center.
Test the viability of a new short line railroad.
Rail ownership changes.
Transferability
50
May not be readily transferable to smaller scale geographies such as MPOs or corridors. Scale of MPO may preclude accuracy since the disaggregation
process from county to TAZ depends on local employment or land use data.
At state or regional scales, the iTRAM rail freight commodity concept is expected to be transferable
Local knowledge is required in the adapting process (CWS)
While very much a “work in progress”, the iTRAM rail freight model is expected to advance the practice of freight modeling nationwide.

Contact Information
51
Ron Eash
Parsons Brinckerhoff
230 West Monroe Street Suite 900
Chicago IL 60606