Embed Size (px)
Citation preview
IPO PRICE FORMATION AND ANALYST COVERAGE
Joseph Weber Massachusetts Institute of Technology
Michael Willenborg University of Connecticut [email protected]
Yanhua Sunny Yang University of Connecticut [email protected]
May 1, 2018
IPO PRICE FORMATION AND ANALYST COVERAGE
ABSTRACT: We study analyst coverage of newly-public companies for a period subsequent to the early 2000s regulatory events affecting sell-side research analysts. Our focus is on re-visiting the relation between underpricing and coverage by analysts, with and without affiliations to the investment bank(s) underwriting the IPO. A key aspect of our design is to operationalize the insight that IPO underpricing is conditional on the offer price revision during / after the road show; and, as such, some underpricing is ‘expected’ and some is ‘unexpected’. We proxy the former with the offer price revision (a measure of institutional investor demand) and proxy the latter with the residual from regressing the first-day return on the offer price revision. We find no support for an association between underpricing, either expected or unexpected, and coverage by affiliated analysts. In contrast, we document strong, positive associations between both underpricing components, especially the offer price revision, and coverage by unaffiliated analysts. We then delve into three potential explanations for the relation between underpricing and unaffiliated analyst coverage. First, we suggest that IPOs with high underpricing are those with strong demand from institutional investors and analysts are drawn to cover such firms. Second, we suggest that IPOs with low underpricing are primarily firms that are burning cash and analysts tend to shun such firms. Lastly, we suggest that IPOs with high underpricing are those with high levels of ownership retention and pre-IPO owners forgo proceeds to attract analyst coverage. In general, our findings are most consistent with the view that analysts cover stocks they expect to have high recognition from institutional investors (i.e., the ‘anticipation hypothesis’) and suggest a rational reason for why issuers may not object to partial upward adjustment of their IPO offer price in response to strong demand from road show investors.
Keywords: Analyst coverage, initial public offerings, partial adjustment, price revision, underpricing
JEL codes: G24, G32, M13, M41
1
I. INTRODUCTION
Most companies that go public in a firm-commitment IPO do so via book-building, a
process that begins when the issuer provides an initial price range within which it expects to sell
a certain number of its shares. Following this disclosure, underwriters and company executives
then conduct a marketing campaign (i.e., a road show), which involves meeting with select
investors to solicit their non-binding indications of interest as input to pricing the shares. In a
seminal paper, Benveniste and Spindt (1989) propose a book-building theory of IPO pricing. In
their model, to induce road show investors to divulge strong demand, underwriters agree to only
a partial adjustment to arrive at the IPO offer price. As a result, underpricing of IPO shares,
along with allocating them in a discretionary manner, serves to compensate these ‘regular’
investors for revealing their favorable private information.
From an empirical perspective, Hanley (1993) was the first to document the strong,
positive relation between offer price revisions (i.e., from the mid-point of the initial price range
to the IPO offer price) and initial returns, consistent with a partial upward adjustment to road
show investors’ strong demand. However, the statistical and economic significance of this
association, in combination with subsequent literature that finds a partial adjustment to positive
public information that arises during the road show (e.g., Bradley and Jordan, 2002; Loughran
and Ritter 2002; Lowry and Schwert 2004), suggest this relation stems from more than just an
inducement for the revelation of favorable private information by regular investors. Indeed,
Ritter (2011) argues that agency conflicts between issuers and underwriters is the primary reason
for the ‘partial adjustment phenomenon’ and, because of this, emphasizes the importance of
interpreting IPO underpricing as being ‘conditional’ on the offer price revision.1
The above poses a puzzle. Why is a partial adjustment of the offer price acceptable to
issuers? Loughran and Ritter (2002) posit a behavioral explanation; if issuers anchor on the
1 Per Ritter (2011, p.356), “[w]hen an IPO uses bookbuilding, the single variable that has the greatest explanatory power for first-day returns is the revision in the offer price from the midpoint of the original file price range … [i]f the offer price is revised down, on average there is very little underpricing. But if the offer price is revised upwards, there is on average fairly severe underpricing. Thus, the adjustment of the offer price can be used to forecast the first-day return, a pattern that is known as the partial adjustment phenomenon.”
2
midpoint of the initial price range and offset the loss of proceeds to the company from the
underpricing of primary shares with their personal wealth revaluation on retained and / or
secondary shares, they will acquiesce to underwriters under-adjusting the offer price upward in
response to favorable information; whether it be private or public. In this paper, we present
findings in support of a non-mutually exclusive rational explanation: upward adjustment of the
offer price following the road show attracts coverage by unaffiliated research analysts.
Whereas analyst coverage is important for a typical public company, it is arguably of
particular importance for a newly-public company. Companies that go public are often not well
known and have incentives to garner coverage by awarding the mandate to investment banks that
bundle underwriting with the promise of analyst following. In a survey of chief financial officers
(CFOs), Brau and Fawcett (2006, p. 400) “find that CFOs select underwriters based on overall
reputation, quality of the research department and industry expertise.” Loughran and Ritter
(2004) assert that IPO issuers during the late 1990s increasingly chose their lead underwriter on
the basis of analyst coverage, a development they term ‘analyst lust’. They cite several studies in
support of this and, upon examining a sample of 1980-2003 IPOs, attribute much of the extreme
underpricing during this period to this non-price aspect of the issuer’s objective function. Also
in support of this view, Cliff and Denis (2004) study a sample of 1993-2000 IPOs and report a
strong, positive relation between underpricing and whether the lead underwriter employs an
Institutional Investor (II) All-Star analyst in the issuer’s industry. They interpret this as issuers
underpricing to compensate the lead underwriter for coverage. Aggarwal, Krigman and Womack
(2002) also study the relation between extreme underpricing during the 1990s and coverage,
though with a focus on analysts without affiliation to a lead underwriter. They argue that issuers
underprice to attract coverage and, upon examining a sample of 1994-1999 IPOs, document a
strong, positive relation between underpricing and recommendations by non-lead analysts around
the time of lockup expiration. It is, however, important to note that the findings in this literature
are somewhat mixed, as Bradley, Jordan and Ritter (2008, p. 101) study a sample of IPOs from
1999-2000 and conclude “[a]nalyst coverage in the first year is not affected by underpricing.”
3
In this paper, we re-examine the relation between underpricing and analyst coverage for a
sample of IPOs from 2002 to 2013, a period quite different from those that the above literature
examines. First, at an average initial return of around 15%, the level of underpricing is
considerably lower; mostly because IPOs with extreme underpricing are much less prevalent.2
Second, owing in large part to allegations of bias and conflicts of interest by analysts from
bundling services during the Internet bubble, major changes have since taken place involving
research analysts (e.g., NASD Rule 2711, NYSE Amended Rule 472, the Global Analyst
Research Settlement). These new regulations limit interactions between sell-side analysts and
their underwriting colleagues, prohibit analyst compensation from being directly linked to
investment banking deals and bar analysts from attending IPO road shows.
In addition to examining a more-recent time period, a key aspect of our research design is
to operationalize the insight that IPO underpricing (i.e., initial return) is conditional on the offer
price revision; and, as such, some underpricing is arguably ‘expected’ and some is ‘unexpected’.
As for the former, we suggest that the offer price revision is a plausible proxy for the revelation
of institutional investor demand during the book building process. When the price revision is
positive, institutional demand is more than underwriter / issuer expectations; when the revision is
negative, institutional demand is less than their expectations; and when there is no price revision,
this is because the underwriter and issuer were accurate in anticipating institutional demand.
Based on this, and building on Ritter (2011), we suggest that a portion of an IPO’s first-day
return is reflective of institutional demand during book-building, whereas the remainder is
reflective of relatively unexpected enthusiasm (or the lack thereof) from retail and institutional
investors. Thus, we split the actual initial return into two orthogonal components. The first is
the price revision; our proxy for the expected portion that reflects latent institutional investor
demand. The second is the residual from regressing initial returns on price revisions; our proxy
for the unexpected portion that reflects a blend of retail and institutional demand.
2 For example, in contrast to a 24% frequency in Aggarwal et al. (2002), less than 4% of our sample would classify as ‘extra-hot’ IPOs (i.e., underpricing greater than 60%, using the opening price on the first day)
4
Consistent with many prior studies, we report evidence, both descriptive and multivariate,
of a strong, positive association between underpricing and analyst coverage as of the end of the
issuer’s first year public. New to the literature, our descriptive evidence shows that this relation
is particularly strong for IPOs with final offer prices that well exceed the maximum of their
initial price range; and especially among those for which unexpected underpricing is high. These
are IPOs that sustain high first-day underpricing, even after taking into consideration a positive
price revision. In other words, they were subject to a high degree of partial adjustment. Our
multivariate evidence shows that this association primarily stems from a symmetric relation
between the price revision and analyst coverage (i.e., from ‘expected’ underpricing rather than
‘unexpected’ underpricing). That is, we find that if the offer price revises upward, then analyst
coverage is higher; and if it revises downward, then analyst coverage is lower. Thus, the price
revision, observable prior to the IPO date, is a strong predictor of subsequent analyst coverage.
As for economic significance, a one standard deviation decrease in offer price revision
corresponds to 0.6 fewer analysts and a one standard deviation increase corresponds to 1.3 more
analysts. This compares to 0.5 fewer analysts for a one standard deviation decrease in our proxy
for unexpected underpricing (the coefficient representing an increase in unexpected underpricing
is statistically insignificant).
We further investigate whether this effect varies by analyst affiliation. We find that the
relation between underpricing, both expected and unexpected, and analyst coverage stems solely
from analysts without affiliation to the investment bank(s) underwriting the IPO. We find no
multivariate evidence of a relation between underpricing, either expected or unexpected, and
affiliated analyst coverage. We also distinguish analysts by whether they are II All Stars. In
contrast to extant literature, we find no support for a positive relation between underpricing and
coverage by affiliated All Stars. The absence of a relation with affiliated analysts is consistent
with the intent of the regulatory changes that took place since the start of our sample period. In
contrast though, we do find evidence of a positive relation between the offer price revision and
coverage by unaffiliated All Star analysts.
5
We conclude by studying certain alternative channels / explanations for the relation
between underpricing and analyst coverage. Consistent with our arguments above, because the
price revision derives, in large part, from road-show investor interest, we suggest that positive
price revisions reflect strong institutional demand. Given this, if analysts follow firms for which
they expect strong interest from institutional investors, we expect their coverage to increase with
price revision (our proxy for expected underpricing). As for the unexpected portion of
underpricing, it is less clear that analyst coverage relates to institutional demand.
The channels / explanations we investigate involve examining the extent to which the
relations we document between underpricing and unaffiliated analyst coverage vary with issuer
cash burn and ownership retention. This follows Willenborg, Wu and Yang (2015), which
examines a recent IPO sample and finds that issuers with strong operating cash flow that offer
small slices of ownership have positive price revisions. That is, they show that the ‘partial
adjustment phenomenon’ concentrates among IPOs with these characteristics. However, while
underwriters have incentives to engage in this behavior (e.g., to generate price momentum so as
to allocate ‘hot’ IPOs to their clients), it is less clear why issuers go along with it. To study this,
we conduct six two-way sorts of our sample. The first three of which partition total
underpricing, expected underpricing and unexpected underpricing by quintile of pre-IPO
operating cash flow; and the next three partition these underpricing measures by quintile of the
percentage of ownership that pre-IPO owners retain.
With respect to the first three of these sorts, we find that unaffiliated analyst coverage
increases with the extent to which the issuer generates operating cash flow; or, put another way,
that analysts seem to shun high cash-burn IPOs. This aligns with Das, Guo and Zhang (2006),
which finds analysts selectively cover IPOs based on their expectations of future performance
and is also consistent with the view that, because coverage is costly to initiate, analysts avoid
following firms likely to experience problems with viability (Lee and So, 2017). Upon splitting
underpricing into expected and unexpected components, we find the relation between operating
performance and coverage stems primarily from IPOs with negative offer price revisions. This
6
suggests analysts especially avoid IPOs by cash-burning issuers in which institutional investors
show weak road-show interest. More importantly, we find that the positive association between
offer price revision and coverage is manifest for all quintiles of operating cash flow. That is,
regardless of whether an issuer is burning or generating cash, analyst coverage generally
decreases as price revision decreases and increases as price revision increases. This pattern is
not evident for our proxy for unexpected underpricing as, for most cash flow quintiles, coverage
does not increase with unexpected underpricing. To the extent the offer price revision is a
plausible proxy for institutional investor demand, this suggests analysts cover firms for which
they have reason to expect high recognition from institutional investors, with the extent of cash
burn reinforcing this relation.
With respect to the second three of these sorts, we find that unaffiliated analyst coverage
also increases with ownership retention; and, consistent with Aggarwal et al. (2002), that IPOs
selling the smallest slices tend to have high levels of underpricing and coverage. Upon splitting
underpricing into expected and unexpected components, we find the relation between ownership
retention and coverage stems primarily from IPOs with positive price revisions. This suggests
that analysts are drawn to cover IPOs that portend strong demand from institutional investors,
especially when the issuer has more ownership yet to sell. More importantly, we find that the
positive association between offer price revision and coverage is manifest for all quintiles of
ownership retention. That is, regardless of whether an issuer is selling a large or small amount of
ownership, analyst coverage decreases as price revision decreases and increases as price revision
increases. Again, this pattern is not evident for our proxy for unexpected underpricing as, for
most ownership retention quintiles, coverage does not increase with unexpected underpricing.
The only exception is an increase in unaffiliated analyst coverage for IPOs that retain a very high
level of ownership and also sustain high unexpected underpricing. Overall, although cash burn
and ownership retention explain some of the variation in analyst coverage, they do not subsume
the relation we document between the offer price revision and unaffiliated aanalyst coverage.
7
Our paper contributes to the IPO literature and the analyst literature. With respect to the
IPOs, our results are consistent with a benefit to issuers whose offer price revises upward,
especially when it exceeds the maximum of the initial range. This suggests a rational reason
why issuers go along with partial upward adjustment: that is, because it attracts unaffiliated
analyst coverage. Rajan and Servaes (1997), which studies a sample of IPOs from 1975 to mid-
1987, was the first to document a strong, positive association between underpricing and analyst
coverage. They conclude “[o]verall these results suggest that firms that underprice attract
analyst interest. Clearly, there could be a common omitted variable that drives both underpricing
and analyst following, but it is not obvious what that is.” (p. 514) A plausible inference from our
findings is that the offer price revision during / following the road show is such a variable.
With respect to the analyst literature, our results suggest that analysts cover stocks for
which they have reason to expect high demand from institutional investors. In a recent paper, Li
and You (2015) study the market reaction to analyst initiations and terminations. They find little
support that coverage increases performance via monitoring or decreases information asymmetry
but strong support that analysts provide value by increasing investor recognition; their primary
proxy for which is the breadth of institutional ownership (i.e., the fraction of 13F filers holding
the stock). They interpret this as “…consistent with the “value creation hypothesis” – investors
react favorably (unfavorably) to coverage initiations (terminations) because they understand that
analysts create value for firms by promoting the stocks to more investors. However, the results
for the initiation sample are also consistent with an alternative explanation that analysts tend to
initiate coverage on stocks that they expect to have higher investor recognition (the “anticipation
hypothesis”).” (p. 142) In his discussion, Hansen (2016, p. 62) posits that such an alternative
“suggests it is likely that initiations are somewhat predictable using observable indicators.”
Following this, another inference from our findings is that, in the case of IPOs, analyst coverage
is predictable and supportive of the ‘anticipation hypothesis’. In this sense, our findings that
analysts tend to cover (not cover) IPOs that portend high (low) institutional demand is consistent
with “… the business model for sell-side research, in which buy-side investors trade fees for
8
information; and to career interests, because analysts achieve status through buy-side recognition
like the Institutional Investor surveys.” (Bradshaw, Ertimur and O’Brien 2016, p. 135)
Finally, our paper illuminates the roles cash burn and retained ownership play in analyst
coverage decisions. We find that analysts tend to avoid cash burners, consistent with the view
that they avoid following risky stocks because the opportunity costs of initiating coverage and
then having the firm delist or otherwise fail are high. As for ownership retention, it is often seen
as a positive signal of value (Leland and Pyle, 1977). Consistent with this, we show that analysts
follow IPO’s with high ownership retention, which is important as it suggests that the increase in
analyst following will increase liquidity in the event that the retained interests are sold.
II. LITERATURE AND MOTIVATION
Extant literature on the relation between IPO underpricing and analyst coverage mostly
examines time periods prior to the regulatory events pertaining to investment banks and analysts
in the early 2000s and does not separately examine analysts with versus without an affiliation to
lead underwriters.3 While early papers in this literature generally find a positive relation between
IPO underpricing and analyst coverage, later papers often report mixed evidence.
Rajan and Servaes (1997) is the first paper to document a positive relation between IPO
underpricing and the extent of analyst coverage. They study IPOs from 1975 to mid-1987 and,
after considering the potential for selection bias in the analyst’s decision to provide coverage,
report a strong, positive association between IPOs with an ‘extreme’ level of underpricing (i.e.,
those with a greater than the median of IPOs with positive underpricing) and the number of
analysts providing earnings forecasts to IBES during the issuer’s first post-IPO year.
Aggarwal, Krigman and Womack (2002) study a sample of Internet and matched IPOs
from 1994 to 1999. They report a positive association between underpricing and the number of
non-lead analyst recommendations on First Call within the first seven months. Aggarwal et al.
interpret their findings as consistent with their theory that managers strategically underprice in 3 The latter distinction is important because the early 2000s regulatory events primarily pertain to affiliated analysts.
9
order to generate information momentum in the form of research coverage because they plan to
sell their shares at the expiration of the lockup period.
Cliff and Denis (2004) address the question of whether IPO issuers underprice in order to
‘purchase’ analyst coverage from their lead underwriter(s). They examine a unique sample of
IPOs from 1993 to 2000 that also issue an SEO from 1993 to 2001. They find a strong, positive
association between underpricing and whether the lead underwriter has an Institutional Investor
All-Star analyst in the same industry as the IPO issuer. In addition, after endogenizing the lead
underwriter’s decision to provide coverage within one year, they also report a significant positive
association between expected coverage and underpricing. Cliff and Denis (2004, p. 2871)
interpret their findings as “… consistent with the [analyst lust] hypothesis that underpricing is, in
part, compensation for expected post-IPO analyst coverage from highly ranked analysts.”
Das, Guo and Zhang (2006) use the IPO setting to study if analyst coverage decisions are,
in part, reflective of their ability to identify firms with superior future prospects. They examine a
sample of IPOs from 1986 to 2000 and also report evidence of a positive association between
IPO underpricing and the extent of analyst coverage within the first six months.
Bradley, Jordan and Ritter (2008) examine a sample of IPOs from the height of the 1999-
2000 Internet bubble and report a statistically-thin, positive association between underpricing
and analyst coverage as of the first month (i.e., a time frame within which most following is by
analysts with affiliation to a lead manager(s)); but that is no longer evident at the one-year mark.
Bradley et al. (2008, p. 101) conclude that, for this period of time at the height of the Internet
IPO bubble, “analyst following in the first year is not affected by underpricing.” (italics added)
Liu and Ritter (2011) develop and test a theory of underpricing that considers issuers’
preferences for both the price and non-price dimensions of underwriting services. In terms of
issuers, they focus on those with venture capital backing; and, in terms of non-price dimensions,
they focus on coverage by II All-Star analysts with an affiliation to a bookrunner. They examine
a sample of IPOs from 1993-2008 and report a positive association between the presence of such
10
an analyst and underpricing during the earlier portion of their sample, particularly for venture
backed IPOs, but not for the later portion from 2001-2008.
O’Brien and Tan (2015) use the IPO setting as a context to study how analyst geographic
proximity affects their decision to provide coverage within two years. Among their covariates,
they control for underpricing, on which they report a positive coefficient. However, because
they examine 1996-2009 IPOs, it is unclear whether this finding is evident for the latter period(s)
of the sample or whether the lack of such a relation, as Bradley et al. (2008) conclude, persists.
The above papers all specify underpricing as either a variable of interest or as a covariate
and measure it as the return from the IPO offer price to either the opening or, more often, the
closing price on the first trading day. However, a well-known aspect of the pricing of book-built
IPOs is that, to a considerable extent, the first-day return is predictable from the offer price
revision during / after the road show. That is, if the offer price revises upward then the first-day
return is quite positive; and, if the offer price revises downward then the first-day return is often
zero or negative. Ritter (2011) argues that this pattern of ‘conditional’ underpricing stems from
an agency problem in which underwriters exploit a cognitive bias on the part of issuers resulting
from their tendency to anchor on the mid-point of the initial price range. From an empirical
perspective, this suggests that a portion of IPO underpricing is arguably ‘expected’, based on the
offer price revision, whereas the remaining portion is ‘unexpected’.
In terms of ‘expected’ underpricing, Willenborg, Wu and Yang (2015) examine a sample
of IPOs from 2001-2013 and show that pre-IPO performance is a strong predictor of offer price
revisions. They find that issuers with positive operating cash flow that retain large fractions of
ownership have positive offer price revisions (i.e., ‘partial adjustment’ concentrates among IPOs
with these characteristics). Willenborg et al. (2015) conclude this is because these issuers have
lower incentives to bargain for the initial valuation and, as a consequence, are vulnerable to
having the underwriter(s) low-ball their price range. However, while underwriters have rational
incentives to engage in this behavior (e.g., to generate price momentum and allocate ‘hot’ IPOs
to their clients), it is less clear why issuers would go along with it. In this sense, Willenborg et
11
al.’s (2015) findings also pose a puzzle: That is, bargaining incentives (or naïveté) aside, is
there a benefit to issuers which acquiesce to having underwriters low-ball their initial valuation?
In this paper, for two reasons, we re-visit the relation between IPO underpricing and
analyst coverage. For one, given the regulatory events in the early 2000s affecting sell-side
analysts that we allude to in our Introduction, along with the sharp drop in the overall level of
underpricing since the Internet bubble and the (lack of) findings in Bradley et al. (2008) and Liu
and Ritter (2011), we wish to examine the persistence of the relation. For another, in doing so,
we operationalize the insight that IPO underpricing is predicable from the offer price revision.
To the extent the offer price revision is a reliable measure of institutional investor demand, this
would suggest a mechanism underlying the underpricing / coverage association.
III. SAMPLE, VARIABLES AND DESCRIPTIVE STATISTICS
Sample
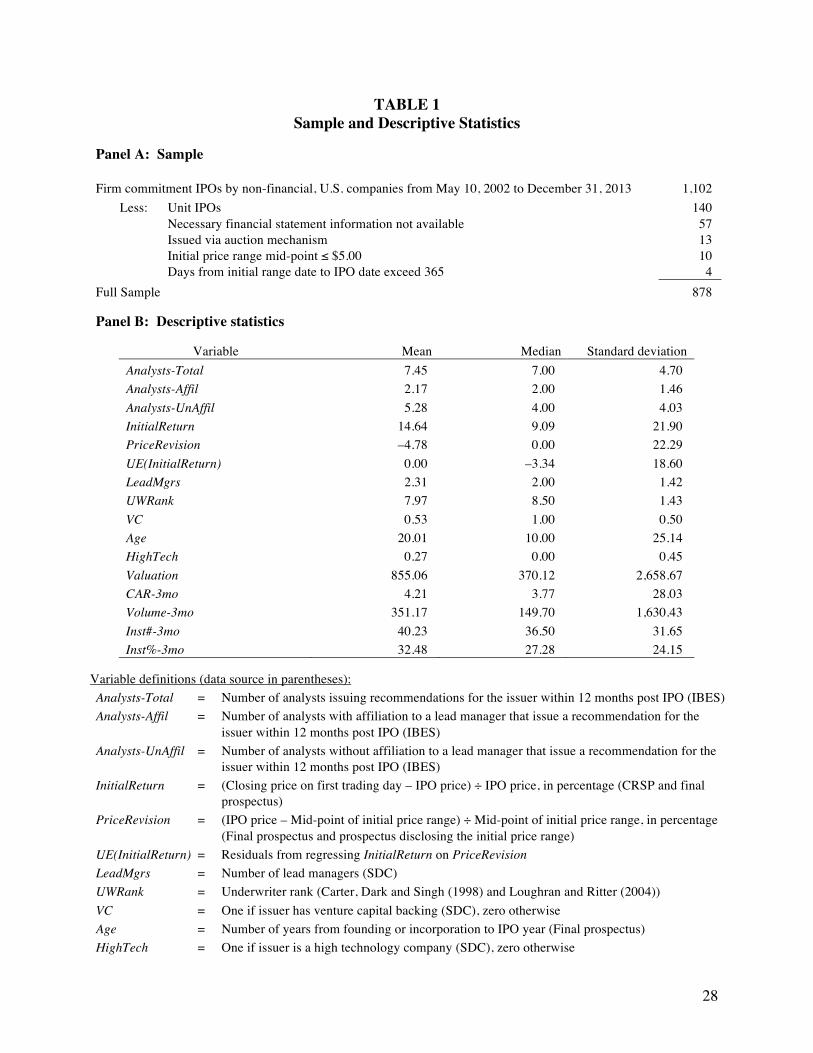
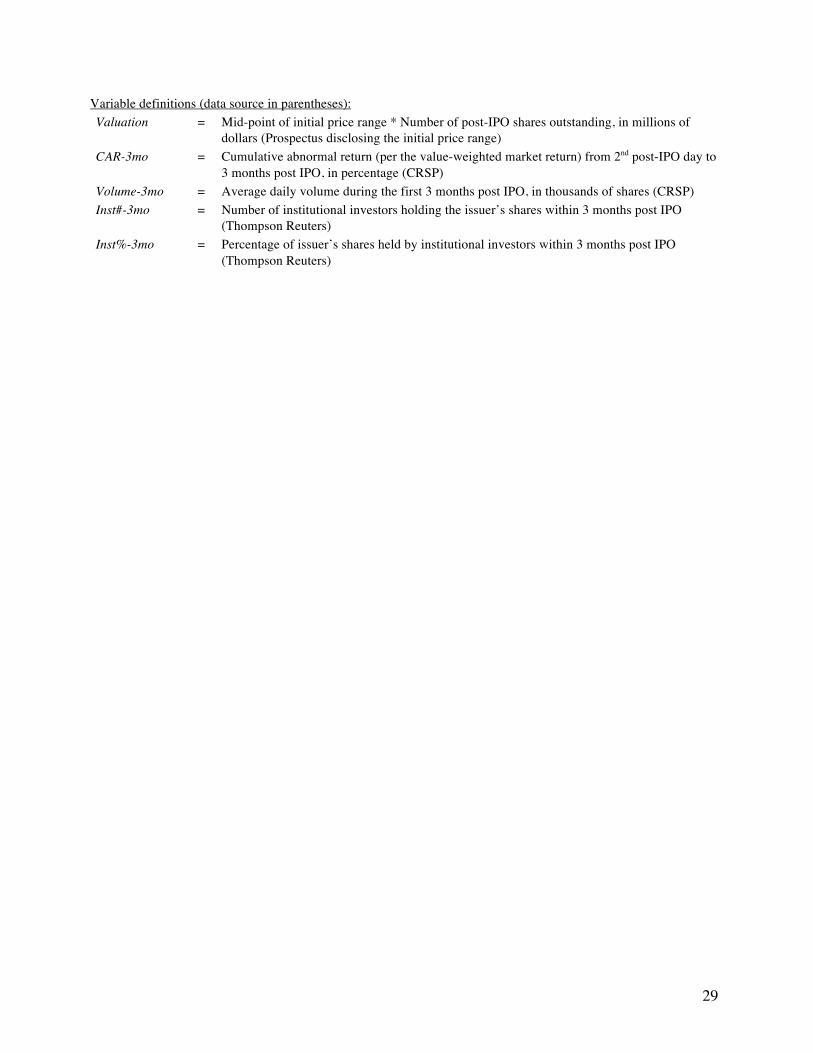
Panel A of Table 1 presents the sample. Using Thompson Financial’s SDC database, we
identify 1,102 firm-commitment IPOs by non-financial, domestic issuers from May 10, 2002 to
December 31, 2013. The starting point is the date of SEC approval of NASD Rule 2711 and
amendments to NYSE Rule 472. The majority of the extant literature examines samples that
include segments of time prior to these regulatory changes, when analysts were subject to
allegations of conflicts of interest. We focus on share IPOs and eliminate 140 offerings
involving units. We also exclude 57 IPOs without necessary information, mostly issuers that
undergo a change in legal form.4 Since our interest is analyst coverage and the price formation
of book-built IPOs, we omit 13 IPOs sold via auction (Degeorge, Derrien and Womack 2010).
Lastly, following Edelen and Kadlec (2005), we exclude 10 IPOs with a mid-point of their initial
price range of $5 or less and 4 IPOs for which the period of time from the date of the prospectus
with the initial range to the date of the IPO exceeds one year. Our sample consists of 878 IPOs.
4 Because of this, we are unable to reliably determine the issuer’s age. In addition, many of these issuers present financial statements pertaining to successor and predecessor entities and we cannot reliably compute average assets.
12
Variables and Descriptive Statistics
Panel B of Table 1 presents descriptive statistics. The mean (median) number of analysts
covering an issuer, per I/B/E/S, within one year of going public (Analyst-Total) is 7.45 (7.00).
Consistent with recent trends, less than 1% of the IPOs in our sample do not have some analyst
coverage within by the first year.5 Because the distribution of Analysts-Total exhibits over-
dispersion, its variance of 22.10 (un-tabled) greatly exceeds its mean of 7.45, we use count data
econometric techniques to estimate analyst coverage regressions (Rock, Sedo and Willenborg,
2000; Bradley et al. 2008). When we distinguish analysts by whether or not they have an
affiliation with a lead manager(s), the majority of coverage is from unaffiliated analysts; as mean
(median) Analyst-UnAffil of 5.28 (4.00) is at least double that of 2.17 (2.00) for Analyst-Affil.
Our design keys off of Ritter’s (2011) characterization of IPO underpricing as conditional
on both the direction and extent of the offer price revision. To operationalize this, we split
underpricing into ‘expected’ and ‘unexpected’ components. To proxy for the former, we specify
PriceRevision (i.e., the percentage change from the mid-point of the initial price range to the IPO
offer price) and, to proxy for the latter, we specify UE(InitialReturn) as the residuals from
regressing InitialReturn (i.e., the percentage change from the IPO offer price to the closing price
on the first trading day) on PriceRevision. This split helps to identify the source(s) of demand,
with PriceRevision measuring that of institutional investors with potential access to the shares at
the IPO price and UE(InitialReturn) measuring a blend of institutional and retail investors with
potential access to the shares at first-day trading prices.
Given the above, we focus on three variables of interest: InitialReturn, PriceRevision
and UE(InitialReturn). Per panel B of Table 1, mean (median) InitialReturn is 14.64% (9.09%),
PriceRevision is –4.78% (0.00%) and UE(InitialReturn) is 0.00% (–3.34%). This average level
of underpricing, while greater than Rajan and Servaes’ (1997) 10.03% for IPOs from 1975 to
mid-1987, is considerably less than either Aggarwal et al.’s (2002) 50.4% for IPOs from 1994 to
5 For example, Bradley, Jordan and Ritter (2003) study the initiation of analyst coverage at expiration of the ‘quiet period’ and report the percentage of IPOs with analyst coverage increases from 57.9% in 1996 to 95.6% in 2000.
13
1999 or Cliff and Denis’ (2004) 27.5% for IPOs from 1993 to 2000. Consistent with these
differences, the average PriceRevision for our sample is also lower than that of either of these
two studies; at 13.6% for Aggarwal et al. (2002) and 3.1% for Cliff and Denis (2004).
In Section IV, we conduct multivariate analyses of the determinants of analyst coverage
and, following the literature that we discuss in Section II, specify covariates pertaining to
underwriter, issuer and the IPO shares. As for underwriter, we control for the number
(LeadMgrs) and ranking (UWRank) of lead managers. As for issuer, we control for venture
capital backing (VC), age (Age), high-technology industry membership (HighTech) and valuation
(Valuation).6 As for the IPO shares, we control for cumulative abnormal returns (CAR-3mo),
trading volume (Volume-3mo) and the number and fractional ownership of institutional investors
(Inst#-3mo and Inst%-3mo); all of which we measure as of three-months post-IPO. Lastly, we
specify fixed effects for IPO year.
Correlations
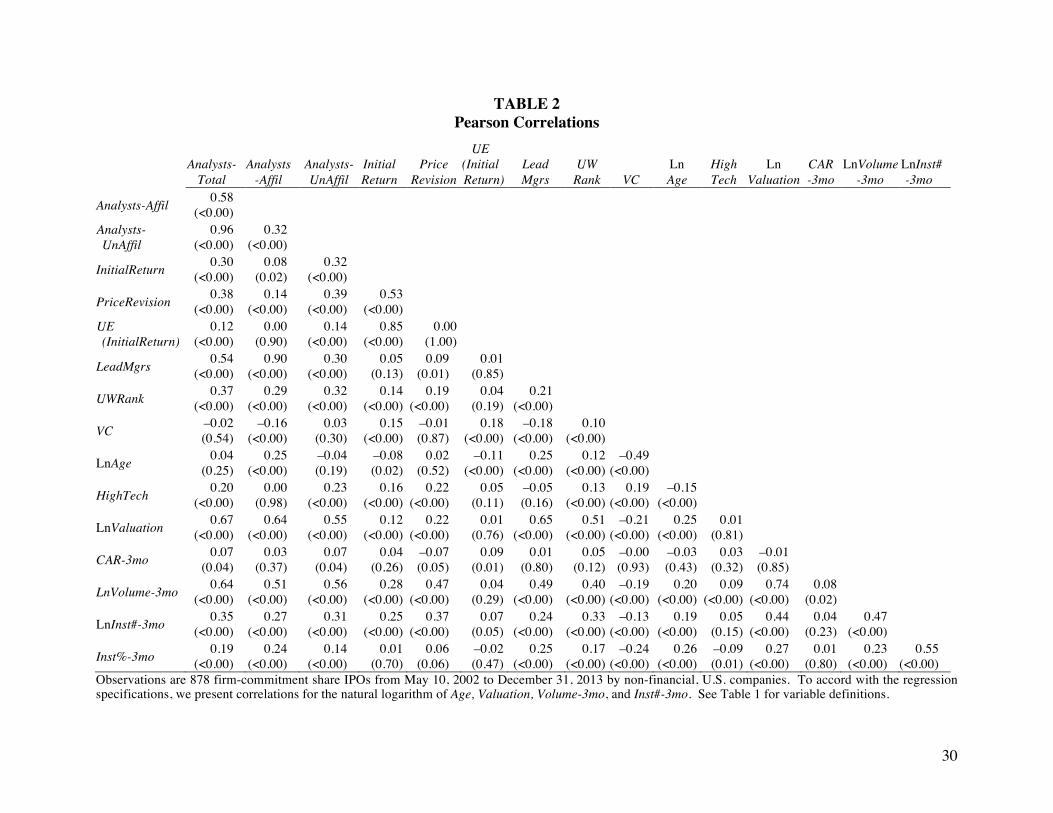
Table 2 presents Pearson correlations. Our variables of interest have unsurprising levels
of correlation. The correlation between InitialReturn and PriceRevision, at 0.53, is high; and, by
design, PriceRevision and UE(InitialReturn) are orthogonal. As for these variables and analyst
coverage, while all have significant positive correlations with Analysts-Total, their relations are
considerably stronger with Analysts-UnAffil. In particular, given that unaffiliated analysts have
little to gain from underpricing, is interesting to note that the correlation between InitialReturn
and Analyst-UnAfill, at 0.32, is much larger than that between InitialReturn and Analyst-Afill, at
0.08. Also of note, the correlation between UE(InitialReturn) and Analysts-Affil is zero. That is,
prior to specifying covariates, the extent to which underpricing is associated with coverage by
affiliated analysts stems entirely from PriceRevision, our proxy for ‘expected’ underpricing
6 When we specify InitialReturn as independent variable (as in equation (2)), we measure Valuation using the IPO price per share. When we specify PriceRevision as dependent variable (as in equations (3) and (4)), we measure Valuation using the mid-point of the initial price range. To do otherwise (e.g., measure Valuation using a post-IPO price per share, such as at the end of the first trading day) would subsume effects associated with our variables of interest (InitialReturn, PriceRevision and UE(InitialReturn)).
14
IV. EMPIRICAL ANALYSIS
IPO Price Formation and Analyst Coverage – Descriptive Analysis
We begin by presenting a series of one- and two-way descriptive sorts of our sample.
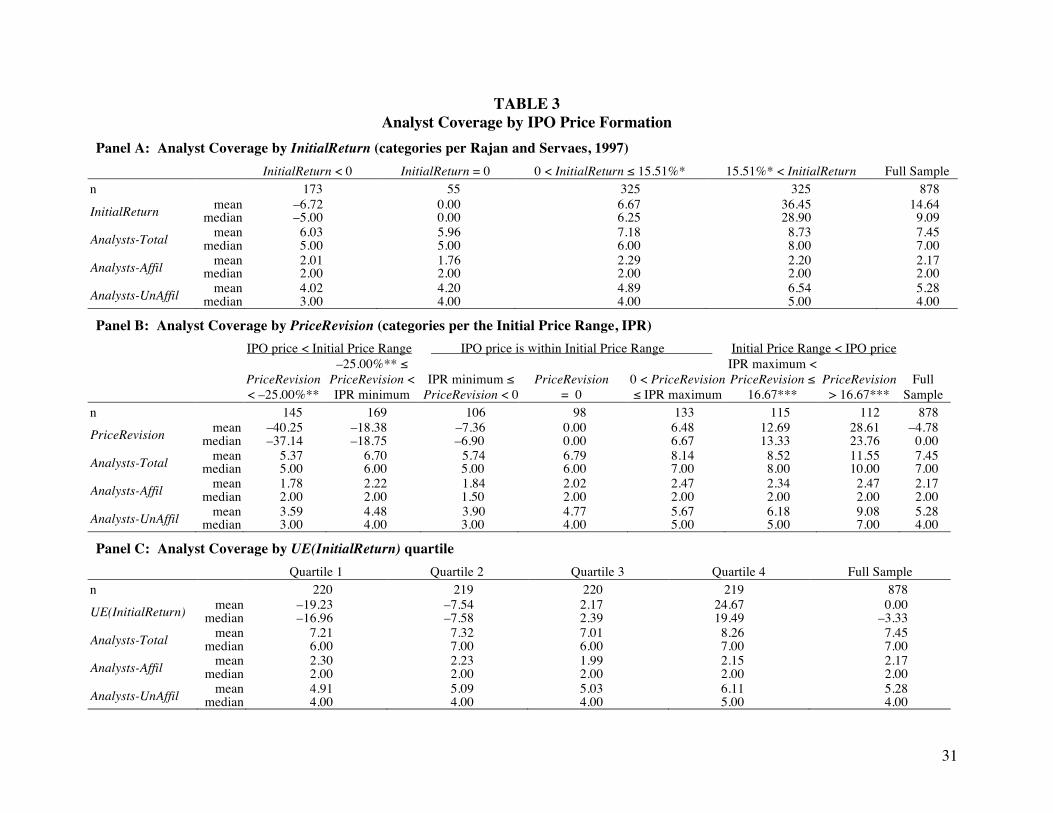
Panels A–C of Table 3 are one-way sorts that supplement the Table 2 correlations. Panels D and
E of Table 3 are two-way sorts that supplement the Tables 4 and 5 regressions.
In panel A of Table 3, following Rajan and Servaes (1997), we split the sample into four
categories of InitialReturn. The first two are the 173 and 55 IPOs with an InitialReturn that is
negative and zero, respectively (‘broken deals’) and, for the next two, we split the remaining 650
IPOs by their median InitialReturn of 15.51%. Analyst coverage manifests an increasing trend
across these categories; as mean (median) Analyst-Total goes from 6.03 to 5.96 to 7.18 to 8.73
(from 5.00 to 5.00 to 6.00 to 8.00). Upon distinguishing analysts by whether they have an
affiliation with a lead manager(s), we find this pattern stems from Analyst-UnAffil.
In panel B of Table 3, we use the initial price range (IPR) as a frame of reference and
split the sample into seven categories of PriceRevision. The middle category is the 98 IPOs with
PriceRevision of zero; those to either side of this category are the 106 and 133 IPOs with
negative and positive revisions, yet within the IPR, respectively; the two left-most categories are
IPOs with an offer price below the IPR minimum, split by the median –25.00% PriceRevision
for these 314 IPOs; and the two right-most categories are IPOs with an offer price above their
IPR maximum, split by the median +16.67% PriceRevision for these 227 IPOs. Going from left-
to-right, while neither Analyst-Affil nor Analyst-UnAffil manifest a trend for the first three
categories, they both increase from the middle group through to right-most group. As with panel
A, this stems from unaffiliated analyst coverage; as mean (median) Analyst-UnAffil increasing
from 4.77 to 5.67 to 6.18 to 9.08 (4.00 to 5.00 to 5.00 to 7.00) across the latter four categories.
In panel C of Table 3, we split the sample into quartiles of UE(InitialReturn); our proxy
for ‘unexpected’ underpricing. IPOs in quintile 1 have unexpectedly low InitialReturn, after
15
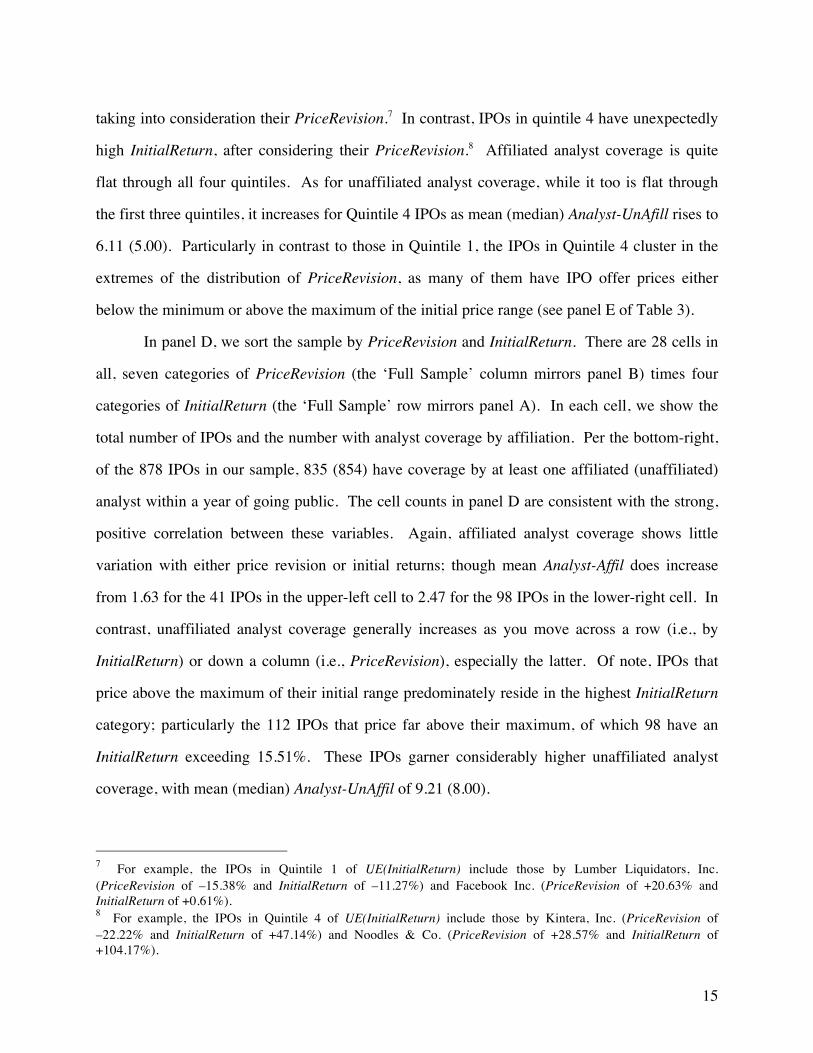
taking into consideration their PriceRevision.7 In contrast, IPOs in quintile 4 have unexpectedly
high InitialReturn, after considering their PriceRevision.8 Affiliated analyst coverage is quite
flat through all four quintiles. As for unaffiliated analyst coverage, while it too is flat through
the first three quintiles, it increases for Quintile 4 IPOs as mean (median) Analyst-UnAfill rises to
6.11 (5.00). Particularly in contrast to those in Quintile 1, the IPOs in Quintile 4 cluster in the
extremes of the distribution of PriceRevision, as many of them have IPO offer prices either
below the minimum or above the maximum of the initial price range (see panel E of Table 3).
In panel D, we sort the sample by PriceRevision and InitialReturn. There are 28 cells in
all, seven categories of PriceRevision (the ‘Full Sample’ column mirrors panel B) times four
categories of InitialReturn (the ‘Full Sample’ row mirrors panel A). In each cell, we show the
total number of IPOs and the number with analyst coverage by affiliation. Per the bottom-right,
of the 878 IPOs in our sample, 835 (854) have coverage by at least one affiliated (unaffiliated)
analyst within a year of going public. The cell counts in panel D are consistent with the strong,
positive correlation between these variables. Again, affiliated analyst coverage shows little
variation with either price revision or initial returns; though mean Analyst-Affil does increase
from 1.63 for the 41 IPOs in the upper-left cell to 2.47 for the 98 IPOs in the lower-right cell. In
contrast, unaffiliated analyst coverage generally increases as you move across a row (i.e., by
InitialReturn) or down a column (i.e., PriceRevision), especially the latter. Of note, IPOs that
price above the maximum of their initial range predominately reside in the highest InitialReturn
category; particularly the 112 IPOs that price far above their maximum, of which 98 have an
InitialReturn exceeding 15.51%. These IPOs garner considerably higher unaffiliated analyst
coverage, with mean (median) Analyst-UnAffil of 9.21 (8.00).
7 For example, the IPOs in Quintile 1 of UE(InitialReturn) include those by Lumber Liquidators, Inc. (PriceRevision of –15.38% and InitialReturn of –11.27%) and Facebook Inc. (PriceRevision of +20.63% and InitialReturn of +0.61%). 8 For example, the IPOs in Quintile 4 of UE(InitialReturn) include those by Kintera, Inc. (PriceRevision of –22.22% and InitialReturn of +47.14%) and Noodles & Co. (PriceRevision of +28.57% and InitialReturn of +104.17%).
16
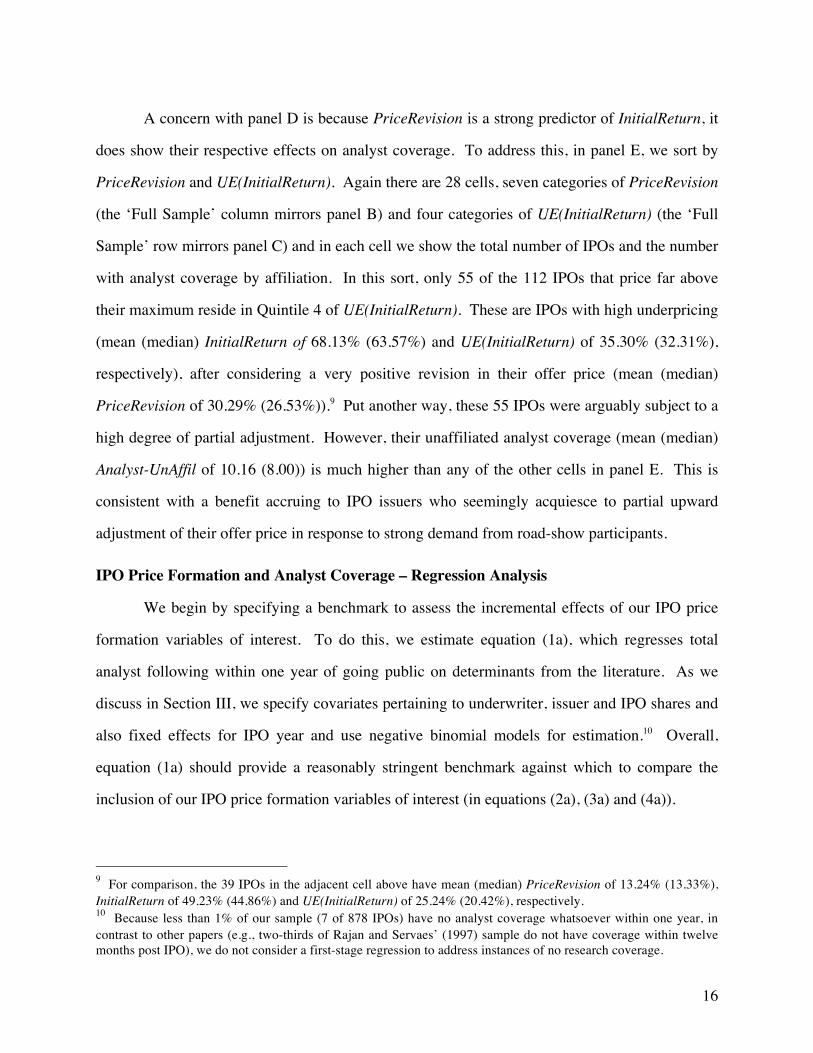
A concern with panel D is because PriceRevision is a strong predictor of InitialReturn, it
does show their respective effects on analyst coverage. To address this, in panel E, we sort by
PriceRevision and UE(InitialReturn). Again there are 28 cells, seven categories of PriceRevision
(the ‘Full Sample’ column mirrors panel B) and four categories of UE(InitialReturn) (the ‘Full
Sample’ row mirrors panel C) and in each cell we show the total number of IPOs and the number
with analyst coverage by affiliation. In this sort, only 55 of the 112 IPOs that price far above
their maximum reside in Quintile 4 of UE(InitialReturn). These are IPOs with high underpricing
(mean (median) InitialReturn of 68.13% (63.57%) and UE(InitialReturn) of 35.30% (32.31%),
respectively), after considering a very positive revision in their offer price (mean (median)
PriceRevision of 30.29% (26.53%)).9 Put another way, these 55 IPOs were arguably subject to a
high degree of partial adjustment. However, their unaffiliated analyst coverage (mean (median)
Analyst-UnAffil of 10.16 (8.00)) is much higher than any of the other cells in panel E. This is
consistent with a benefit accruing to IPO issuers who seemingly acquiesce to partial upward
adjustment of their offer price in response to strong demand from road-show participants.
IPO Price Formation and Analyst Coverage – Regression Analysis
We begin by specifying a benchmark to assess the incremental effects of our IPO price
formation variables of interest. To do this, we estimate equation (1a), which regresses total
analyst following within one year of going public on determinants from the literature. As we
discuss in Section III, we specify covariates pertaining to underwriter, issuer and IPO shares and
also fixed effects for IPO year and use negative binomial models for estimation.10 Overall,
equation (1a) should provide a reasonably stringent benchmark against which to compare the
inclusion of our IPO price formation variables of interest (in equations (2a), (3a) and (4a)).
9 For comparison, the 39 IPOs in the adjacent cell above have mean (median) PriceRevision of 13.24% (13.33%), InitialReturn of 49.23% (44.86%) and UE(InitialReturn) of 25.24% (20.42%), respectively. 10 Because less than 1% of our sample (7 of 878 IPOs) have no analyst coverage whatsoever within one year, in contrast to other papers (e.g., two-thirds of Rajan and Servaes’ (1997) sample do not have coverage within twelve months post IPO), we do not consider a first-stage regression to address instances of no research coverage.
17
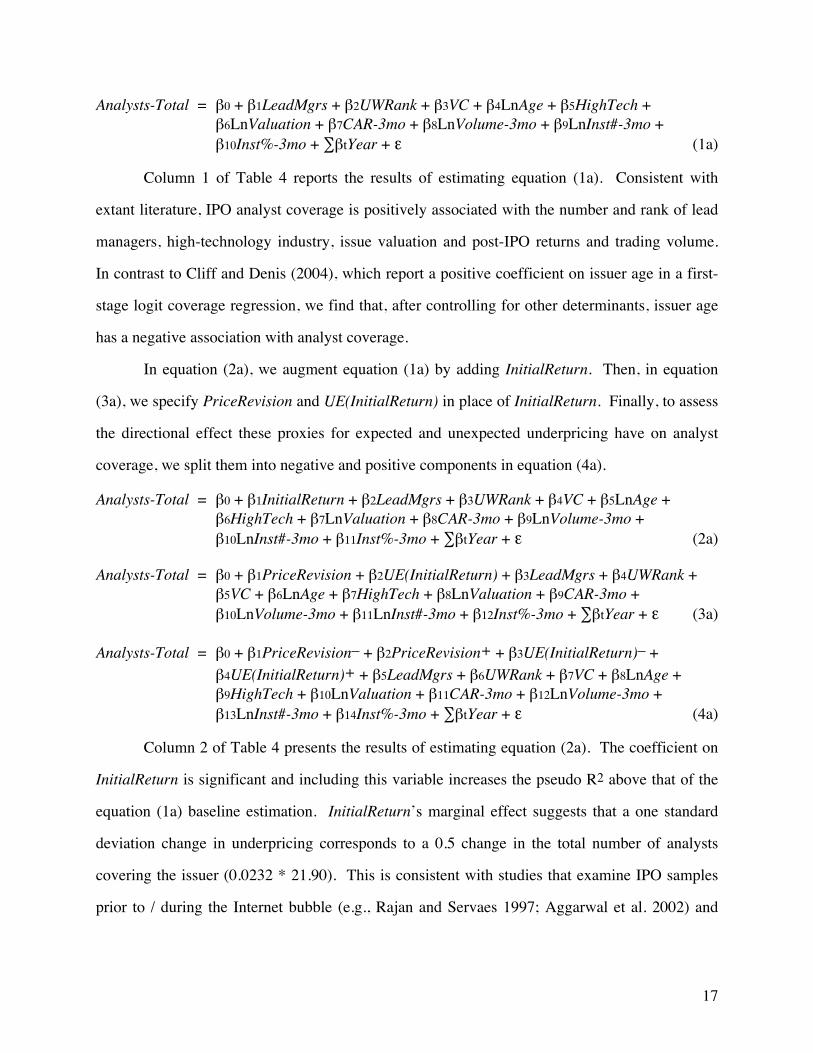
Analysts-Total = β0 + β1LeadMgrs + β2UWRank + β3VC + β4LnAge + β5HighTech + β6LnValuation + β7CAR-3mo + β8LnVolume-3mo + β9LnInst#-3mo + β10Inst%-3mo + ∑βtYear + ε (1a)
Column 1 of Table 4 reports the results of estimating equation (1a). Consistent with
extant literature, IPO analyst coverage is positively associated with the number and rank of lead
managers, high-technology industry, issue valuation and post-IPO returns and trading volume.
In contrast to Cliff and Denis (2004), which report a positive coefficient on issuer age in a first-
stage logit coverage regression, we find that, after controlling for other determinants, issuer age
has a negative association with analyst coverage.
In equation (2a), we augment equation (1a) by adding InitialReturn. Then, in equation
(3a), we specify PriceRevision and UE(InitialReturn) in place of InitialReturn. Finally, to assess
the directional effect these proxies for expected and unexpected underpricing have on analyst
coverage, we split them into negative and positive components in equation (4a).
Analysts-Total = β0 + β1InitialReturn + β2LeadMgrs + β3UWRank + β4VC + β5LnAge + β6HighTech + β7LnValuation + β8CAR-3mo + β9LnVolume-3mo + β10LnInst#-3mo + β11Inst%-3mo + ∑βtYear + ε (2a)
Analysts-Total = β0 + β1PriceRevision + β2UE(InitialReturn) + β3LeadMgrs + β4UWRank + β5VC + β6LnAge + β7HighTech + β8LnValuation + β9CAR-3mo + β10LnVolume-3mo + β11LnInst#-3mo + β12Inst%-3mo + ∑βtYear + ε (3a)
Analysts-Total = β0 + β1PriceRevision– + β2PriceRevision+ + β3UE(InitialReturn)– + β4UE(InitialReturn)+ + β5LeadMgrs + β6UWRank + β7VC + β8LnAge + β9HighTech + β10LnValuation + β11CAR-3mo + β12LnVolume-3mo + β13LnInst#-3mo + β14Inst%-3mo + ∑βtYear + ε (4a)
Column 2 of Table 4 presents the results of estimating equation (2a). The coefficient on
InitialReturn is significant and including this variable increases the pseudo R2 above that of the
equation (1a) baseline estimation. InitialReturn’s marginal effect suggests that a one standard
deviation change in underpricing corresponds to a 0.5 change in the total number of analysts
covering the issuer (0.0232 * 21.90). This is consistent with studies that examine IPO samples
prior to / during the Internet bubble (e.g., Rajan and Servaes 1997; Aggarwal et al. 2002) and
18
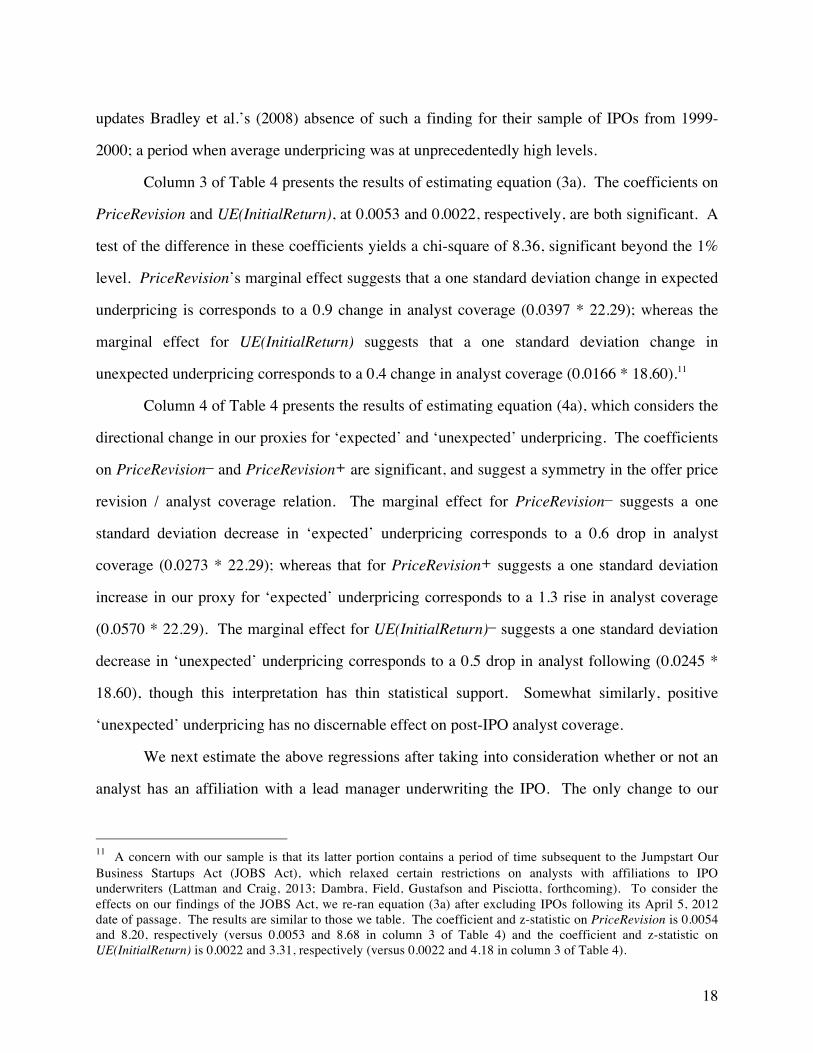
updates Bradley et al.’s (2008) absence of such a finding for their sample of IPOs from 1999-
2000; a period when average underpricing was at unprecedentedly high levels.
Column 3 of Table 4 presents the results of estimating equation (3a). The coefficients on
PriceRevision and UE(InitialReturn), at 0.0053 and 0.0022, respectively, are both significant. A
test of the difference in these coefficients yields a chi-square of 8.36, significant beyond the 1%
level. PriceRevision’s marginal effect suggests that a one standard deviation change in expected
underpricing is corresponds to a 0.9 change in analyst coverage (0.0397 * 22.29); whereas the
marginal effect for UE(InitialReturn) suggests that a one standard deviation change in
unexpected underpricing corresponds to a 0.4 change in analyst coverage (0.0166 * 18.60).11
Column 4 of Table 4 presents the results of estimating equation (4a), which considers the
directional change in our proxies for ‘expected’ and ‘unexpected’ underpricing. The coefficients
on PriceRevision– and PriceRevision+ are significant, and suggest a symmetry in the offer price
revision / analyst coverage relation. The marginal effect for PriceRevision– suggests a one
standard deviation decrease in ‘expected’ underpricing corresponds to a 0.6 drop in analyst
coverage (0.0273 * 22.29); whereas that for PriceRevision+ suggests a one standard deviation
increase in our proxy for ‘expected’ underpricing corresponds to a 1.3 rise in analyst coverage
(0.0570 * 22.29). The marginal effect for UE(InitialReturn)– suggests a one standard deviation
decrease in ‘unexpected’ underpricing corresponds to a 0.5 drop in analyst following (0.0245 *
18.60), though this interpretation has thin statistical support. Somewhat similarly, positive
‘unexpected’ underpricing has no discernable effect on post-IPO analyst coverage.
We next estimate the above regressions after taking into consideration whether or not an
analyst has an affiliation with a lead manager underwriting the IPO. The only change to our
11 A concern with our sample is that its latter portion contains a period of time subsequent to the Jumpstart Our Business Startups Act (JOBS Act), which relaxed certain restrictions on analysts with affiliations to IPO underwriters (Lattman and Craig, 2013; Dambra, Field, Gustafson and Pisciotta, forthcoming). To consider the effects on our findings of the JOBS Act, we re-ran equation (3a) after excluding IPOs following its April 5, 2012 date of passage. The results are similar to those we table. The coefficient and z-statistic on PriceRevision is 0.0054 and 8.20, respectively (versus 0.0053 and 8.68 in column 3 of Table 4) and the coefficient and z-statistic on UE(InitialReturn) is 0.0022 and 3.31, respectively (versus 0.0022 and 4.18 in column 3 of Table 4).
19
previous specifications pertains to the dependent variable. Whereas for the equations (1a)
through (4a), the dependent variable is Analysts-Total, we specify Analysts-Affil for equations
(1b) through (4b) and as Analysts-UnAffil for equations (1c) through (4c).
Table 5 presents the results. Per column 1, the extent of post-IPO coverage by affiliated
analysts has a strong association with LeadMgrs and UWRank. The positive coefficient on
LeadMgrs is consistent with Loughran and Ritter’s (2004, p. 9-10) observation that “the number
of managing underwriters in IPO syndicates has increased over time. Investment bankers note
that co-managers are included in a syndicate almost exclusively to provide research coverage.”
Aside from these underwriter covariates, none of the other control variables manifest a
consistent, significant association with affiliated analyst coverage. As for our variables of
interest, the results in columns 2 through 4 also provide no statistical support for a relation
between IPO price formation and affiliated analyst coverage.
In contrast, the drivers of post-IPO coverage by unaffiliated analysts are much different.
Of particular note, and in contrast to the results of estimating equations (1b) through 4(b), the
coefficient on LnValuation is positive and highly significant. In addition, the coefficients on
three of the four covariates pertaining the IPO shares (CAR-3mo, LnVolume-3mo and Inst%-
3mo) are also positive and significant. As for our IPO price formation variables of interest, per
columns 6 through 8, all of the coefficients are greater than their counterparts in Table 4 (e.g.,
the 0.0067 and 0.0030 coefficients on PriceRevision and UE(InitialReturn) in column 7 of Table
5, respectively, exceed those of 0.0053 and 0.0022 in column 3 of Table 4). Overall, consistent
with the descriptive sorts in Table 3, the findings in Table 5 show that the Table 4 findings stem
from unaffiliated analysts coverage.
Collectively, these findings are consistent with the inference that sell-side security
analysts consider institutional investor demand during the book-building process as a key input
into their decision for whether to cover, or not cover, an IPO issuer. If these investors express
weak demand for the shares, which we proxy with downward revision in the offer price, then the
extent of unaffiliated analyst coverage is lower; if, these investors express strong demand, which
20
we proxy with upward revision, then unaffiliated analyst coverage is higher. The latter provides
a rational explanation for why an IPO issuer may acquiesce to partial adjustment of their offer
price in response to strong road show demand. We interpret the relative symmetry of the relation
between IPO offer price revision and the extent of subsequent analyst coverage (i.e., decreases
(increases) in coverage for IPOs with downward (upward) price revision) as support for the
‘anticipation hypothesis’ (Li and You 2015) that analysts choose to cover (not cover) IPO stocks
that they have good reason to expect will have higher (lower) institutional investor recognition.
IPO Price Formation and All-Star Analyst Coverage
As we discuss in Section III, Cliff and Denis (2004) examine a sample of IPOs from 1993
to 2000 that also issue an SEO from 1993 to 2001 and report a positive association between
underpricing and whether the lead underwriter has an Institutional Investor (II) Top 3 All-Star
analyst in the issuer’s industry. They interpret this as support for the ‘analyst lust hypothesis’,
that underpricing serves to compensate the lead underwriter(s) for providing post-IPO analyst
coverage from its highly-ranked analysts. In this section, we re-examine this finding.
We use the All-America Research Team rank from the October issue of II magazine prior
to the IPO year to designate all-star status and track analysts who issue recommendations during
the one-year period following IPO date. As such, in contrast to Cliff and Denis (2004), we
identify whether a given All-Star analyst covers a given IPO issuer. We then replicate the
primary portions of Cliff and Denis’ (2004) Table IV, which presents their main findings. We
supplement what they present with a broader categorization that considers whether an analyst
receives a ‘Runner Up’ designation in II’s rankings as well as showing the frequency of coverage
by unaffiliated All-Star analysts. In panel A, following Cliff and Denis (2004), we sort our
sample into quintiles of InitialReturn; then, in panel B, we sort our sample into the seven
categories of PriceRevision that we shoe in panels B, D and E of Table 3
Per panel A, as with Cliff and Denis (2004), both UWRank and the percent of IPOs with
recommendations by affiliated and unaffiliated analysts increase with InitialReturn. However,
21
none of these patterns exhibit the same range in their sample. For example, whereas they report
that the frequency of coverage by a lead (non-lead) analyst increases from 74.8% (81.4%) for
IPOs in the lowest quintile of underpricing to 85.7% (96.7%) for those in the highest quintile; for
our sample, affiliated coverage increases from 91.9% to 97.7% and unaffiliated coverage
increases from 95.4% to 99.4%. This narrower range is consistent with studies that document an
increase over time in post-IPO analyst coverage (e.g., Bradley et al. 2003; Bradley et al. 2008).
What is more interesting is that we do not find a pattern of increasing coverage by an All-
Star affiliated analyst as underpricing increases. Whereas Cliff and Denis (2004) report that the
frequency of whether a lead underwriter employs a Top 3 All-Star analyst increases from 15.7%
for IPOs in the lowest underpricing quintile to 35.2% for IPOs in the highest quintile; for our
sample, the percent of IPOs with actual coverage by an affiliated Top 3 All Star is 11.6% in the
lowest underpricing quintile, 13.6% in the middle quintile and 11.4% in the highest quintile (i.e.,
an inverted-U pattern that remains evident if we broaden the definition of All-Star to encompass
analysts with a ‘runner-up’ designation). In contrast, we do report some evidence that coverage
by an unaffiliated All-Star increases with underpricing. For example, coverage by Top 3 All-
Stars analyst increases from 1.7% in the lowest quintile to 5.7% in the highest quintile (a pattern
that is linear with our broader definition). Overall, this lack of findings regarding the lack of an
association between affiliated All-Star coverage and underpricing, along with those we report in
columns 2 through 4 of Table 5 pertaining to affiliated coverage in general, are not supportive of
the ‘analyst lust’ hypothesis. This may be because Cliff and Denis’ (2004) findings were
derivative of conflicts of interest involving sell-side analysts and their underwriting colleagues
and that the regulatory changes that have since taken place mitigate such conflicts.
Panel B presents All-Star analyst coverage by our seven categories of PriceRevision. As
for the percent of IPOs with coverage by an affiliated Top 3 All Star, while it does increase from
7.6% for IPOs that price far below the minimum of their range to 12.5% for those that price far
above the maximum (from 12.4% to 21.4% with our broader definition), the path between these
two groups exhibits no obvious pattern across PriceRevision categories. This contrasts with the
22
percent of IPOs with coverage by unaffiliated All Star analysts, which generally increases with
PriceRevision category (particularly so with our broader definition).12
Alternative Channels / Explanations
So far, the results of our analyses show positive associations between unaffiliated analyst
coverage and both PriceRevision and UE(InitialReturn) and that the effects of the former exceed
those of the latter. With respect to the former, we interpret this as consistent with a rational
reason for why issuers may not object to ‘partial adjustment’; and, to the extent PriceRevision is
a measure of institutional investor demand, that analysts cover stocks they have reason to expect
will have high recognition from institutional investors. With respect to the latter, to the extent
UE(InitialReturn) is a measure of institutional and retail demand, that ‘unexpected’ underpricing
reflects this demand and also attracts unaffiliated analysts.
However, all of these analyses take the offer price revision as a given and do not consider
its potentially endogenous nature. As we previously discuss, Willenborg et al. (2015) finds IPOs
with strong operating performance that retain a high fraction of ownership have positive offer
price revisions on average. Following this, an explanation for our PriceRevision results is that
analysts choose (do not choose) to cover IPOs with strong (weak) historical performance because
it portends strong (weak) future performance (Das, et al., 2006; Jung, Wong and Zhang, 2015).
To consider this, we examine whether the PriceRevision / unaffiliated coverage relation varies
with pre-IPO operating cash flow to average assets (OCF/Assets). In addition, and akin to
Aggarwal et al. (2002), our analyses do not consider whether IPO issuers underprice to attract
unaffiliated analyst coverage. Following this, an explanation for our UE(InitialReturn) results
(e.g., the positive coefficient on UE(InitialReturn)– in column eight of Table 5) is that analyst
coverage is lower because managers do not leave (an unexpected amount of) money on the table.
To consider this, we examine whether the relation between UE(InitialReturn) and unaffiliated
analyst coverage varies with the percentage of ownership retention (Retain%). 12 The Pearson correlation between an indicator variable for this broader All-Star status and PriceRevision is 0.13 (significant beyond the 1% level) whereas that between this indicator and UE(InitialReturn) is an insignificant 0.03.
23
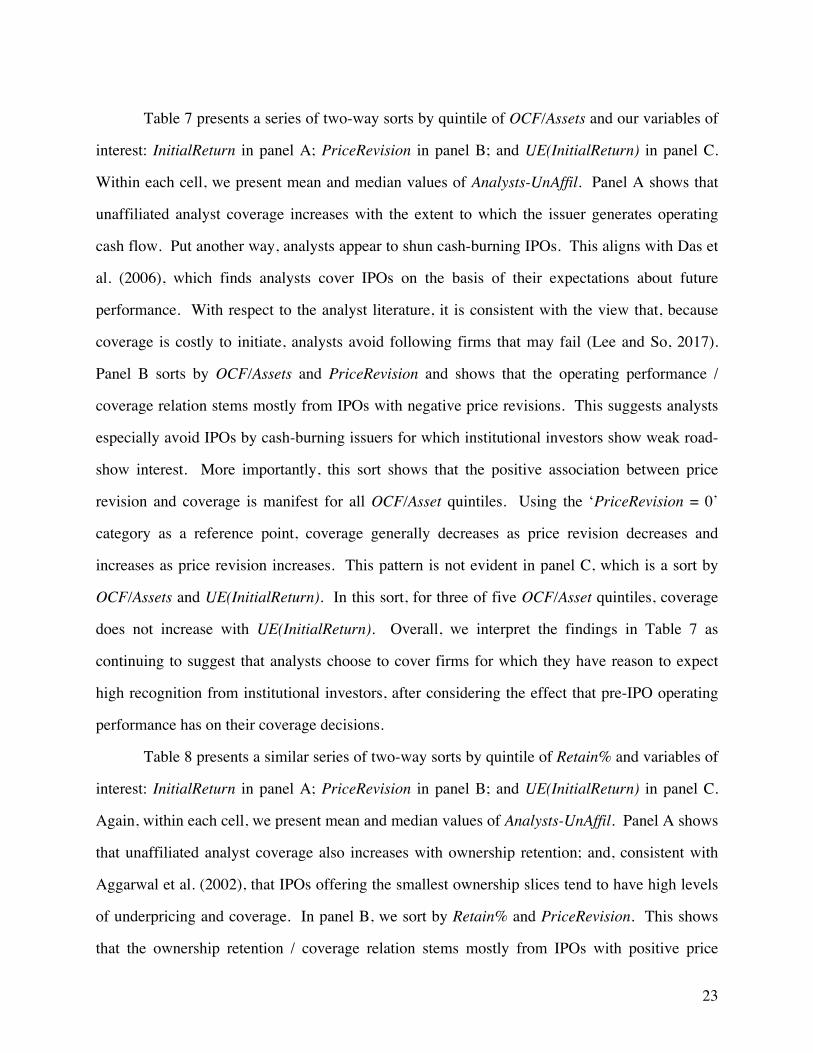
Table 7 presents a series of two-way sorts by quintile of OCF/Assets and our variables of
interest: InitialReturn in panel A; PriceRevision in panel B; and UE(InitialReturn) in panel C.
Within each cell, we present mean and median values of Analysts-UnAffil. Panel A shows that
unaffiliated analyst coverage increases with the extent to which the issuer generates operating
cash flow. Put another way, analysts appear to shun cash-burning IPOs. This aligns with Das et
al. (2006), which finds analysts cover IPOs on the basis of their expectations about future
performance. With respect to the analyst literature, it is consistent with the view that, because
coverage is costly to initiate, analysts avoid following firms that may fail (Lee and So, 2017).
Panel B sorts by OCF/Assets and PriceRevision and shows that the operating performance /
coverage relation stems mostly from IPOs with negative price revisions. This suggests analysts
especially avoid IPOs by cash-burning issuers for which institutional investors show weak road-
show interest. More importantly, this sort shows that the positive association between price
revision and coverage is manifest for all OCF/Asset quintiles. Using the ‘PriceRevision = 0’
category as a reference point, coverage generally decreases as price revision decreases and
increases as price revision increases. This pattern is not evident in panel C, which is a sort by
OCF/Assets and UE(InitialReturn). In this sort, for three of five OCF/Asset quintiles, coverage
does not increase with UE(InitialReturn). Overall, we interpret the findings in Table 7 as
continuing to suggest that analysts choose to cover firms for which they have reason to expect
high recognition from institutional investors, after considering the effect that pre-IPO operating
performance has on their coverage decisions.
Table 8 presents a similar series of two-way sorts by quintile of Retain% and variables of
interest: InitialReturn in panel A; PriceRevision in panel B; and UE(InitialReturn) in panel C.
Again, within each cell, we present mean and median values of Analysts-UnAffil. Panel A shows
that unaffiliated analyst coverage also increases with ownership retention; and, consistent with
Aggarwal et al. (2002), that IPOs offering the smallest ownership slices tend to have high levels
of underpricing and coverage. In panel B, we sort by Retain% and PriceRevision. This shows
that the ownership retention / coverage relation stems mostly from IPOs with positive price
24
revisions. This suggests that analysts are drawn to cover IPOs that portend strong demand from
institutional investors, especially when the issuer has more ownership yet to sell. More
importantly, this sort shows that the positive association between price revision and coverage is
manifest across all Retain% quintiles. Using the ‘PriceRevision = 0’ category as a reference
point, coverage generally decreases as price revision decreases and increases as price revision
increases. Once again, this pattern is not evident in panel C, which sorts by Retain% and
UE(InitialReturn). In this sort, for four of five Retain% quintiles, coverage does not increase
with UE(InitialReturn). The exception is quintile 5, which shows a sharp increase in coverage
for IPOs that retain a high level of ownership and sustain high unexpected underpricing. This
suggests that the effect Aggarwal et al. (2002) document holds after considering the effect of
price revision on underpricing. Overall, the findings in Table 8 suggest that analysts choose to
cover firms for which they have reason to expect high recognition from institutional investors,
after considering any effects that ownership retention may have on their coverage decisions.
V. CONCLUSION
In this paper, we re-visit the origin of analyst following by re-examining the association
between IPO underpricing and analyst coverage. The main focus of our analysis highlights that a
portion of IPO underpricing is expected, as it likely reflects revealed institutional demand; while
a portion is unexpected, as it likely reflects retail demand and residual institutional demand. We
find that the expected portion of underpricing is highly, positively correlated with unaffiliated
analyst following, and posit that this relationship provides a potential rational explanation for
why IPO’s do not fully-upwardly price adjust.
We also provide evidence on other indicators at the IPO date that portend increased
analyst following. Specifically, we find that analysts tend to follow IPO’s that have relatively
larger retained ownership and to avoid cash burners. These results reinforce the idea that IPOs
with larger retained ownership are more likely to be better performers in the future, and that cash
burners represent riskier companies, which analysts tend to avoid.
25
Our results are likely to be important to the broad set of papers analyzing factors
affecting analysts’ decisions to follow firms, as well as factors affecting owners’ incentives to
underprice. In the IPO setting, there is a clear delineation as to the timing of events. Firm
characteristics, like retained ownership and cash burn, are provided to market participants prior
to the revelation of investor demand. Then during the book building process, analysts can
observe the revealed demand of institutional investors, followed by the revelation of retail
demand on IPO date. These features of the IPO market provide a nice setting to investigate
whether analyst following derives from institutional or retail demand.
Researchers have long debated why owners are willing to ‘leave money on the table’ by
allowing underwriters to offer a relatively low IPO price. Our paper suggests that a portion of
this underpricing reflects unexpectedly large institutional demand that occurs during the road
show, and this institutional demand is accompanied by analyst following, which seems likely to
ultimately benefit the owners.
26
REFERENCES
Aggarwal, R., L. Krigman and K. Womack. 2002. Strategic IPO underpricing, information momentum and lockup expiration selling. Journal of Financial Economics 66: 105-137.
Benveniste, L. M. and P. A. Spindt. 1989. How investment bankers determine the offer price and allocation of new issues. Journal of Financial Economics 24: 213-232.
Brau, J. C. and S. Fawcett. 2006. Initial public offerings: An analysis of theory and practice. The Journal of Finance 61: 399-436.
Bradley, D. J., B. D. Jordan and J. R. Ritter. 2003. The quiet period goes out with a bang. The Journal of Finance 58: 1-36.
Bradley, D. J., B. D. Jordan and J. R. Ritter. 2008. Analyst behavior following IPOs: The “bubble period” evidence. The Review of Financial Studies 21: 101-133.
Bradshaw, M., Y. Ertimur and P. O’Brien. 2016. Financial analysts and their contribution to well-functioning capital markets. Foundations and Trends in Accounting 11: 119-191.
Carter, R., F. Dark and A. Singh. 1998. Underwriter reputation, initial returns, and the long-run performance of IPO stocks. The Journal of Finance 53: 285-311.
Cliff, M. T. and D. J. Denis. 2004. Do initial public offering firms purchase analyst coverage with underpricing? The Journal of Finance 59: 2871-2901.
Dambra, M., L. Casares Field, M. Gustafson and K. Pisciotta. Forthcoming. The consequences to analyst involvement in the IPO process: Evidence surrounding the JOBS Act. Journal of Accounting and Economics.
Das, S., R-J. Guo and H. Zhang. Analysts’ selective coverage and subsequent performance of newly public firms. The Journal of Finance 61: 1159-1185.
Degeorge, F., F. Derrien and K. L. Womack. 2010. Auctioned IPOs: The US evidence. Journal of Financial Economics 98: 177-194.
Edelen, R. M. and G. B. Kadlec. 2005. Issuer surplus and the partial adjustment of IPO prices to public information. Journal of Financial Economics 77: 347-373.
Hanley, K. W. 1993. The underpricing of initial public offerings and the partial adjustment phenomenon. Journal of Financial Economics 34: 231-250.
Hansen, R. S. 2015. What is the value of sell-side analysts? Evidence from coverage changes – A discussion. Journal of Accounting and Economics 60: 58-64.
James, C. and J. Karceski. 2006. Strength of analyst coverage following IPOs. Journal of Financial Economics 82: 1-34.

27
Jung, M. J., M. H. F. Wong and X. F. Zhang. 2015. Analyst interest as an early indicator of firm fundamental changes and stock returns. The Accounting Review 90: 1049-1078.
Kahneman, D. and A. Tversky. 1979. Prospect theory: An analysis of decision under risk. Econometrica 47: 263-291.
Lattman, P. and S. Craig. 2013. With IPOs on the rise, analysts get new scrutiny. The New York Times (August 11).
Lee, C. and E. So. 2017. Uncovering expected returns: Information in analyst coverage proxies. Journal of Financial Economics 124: 331-348.
Leland, H. and D. Pyle. “Informational asymmetries, financial structure and financial intermediation.” The Journal of Finance 32 (1977): 371-387.
Li, K. and H. You. 2015. What is the value of sell-side analysts? Evidence from coverage initiations and terminations. Journal of Accounting and Economics 60: 141-160.
Liu, X. and J. Ritter. 2002. Local underwriter oligopolies and IPO underpricing. Journal of Financial Economics 102: 579-601.
Loughran, T. and J. R. Ritter. 2002. Why don’t issuers get upset about leaving money on the table in IPOs? Review of Financial Studies 15: 413-443.
Loughran, T. and J. R. Ritter. 2004. Why has IPO underpricing changed over time? Financial Management 33: 5-37.
Lowry, M. and W. Schwert. 2004. Is the IPO pricing process efficient? Journal of Financial Economics 71: 3-26.
O’Brien, P. C. and H. Tan. 2015. Geographic proximity and analyst coverage decisions: Evidence from IPOs. Journal of Accounting and Economics 59: 41-59.
Rajan, R. and H. Servaes. 1997. Analyst following of initial public offerings. The Journal of Finance 52: 507-529.
Ritter, J. 2011. Equilibrium in the Initial Public Offering market. Annual Review of Financial Economics 3: 347-374.
Rock, K. 1986. Why new issues are underpriced. Journal of Financial Economics 15: 187-212.
Rock, S., S. Sedo and M. Willenborg. 2001. Analyst following and count-data econometrics. Journal of Accounting and Economics 30: 351-373.
Willenborg, M., B. Wu and Y. S. Yang. 2015. Issuer operating performance and IPO price formation. Journal of Accounting Research 53: 1109-1149.
28
TABLE 1 Sample and Descriptive Statistics
Panel A: Sample Firm commitment IPOs by non-financial, U.S. companies from May 10, 2002 to December 31, 2013 1,102 Less: Unit IPOs 140 Necessary financial statement information not available 57 Issued via auction mechanism 13 Initial price range mid-point ≤ $5.00 10 Days from initial range date to IPO date exceed 365 4 Full Sample 878 Panel B: Descriptive statistics
Variable Mean Median Standard deviation Analysts-Total 7.45 7.00 4.70 Analysts-Affil 2.17 2.00 1.46 Analysts-UnAffil 5.28 4.00 4.03 InitialReturn 14.64 9.09 21.90 PriceRevision –4.78 0.00 22.29 UE(InitialReturn) 0.00 –3.34 18.60 LeadMgrs 2.31 2.00 1.42 UWRank 7.97 8.50 1.43 VC 0.53 1.00 0.50 Age 20.01 10.00 25.14 HighTech 0.27 0.00 0.45 Valuation 855.06 370.12 2,658.67 CAR-3mo 4.21 3.77 28.03 Volume-3mo 351.17 149.70 1,630.43 Inst#-3mo 40.23 36.50 31.65 Inst%-3mo 32.48 27.28 24.15
Variable definitions (data source in parentheses): Analysts-Total = Number of analysts issuing recommendations for the issuer within 12 months post IPO (IBES) Analysts-Affil = Number of analysts with affiliation to a lead manager that issue a recommendation for the
issuer within 12 months post IPO (IBES) Analysts-UnAffil = Number of analysts without affiliation to a lead manager that issue a recommendation for the
issuer within 12 months post IPO (IBES) InitialReturn = (Closing price on first trading day – IPO price) ÷ IPO price, in percentage (CRSP and final
prospectus) PriceRevision = (IPO price – Mid-point of initial price range) ÷ Mid-point of initial price range, in percentage
(Final prospectus and prospectus disclosing the initial price range) UE(InitialReturn) = Residuals from regressing InitialReturn on PriceRevision LeadMgrs = Number of lead managers (SDC) UWRank = Underwriter rank (Carter, Dark and Singh (1998) and Loughran and Ritter (2004)) VC = One if issuer has venture capital backing (SDC), zero otherwise Age = Number of years from founding or incorporation to IPO year (Final prospectus) HighTech = One if issuer is a high technology company (SDC), zero otherwise
29
Variable definitions (data source in parentheses): Valuation = Mid-point of initial price range * Number of post-IPO shares outstanding, in millions of
dollars (Prospectus disclosing the initial price range) CAR-3mo = Cumulative abnormal return (per the value-weighted market return) from 2nd post-IPO day to
3 months post IPO, in percentage (CRSP) Volume-3mo = Average daily volume during the first 3 months post IPO, in thousands of shares (CRSP) Inst#-3mo = Number of institutional investors holding the issuer’s shares within 3 months post IPO
(Thompson Reuters) Inst%-3mo = Percentage of issuer’s shares held by institutional investors within 3 months post IPO
(Thompson Reuters)
30
TABLE 2 Pearson Correlations
Analysts-
Total
Analysts
-Affil
Analysts-UnAffil
Initial Return
Price
Revision
UE (Initial Return)
Lead Mgrs
UW
Rank
VC
Ln Age
High Tech
Ln
Valuation
CAR -3mo
LnVolume
-3mo
LnInst# -3mo
Analysts-Affil 0.58 (<0.00)
Analysts- UnAffil
0.96 (<0.00)
0.32 (<0.00)
InitialReturn 0.30 (<0.00)
0.08 (0.02)
0.32 (<0.00)
PriceRevision 0.38 (<0.00)
0.14 (<0.00)
0.39 (<0.00)
0.53 (<0.00)
UE (InitialReturn)
0.12 (<0.00)
0.00 (0.90)
0.14 (<0.00)
0.85 (<0.00)
0.00 (1.00)
LeadMgrs 0.54 (<0.00)
0.90 (<0.00)
0.30 (<0.00)
0.05 (0.13)
0.09 (0.01)
0.01 (0.85)
UWRank 0.37 (<0.00)
0.29 (<0.00)
0.32 (<0.00)
0.14 (<0.00)
0.19 (<0.00)
0.04 (0.19)
0.21 (<0.00)
VC –0.02 (0.54)
–0.16 (<0.00)
0.03 (0.30)
0.15 (<0.00)
–0.01 (0.87)
0.18 (<0.00)
–0.18 (<0.00)
0.10 (<0.00)
LnAge 0.04 (0.25)
0.25 (<0.00)
–0.04 (0.19)
–0.08 (0.02)
0.02 (0.52)
–0.11 (<0.00)
0.25 (<0.00)
0.12 (<0.00)
–0.49 (<0.00)
HighTech 0.20 (<0.00)
0.00 (0.98)
0.23 (<0.00)
0.16 (<0.00)
0.22 (<0.00)
0.05 (0.11)
–0.05 (0.16)
0.13 (<0.00)
0.19 (<0.00)
–0.15 (<0.00)
LnValuation 0.67 (<0.00)
0.64 (<0.00)
0.55 (<0.00)
0.12 (<0.00)
0.22 (<0.00)
0.01 (0.76)
0.65 (<0.00)
0.51 (<0.00)
–0.21 (<0.00)
0.25 (<0.00)
0.01 (0.81)
CAR-3mo 0.07 (0.04)
0.03 (0.37)
0.07 (0.04)
0.04 (0.26)
–0.07 (0.05)
0.09 (0.01)
0.01 (0.80)
0.05 (0.12)
–0.00 (0.93)
–0.03 (0.43)
0.03 (0.32)
–0.01 (0.85)
LnVolume-3mo 0.64 (<0.00)
0.51 (<0.00)
0.56 (<0.00)
0.28 (<0.00)
0.47 (<0.00)
0.04 (0.29)
0.49 (<0.00)
0.40 (<0.00)
–0.19 (<0.00)
0.20 (<0.00)
0.09 (<0.00)
0.74 (<0.00)
0.08 (0.02)
LnInst#-3mo 0.35 (<0.00)
0.27 (<0.00)
0.31 (<0.00)
0.25 (<0.00)
0.37 (<0.00)
0.07 (0.05)
0.24 (<0.00)
0.33 (<0.00)
–0.13 (<0.00)
0.19 (<0.00)
0.05 (0.15)
0.44 (<0.00)
0.04 (0.23)
0.47 (<0.00)
Inst%-3mo 0.19 (<0.00)
0.24 (<0.00)
0.14 (<0.00)
0.01 (0.70)
0.06 (0.06)
–0.02 (0.47)
0.25 (<0.00)
0.17 (<0.00)
–0.24 (<0.00)
0.26 (<0.00)
–0.09 (0.01)
0.27 (<0.00)
0.01 (0.80)
0.23 (<0.00)
0.55 (<0.00)
Observations are 878 firm-commitment share IPOs from May 10, 2002 to December 31, 2013 by non-financial, U.S. companies. To accord with the regression specifications, we present correlations for the natural logarithm of Age, Valuation, Volume-3mo, and Inst#-3mo. See Table 1 for variable definitions.
31
TABLE 3 Analyst Coverage by IPO Price Formation
Panel A: Analyst Coverage by InitialReturn (categories per Rajan and Servaes, 1997)
InitialReturn < 0 InitialReturn = 0 0 < InitialReturn ≤ 15.51%* 15.51%* < InitialReturn Full Sample n 173 55 325 325 878
InitialReturn mean median
–6.72 –5.00
0.00 0.00
6.67 6.25
36.45 28.90
14.64 9.09
Analysts-Total mean median
6.03 5.00
5.96 5.00
7.18 6.00
8.73 8.00
7.45 7.00
Analysts-Affil mean median
2.01 2.00
1.76 2.00
2.29 2.00
2.20 2.00
2.17 2.00
Analysts-UnAffil mean median
4.02 3.00
4.20 4.00
4.89 4.00
6.54 5.00
5.28 4.00
Panel B: Analyst Coverage by PriceRevision (categories per the Initial Price Range, IPR) IPO price < Initial Price Range IPO price is within Initial Price Range Initial Price Range < IPO price
PriceRevision < –25.00%**
–25.00%** ≤ PriceRevision < IPR minimum
IPR minimum ≤
PriceRevision < 0
PriceRevision
= 0
0 < PriceRevision ≤ IPR maximum
IPR maximum < PriceRevision ≤
16.67***
PriceRevision
> 16.67***
Full
Sample n 145 169 106 98 133 115 112 878
PriceRevision mean median
–40.25 –37.14
–18.38 –18.75
–7.36 –6.90
0.00 0.00
6.48 6.67
12.69 13.33
28.61 23.76
–4.78 0.00
Analysts-Total mean median
5.37 5.00
6.70 6.00
5.74 5.00
6.79 6.00
8.14 7.00
8.52 8.00
11.55 10.00
7.45 7.00
Analysts-Affil mean median
1.78 2.00
2.22 2.00
1.84 1.50
2.02 2.00
2.47 2.00
2.34 2.00
2.47 2.00
2.17 2.00
Analysts-UnAffil mean median
3.59 3.00
4.48 4.00
3.90 3.00
4.77 4.00
5.67 5.00
6.18 5.00
9.08 7.00
5.28 4.00
Panel C: Analyst Coverage by UE(InitialReturn) quartile
Quartile 1 Quartile 2 Quartile 3 Quartile 4 Full Sample n 220 219 220 219 878
UE(InitialReturn) mean median
–19.23 –16.96
–7.54 –7.58
2.17 2.39
24.67 19.49
0.00 –3.33
Analysts-Total mean median
7.21 6.00
7.32 7.00
7.01 6.00
8.26 7.00
7.45 7.00
Analysts-Affil mean median
2.30 2.00
2.23 2.00
1.99 2.00
2.15 2.00
2.17 2.00
Analysts-UnAffil mean median
4.91 4.00
5.09 4.00
5.03 4.00
6.11 5.00
5.28 4.00
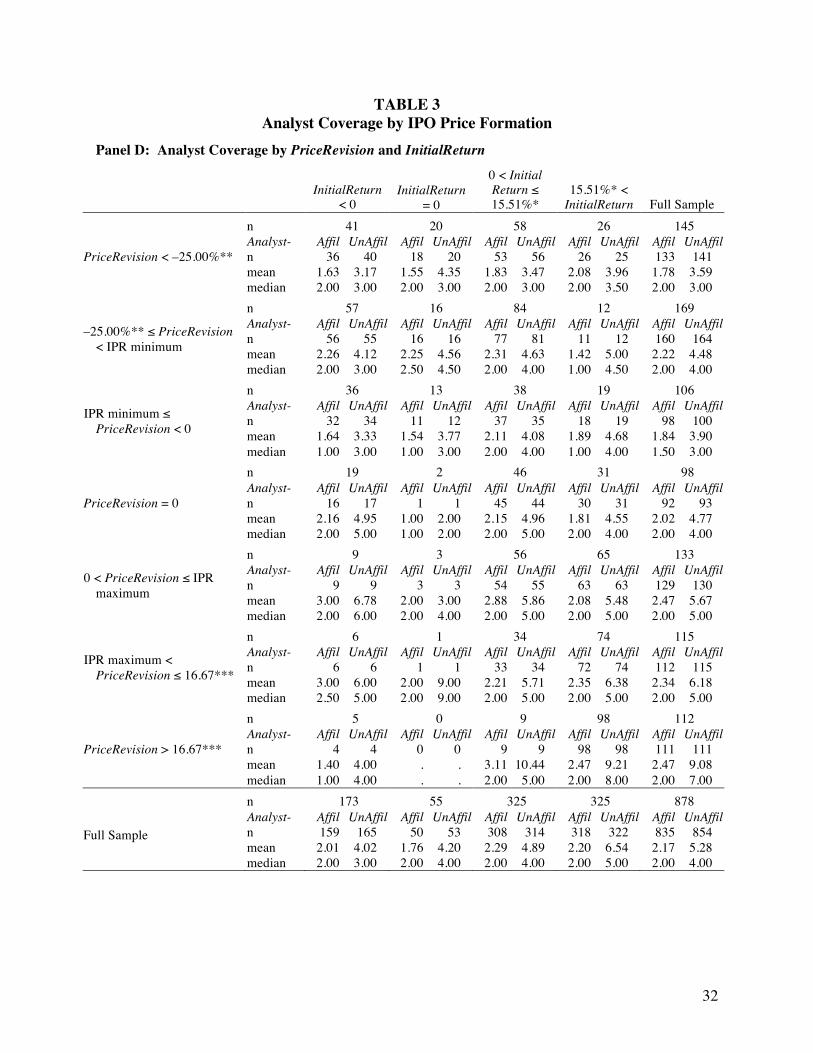
32
TABLE 3 Analyst Coverage by IPO Price Formation
Panel D: Analyst Coverage by PriceRevision and InitialReturn
InitialReturn
< 0
InitialReturn
= 0
0 < Initial Return ≤ 15.51%*
15.51%* <
InitialReturn
Full Sample PriceRevision < –25.00%**
n Analyst- n mean median
41 Affil UnAffil 36 40 1.63 3.17 2.00 3.00
20 Affil UnAffil 18 20 1.55 4.35 2.00 3.00
58 Affil UnAffil 53 56 1.83 3.47 2.00 3.00
26 Affil UnAffil 26 25 2.08 3.96 2.00 3.50
145 Affil UnAffil 133 141 1.78 3.59 2.00 3.00
–25.00%** ≤ PriceRevision < IPR minimum
n Analyst- n mean median
57 Affil UnAffil 56 55 2.26 4.12 2.00 3.00
16 Affil UnAffil 16 16 2.25 4.56 2.50 4.50
84 Affil UnAffil 77 81 2.31 4.63 2.00 4.00
12 Affil UnAffil 11 12 1.42 5.00 1.00 4.50
169 Affil UnAffil 160 164 2.22 4.48 2.00 4.00
IPR minimum ≤ PriceRevision < 0
n Analyst- n mean median
36 Affil UnAffil 32 34 1.64 3.33 1.00 3.00
13 Affil UnAffil 11 12 1.54 3.77 1.00 3.00
38 Affil UnAffil 37 35 2.11 4.08 2.00 4.00
19 Affil UnAffil 18 19 1.89 4.68 1.00 4.00
106 Affil UnAffil 98 100 1.84 3.90 1.50 3.00
PriceRevision = 0
n Analyst- n mean median
19 Affil UnAffil 16 17 2.16 4.95 2.00 5.00
2 Affil UnAffil 1 1 1.00 2.00 1.00 2.00
46 Affil UnAffil 45 44 2.15 4.96 2.00 5.00
31 Affil UnAffil 30 31 1.81 4.55 2.00 4.00
98 Affil UnAffil 92 93 2.02 4.77 2.00 4.00
0 < PriceRevision ≤ IPR maximum
n Analyst- n mean median
9 Affil UnAffil 9 9 3.00 6.78 2.00 6.00
3 Affil UnAffil 3 3 2.00 3.00 2.00 4.00
56 Affil UnAffil 54 55 2.88 5.86 2.00 5.00
65 Affil UnAffil 63 63 2.08 5.48 2.00 5.00
133 Affil UnAffil 129 130 2.47 5.67 2.00 5.00
IPR maximum < PriceRevision ≤ 16.67***
n Analyst- n mean median
6 Affil UnAffil 6 6 3.00 6.00 2.50 5.00
1 Affil UnAffil 1 1 2.00 9.00 2.00 9.00
34 Affil UnAffil 33 34 2.21 5.71 2.00 5.00
74 Affil UnAffil 72 74 2.35 6.38 2.00 5.00
115 Affil UnAffil 112 115 2.34 6.18 2.00 5.00
PriceRevision > 16.67***
n Analyst- n mean median
5 Affil UnAffil 4 4 1.40 4.00 1.00 4.00
0 Affil UnAffil 0 0 . . . .
9 Affil UnAffil 9 9 3.11 10.44 2.00 5.00
98 Affil UnAffil 98 98 2.47 9.21 2.00 8.00
112 Affil UnAffil 111 111 2.47 9.08 2.00 7.00
Full Sample
n Analyst- n mean median
173 Affil UnAffil 159 165 2.01 4.02 2.00 3.00
55 Affil UnAffil 50 53 1.76 4.20 2.00 4.00
325 Affil UnAffil 308 314 2.29 4.89 2.00 4.00
325 Affil UnAffil 318 322 2.20 6.54 2.00 5.00
878 Affil UnAffil 835 854 2.17 5.28 2.00 4.00
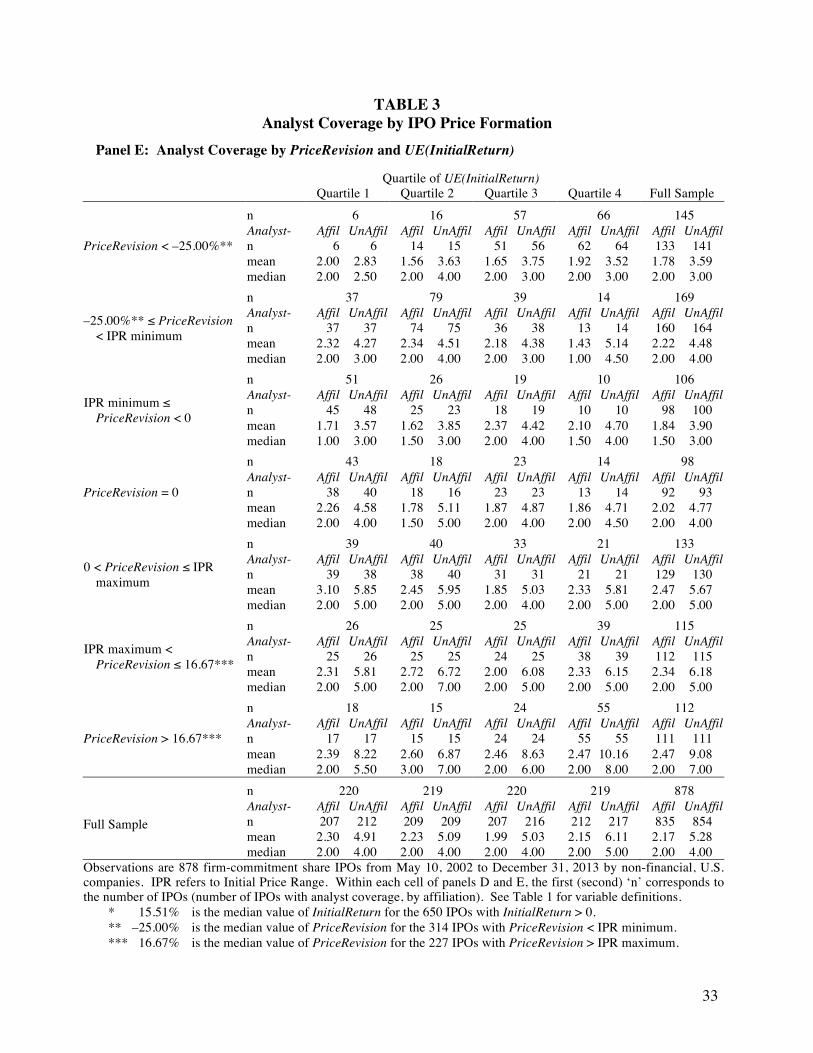
33
TABLE 3 Analyst Coverage by IPO Price Formation
Panel E: Analyst Coverage by PriceRevision and UE(InitialReturn)
Quartile of UE(InitialReturn) Quartile 1 Quartile 2 Quartile 3 Quartile 4 Full Sample
PriceRevision < –25.00%**
n Analyst- n mean median
6 Affil UnAffil 6 6 2.00 2.83 2.00 2.50
16 Affil UnAffil 14 15 1.56 3.63 2.00 4.00
57 Affil UnAffil 51 56 1.65 3.75 2.00 3.00
66 Affil UnAffil 62 64 1.92 3.52 2.00 3.00
145 Affil UnAffil 133 141 1.78 3.59 2.00 3.00
–25.00%** ≤ PriceRevision < IPR minimum
n Analyst- n mean median
37 Affil UnAffil 37 37 2.32 4.27 2.00 3.00
79 Affil UnAffil 74 75 2.34 4.51 2.00 4.00
39 Affil UnAffil 36 38 2.18 4.38 2.00 3.00
14 Affil UnAffil 13 14 1.43 5.14 1.00 4.50
169 Affil UnAffil 160 164 2.22 4.48 2.00 4.00
IPR minimum ≤ PriceRevision < 0
n Analyst- n mean median
51 Affil UnAffil 45 48 1.71 3.57 1.00 3.00
26 Affil UnAffil 25 23 1.62 3.85 1.50 3.00
19 Affil UnAffil 18 19 2.37 4.42 2.00 4.00
10 Affil UnAffil 10 10 2.10 4.70 1.50 4.00
106 Affil UnAffil 98 100 1.84 3.90 1.50 3.00
PriceRevision = 0
n Analyst- n mean median
43 Affil UnAffil 38 40 2.26 4.58 2.00 4.00
18 Affil UnAffil 18 16 1.78 5.11 1.50 5.00
23 Affil UnAffil 23 23 1.87 4.87 2.00 4.00
14 Affil UnAffil 13 14 1.86 4.71 2.00 4.50
98 Affil UnAffil 92 93 2.02 4.77 2.00 4.00
0 < PriceRevision ≤ IPR maximum
n Analyst- n mean median
39 Affil UnAffil 39 38 3.10 5.85 2.00 5.00
40 Affil UnAffil 38 40 2.45 5.95 2.00 5.00
33 Affil UnAffil 31 31 1.85 5.03 2.00 4.00
21 Affil UnAffil 21 21 2.33 5.81 2.00 5.00
133 Affil UnAffil 129 130 2.47 5.67 2.00 5.00
IPR maximum < PriceRevision ≤ 16.67***
n Analyst- n mean median
26 Affil UnAffil 25 26 2.31 5.81 2.00 5.00
25 Affil UnAffil 25 25 2.72 6.72 2.00 7.00
25 Affil UnAffil 24 25 2.00 6.08 2.00 5.00
39 Affil UnAffil 38 39 2.33 6.15 2.00 5.00
115 Affil UnAffil 112 115 2.34 6.18 2.00 5.00
PriceRevision > 16.67***
n Analyst- n mean median
18 Affil UnAffil 17 17 2.39 8.22 2.00 5.50
15 Affil UnAffil 15 15 2.60 6.87 3.00 7.00
24 Affil UnAffil 24 24 2.46 8.63 2.00 6.00
55 Affil UnAffil 55 55 2.47 10.16 2.00 8.00
112 Affil UnAffil 111 111 2.47 9.08 2.00 7.00
Full Sample
n Analyst- n mean median
220 Affil UnAffil 207 212 2.30 4.91 2.00 4.00
219 Affil UnAffil 209 209 2.23 5.09 2.00 4.00
220 Affil UnAffil 207 216 1.99 5.03 2.00 4.00
219 Affil UnAffil 212 217 2.15 6.11 2.00 5.00
878 Affil UnAffil 835 854 2.17 5.28 2.00 4.00
Observations are 878 firm-commitment share IPOs from May 10, 2002 to December 31, 2013 by non-financial, U.S. companies. IPR refers to Initial Price Range. Within each cell of panels D and E, the first (second) ‘n’ corresponds to the number of IPOs (number of IPOs with analyst coverage, by affiliation). See Table 1 for variable definitions.
* 15.51% is the median value of InitialReturn for the 650 IPOs with InitialReturn > 0. ** –25.00% is the median value of PriceRevision for the 314 IPOs with PriceRevision < IPR minimum. *** 16.67% is the median value of PriceRevision for the 227 IPOs with PriceRevision > IPR maximum.
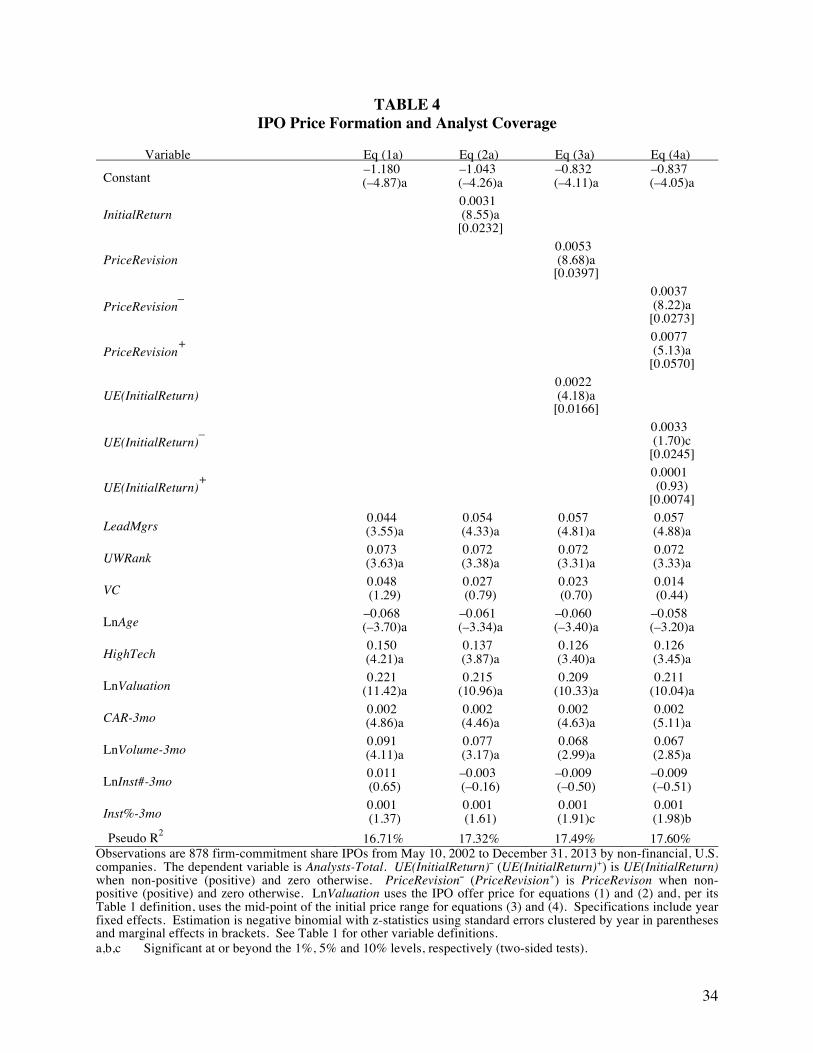
34
TABLE 4 IPO Price Formation and Analyst Coverage
Variable Eq (1a) Eq (2a) Eq (3a) Eq (4a)
Constant –1.180 (–4.87)a
–1.043 (–4.26)a
–0.832 (–4.11)a
–0.837 (–4.05)a
InitialReturn 0.0031
(8.55)a [0.0232]
PriceRevision 0.0053
(8.68)a [0.0397]
PriceRevision– 0.0037 (8.22)a
[0.0273]
PriceRevision+ 0.0077 (5.13)a
[0.0570]
UE(InitialReturn) 0.0022
(4.18)a [0.0166]
UE(InitialReturn)– 0.0033 (1.70)c
[0.0245]
UE(InitialReturn)+ 0.0001 (0.93)
[0.0074]
LeadMgrs 0.044 (3.55)a
0.054 (4.33)a
0.057 (4.81)a
0.057 (4.88)a
UWRank 0.073 (3.63)a
0.072 (3.38)a
0.072 (3.31)a
0.072 (3.33)a
VC 0.048 (1.29)
0.027 (0.79)
0.023 (0.70)
0.014 (0.44)
LnAge –0.068 (–3.70)a
–0.061 (–3.34)a
–0.060 (–3.40)a
–0.058 (–3.20)a
HighTech 0.150 (4.21)a
0.137 (3.87)a
0.126 (3.40)a
0.126 (3.45)a
LnValuation 0.221 (11.42)a
0.215 (10.96)a
0.209 (10.33)a
0.211 (10.04)a
CAR-3mo 0.002 (4.86)a
0.002 (4.46)a
0.002 (4.63)a
0.002 (5.11)a
LnVolume-3mo 0.091 (4.11)a
0.077 (3.17)a
0.068 (2.99)a
0.067 (2.85)a
LnInst#-3mo 0.011 (0.65)
–0.003 (–0.16)
–0.009 (–0.50)
–0.009 (–0.51)
Inst%-3mo 0.001 (1.37)
0.001 (1.61)
0.001 (1.91)c
0.001 (1.98)b
Pseudo R2 16.71% 17.32% 17.49% 17.60% Observations are 878 firm-commitment share IPOs from May 10, 2002 to December 31, 2013 by non-financial, U.S. companies. The dependent variable is Analysts-Total. UE(InitialReturn)– (UE(InitialReturn)+) is UE(InitialReturn) when non-positive (positive) and zero otherwise. PriceRevision– (PriceRevision+) is PriceRevison when non-positive (positive) and zero otherwise. LnValuation uses the IPO offer price for equations (1) and (2) and, per its Table 1 definition, uses the mid-point of the initial price range for equations (3) and (4). Specifications include year fixed effects. Estimation is negative binomial with z-statistics using standard errors clustered by year in parentheses and marginal effects in brackets. See Table 1 for other variable definitions. a,b,c Significant at or beyond the 1%, 5% and 10% levels, respectively (two-sided tests).

35
TABLE 5 IPO Price Formation and Analyst Coverage – by Affiliation
Affiliated Analysts Unaffiliated Analysts Variable Eq (1b) Eq (2b) Eq (3b) Eq (4b) Eq (1c) Eq (2c) Eq (3c) Eq(4c)
Constant –0.976 (–6.42)a
–0.959 (–6.15)a
–0.903 (–5.70)a
–0.898 (–5.94)a
–2.125 (–6.60)a
–1.933 (–5.63)a
–1.688 (–5.56)a
–1.689 (–5.56)a
InitialReturn 0.0005 (1.12)
[0.0010]
0.0039 (9.36)a
[0.0206]
PriceRevision 0.0008 (0.98)
[0.0017]
0.0067 (8.65)a
[0.0357]
PriceRevision– 0.0009 (0.77)
[0.0020]
0.0052 (5.97)
[0.0274]
PriceRevision+ 0.0002 (0.23)
[0.0005]
0.0092 (5.07)a
[0.0488]
UE-InitialReturn 0.0002 (0.27)
[0.0004]
0.0030 (4.79)a
[0.0159]
UE(InitialReturn)– –0.0014 (–0.85)
[–0.0031]
0.0053 (2.24)b
[0.0281]
UE(InitialReturn)+ 0.0012 (0.78)
[0.0025]
0.0011 (0.85)
[0.0057]
LeadMgrs 0.221 (9.84)a
0.222 (9.73)a
0.224 (10.04)a
0.225 (10.04)a
–0.053 (–3.44)a
–0.039 (–2.56)b
–0.035 (–2.32)b
–0.035 (–2.28)b
UWRank 0.109 (7.12)a
0.109 (7.08)a
0.109 (7.14)a
0.109 (6.99)a
0.056 (1.98)b
0.056 (1.88)c
0.056 (1.86)c
0.055 (1.86)c
VC –0.054 (–1.64)c
–0.056 (–1.72)c
–0.056 (–1.68)c
–0.055 (–1.62)
0.090 (1.86)c
0.063 (1.37)
0.057 (1.29)
0.048 (1.07)
LnAge 0.006 (0.33)
0.006 (0.40)
0.007 (0.41)
0.008 (0.48)
–0.105 (–4.16)a
–0.097 (–3.89)a
–0.096 (–3.94)a
–0.095 (–3.87)a
HighTech 0.027 (1.38)
0.025 (1.30)
0.021 (1.14)
0.022 (1.11)
0.203 (4.47)a
0.185 (3.93)a
0.173 (3.52)a
0.172 (3.58)a
LnValuation 0.004 (0.18)
0.004 (0.16)
–0.002 (–0.09)
–0.002 (–0.07)
0.322 (13.03)a
0.314 (12.41)a
0.308 (11.83)a
0.309 (11.84)a
CAR-3mo 0.001 (1.19)
0.001 (1.17)
0.001 (1.33)
0.001 (1.37)
0.003 (3.89)a
0.003 (3.69)a
0.003 (3.86)a
0.003 (4.01)a
LnVolume-3mo 0.024 (1.23)
0.022 (1.15)
0.021 (1.16)
0.017 (0.85)
0.115 (3.90)a
0.096 (2.87)a
0.085 (2.67)a
0.087 (2.63)a
LnInst#-3mo 0.018 (0.89)
0.016 (0.79)
0.014 (0.73)
0.016 (0.80)
0.012 (0.60)
–0.001 (–0.27)
–0.011 (–0.52)
–0.013 (–0.59)
Inst%-3mo –0.000 (–0.40)
–0.000 (–0.32)
–0.000 (–0.22)
–0.000 (–0.30)
0.001 (1.78)c
0.001 (2.00)b
0.001 (2.09)b
0.001 (2.17)b
Pseudo R2 18.08% 18.09% 18.09% 18.11% 13.03% 13.57% 13.70% 13.79% Observations are 878 firm-commitment share IPOs from May 10, 2002 to December 31, 2013 by non-financial, U.S. companies. The dependent variable is Analysts-Affil for equations (1b) – (4b) and Analysts-UnAffil for equations (1c) – (4c). Specifications include fixed effects for year. Estimation is negative binomial with z-statistics using standard errors clustered by year in parentheses and marginal effects in brackets. See Tables 1 and 4 for variable definitions. a,b,c Significant at or beyond the 1%, 5% and 10% levels, respectively (two-sided tests).
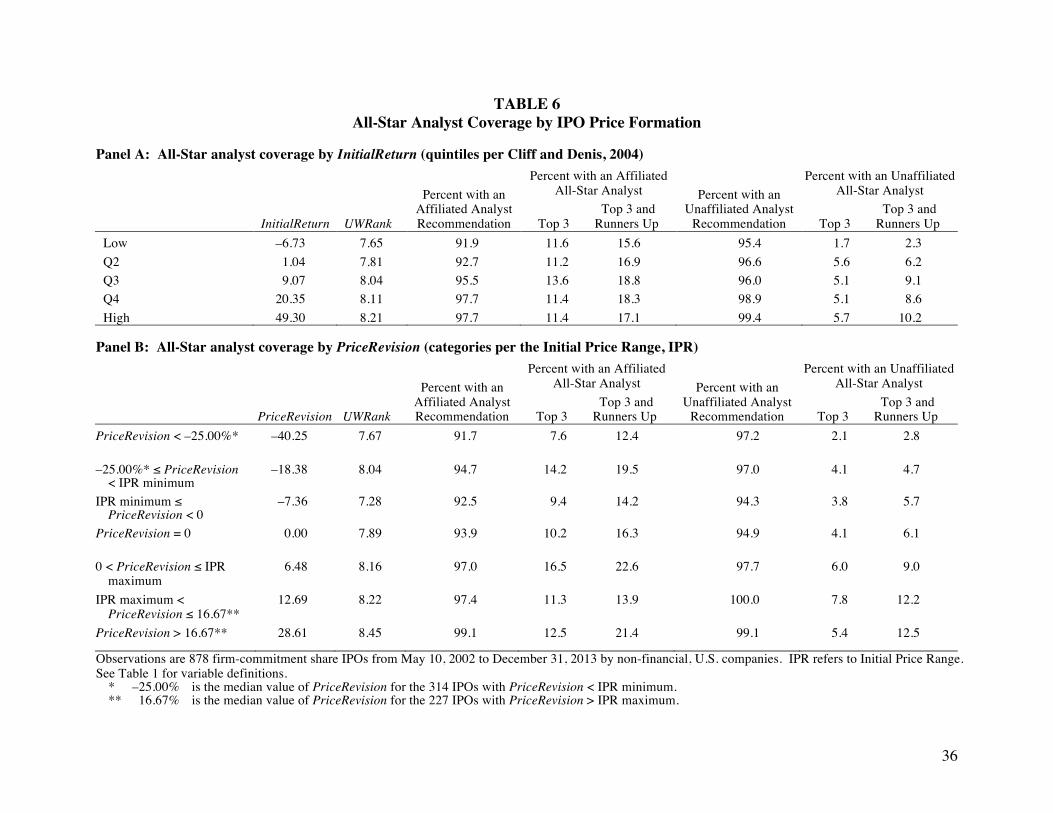
36
TABLE 6 All-Star Analyst Coverage by IPO Price Formation
Panel A: All-Star analyst coverage by InitialReturn (quintiles per Cliff and Denis, 2004)
InitialReturn
UWRank
Percent with an Affiliated Analyst Recommendation
Percent with an Affiliated All-Star Analyst
Top 3 and Top 3 Runners Up
Percent with an Unaffiliated Analyst
Recommendation
Percent with an Unaffiliated All-Star Analyst
Top 3 and Top 3 Runners Up
Low –6.73 7.65 91.9 11.6 15.6 95.4 1.7 2.3 Q2 1.04 7.81 92.7 11.2 16.9 96.6 5.6 6.2 Q3 9.07 8.04 95.5 13.6 18.8 96.0 5.1 9.1 Q4 20.35 8.11 97.7 11.4 18.3 98.9 5.1 8.6 High 49.30 8.21 97.7 11.4 17.1 99.4 5.7 10.2
Panel B: All-Star analyst coverage by PriceRevision (categories per the Initial Price Range, IPR)
PriceRevision
UWRank
Percent with an Affiliated Analyst Recommendation
Percent with an Affiliated All-Star Analyst
Top 3 and Top 3 Runners Up
Percent with an Unaffiliated Analyst
Recommendation
Percent with an Unaffiliated All-Star Analyst
Top 3 and Top 3 Runners Up
PriceRevision < –25.00%*
–40.25 7.67 91.7 7.6 12.4 97.2 2.1 2.8
–25.00%* ≤ PriceRevision < IPR minimum
–18.38 8.04 94.7 14.2 19.5 97.0 4.1 4.7
IPR minimum ≤ PriceRevision < 0
–7.36 7.28 92.5 9.4 14.2 94.3 3.8 5.7
PriceRevision = 0
0.00 7.89 93.9 10.2 16.3 94.9 4.1 6.1
0 < PriceRevision ≤ IPR maximum
6.48 8.16 97.0 16.5 22.6 97.7 6.0 9.0
IPR maximum < PriceRevision ≤ 16.67**
12.69 8.22 97.4 11.3 13.9 100.0 7.8 12.2
PriceRevision > 16.67**
28.61 8.45 99.1 12.5 21.4 99.1 5.4 12.5
Observations are 878 firm-commitment share IPOs from May 10, 2002 to December 31, 2013 by non-financial, U.S. companies. IPR refers to Initial Price Range. See Table 1 for variable definitions.
* –25.00% is the median value of PriceRevision for the 314 IPOs with PriceRevision < IPR minimum. ** 16.67% is the median value of PriceRevision for the 227 IPOs with PriceRevision > IPR maximum.
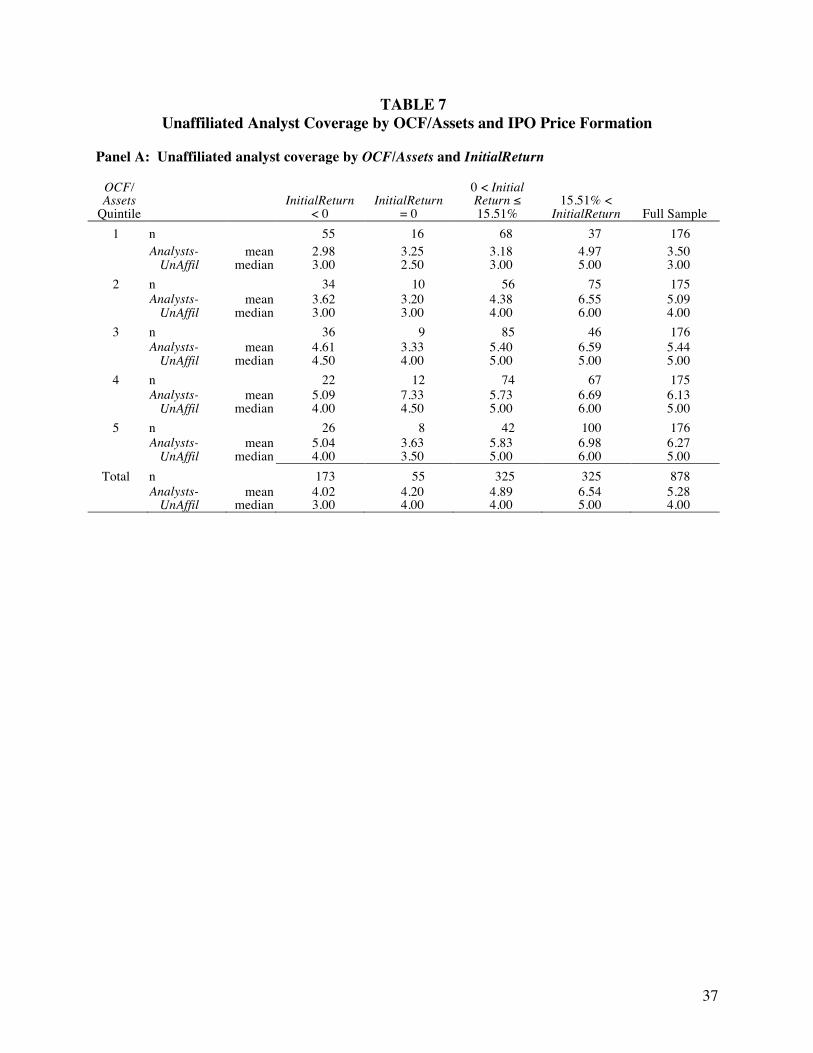
37
TABLE 7 Unaffiliated Analyst Coverage by OCF/Assets and IPO Price Formation
Panel A: Unaffiliated analyst coverage by OCF/Assets and InitialReturn
OCF/ Assets
Quintile
InitialReturn
< 0
InitialReturn
= 0
0 < Initial Return ≤ 15.51%
15.51% <
InitialReturn
Full Sample 1 n 55 16 68 37 176
Analysts- UnAffil
mean median
2.98 3.00
3.25 2.50
3.18 3.00
4.97 5.00
3.50 3.00
2 n 34 10 56 75 175
Analysts- UnAffil
mean median
3.62 3.00
3.20 3.00
4.38 4.00
6.55 6.00
5.09 4.00
3 n 36 9 85 46 176
Analysts- UnAffil
mean median
4.61 4.50
3.33 4.00
5.40 5.00
6.59 5.00
5.44 5.00
4 n 22 12 74 67 175
Analysts- UnAffil
mean median
5.09 4.00
7.33 4.50
5.73 5.00
6.69 6.00
6.13 5.00
5 n 26 8 42 100 176
Analysts- UnAffil
mean median
5.04 4.00
3.63 3.50
5.83 5.00
6.98 6.00
6.27 5.00
Total n 173 55 325 325 878
Analysts- UnAffil
mean median
4.02 3.00
4.20 4.00
4.89 4.00
6.54 5.00
5.28 4.00
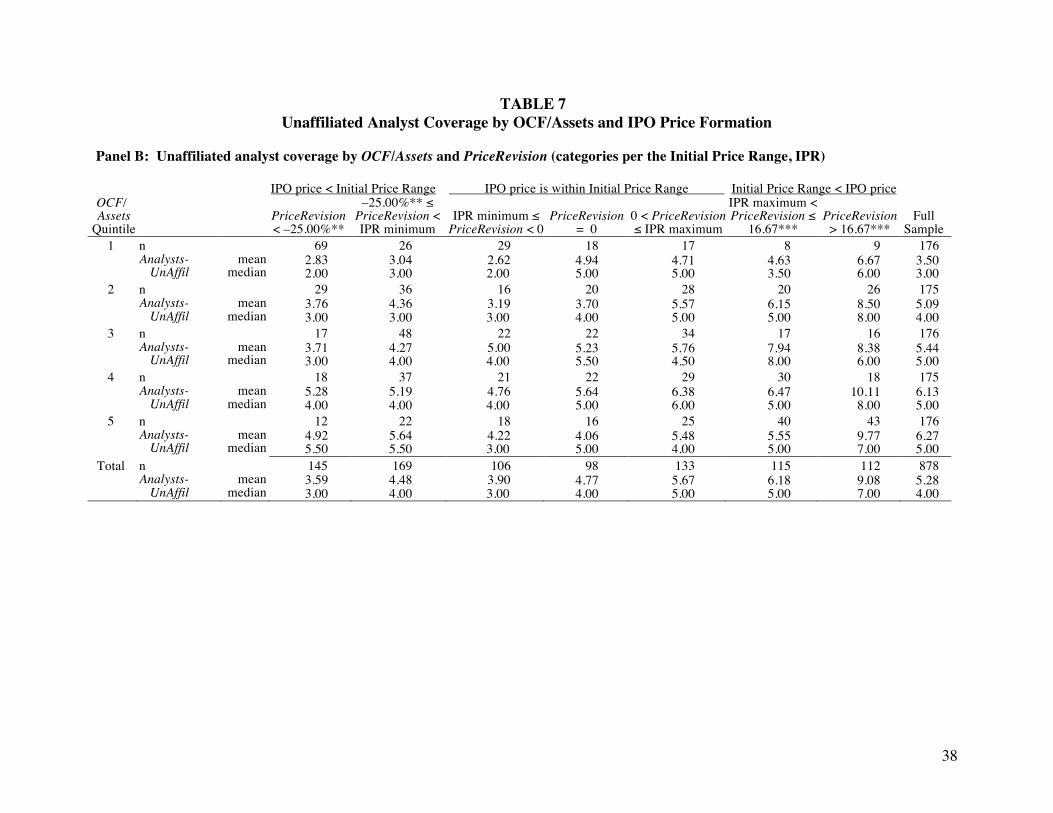
38
TABLE 7 Unaffiliated Analyst Coverage by OCF/Assets and IPO Price Formation
Panel B: Unaffiliated analyst coverage by OCF/Assets and PriceRevision (categories per the Initial Price Range, IPR)
IPO price < Initial Price Range IPO price is within Initial Price Range Initial Price Range < IPO price OCF/ Assets
Quintile
PriceRevision < –25.00%**
–25.00%** ≤ PriceRevision < IPR minimum
IPR minimum ≤
PriceRevision < 0
PriceRevision
= 0
0 < PriceRevision ≤ IPR maximum
IPR maximum < PriceRevision ≤
16.67***
PriceRevision
> 16.67***
Full
Sample 1 n 69 26 29 18 17 8 9 176
Analysts- UnAffil
mean median
2.83 2.00
3.04 3.00
2.62 2.00
4.94 5.00
4.71 5.00
4.63 3.50
6.67 6.00
3.50 3.00
2 n 29 36 16 20 28 20 26 175 Analysts-
UnAffil mean
median 3.76 3.00
4.36 3.00
3.19 3.00
3.70 4.00
5.57 5.00
6.15 5.00
8.50 8.00
5.09 4.00
3 n 17 48 22 22 34 17 16 176 Analysts-
UnAffil mean
median 3.71 3.00
4.27 4.00
5.00 4.00
5.23 5.50
5.76 4.50
7.94 8.00
8.38 6.00
5.44 5.00
4 n 18 37 21 22 29 30 18 175 Analysts-
UnAffil mean
median 5.28 4.00
5.19 4.00
4.76 4.00
5.64 5.00
6.38 6.00
6.47 5.00
10.11 8.00
6.13 5.00
5 n 12 22 18 16 25 40 43 176 Analysts-
UnAffil mean
median 4.92 5.50
5.64 5.50
4.22 3.00
4.06 5.00
5.48 4.00
5.55 5.00
9.77 7.00
6.27 5.00
Total n 145 169 106 98 133 115 112 878 Analysts-
UnAffil mean
median 3.59 3.00
4.48 4.00
3.90 3.00
4.77 4.00
5.67 5.00
6.18 5.00
9.08 7.00
5.28 4.00
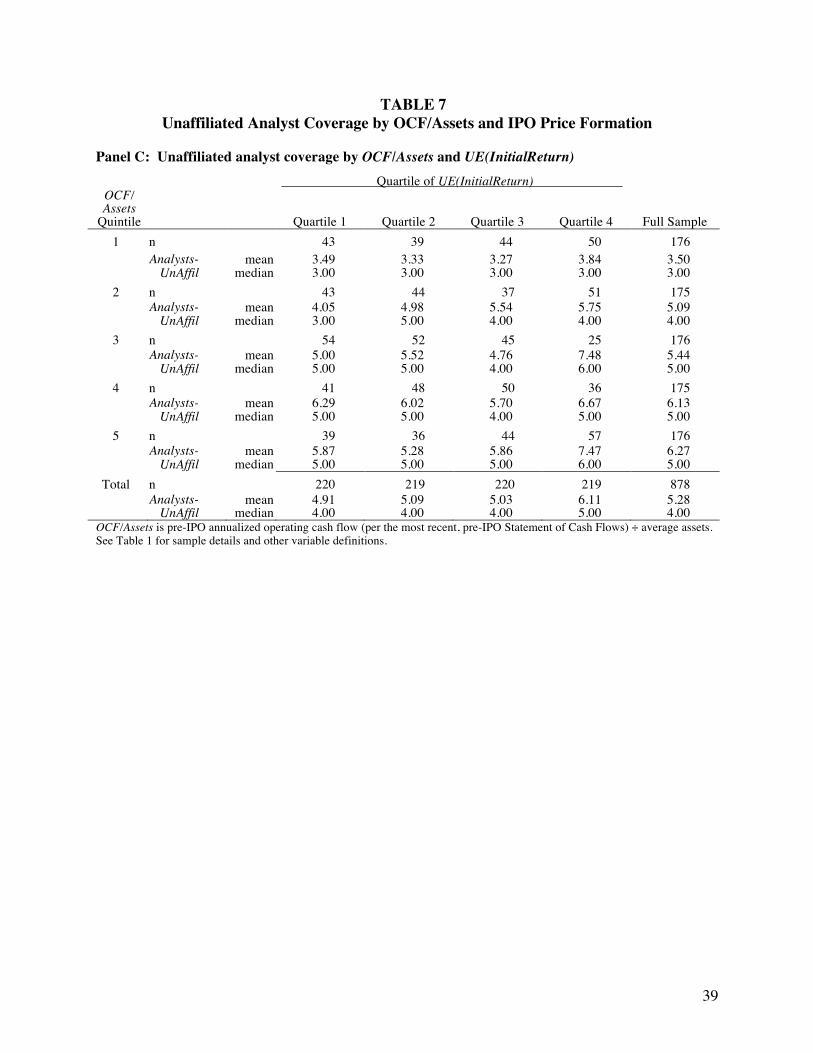
39
TABLE 7 Unaffiliated Analyst Coverage by OCF/Assets and IPO Price Formation
Panel C: Unaffiliated analyst coverage by OCF/Assets and UE(InitialReturn) Quartile of UE(InitialReturn)
OCF/ Assets
Quintile
Quartile 1
Quartile 2
Quartile 3
Quartile 4
Full Sample 1 n 43 39 44 50 176
Analysts- UnAffil
mean median
3.49 3.00
3.33 3.00
3.27 3.00
3.84 3.00
3.50 3.00
2 n 43 44 37 51 175
Analysts- UnAffil
mean median
4.05 3.00
4.98 5.00
5.54 4.00
5.75 4.00
5.09 4.00
3 n 54 52 45 25 176
Analysts- UnAffil
mean median
5.00 5.00
5.52 5.00
4.76 4.00
7.48 6.00
5.44 5.00
4 n 41 48 50 36 175
Analysts- UnAffil
mean median
6.29 5.00
6.02 5.00
5.70 4.00
6.67 5.00
6.13 5.00
5 n 39 36 44 57 176
Analysts- UnAffil
mean median
5.87 5.00
5.28 5.00
5.86 5.00
7.47 6.00
6.27 5.00
Total n 220 219 220 219 878
Analysts- UnAffil
mean median
4.91 4.00
5.09 4.00
5.03 4.00
6.11 5.00
5.28 4.00
OCF/Assets is pre-IPO annualized operating cash flow (per the most recent, pre-IPO Statement of Cash Flows) ÷ average assets. See Table 1 for sample details and other variable definitions.
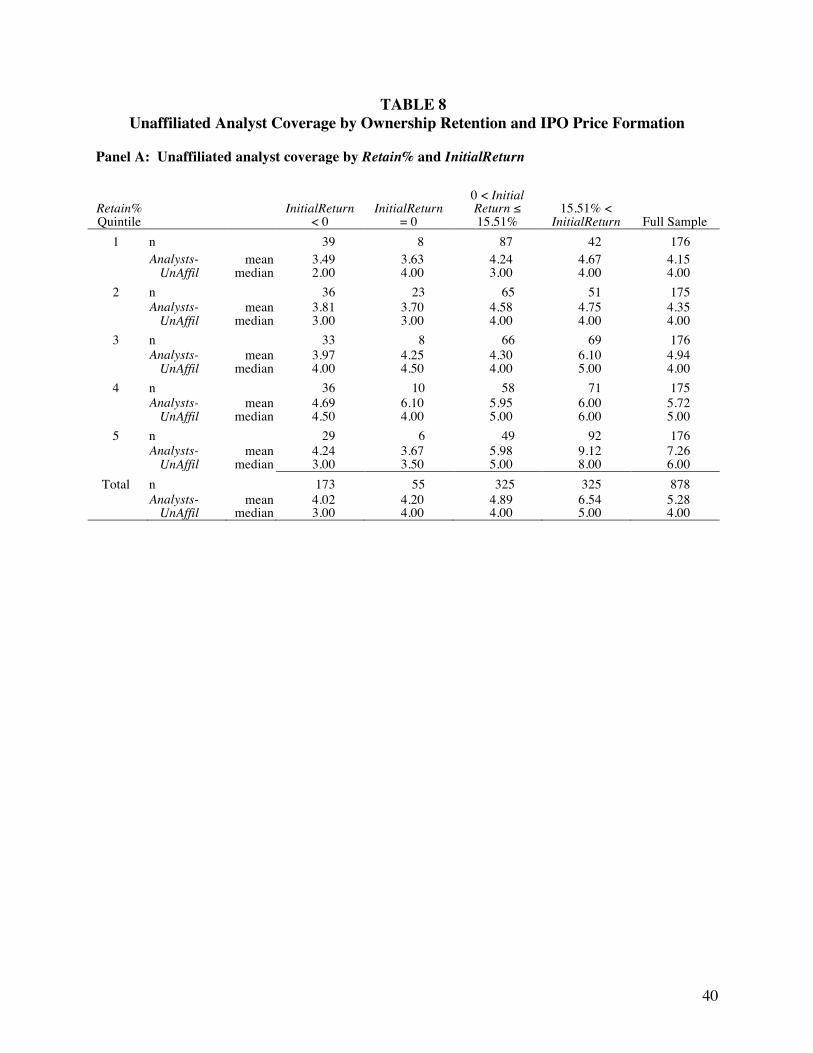
40
TABLE 8 Unaffiliated Analyst Coverage by Ownership Retention and IPO Price Formation
Panel A: Unaffiliated analyst coverage by Retain% and InitialReturn
Retain% Quintile
InitialReturn
< 0
InitialReturn
= 0
0 < Initial Return ≤ 15.51%
15.51% <
InitialReturn
Full Sample 1 n 39 8 87 42 176
Analysts- UnAffil
mean median
3.49 2.00
3.63 4.00
4.24 3.00
4.67 4.00
4.15 4.00
2 n 36 23 65 51 175
Analysts- UnAffil
mean median
3.81 3.00
3.70 3.00
4.58 4.00
4.75 4.00
4.35 4.00
3 n 33 8 66 69 176
Analysts- UnAffil
mean median
3.97 4.00
4.25 4.50
4.30 4.00
6.10 5.00
4.94 4.00
4 n 36 10 58 71 175
Analysts- UnAffil
mean median
4.69 4.50
6.10 4.00
5.95 5.00
6.00 6.00
5.72 5.00
5 n 29 6 49 92 176
Analysts- UnAffil
mean median
4.24 3.00
3.67 3.50
5.98 5.00
9.12 8.00
7.26 6.00
Total n 173 55 325 325 878
Analysts- UnAffil
mean median
4.02 3.00
4.20 4.00
4.89 4.00
6.54 5.00
5.28 4.00
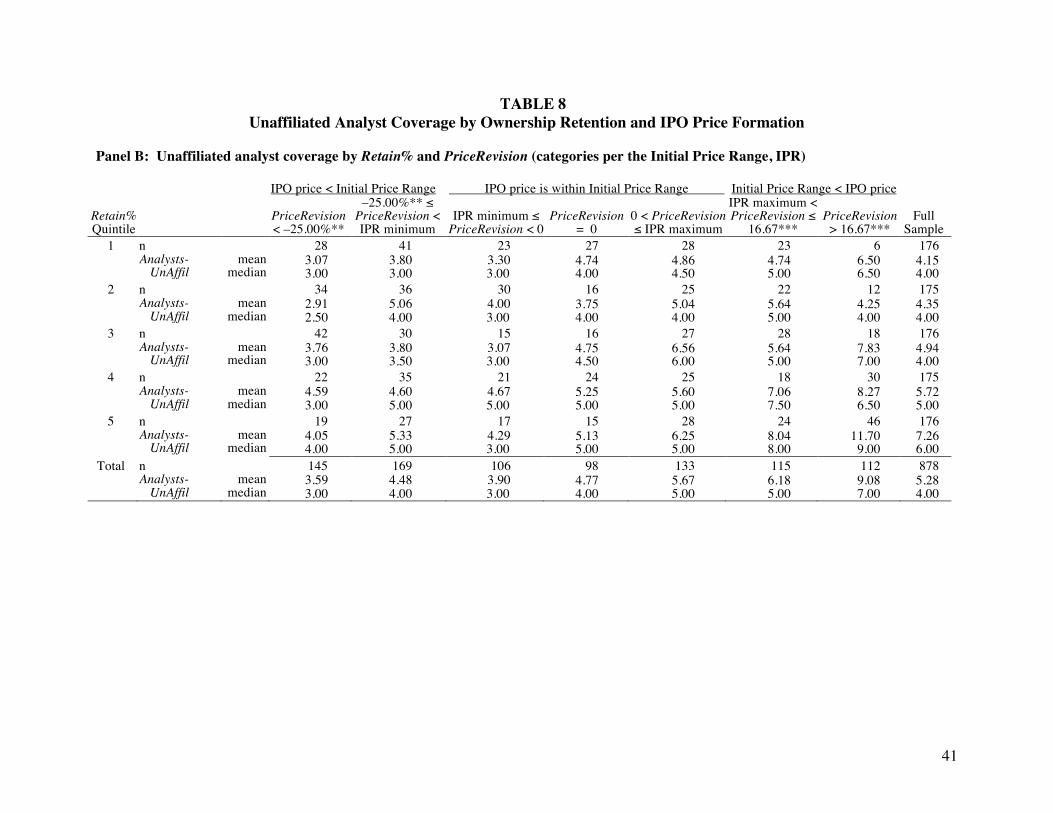
41
TABLE 8 Unaffiliated Analyst Coverage by Ownership Retention and IPO Price Formation
Panel B: Unaffiliated analyst coverage by Retain% and PriceRevision (categories per the Initial Price Range, IPR)
IPO price < Initial Price Range IPO price is within Initial Price Range Initial Price Range < IPO price
Retain% Quintile
PriceRevision < –25.00%**
–25.00%** ≤ PriceRevision < IPR minimum
IPR minimum ≤
PriceRevision < 0
PriceRevision
= 0
0 < PriceRevision ≤ IPR maximum
IPR maximum < PriceRevision ≤
16.67***
PriceRevision
> 16.67***
Full
Sample 1 n 28 41 23 27 28 23 6 176
Analysts- UnAffil
mean median
3.07 3.00
3.80 3.00
3.30 3.00
4.74 4.00
4.86 4.50
4.74 5.00
6.50 6.50
4.15 4.00
2 n 34 36 30 16 25 22 12 175 Analysts-
UnAffil mean
median 2.91 2.50
5.06 4.00
4.00 3.00
3.75 4.00
5.04 4.00
5.64 5.00
4.25 4.00
4.35 4.00
3 n 42 30 15 16 27 28 18 176 Analysts-
UnAffil mean
median 3.76 3.00
3.80 3.50
3.07 3.00
4.75 4.50
6.56 6.00
5.64 5.00
7.83 7.00
4.94 4.00
4 n 22 35 21 24 25 18 30 175 Analysts-
UnAffil mean
median 4.59 3.00
4.60 5.00
4.67 5.00
5.25 5.00
5.60 5.00
7.06 7.50
8.27 6.50
5.72 5.00
5 n 19 27 17 15 28 24 46 176 Analysts-
UnAffil mean
median 4.05 4.00
5.33 5.00
4.29 3.00
5.13 5.00
6.25 5.00
8.04 8.00
11.70 9.00
7.26 6.00
Total n 145 169 106 98 133 115 112 878 Analysts-
UnAffil mean
median 3.59 3.00
4.48 4.00
3.90 3.00
4.77 4.00
5.67 5.00
6.18 5.00
9.08 7.00
5.28 4.00
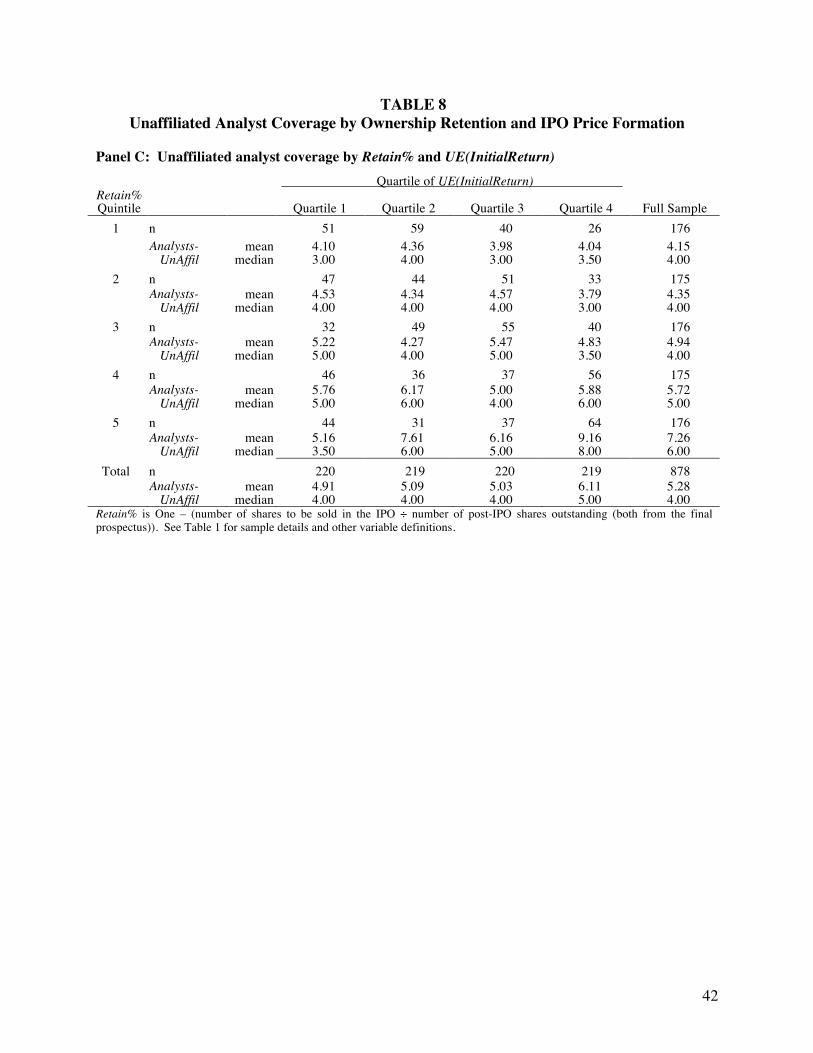
42
TABLE 8 Unaffiliated Analyst Coverage by Ownership Retention and IPO Price Formation
Panel C: Unaffiliated analyst coverage by Retain% and UE(InitialReturn) Quartile of UE(InitialReturn) Retain% Quintile
Quartile 1
Quartile 2
Quartile 3
Quartile 4
Full Sample
1 n 51 59 40 26 176 Analysts-
UnAffil mean
median 4.10 3.00
4.36 4.00
3.98 3.00
4.04 3.50
4.15 4.00
2 n 47 44 51 33 175
Analysts- UnAffil
mean median
4.53 4.00
4.34 4.00
4.57 4.00
3.79 3.00
4.35 4.00
3 n 32 49 55 40 176
Analysts- UnAffil
mean median
5.22 5.00
4.27 4.00
5.47 5.00
4.83 3.50
4.94 4.00
4 n 46 36 37 56 175
Analysts- UnAffil
mean median
5.76 5.00
6.17 6.00
5.00 4.00
5.88 6.00
5.72 5.00
5 n 44 31 37 64 176
Analysts- UnAffil
mean median
5.16 3.50
7.61 6.00
6.16 5.00
9.16 8.00
7.26 6.00
Total n 220 219 220 219 878
Analysts- UnAffil
mean median
4.91 4.00
5.09 4.00
5.03 4.00
6.11 5.00
5.28 4.00
Retain% is One – (number of shares to be sold in the IPO ÷ number of post-IPO shares outstanding (both from the final prospectus)). See Table 1 for sample details and other variable definitions.