Embed Size (px)
Citation preview
REFER TO DISCLOSURE SECTION AT THE END OF THE NOTES page 1 of 13
IPO Report
A leading producer of ethanol used in the transportation sector, TAE is expected to continue to benefit from the government’s policy to boost domestic consumption of alternative energy. We estimate TAE’s EPS to grow at a CAGR of 49% during 2014-15 driven by strong volume growth. We have derived a target price of Bt2.95, based on 11x 2014E PER (fully diluted), representing a combination of the average PER of its international peers and of SET-listed integrated sugar mill producers.
A leading producer of ethanol fuel TAE is the third largest producer of ethanol fuel in the industry, with a combined capacity of 356,000 liters/day. Not only does TAE focus on the production of high-quality ethanol to meet its clients’ demand, the company also emphasizes effective production cost control in order to boost its profitability. This includes the commencement of a second production line to support a wider range of feedstock. Moreover, TAE also uses biogas derived from the water treatment process during the production process as an alternative form of fuel.
EPS estimated at 49% CAGR during 2014-15 We expect TAE’s earnings per share (EPS) to achieve a 49% CAGR during 2014-15. The EPS growth should be driven by the anticipated strong sales volume growth of ethanol. The higher utilization rates at both production lines are expected to support domestic demand for ethanol, which is likely to continue growing. Moreover, with its ability to support various kinds of feedstock, TAE is expected to be able to manage its costs more effectively, especially amid the fluctuations in the prices of different kinds of feedstock.
Risk in regard to the procurement of feedstock TAE is a molasses-based producer but the firm does not own any sugar mills. Hence, there is risk that the firm may be unable to secure a sufficient volume of molasses (feedstock) for its ethanol production. In an attempt to reduce this risk, TAE has signed long-term contracts with several sugar mills. We believe the volume of molasses under long-term contracts should be sufficient for TAE’s current production.
Financial and Valuation
FY Ended 31 Dec 2011 2012 2013 2014E 2015E Revenue (Btm) 1,098 1,350 1,659 2,421 2,648 Net Profit (Btm) (43) 164 118 266 329 EPS (Bt) (0.05) 0.21 0.15 0.28 0.33 EPS Growth (%) nm nm -28.9% 93.5% 15.5% Dividend (Bt) 0.00 0.00 0.07 0.16 0.20 BV (Bt) 1.15 1.36 1.38 1.70 1.87
FY Ended 31 Dec 2011 2012 2013 2014E 2015E PER (x) na na na 7.52 6.09 EV/EBITDA (x) na na na 6.75 5.43 PBV (x) na na na 1.18 1.07 Dividend Yield (%) 0.0% 0.0% nm 8.0% 9.9% ROE (%) -4.6% 16.5% 10.8% 19.0% 18.5% Net Gearing 157.8% 112.9% 142.6% 59.5% 40.8%
*per share data is calculated based on par Bt1 for comparison
Share data
Reuters / Bloomberg TAE.BK/TAE TB Market SET
Post-IPO paid-up shares (mn) 1,000 Pre-IPO paid-up shares (mn) 800 Par (Bt) 1.00 Dividend polity Not < 60% of NP IPO summary Issued shares (mn) 296.0 Offering price (Bt) 2.00 First trading date 5 June 2014
Lead Underwriters Finansia Syrus
Financial Advisor Finansia Syrus Major Shareholders 2 June 14 (%) Pre-IPO Post-IPO
LANNA 75.8 51.0
Sirirungsi Family 5.2 5.0
SCCC - 4.7
Jaturaphruek Family 4.7 3.8
Limwathanagura
Family
4.6 3.6
Intended use of proceeds (Btmn) - Invest in gas engine plant for electricity production
120.0
- Debt repayment 200.0 - Use as working capital 63.9
Note
Major shareholders certify not to sell 550mn shares or 55% of the paid-up capital post-IPO for a period of one year from the first trading day; meanwhile, twenty-five percent of the total amount of shares is prohibited for sale after the expiry of a six-month period and the rest after one year.
Waraporn Wiboonkanarak, no. 2482 Analyst [email protected] 02-624-6273
June 5, 2014
Thai Agro Energy Target Price: Bt2.95
Volume sales to drive growth IPO Price: Bt2.0
REFER TO DISCLOSURE SECTION AT THE END OF THE NOTES page 2 of 13
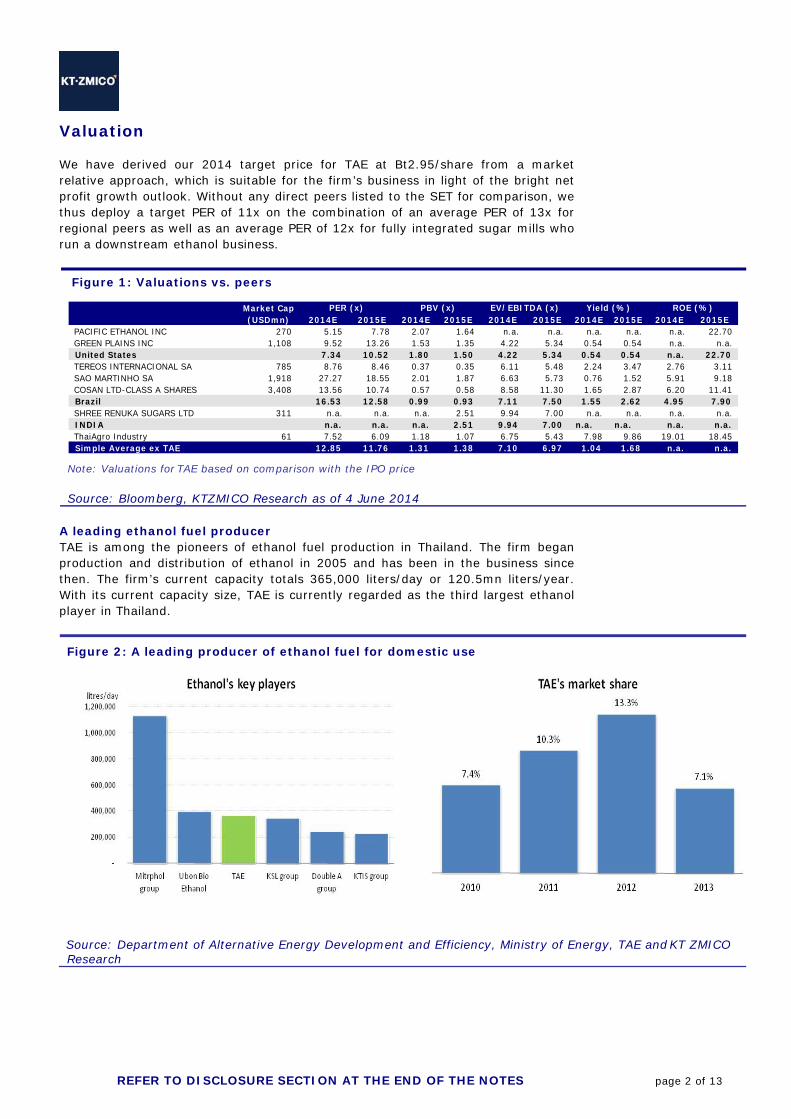
Valuation We have derived our 2014 target price for TAE at Bt2.95/share from a market relative approach, which is suitable for the firm’s business in light of the bright net profit growth outlook. Without any direct peers listed to the SET for comparison, we thus deploy a target PER of 11x on the combination of an average PER of 13x for regional peers as well as an average PER of 12x for fully integrated sugar mills who run a downstream ethanol business.
Figure 1: Valuations vs. peers
Market Cap(USDmn) 2014E 2015E 2014E 2015E 2014E 2015E 2014E 2015E 2014E 2015E
PACIFIC ETHANOL INC 270 5.15 7.78 2.07 1.64 n.a. n.a. n.a. n.a. n.a. 22.70 GREEN PLAINS INC 1,108 9.52 13.26 1.53 1.35 4.22 5.34 0.54 0.54 n.a. n.a.United States 7.34 10.52 1.80 1.50 4.22 5.34 0.54 0.54 n.a. 22.70 TEREOS INTERNACIONAL SA 785 8.76 8.46 0.37 0.35 6.11 5.48 2.24 3.47 2.76 3.11 SAO MARTINHO SA 1,918 27.27 18.55 2.01 1.87 6.63 5.73 0.76 1.52 5.91 9.18 COSAN LTD-CLASS A SHARES 3,408 13.56 10.74 0.57 0.58 8.58 11.30 1.65 2.87 6.20 11.41 Brazil 16.53 12.58 0.99 0.93 7.11 7.50 1.55 2.62 4.95 7.90 SHREE RENUKA SUGARS LTD 311 n.a. n.a. n.a. 2.51 9.94 7.00 n.a. n.a. n.a. n.a.INDIA n.a. n.a. n.a. 2.51 9.94 7.00 n.a. n.a. n.a. n.a.ThaiAgro Industry 61 7.52 6.09 1.18 1.07 6.75 5.43 7.98 9.86 19.01 18.45 Simple Average ex TAE 12.85 11.76 1.31 1.38 7.10 6.97 1.04 1.68 n.a. n.a.
PER (x) PBV (x) EV/EBITDA (x) ROE (%)Yield (%)
Note: Valuations for TAE based on comparison with the IPO price
Source: Bloomberg, KTZMICO Research as of 4 June 2014
A leading ethanol fuel producer TAE is among the pioneers of ethanol fuel production in Thailand. The firm began production and distribution of ethanol in 2005 and has been in the business since then. The firm’s current capacity totals 365,000 liters/day or 120.5mn liters/year. With its current capacity size, TAE is currently regarded as the third largest ethanol player in Thailand.
Figure 2: A leading producer of ethanol fuel for domestic use
Source: Department of Alternative Energy Development and Efficiency, Ministry of Energy, TAE and KT ZMICO Research
REFER TO DISCLOSURE SECTION AT THE END OF THE NOTES page 3 of 13
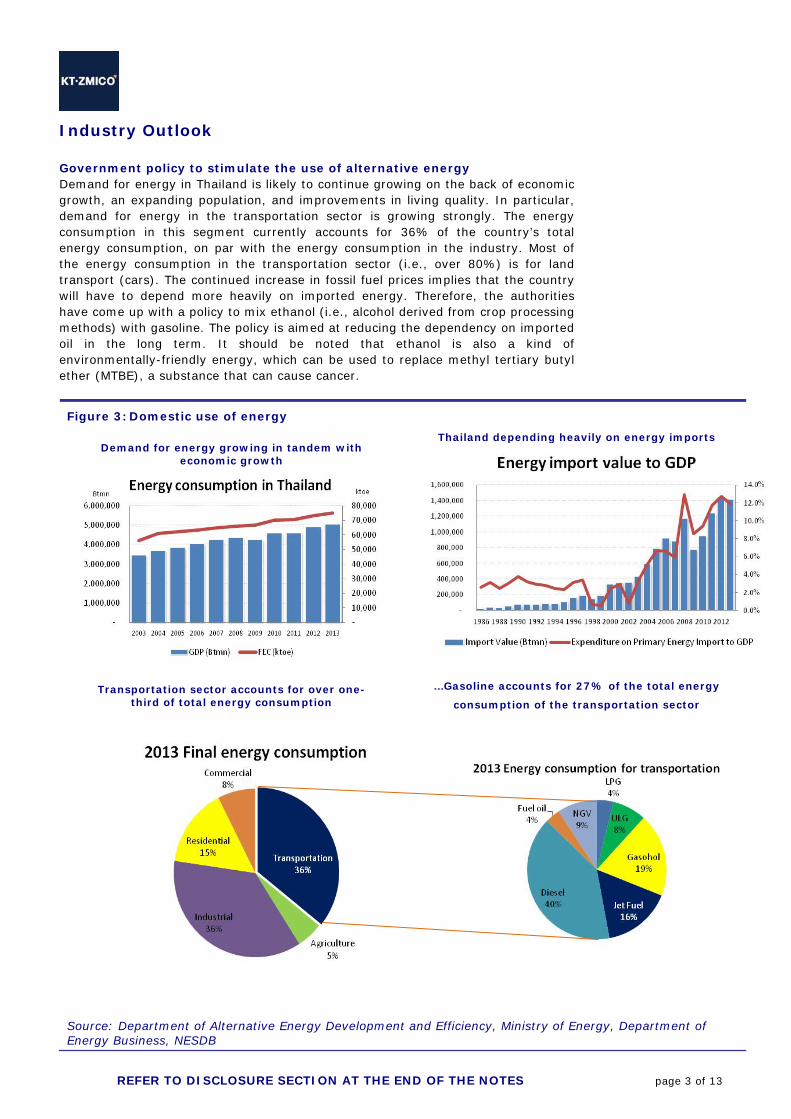
Industry Outlook Government policy to stimulate the use of alternative energy Demand for energy in Thailand is likely to continue growing on the back of economic growth, an expanding population, and improvements in living quality. In particular, demand for energy in the transportation sector is growing strongly. The energy consumption in this segment currently accounts for 36% of the country’s total energy consumption, on par with the energy consumption in the industry. Most of the energy consumption in the transportation sector (i.e., over 80%) is for land transport (cars). The continued increase in fossil fuel prices implies that the country will have to depend more heavily on imported energy. Therefore, the authorities have come up with a policy to mix ethanol (i.e., alcohol derived from crop processing methods) with gasoline. The policy is aimed at reducing the dependency on imported oil in the long term. It should be noted that ethanol is also a kind of environmentally-friendly energy, which can be used to replace methyl tertiary butyl ether (MTBE), a substance that can cause cancer. Figure 3: Domestic use of energy
Demand for energy growing in tandem with economic growth
Transportation sector accounts for over one-third of total energy consumption
Thailand depending heavily on energy imports
...Gasoline accounts for 27% of the total energy
consumption of the transportation sector
Source: Department of Alternative Energy Development and Efficiency, Ministry of Energy, Department of Energy Business, NESDB
REFER TO DISCLOSURE SECTION AT THE END OF THE NOTES page 4 of 13
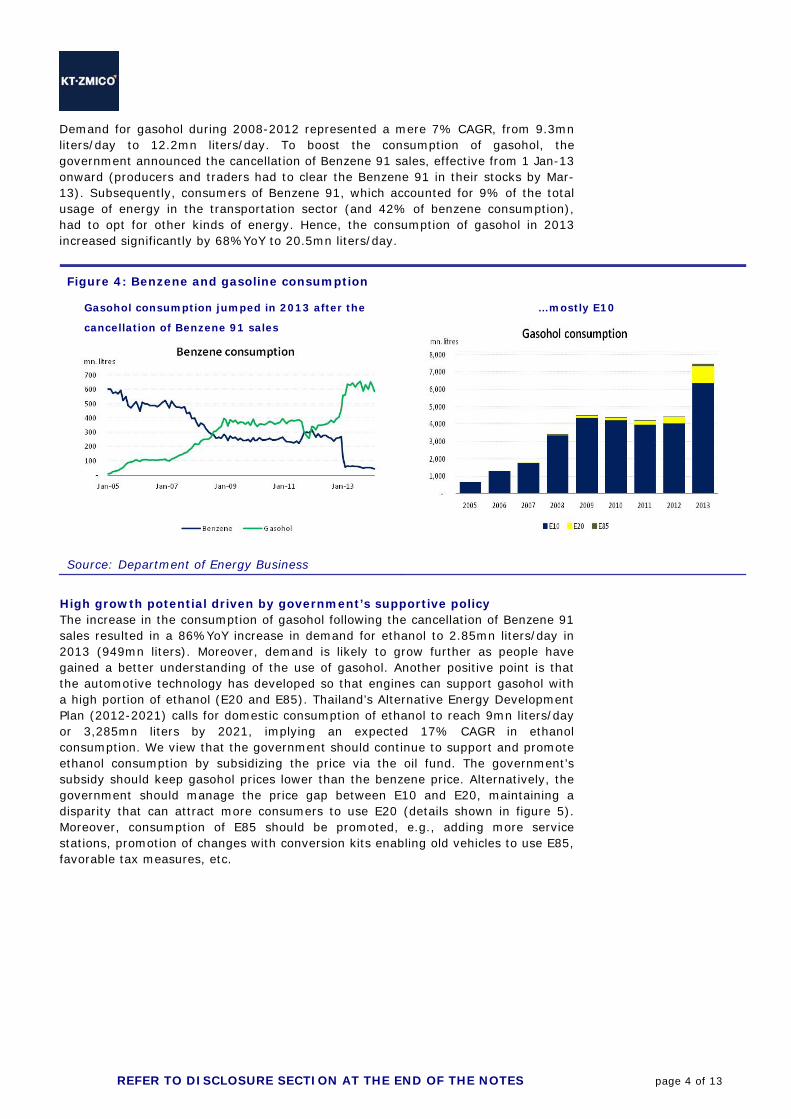
Demand for gasohol during 2008-2012 represented a mere 7% CAGR, from 9.3mn liters/day to 12.2mn liters/day. To boost the consumption of gasohol, the government announced the cancellation of Benzene 91 sales, effective from 1 Jan-13 onward (producers and traders had to clear the Benzene 91 in their stocks by Mar-13). Subsequently, consumers of Benzene 91, which accounted for 9% of the total usage of energy in the transportation sector (and 42% of benzene consumption), had to opt for other kinds of energy. Hence, the consumption of gasohol in 2013 increased significantly by 68%YoY to 20.5mn liters/day. Figure 4: Benzene and gasoline consumption
Gasohol consumption jumped in 2013 after the
cancellation of Benzene 91 sales
…mostly E10
Source: Department of Energy Business
High growth potential driven by government’s supportive policy The increase in the consumption of gasohol following the cancellation of Benzene 91 sales resulted in a 86%YoY increase in demand for ethanol to 2.85mn liters/day in 2013 (949mn liters). Moreover, demand is likely to grow further as people have gained a better understanding of the use of gasohol. Another positive point is that the automotive technology has developed so that engines can support gasohol with a high portion of ethanol (E20 and E85). Thailand’s Alternative Energy Development Plan (2012-2021) calls for domestic consumption of ethanol to reach 9mn liters/day or 3,285mn liters by 2021, implying an expected 17% CAGR in ethanol consumption. We view that the government should continue to support and promote ethanol consumption by subsidizing the price via the oil fund. The government’s subsidy should keep gasohol prices lower than the benzene price. Alternatively, the government should manage the price gap between E10 and E20, maintaining a disparity that can attract more consumers to use E20 (details shown in figure 5). Moreover, consumption of E85 should be promoted, e.g., adding more service stations, promotion of changes with conversion kits enabling old vehicles to use E85, favorable tax measures, etc.
REFER TO DISCLOSURE SECTION AT THE END OF THE NOTES page 5 of 13
Figure 5: Fuel price structure as of 24 Apr-14
Unit: Bt/liter Benzene 95 Gasohol 95 Gasohol 91 Gasohol E20 Gasohol E85
Contribution to the Oil Fund
10.00 3.30 1.20 - -
Subsidy - - - 1.05 11.60 Marketing margin 1.3313 1.3235 1.3605 1.4574 4.9061 Retail price 48.45 40.93 38.48 35.98 24.58
Source: Energy Policy and Planning Office
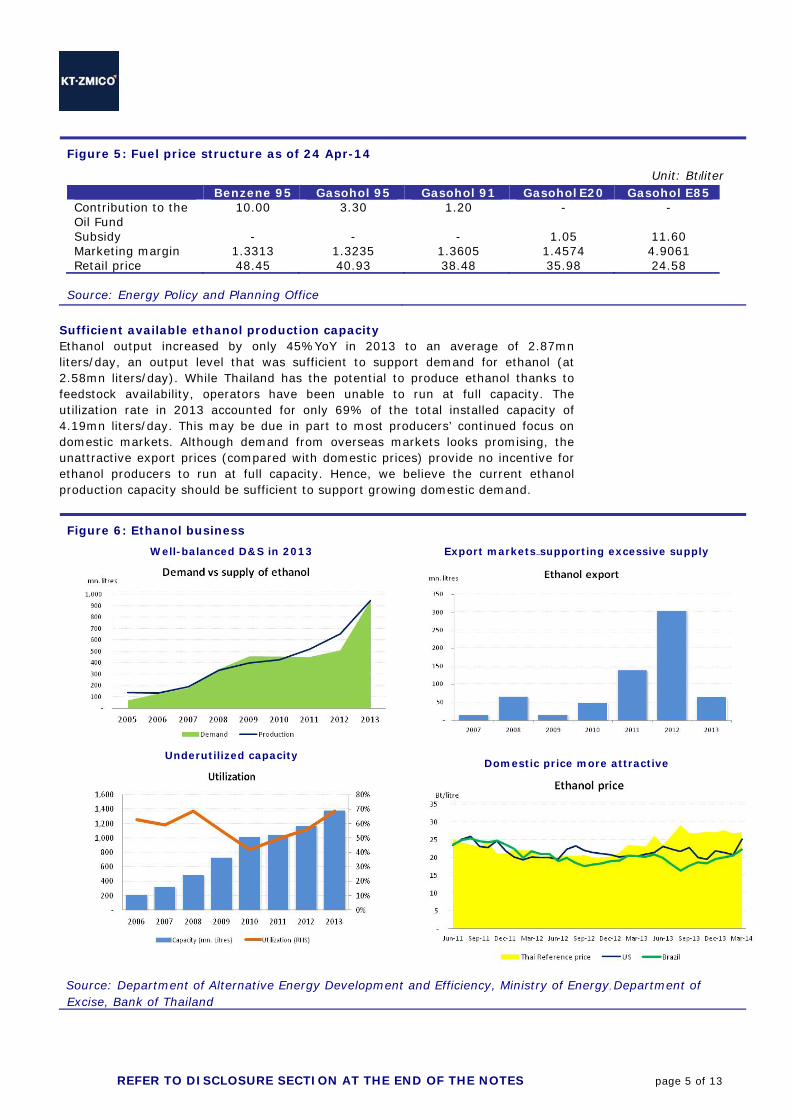
Sufficient available ethanol production capacity Ethanol output increased by only 45%YoY in 2013 to an average of 2.87mn liters/day, an output level that was sufficient to support demand for ethanol (at 2.58mn liters/day). While Thailand has the potential to produce ethanol thanks to feedstock availability, operators have been unable to run at full capacity. The utilization rate in 2013 accounted for only 69% of the total installed capacity of 4.19mn liters/day. This may be due in part to most producers’ continued focus on domestic markets. Although demand from overseas markets looks promising, the unattractive export prices (compared with domestic prices) provide no incentive for ethanol producers to run at full capacity. Hence, we believe the current ethanol production capacity should be sufficient to support growing domestic demand.
Figure 6: Ethanol business
Well-balanced D&S in 2013
Underutilized capacity
Export markets..supporting excessive supply
Domestic price more attractive
Source: Department of Alternative Energy Development and Efficiency, Ministry of Energy, Department of Excise, Bank of Thailand
REFER TO DISCLOSURE SECTION AT THE END OF THE NOTES page 6 of 13
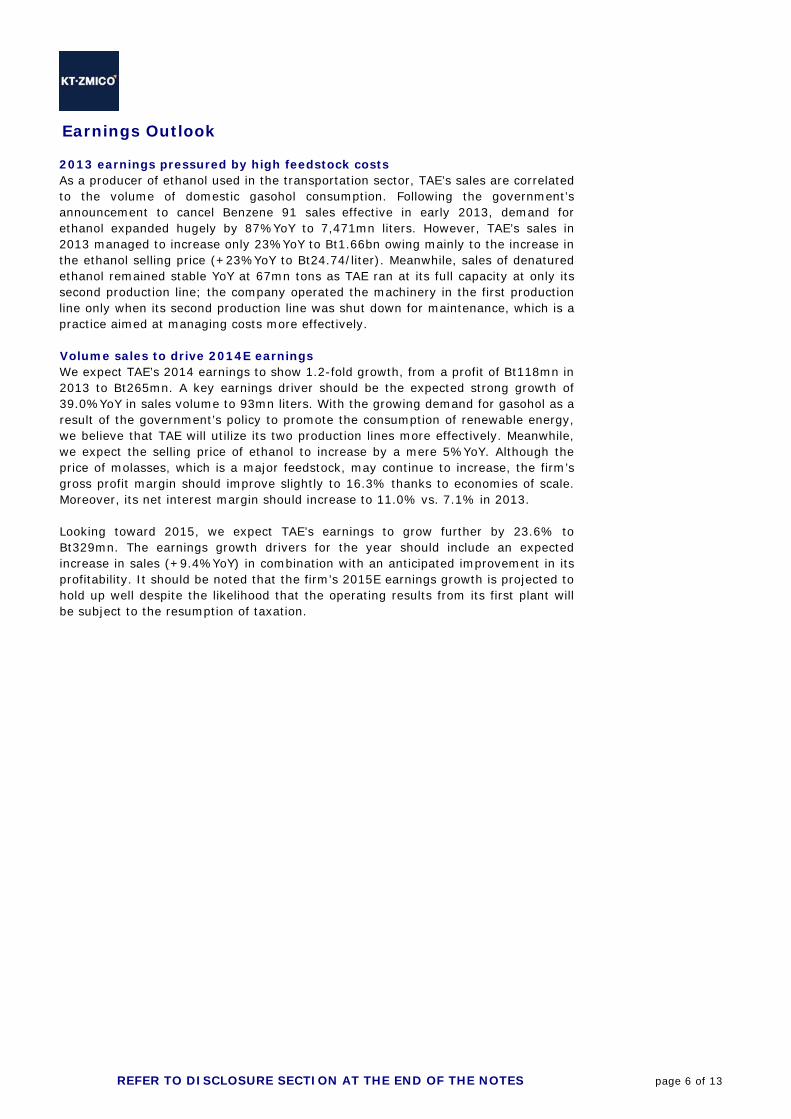
Earnings Outlook 2013 earnings pressured by high feedstock costs As a producer of ethanol used in the transportation sector, TAE’s sales are correlated to the volume of domestic gasohol consumption. Following the government’s announcement to cancel Benzene 91 sales effective in early 2013, demand for ethanol expanded hugely by 87%YoY to 7,471mn liters. However, TAE’s sales in 2013 managed to increase only 23%YoY to Bt1.66bn owing mainly to the increase in the ethanol selling price (+23%YoY to Bt24.74/liter). Meanwhile, sales of denatured ethanol remained stable YoY at 67mn tons as TAE ran at its full capacity at only its second production line; the company operated the machinery in the first production line only when its second production line was shut down for maintenance, which is a practice aimed at managing costs more effectively. Volume sales to drive 2014E earnings We expect TAE’s 2014 earnings to show 1.2-fold growth, from a profit of Bt118mn in 2013 to Bt265mn. A key earnings driver should be the expected strong growth of 39.0%YoY in sales volume to 93mn liters. With the growing demand for gasohol as a result of the government’s policy to promote the consumption of renewable energy, we believe that TAE will utilize its two production lines more effectively. Meanwhile, we expect the selling price of ethanol to increase by a mere 5%YoY. Although the price of molasses, which is a major feedstock, may continue to increase, the firm’s gross profit margin should improve slightly to 16.3% thanks to economies of scale. Moreover, its net interest margin should increase to 11.0% vs. 7.1% in 2013. Looking toward 2015, we expect TAE’s earnings to grow further by 23.6% to Bt329mn. The earnings growth drivers for the year should include an expected increase in sales (+9.4%YoY) in combination with an anticipated improvement in its profitability. It should be noted that the firm’s 2015E earnings growth is projected to hold up well despite the likelihood that the operating results from its first plant will be subject to the resumption of taxation.
REFER TO DISCLOSURE SECTION AT THE END OF THE NOTES page 7 of 13
Figure 7: Earnings performance
Source: TAE and KT ZMICO Research
Production cost management...a key success factor
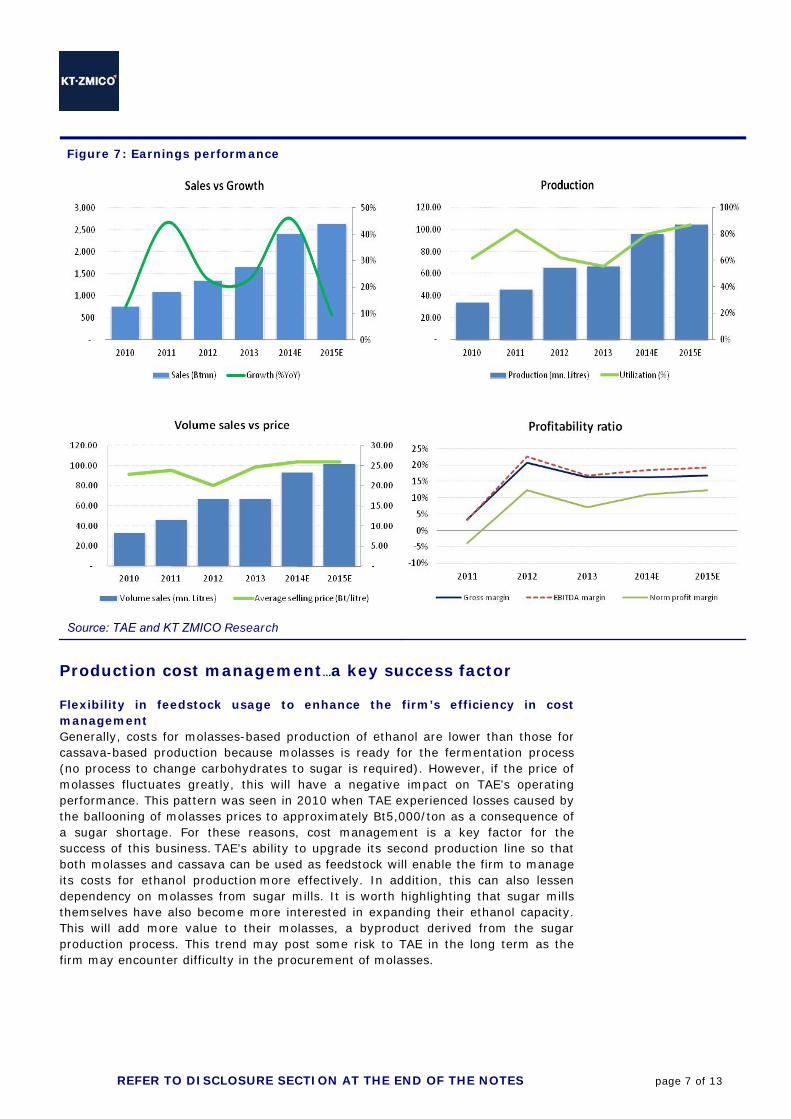
Flexibility in feedstock usage to enhance the firm’s efficiency in cost management Generally, costs for molasses-based production of ethanol are lower than those for cassava-based production because molasses is ready for the fermentation process (no process to change carbohydrates to sugar is required). However, if the price of molasses fluctuates greatly, this will have a negative impact on TAE’s operating performance. This pattern was seen in 2010 when TAE experienced losses caused by the ballooning of molasses prices to approximately Bt5,000/ton as a consequence of a sugar shortage. For these reasons, cost management is a key factor for the success of this business. TAE’s ability to upgrade its second production line so that both molasses and cassava can be used as feedstock will enable the firm to manage its costs for ethanol production more effectively. In addition, this can also lessen dependency on molasses from sugar mills. It is worth highlighting that sugar mills themselves have also become more interested in expanding their ethanol capacity. This will add more value to their molasses, a byproduct derived from the sugar production process. This trend may post some risk to TAE in the long term as the firm may encounter difficulty in the procurement of molasses.
REFER TO DISCLOSURE SECTION AT THE END OF THE NOTES page 8 of 13
Figure 8: Unit cost of production
Source: Bank of Thailand
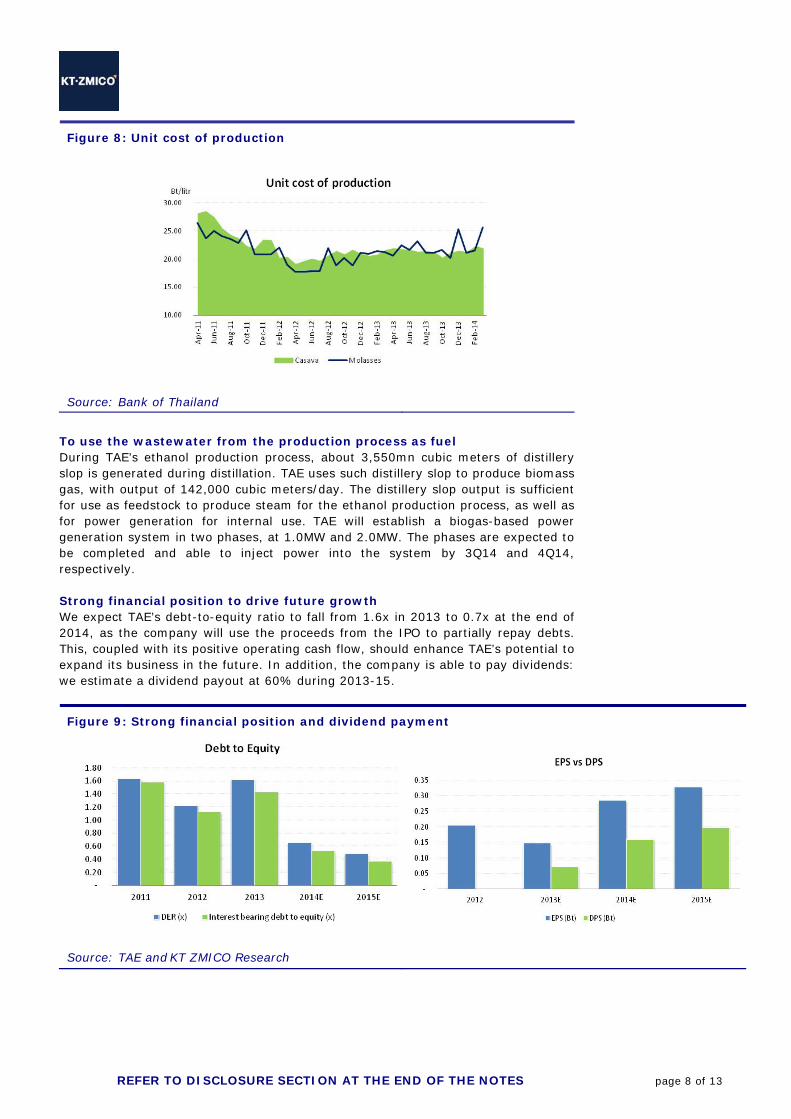
To use the wastewater from the production process as fuel During TAE’s ethanol production process, about 3,550mn cubic meters of distillery slop is generated during distillation. TAE uses such distillery slop to produce biomass gas, with output of 142,000 cubic meters/day. The distillery slop output is sufficient for use as feedstock to produce steam for the ethanol production process, as well as for power generation for internal use. TAE will establish a biogas-based power generation system in two phases, at 1.0MW and 2.0MW. The phases are expected to be completed and able to inject power into the system by 3Q14 and 4Q14, respectively. Strong financial position to drive future growth We expect TAE’s debt-to-equity ratio to fall from 1.6x in 2013 to 0.7x at the end of 2014, as the company will use the proceeds from the IPO to partially repay debts. This, coupled with its positive operating cash flow, should enhance TAE’s potential to expand its business in the future. In addition, the company is able to pay dividends: we estimate a dividend payout at 60% during 2013-15.
Figure 9: Strong financial position and dividend payment
Source: TAE and KT ZMICO Research
REFER TO DISCLOSURE SECTION AT THE END OF THE NOTES page 9 of 13
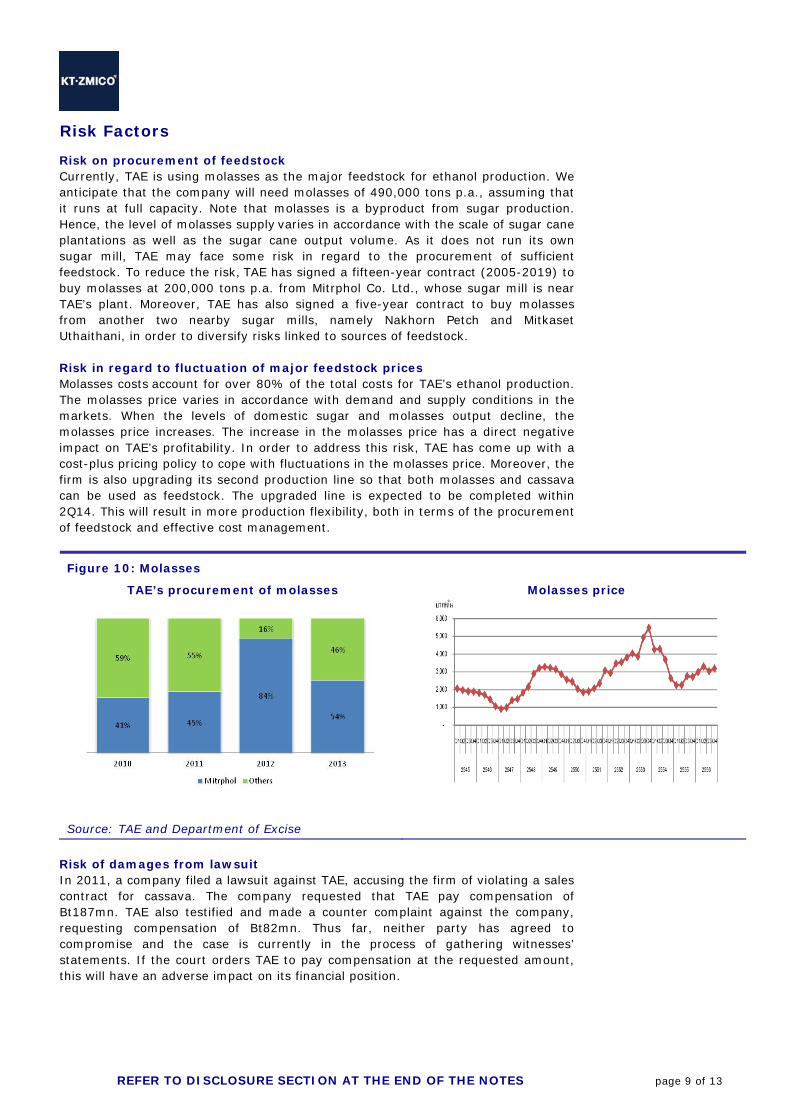
Risk Factors Risk on procurement of feedstock Currently, TAE is using molasses as the major feedstock for ethanol production. We anticipate that the company will need molasses of 490,000 tons p.a., assuming that it runs at full capacity. Note that molasses is a byproduct from sugar production. Hence, the level of molasses supply varies in accordance with the scale of sugar cane plantations as well as the sugar cane output volume. As it does not run its own sugar mill, TAE may face some risk in regard to the procurement of sufficient feedstock. To reduce the risk, TAE has signed a fifteen-year contract (2005-2019) to buy molasses at 200,000 tons p.a. from Mitrphol Co. Ltd., whose sugar mill is near TAE’s plant. Moreover, TAE has also signed a five-year contract to buy molasses from another two nearby sugar mills, namely Nakhorn Petch and Mitkaset Uthaithani, in order to diversify risks linked to sources of feedstock. Risk in regard to fluctuation of major feedstock prices Molasses costs account for over 80% of the total costs for TAE’s ethanol production. The molasses price varies in accordance with demand and supply conditions in the markets. When the levels of domestic sugar and molasses output decline, the molasses price increases. The increase in the molasses price has a direct negative impact on TAE’s profitability. In order to address this risk, TAE has come up with a cost-plus pricing policy to cope with fluctuations in the molasses price. Moreover, the firm is also upgrading its second production line so that both molasses and cassava can be used as feedstock. The upgraded line is expected to be completed within 2Q14. This will result in more production flexibility, both in terms of the procurement of feedstock and effective cost management. Figure 10: Molasses
TAE’s procurement of molasses
Molasses price
Source: TAE and Department of Excise
Risk of damages from lawsuit In 2011, a company filed a lawsuit against TAE, accusing the firm of violating a sales contract for cassava. The company requested that TAE pay compensation of Bt187mn. TAE also testified and made a counter complaint against the company, requesting compensation of Bt82mn. Thus far, neither party has agreed to compromise and the case is currently in the process of gathering witnesses’ statements. If the court orders TAE to pay compensation at the requested amount, this will have an adverse impact on its financial position.
REFER TO DISCLOSURE SECTION AT THE END OF THE NOTES page 10 of 13
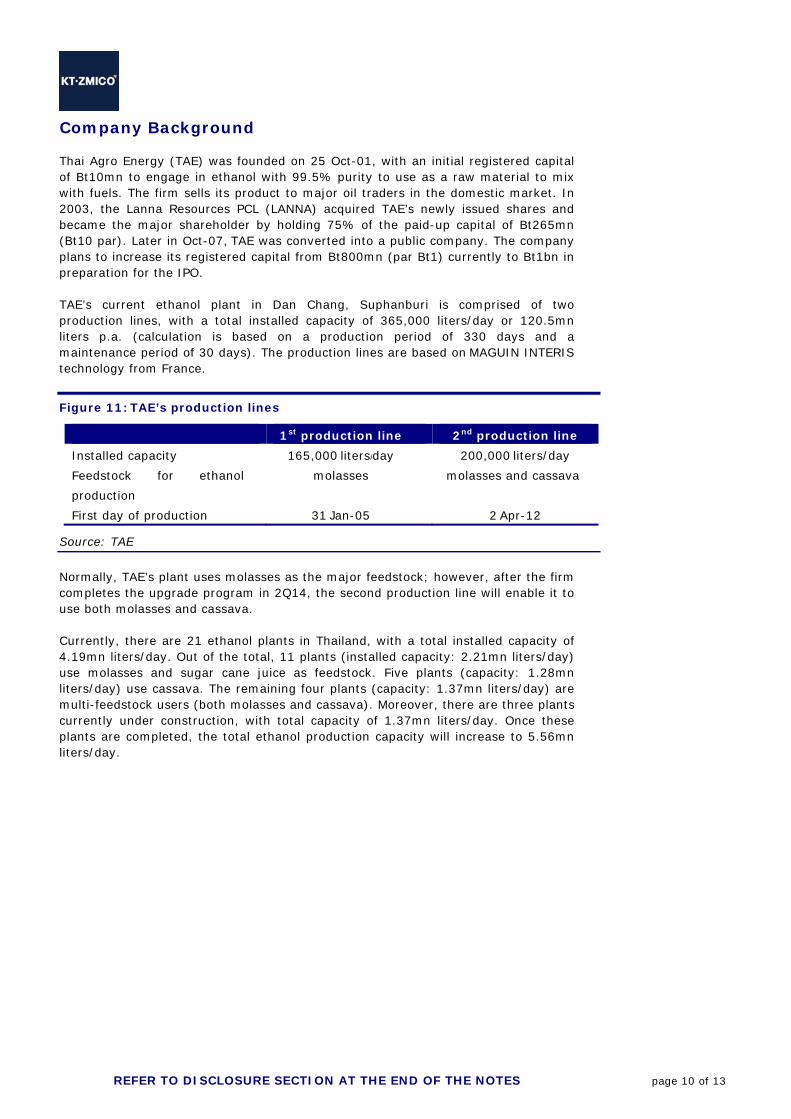
Company Background Thai Agro Energy (TAE) was founded on 25 Oct-01, with an initial registered capital of Bt10mn to engage in ethanol with 99.5% purity to use as a raw material to mix with fuels. The firm sells its product to major oil traders in the domestic market. In 2003, the Lanna Resources PCL (LANNA) acquired TAE’s newly issued shares and became the major shareholder by holding 75% of the paid-up capital of Bt265mn (Bt10 par). Later in Oct-07, TAE was converted into a public company. The company plans to increase its registered capital from Bt800mn (par Bt1) currently to Bt1bn in preparation for the IPO. TAE’s current ethanol plant in Dan Chang, Suphanburi is comprised of two production lines, with a total installed capacity of 365,000 liters/day or 120.5mn liters p.a. (calculation is based on a production period of 330 days and a maintenance period of 30 days). The production lines are based on MAGUIN INTERIS technology from France. Figure 11: TAE’s production lines
Source: TAE
Normally, TAE’s plant uses molasses as the major feedstock; however, after the firm completes the upgrade program in 2Q14, the second production line will enable it to use both molasses and cassava. Currently, there are 21 ethanol plants in Thailand, with a total installed capacity of 4.19mn liters/day. Out of the total, 11 plants (installed capacity: 2.21mn liters/day) use molasses and sugar cane juice as feedstock. Five plants (capacity: 1.28mn liters/day) use cassava. The remaining four plants (capacity: 1.37mn liters/day) are multi-feedstock users (both molasses and cassava). Moreover, there are three plants currently under construction, with total capacity of 1.37mn liters/day. Once these plants are completed, the total ethanol production capacity will increase to 5.56mn liters/day.
1st production line 2nd production line
Installed capacity 165,000 liters/day 200,000 liters/day
Feedstock for ethanol
production
molasses molasses and cassava
First day of production 31 Jan-05 2 Apr-12
REFER TO DISCLOSURE SECTION AT THE END OF THE NOTES page 11 of 13
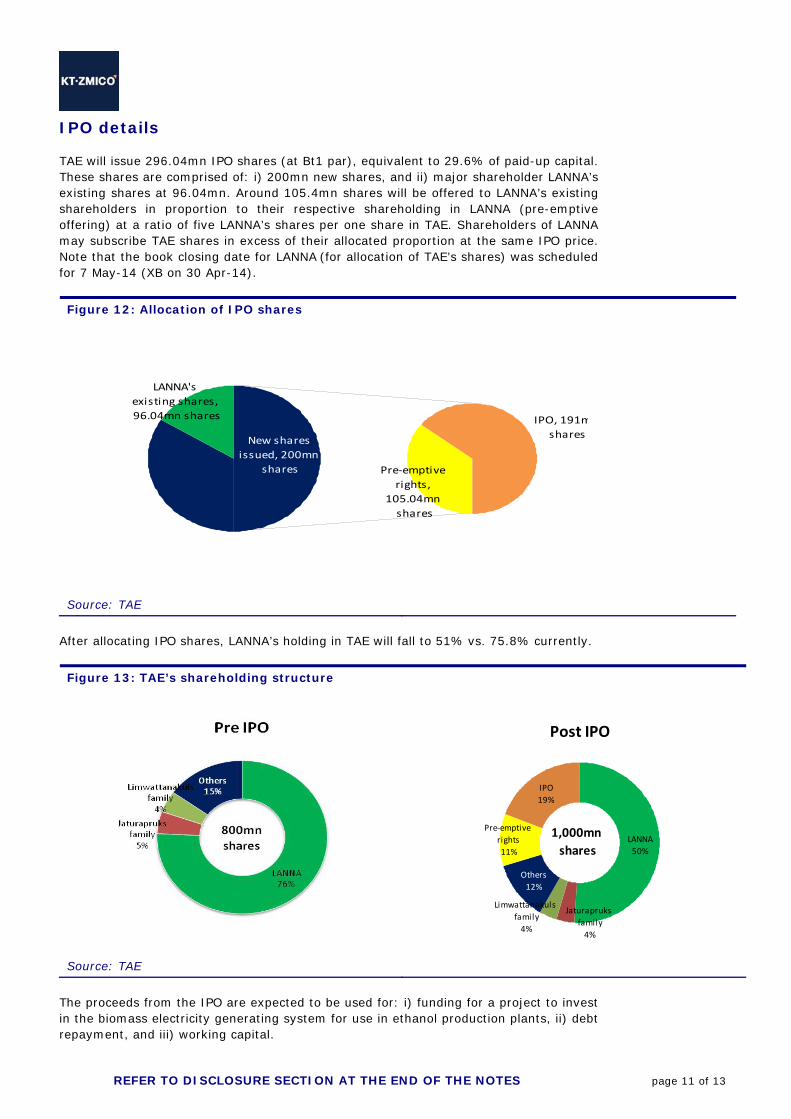
IPO details TAE will issue 296.04mn IPO shares (at Bt1 par), equivalent to 29.6% of paid-up capital. These shares are comprised of: i) 200mn new shares, and ii) major shareholder LANNA’s existing shares at 96.04mn. Around 105.4mn shares will be offered to LANNA’s existing shareholders in proportion to their respective shareholding in LANNA (pre-emptive offering) at a ratio of five LANNA’s shares per one share in TAE. Shareholders of LANNA may subscribe TAE shares in excess of their allocated proportion at the same IPO price. Note that the book closing date for LANNA (for allocation of TAE’s shares) was scheduled for 7 May-14 (XB on 30 Apr-14).
Figure 12: Allocation of IPO shares
New shares
issued, 200mn
shares
LANNA's
existing shares,
96.04mn shares
Pre‐emptive
rights,
105.04mn
shares
IPO, 191m
shares
Source: TAE
After allocating IPO shares, LANNA’s holding in TAE will fall to 51% vs. 75.8% currently.
Figure 13: TAE’s shareholding structure
Post IPO
LANNA
50%
IPO
19%
Jaturapruks
family
4%
Limwattanakuls
family
4%
Others
12%
Pre‐emptive
rights
11%
1,000mn
shares
Source: TAE The proceeds from the IPO are expected to be used for: i) funding for a project to invest in the biomass electricity generating system for use in ethanol production plants, ii) debt repayment, and iii) working capital.
REFER TO DISCLOSURE SECTION AT THE END OF THE NOTES page 12 of 13
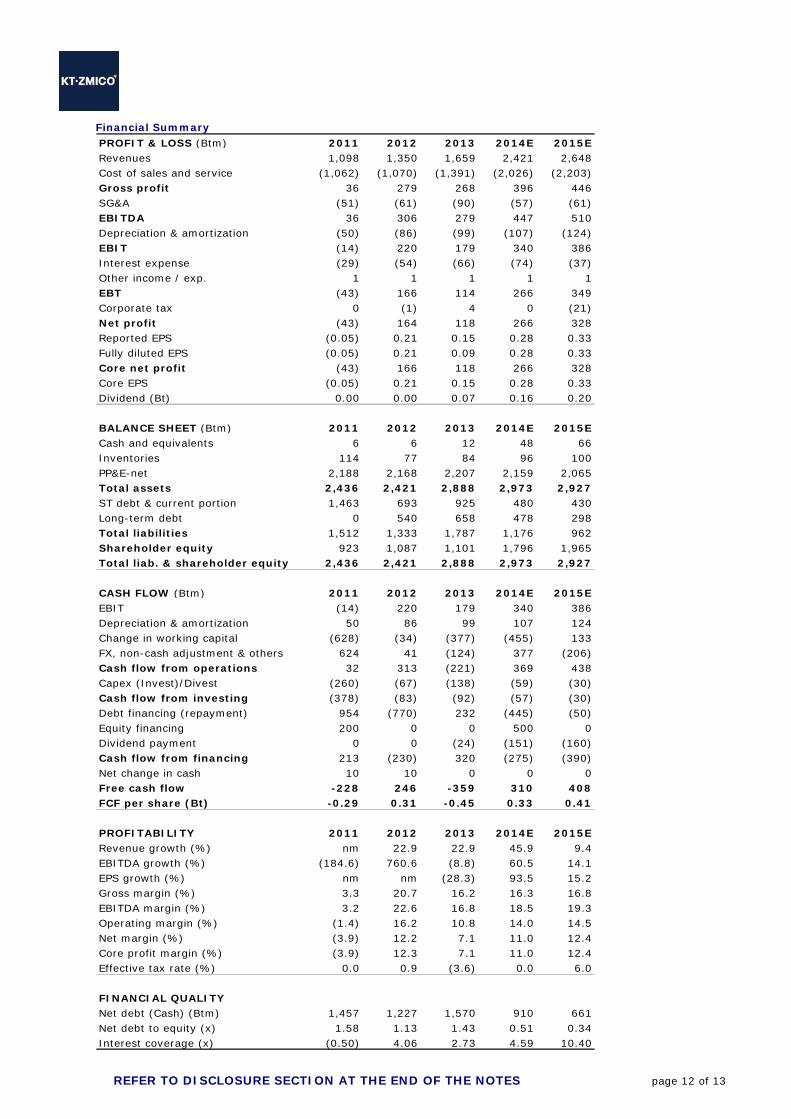
Financial Summary PROFIT & LOSS (Btm) 2011 2012 2013 2014E 2015ERevenues 1,098 1,350 1,659 2,421 2,648Cost of sales and service (1,062) (1,070) (1,391) (2,026) (2,203)Gross profit 36 279 268 396 446SG&A (51) (61) (90) (57) (61)EBITDA 36 306 279 447 510Depreciation & amortization (50) (86) (99) (107) (124)EBIT (14) 220 179 340 386Interest expense (29) (54) (66) (74) (37)Other income / exp. 1 1 1 1 1EBT (43) 166 114 266 349Corporate tax 0 (1) 4 0 (21)Net profit (43) 164 118 266 328Reported EPS (0.05) 0.21 0.15 0.28 0.33Fully diluted EPS (0.05) 0.21 0.09 0.28 0.33Core net profit (43) 166 118 266 328Core EPS (0.05) 0.21 0.15 0.28 0.33Dividend (Bt) 0.00 0.00 0.07 0.16 0.20
BALANCE SHEET (Btm) 2011 2012 2013 2014E 2015ECash and equivalents 6 6 12 48 66Inventories 114 77 84 96 100PP&E-net 2,188 2,168 2,207 2,159 2,065Total assets 2,436 2,421 2,888 2,973 2,927ST debt & current portion 1,463 693 925 480 430Long-term debt 0 540 658 478 298Total liabilities 1,512 1,333 1,787 1,176 962Shareholder equity 923 1,087 1,101 1,796 1,965Total liab. & shareholder equity 2,436 2,421 2,888 2,973 2,927
CASH FLOW (Btm) 2011 2012 2013 2014E 2015EEBIT (14) 220 179 340 386Depreciation & amortization 50 86 99 107 124Change in working capital (628) (34) (377) (455) 133FX, non-cash adjustment & others 624 41 (124) 377 (206)Cash flow from operations 32 313 (221) 369 438Capex (Invest)/Divest (260) (67) (138) (59) (30)Cash flow from investing (378) (83) (92) (57) (30)Debt financing (repayment) 954 (770) 232 (445) (50)Equity financing 200 0 0 500 0Dividend payment 0 0 (24) (151) (160)Cash flow from financing 213 (230) 320 (275) (390)Net change in cash 10 10 0 0 0Free cash flow -228 246 -359 310 408FCF per share (Bt) -0.29 0.31 -0.45 0.33 0.41
PROFITABILITY 2011 2012 2013 2014E 2015ERevenue growth (%) nm 22.9 22.9 45.9 9.4EBITDA growth (%) (184.6) 760.6 (8.8) 60.5 14.1EPS growth (%) nm nm (28.3) 93.5 15.2Gross margin (%) 3.3 20.7 16.2 16.3 16.8EBITDA margin (%) 3.2 22.6 16.8 18.5 19.3Operating margin (%) (1.4) 16.2 10.8 14.0 14.5Net margin (%) (3.9) 12.2 7.1 11.0 12.4Core profit margin (%) (3.9) 12.3 7.1 11.0 12.4Effective tax rate (%) 0.0 0.9 (3.6) 0.0 6.0
FINANCIAL QUALITYNet debt (Cash) (Btm) 1,457 1,227 1,570 910 661Net debt to equity (x) 1.58 1.13 1.43 0.51 0.34Interest coverage (x) (0.50) 4.06 2.73 4.59 10.40
REFER TO DISCLOSURE SECTION AT THE END OF THE NOTES page 13 of 13
DISCLAIMER
This document is produced using open sources believed to be reliable. However, their accuracy and completeness cannot be guaranteed. The statements and opinions herein were formed after due and careful consideration for use as information for the purposes of investment. The opinions contained herein are subject to change without notice. This document is not, and should not be construed as, an offer or the solicitation of an offer to buy or sell any securities. The use of any information contained in this document shall be at the sole discretion and risk of the user.
KT ZMICO RESEARCH – RECOMMENDATION DEFINITIONS
STOCK RECOMMENDATIONS SECTOR RECOMMENDATIONS BUY: Expecting positive total returns of 15% or more over the next 12 months TRADING BUY: Expecting positive total returns of 10% or more over the next 3 months SELL INTO STRENGTH: Expecting total returns between -10% to +10% over the next 12 month; share price has largely priced in fundamentals SELL: Expecting negative total returns of 10% or more over the next 12 months
OVERWEIGHT: The industry, as defined by the analyst's coverage universe, is expected to outperform the relevant primary market index by at least 10% over the next 12 months.
NEUTRAL: The industry, as defined by the analyst's coverage universe, is expected to perform in line with the relevant primary market index over the next 12 months.
UNDERWEIGHT: The industry, as defined by the analyst's coverage universe, is expected to underperform the relevant primary market index by 10% over the next 12 months.
KT•ZMICO Securities Company Limited 8th, 15th-17th, 19th, 21st Floor, Liberty Square Bldg., 287 Silom Road, Bangrak, Bangkok 10500
Telephone: (66-2) 695-5000 Fax. (66-2) 631-1709
Phaholyothin Branch 3rd Floor, Shinnawatra Tower II,
1291/1 Phaholyothin Road, Phayathai, Bangkok 10400 Telephone: (66-2) 686-1500
Fax. (66-2) 686-1666
Ploenchit Branch 8th Floor, Ton Son Tower,
900 Ploenchit Road, Lumpini, Pathumwan, Bangkok 10330 Telephone: (66-2) 626-6000
Fax. (66-2) 626-6111
Sindhorn Branch 2nd Floor, Sindhorn Tower 1, 130-132
Wireless Road, Lumpini, Pathumwan, Bangkok 10330 Telephone: (66-2) 627-3550
Fax. (66-2) 627-3582, 627-3600
Viphavadee Branch G Floor, Lao Peng Nguan 1 Bldg.,
333 Soi Cheypuand, Viphavadee-Rangsit Road, Ladyao, Jatujak, Bangkok 10900
Telephone: (66-2) 618-8500 Fax. (66-2) 618-8569
Chachoengsao Branch 108/34-36 Mahajakkrapad Road,
T.Namuang, A.Muang, Chachoengsao 24000
Telephone: (038) 813-088 Fax. (038) 813-099
Chonburi Branch 4th Floor, Forum Plaza Bldg.,
870/52 Sukhumvit Road, T. Bangplasoy, A. Muang, Cholburi 20000 Telephone: (038) 287-635
Fax. (038) 287-637
Pattaya Branch 382/6-8 Moo 9, T. NongPrue,
A. Banglamung, Cholburi 20260 Telephone: (038) 362-420-9
Fax. (038) 362-430
Khon Kaen Branch 5th Floor, Charoen Thani Princess Hotel,
260 Srichan Road, T. Naimuang, A. Muang, Khon Kaen 40000
Telephone: (043) 389-171-193 Fax. (043) 389-209
Sriworajak Building Branch1st – 2nd Floor, Sriworajak Building, 222
Luang Road, Pomprab, Bankgok 10100
Telephone: (02) 689-3100 Fax. (02) 689-3199
Central World Branch 999/9 The Offices at Central World, 16th Fl., Rama 1 Rd, Pathumwan,
Bangkok 10330 Telephone: (66-2) 673-5000,
(66-2) 264-5888 Fax. (66-2) 264-5899
Chiang Mai Branch 422/49 Changklan Road, Changklan
Subdistrict, Amphoe Meuang, Chiang Mai 50100
Telephone: (053) 270-072 Fax: (053) 272-618
Phuket Branch 22/61-63, Luang Por Wat Chalong Road,
Talat Yai, Mueang Phuket, Phuket 83000
Tel. (076) 222-811,(076) 222-683 Fax. (076) 222-861
Pak Chong Branch 173 175, Mittapap Road, Nong Sarai, Pak Chong,
Nakhon Ratchasima 30130 Tel. (044) 279-511 Fax. (044) 279-574
Hat Yai Branch 200/301 Juldis Hatyai Plaza Floor 3,
Niphat-Uthit 3 Rd, Hatyai Songkhla 90110
Telephone: (074) 355-530-3 Fax: (074) 355-534
Phitsanulok Branch Krung Thai Bank, Singhawat Branch
114 Singhawat Road, Muang, Phitsanulok 65000 Telephone: 083-490-2873
Information herein was obtained from sources believed to be reliable, but its completeness and accuracy are not guaranteed. All opinions expressed constitute our
views on that date and are not intended as an offer or solicitation to sell or buy any securities. Investors should exercise care when making a decision to invest in
securities. No one may modify or distribute any part of this report unless written permission is first received from Seamico Securities Plc. If any modifications are
made, quotes or references taken from the report and the report date must be clearly mentioned and must not cause misunderstanding or damage to the company.
Bangkhae Branch 6th Floor The Mall Group Building Bangkhae
275 Moo 1 Petchkasem Road, North Bangkhae, Bangkhae, Bangkok 10160
Tel. (66-2) 454-9979 Fax. (66-2) 454-9970
Nakhon Ratchasima Branch 624/9 Changphuek Road, .
Naimaung, A.Maung, Nakhon Ratchasima 30000 Telephone: (044) 247222
Fax: (044) 247171
Cyber Branch @ North Nana Krung Thai Bank PCL, 2 Floor,
North Nana Branch 35 Sukhumvit Rd.,Klong Toey Nua
Subdistrict , Wattana District, Bangkok 10110
Telephone: 083-490-2871
Nakhon Pathom Branch1156 Petchakasem Road, Sanamchan Subdistrict,
Amphoe Meuang , Nakhon Pathom Province 73000
Telephone: (034) 271300 Fax: (034) 271300 #100