Embed Size (px)
Citation preview
1
IPO survival in a reputational market
Susanne Espenlaub*
Arif Khurshed*
Abdulkadir Mohamed*
*Manchester Accounting & Finance Group, Manchester Business School, Booth Street West,
Manchester M15 6PB; UK. Fax: ++44 161 275 4023.
We thank Paul Andre (Associate editor), Michael Brennan, Cecile Carpentier, Alma Hales, Ranko Jelic, Tim Jenkinson, Stefano Paleari, Ajai Singh, Norman Strong, Jean-Marc Suret, Nick Weaver and an anonymous referee for their valuable comments and suggestions. We thank Silvio Vismara for his valuable comments and for providing us with some valuable IPO data. The authors also wish to thank their colleagues at Manchester Business School, and the participants of the EFMA IPO symposium (Oxford 2008) and the Southern Finance Association conference (2008) for their helpful comments on earlier drafts of this paper. This paper was previously circulated with the title ‘Is Aim a Casino?’
2
IPO survival in a reputational market
Abstract
We examine IPO survival in a “reputational” market, the Alternative Investment Market (AIM), where principle-based regulation pivots on the role of a regulatory agent, the nominated advisor (Nomad) to the IPO company, who certifies and controls listing quality. We find survival rates of AIM IPOs broadly in line with North American results. Our study examines whether and to what extent regulators can increase the chances of survival by tightening AIM’s notoriously lax listing rules. We examine the impact of four regulatory levers on IPO survival: the reputation of the Nomad, and (minimum) requirements on firm age, size, and public float. We find that the impact of all four levers on survival times is positive and (except for public float) statistically and economically significant with Nomad reputation having by far the strongest effect. We also report significantly worse survival chances for IPOs issued during hot markets. While these results are of obvious interest to regulators and participants of AIM, they also provide important lessons for market places modeled on AIM including the upper-tier of the U.S. over-the-counter market (OTCQX), Italy’s AIM Italia, and Japan’s Tokyo AIM.
JEL classification: G14, G18
Keywords: IPO; new list(ing); survival; delisting; Alternative Investment Market; AIM; over-the-
counter; OTCQX; regulation.
3
1. Introduction
In 2007, the US Securities and Exchange Commission (SEC) argued that London’s second tier
market, the Alternative Investment Market (AIM) had captured its large market share in new
listings thanks to its lax regulation at a time when US regulation had become more burdensome
following the Sarbanes Oxley Reforms. This came against the backdrop of a record influx of new
listings on AIM, persistently low numbers of IPOs in the U.S., and a growing number of U.S.
companies listing on AIM. The London Stock Exchange indignantly rejected the SEC claim that
30 per cent of new listings on AIM were ‘gone within a year’ (SEC commissioner Roel Campos
quoted in The Financial Times, 9 March 2007) arguing in turn that failure rates on AIM were a
mere three percent. The first objective of our paper is to provide evidence on these conflicting
claims by quantifying the survival rates of new listings on AIM.
The second and main objective of this study is to investigate the effect of AIM’s regulatory
regime on the survival of new AIM listings.1 We focus on the role of the nominated advisor
(Nomad), who act as gatekeepers tasked to ensure the suitability of new entrants to the market.
Our results provide valuable new insights and lessons for new markets with regulatory features
modeled on AIM such as the OTCQX, the “premier tier” of the U.S. over-the-counter market, the
First North tier of the Nordic OMX market, and the Tokyo AIM (a joint venture between the
London and Tokyo stock exchanges).2 The OTCQX website explicitly credits the successful
advisory role of the Nomads on AIM for inspiring its own “community-based” listing process.
Opened in 1995 as a market for small and growing companies, AIM has continually attracted new
listings (see Figure 1 in the Appendix), even in the aftermath of the dot com bubble when other
lower-tier stock markets collapsed (Audretsch and Lehmann 2005, Giudici and Roosenboom
2004 and Goergen et al. 2009). Compared to listing activity in the U.S. which collapsed after the
1 Studying survival complements other analyses of post-IPO events and long-term performance, such as, e.g., the recent long-term performance study of UK IPOs by Gregory et al. (2010). Here we adopt survival analysis (also known as hazard models) to examine the survival rates and times of AIM IPOs. Unlike probit or logit analysis, survival analysis allows us to take into account not just the binary information on whether a stock survives for a specified period or until a specified point in time, but also the length of time the stock survives. 2 OTCQX has positioned itself as a competitor to AIM seeking to attract both U.S. and foreign companies. Its marketing material claims substantially higher stock liquidity on OTCQX than on AIM (http://www.otcmarkets.com/content/doc/ps/OTCQXMedia.pdf). See Mendoza (2008) for a list of further markets emulating the AIM model.
4
internet bubble burst in 2000 and has stagnated ever since, during 2001-2004 the numbers of non-
financial IPOs on AIM roughly matched or exceeded those in the U.S. (taking Amex, NYSE and
NASDAQ together). In the same period, AIM also attracted more IPOs than the upper-tier of the
London Stock Exchange, the Main Market. During 2000-8, AIM attracted 50 percent more non-
domestic companies than NASDAQ.3 However, the flip side of AIM’s apparent success in
attracting listings under its “light-touch” rules may be that AIM “did not have any standards at
all and anyone could list” (John Thain, CEO of the New York Stock Exchange, quoted in The
Financial Times, 26 January 2007).
This raises questions over the role of regulation, specifically listing rules, in filtering potential
new entrants and ensuring that newly floated stocks are of sufficiently high quality to survive for
a reasonable period of time after the IPO. Regulation on AIM is a prime example of principle-
based regulation (as opposed to rule-based regulation), a system that allows players discretion in
the interpretation and implementation of broad principles. The functioning of this regulatory
regime relies on repeated players’ concerns for their reputational capital. On AIM, these repeated
players include institutional investors and, in particular, the nominated advisors (Nomads) who
act not merely as underwriters but also as guardians of AIM listed companies during the listing
process and throughout the period of listing. A substantial part of regulation is effectively
outsourced to Nomads, who act as “regulatory agents” or “decentralized regulators”. AIM has
been termed a “reputational market” (Davidoff 2007 cited in Mendoza 2008) where the quality of
listed company is certified and controlled by regulatory agents staking their reputational capital
rather than by the explicit rules and oversight of the (central) regulatory authorities (including the
Financial Services Authority, FSA).
The centralized AIM regulator controls at least four regulatory levers in the form of (actual or
potential) listing rules: (1) Rules regarding the role (and specifically, the reputation) of the
Nomad; and minimum requirements on (2) firm age (or trading record), (3) firm size (or market
capitalization), and (4) public float. This study examines whether and to what extent regulatory
3 See Figure 1 in the Appendix. The figures are from Jay Ritter’s website http://bear.cba.ufl.edu/ritter, and the websites of AIM and NASDAQ http://www.nasdaq.com/ and http://www.londonstockexchange.com/en-gb/products/companyservices/ourmarkets/ AIM_new/. Ritter’s IPO numbers are based on IPOs with an offer price of at least $5.00, excluding ADRs, unit offers, closed-end funds, REITs, partnerships, banks and S&Ls, and stocks not listed on CRSP.
5
change can improve the survival rates and times of AIM IPOs using one or several of the above
regulatory levers. By examining the survival of IPOs since the opening of AIM, we examine not
merely the survival of AIM listings but by implication the survival and success of AIM itself.
Using data for all IPOs floated in the period from the opening of AIM in 1995 until the end of
2004, and tracking these IPO stocks until 31 December 2010, we estimate survival rates of AIM
IPOs and find them broadly comparable to those of North American IPOs. We define survivors as
stocks that continue to be traded on AIM or transfer their listing to the upper-tier of the London
Stock Exchange Main Market (the Official List or Main Market).4 We identify various reasons
for delisting, and estimate survival (and failure) rates associated with alternative delisting
reasons. We investigate the determinants of survival rates (and times) to answer whether and to
what extent central regulators may improve the survivability of AIM IPOs by tightening the
listing rules on AIM, focusing in particular on the four regulatory levers mentioned above
(Nomad reputation, company age and size, and public float) We estimate an accelerated failure
time (AFT) model that allows the independent variables to have stronger (or weaker) impact on
survival times nearer the IPO date as compared to later in the listing period.
We find that all four regulatory levers increase survival times and (except for public float) their
effects are statistically and economically significant. We quantify the impact of the variables on
survival rates in several ways including by estimating “time ratios”, a method not reported in
previous IPO survival studies. Nomad reputation has by far the strongest effect: IPOs backed by
top-5 Nomads survive for between 3-8 years longer than other IPOs (depending on the measure
of Nomad reputation used). This finding highlights the crucial role played by Nomads on AIM,
and the value of Nomad reputation in resolving information problems and incentive conflicts that
are left unresolved by AIM’s principle-based regulation. Our results highlight the potential for
central regulators to extend survival times by tightening listing rules and requiring companies to
retain reputable Nomads.
4 A stock is a non-survivor if it is delisted due to a merger or acquisition (M&A), suspension, liquidation or for any reason other than a transfer to the upper-tier of the LSE. We recognize that delisting due to a merger or acquisition is not always bad news for the shareholders of the delisted stock. Therefore, we differentiate M&As from other, “unfavourable”, reasons for delisting. We check the robustness of our survival analyses that classify M&As as failures to treating some or all M&As as “right censored” survivors (i.e., observations that are not delisted during the period over which they are tracked). Previous IPO survival studies classify (some) M&As as non-survivors (e.g. Carpentier and Suret 2011) or as censored survivors (Jain and Kini 2000), or exclude them altogether from their samples (Hensler et al 1997).
6
Our analysis controls for a number of potential determinants of survival time including pre-IPO
company profitability, inside ownership at the time of the IPO, industry dummies, a time dummy
to control for IPOs during the internet bubble, and a dummy for UK incorporation of the
company (as opposed to foreign, non-UK incorporation).
The rest of the paper is organized as follows: Section 2 provides an overview of AIM and its
regulation; it also reviews the literature on IPO survival and outlines our research questions.
Section 3 describes the data and methodology. Our empirical findings are discussed in Section 4,
and Section 5 concludes the paper.
2. Background, Literature and Research Questions
The Alternative Investment Market (AIM) was established in 1995 by the London Stock
Exchange (LSE) to provide a market for small and growing companies, especially those unable to
meet the listing rules of the upper tier, the Main Market. Even in the aftermath of the dot com
bubble, AIM continued to attract a large number of IPOs and that the number of foreign IPOs has
consistently increased year on year with a four fold increase from 2003 to 2004. Figure 2 in the
Appendix gives information on the numbers of domestic and other firms admitted to AIM during
1995 to 2004, including both IPOs and non-IPO new entrants. The latter are excluded in this
study. Our sample comprises 918 UK-incorporated and other firms that listed on AIM during
1995-2004 and conducted an IPO. In total, our sample IPOs raised approximately £7 billion.
Regulation on AIM, both in terms of initial listing requirements and ongoing obligations after
listing, is among the least stringent in the world. The status of AIM as an exchange-regulated
market allows AIM to operate outside the regulatory regime imposed by European Union
directives on listing rules. The regulatory approach of AIM is a prime example of principles-
based regulation involving a comply-or-explain option giving companies considerable scope to
interpret the principles laid down in AIM’s regulatory documents and customizing their
compliance. By contrast, the rule-based regulatory approach adopted by the SEC provides
detailed, explicit guidelines that facilitate routine compliance checks but provide less flexibility
and are likely to impose higher compliance costs on companies (see e.g. Ford 2010). Central to
self-regulation approach of AIM is the role and the reputation of the Nominated Adviser (the so-
7
called “Nomad”). AIM regulation requires every AIM company to retain an AIM-approved
financial firm to act as its Nomad not only at the time of its IPO but for as long as the company is
listed on AIM. Nomads act not only as advisers and underwriters to companies at the time of the
IPO. By guiding companies on how to comply with AIM’s regulatory principles and by certifying
compliance by their advisee companies to the market, they also act as “gatekeepers” and
“decentralized regulators”. 5 AIM has been described as a “reputational market” in which the
quality of listed company is certified by the reputational capital of Nomads rather than by the
explicit rules and oversight of market authorities (Davidoff 2007 cited in Mendoza 2008).
If a company dismisses its Nomad, or if a Nomad decides to end its relationship with an AIM
quoted company, the company has 30 days to appoint a new Nomad, otherwise its shares are
suspended and eventually removed from AIM. A Nomad has to be a firm (not just an individual)
that has practiced corporate finance for at least two years and has been involved in at least three
relevant transactions (e.g., IPOs or takeovers requiring a prospectus) in those two years. Nomads
include accounting firms, investment banks, corporate finance firms and stockbrokers; all of these
firms are required to employ at least four suitably qualified individuals. The LSE website carries
a list of all firms authorized to act as Nomads (63 firms in 2010).
AIM requires that all new entrants produce an admission document disclosing details of the
directors’ backgrounds, their promoters, business activities and the firm’s financial position. The
main requirement for listing on AIM is that the stock is “appropriate” for the AIM market. It is
the responsibility of the Nomad to make this judgement and certify the suitability of the stock to
AIM participants. Once admitted to AIM, a company has ongoing disclosure requirements. It is
the Nomads’ responsibility to ensure the adequacy and timeliness of these disclosures.
Table 1 summarizes the admission requirements on the AIM, the Main Market, OTCQX and
NASDAQ. While the distinctive regulatory feature of AIM is the Nomad, on OTCQX this role is
performed by the so-called “designated advisor for disclosure” (DAD). Like AIM Nomads, U.S.
companies listing on OTCQX must appoint a DAD during the application process and retain this
adviser throughout their listing. While the admission documents of companies listing on the UK
5 By contrast, on the upper-tier Main Market of the London Stock Exchange the sponsoring financial advisers to IPOs companies are not required to provide continued advice and oversight to issuing companies after the IPO.
8
Main Market or on NASDAQ (Capital Market) are checked by the respective market regulatory
authority, these checks are delegated to the Nomad on AIM and to the DAD on OTCQX. Both
AIM and OTCQC have no minimum requirements on public float, while the Main Market
requires at least 25% of the shares in public hands, and NASDAQ requires at least 300
shareholders and at least one million shares in public hands. Like OTCQX, AIM does not require
its entrants to have a trading record while the Main Market requires at least three years trading
record. Depending on the listing route, NASDAQ requires zero to two years listing record.
Unlike OTCQX and the other markets, AIM does not stipulate a lower limit on size or market
capitalization. By contrast, the minimum market capitalization required is $5 million on OTCQX,
£10m on the Main Market and $50 million on NASDAQ. For an overview of the listing rules of
several European lower tier markets (the so called new markets) see Giudici and Roosenboom
(2004).
In sum, the explicit admission requirements stipulated by AIM (and OTCXQ) are less stringent
than those on the Main UK Market or on NASDAQ. At the same time, many regulatory
responsibilities on AIM are delegated to the Nomads (and to the DADs on OTCQX). Despite its
apparent success in spawning imitators, the role of Nomad has recently come under close scrutiny
following several scandals involving corporate fraud and failure, and allegations that Nomads
failed in their duties to appropriately screen and monitor companies. In response, the LSE
introduced a new rulebook for Nomads in February 2007 spelling out the duties of a Nomad in
greater detail. One Nomad, Nabarro Wells, was fined and publicly censured in October 2007 for
failing to conduct due diligence on companies it was bringing to AIM in 2005 and earlier. Others
decided to withdraw from the market resulting in a substantial decline in the number of Nomads
from 85 at the start of 2007 to 63 in 2010. Given the ample scope for abuse or negligence by
Nomads, their concern for their reputation is a crucial mechanism for controlling the multitude of
information and incentive problems among market participants on AIM (and similar markets).
There is an established body of literature on the survival of newly listed stocks in North America,
but to our knowledge, there is no published survival study of IPOs on UK stock markets. Next,
we discuss the most relevant North American studies, but we do not provide a comprehensive
literature review. Schultz (1993), Seguin and Smoller (1997), Hensler et al (1997), Jain and Kini
(1999, 2000, 2008), Fama and French (2004), Bradley et al (2006), Demers and Joos (2006), and
9
Kooli and Meknassi (2007) examine IPO survival using US data, and Carpentier and Suret
(forthcoming) use Canadian data. Table 2 summarizes the key aspects and findings of these
studies. The failure rates reported in previous US studies range from 2 to 9 percent over the first
year of listing, 6 to 42 percent over two years, 9 to 47 percent over five years, to 58.5% over 10
years post-IPO. The wide range of failure-rate findings is due to differences between markets,
sample periods, and stratification criteria (e.g. comparisons of penny and other stocks, or between
high tech and other industries).
Hensler et al. (1997) investigate the relation between the survival rate of IPO stocks and firm
characteristics using a hazard model. Their findings show that survival rates are positively related
to firm age and size, IPO initial returns and insider ownership. Jain and Kini (1999) examine the
probability of surviving post-IPO using a multinomial logit model. The results indicate that firm
size at the time of the IPO, pre-IPO operating performance and investment bankers’ prestige are
positively related to IPO survival. Jain and Kini (2000) examine whether venture capital (VC)
involvement improves the survival profile of IPO firms. Their findings indicate that the
probability of post IPO survival is significantly positively affected by VC backing and the
prestige of the investment bank leading the underwriting syndicate (as well as by other factors
likely to benefit from VC involvement such as road show success and analyst following). Jain
and Martin (2005) investigate the relationship between audit quality and post-IPO survival using
a proportional hazard model. They find that the hazard rate is negatively (and hence survival time
is positively) related to auditor quality. Kooli and Meknassi (2007) examine the survival profile
of IPO issuers from 1985 to 2005. They find that large IPOs have lower probability of failing
relative to small IPOs. They also find evidence that IPO underpricing increases the likelihood of
failure, while having a prestigious underwriter improves the survivability of the issuing firm.
Fama and French (2004) examine 10-year post-issue survival rates of US ‘new lists’ coming to
the market between 1973 and 1991. They find that the characteristics of companies going public,
such as profitability and growth, significantly changed over their sample period with more recent
new lists having lower profitability and higher growth. These changes in firm characteristics are
associated with a sharp decline in survival rates of new lists. Fama and French (2004) argue their
results show that the changes in the characteristics and survival rates of new lists are due to a
decline in the cost of equity allowing younger and less profitable firms to go public.
10
Our study examines the impact of regulation on IPO survival in a market specifically designed to
reduce the cost of listing for younger and riskier companies. We seek to answer the following
questions: What are the survival rates and times of AIM IPOs, and how do they vary over the
post-IPO period, and by industry, delisting reason, listing year and country of incorporation. Does
regulation affect the survival of new listings? Specifically, can (central) regulators increase
survival time of new listings by tightening listing rules in terms of stricter minimum requirements
on company size, age, and public float. In particular, should regulation make it mandatory for
companies to retain reputable nominated advisers that stake their good name to certify and
control quality? We aim to answer these questions below by measuring survival rates and times,
and by estimating the impact on survival times of Nomad reputation, company age, size and
public float (along with several control variables). We use a range of alternative measures for
Nomad reputation including market share (specifically, whether the Nomad ranked among the top
5 based on issue numbers or proceeds), Nomad credit score, Nomad profitability and Nomad firm
age.6 In the UK, the reputation measure typically used in US studies, the Carter-Manaster (1990)
tombstone measure, is often unavailable as “tombstone” listings of the underwriting syndicate are
rarely published. Our first two measures are designed to reflect reputation in terms of market
share. The three other reputation measures (credit score, profitability and age) are chosen to
capture the stability and likelihood of survival of the Nomad firm, which is often crucial to the
survival of AIM stocks given the requirement of ongoing Nomad supervision of AIM companies.
We also estimate the impact on survival of domestic versus foreign incorporation of the issuing
company and of the year of listing (to identify the impact of hot issue markets on subsequent
survival). Finally, we control for the impact of pre-IPO profitability of the issuing company and
inside ownership at the time of the IPO. High insider ownership is likely to mitigate agency
conflict and hence we expect the survival time to increase when insider ownership is high.
6 The five nomads backing the highest numbers of IPOs over our sample period 1995-2004 are Seymour Pierce Ltd, W. H. Ireland Ltd, Colins Stewart Europe, Nabarro Wells & Co. Ltd, and Canaccord Adams Ltd (ranked in descending order).
11
3. Data and Methodology
Our sample comprises all IPOs issued on AIM from the opening of the market in 1995 to the end
of 2004. The numbers of new admissions including both IPOs and non-IPOs is shown in Figure 2
in the Appendix. There were a total of 1683 new admissions during 1995-2004. We exclude
companies that entered AIM without conducting an IPO, such as introductions of stocks
previously traded on another market, leaving a sample of 918 IPOs.
IPOs are tracked until 31 December 2010 to determine whether they were delisted or not. The list
of IPO firms, offer price, market capitalization, issue proceeds, country of incorporation and
industry sectors are obtained from the London Stock Exchange (LSE). Dates of incorporation are
obtained from Companies House. The dates of the delisting of stocks are collected from World
Scope and cross-referenced with the London Share Price Database (LSPD). First-day closing
stock prices are taken from Datastream and Perfect Analysis. Venture-capital (VC) backed IPOs
are identified using data provided by the British Venture Capital Association (BVCA).
Information on the credit score, return on assets and firm age of Nomads is from the FAME
database.
Unlike the Logit and Probit methods, applied in some previous studies of IPO survival (see Table
2), survival analysis allows us to take into account not just binary information on whether a stock
survives for a specified period or until a specified point in time, but also the length of time the
stock survives. Unlike linear regression, survival analysis uses non-normal distributions that
accommodate so-called “censored” observations. In our study, sample IPOs are “right censored”
if they have not (yet) been delisted and remain listed until the end of the study period (31
December 2010). Survival analysis uses both censored and uncensored observations to provide
consistent estimators (Allison 2000). Shumway (2001) finds that survival models are theoretically
and empirically superior to “static models” (such as Logit or Probit).
We define survivors as stocks of firms that continue to be traded on AIM or transfer to the
London Stock Exchange’s upper-tier, the Main Market.7 By implication, non-survivors are stocks
that were delisted from AIM trading due to suspension, liquidation, merger/acquisition or for any
7 During our sample period 1995-2004, 47 AIM companies transferred to the Main Market.

12
other reason except a move to the Main Market. We also distinguish between delisting due to
merger or acquisition and delisting due to other, negative reasons because the impact on investors
is typically far more adverse in the case of negative delistings (e.g. liquidations) than in mergers
or acquisitions. We examine the robustness of our results by alternately classifying all mergers
and acquisitions as failures (non-survivors), or by treating all or some M&A stocks as “censored”
survivors, that is, as stocks that drop out of the study for reasons other than delisting and are
therefore still considered alive at the end of our study period. Some firms are likely to be acquired
as a result of poor performance or financial difficulty. We seek to differentiate such poorly
performing M&A stocks from others by imposing a performance criterion. We identify M&A
delistings of well-performing companies and classify them as censored survivors by ranking
companies on the basis of four performance measures: cash to total assets, total liability to total
asset, operating income to total asset, and the current ratio (current assets over current liabilities)
in the year prior to the M&A delisting. Companies that rank above median based on all four
measures are considered censored survivors. We classify M&A delistings of below-median
performing companies as failures.
The survival rates of IPOs are estimated non-parametrically using the Kaplan-Meier method
based on the following expression:
1
( )ij
i ij
i i
n dS t
n
δ
=
−=
∏ (1)
or equivalently
)()( 1−
−= j
j
jjj tS
n
dntS
(2)
where S(tj) is the estimated survival function in month tj (measuring the probability of survival
beyond tj conditional on a stock being listed until at least month tj), ni is the number of the IPOs
that are listed and participating in the study at the start of month tj (also known as the risk set at
tj), and dj is the number of the IPOs delisted during month tj, δi is equal to one if there is a failure
and zero if there is no failure. Alternatively and equivalently, Equation (1) can be restated as
13
Equation (2) to express the survival function in month tj as the probability of survival in month tj
(conditional on a stock being listed until at least month tj) times the survival function in the
previous month tj-1 (see Kleinbaum 1996, p56).
Below, we apply Equation (2) to estimate the survival rates for each post-IPO month for the full
sample and for various subsamples. To test whether IPOs in different groups (such as subsamples
of IPOs grouped by issue year or by industry) share the same Kaplan-Meier survival curves, we
use the log rank test (e.g., Kleinbaum 1996, p557-63), a large-sample chi-square test. The test
involves classifying the failure rates into observed and expected failure rates. If the observed
failure rate is significantly different from the expected failure rate, the test rejects the null
hypothesis that the groups share the same survival curves.
Median survival time (ST) is defined as the number of months elapsed from the IPO until the
point in time when half the sample stocks have failed and the cumulative sample survival rate has
dropped to 50 percent. If the cumulative survival rate is still greater than 50 percent at the end of
the study period (here, 31 December 2010), the median survival time is not computed and
reported as N/A.
We estimate a special type of survival model known as the Accelerated Failure Time (AFT)
model. Three previous studies (listed in Table 2) use the accelerated failure time (AFT) method
that allows the impact of the independent variables on survival time to vary over the post-IPO
period depending on the length of time since listing. In the AFT model, exp(∑βiX i) is an
“acceleration factor”: The effect of a covariate is to extend or shrink the length of survival by a
constant relative amount exp(∑βiX i) if exp(∑βiX i) > 1 survival time is increased, and if
exp(∑βiX i) < 1 it is decreased (Bradburn et al. 2003). Our AFT model allows for the possibility
that the impact of the four regulatory levers on survival may be particularly pronounced in the
period soon after the IPO and less so in the longer term.
The AFT model is typically expressed in terms of a log-linear function with respect to time (see
e.g. Hensler et al. 1997; Bradburn et al. 2003)
jp110j ...)Ln(T εβββ +++= pXX (3)
14
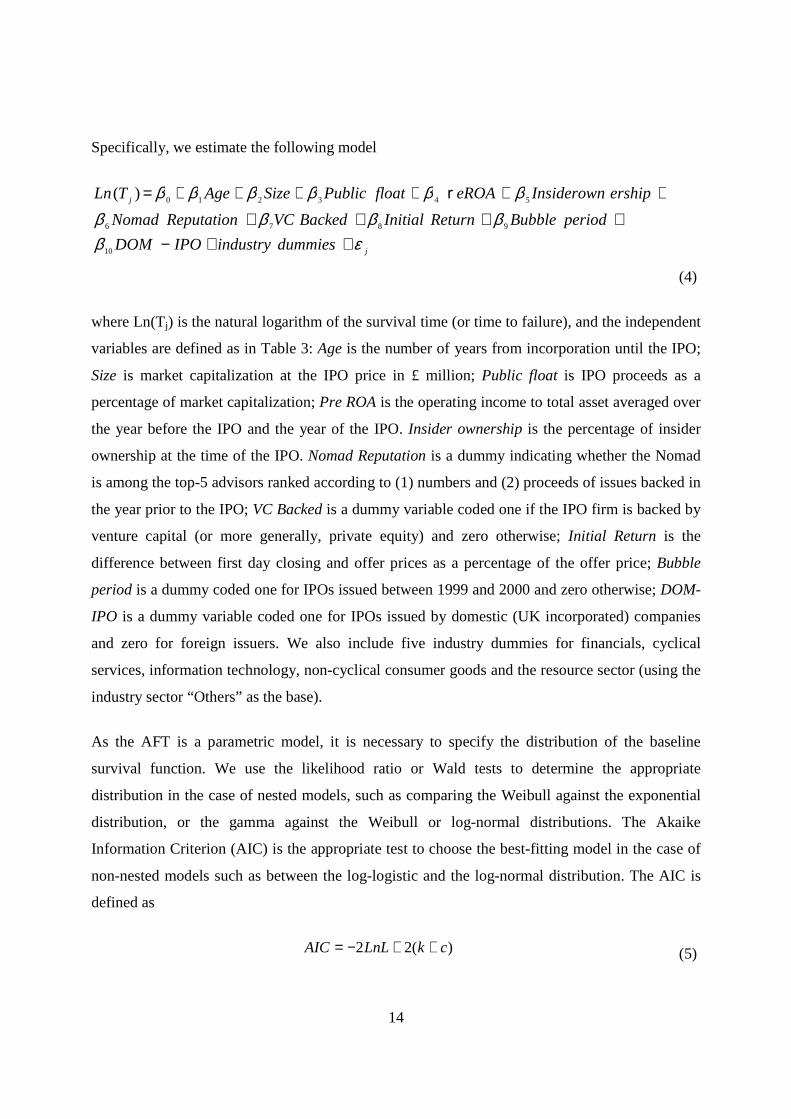
Specifically, we estimate the following model
j
j
dummiesindustryIPODOM
periodBubbleReturnInitialBackedVCReputationNomad
ershipInsiderowneROAfloatPublicSizeAgeTLn
εβββββ
ββββββ
++−++++
++++++=
10
9876
543210)( Pr
(4)
where Ln(Tj) is the natural logarithm of the survival time (or time to failure), and the independent
variables are defined as in Table 3: Age is the number of years from incorporation until the IPO;
Size is market capitalization at the IPO price in £ million; Public float is IPO proceeds as a
percentage of market capitalization; Pre ROA is the operating income to total asset averaged over
the year before the IPO and the year of the IPO. Insider ownership is the percentage of insider
ownership at the time of the IPO. Nomad Reputation is a dummy indicating whether the Nomad
is among the top-5 advisors ranked according to (1) numbers and (2) proceeds of issues backed in
the year prior to the IPO; VC Backed is a dummy variable coded one if the IPO firm is backed by
venture capital (or more generally, private equity) and zero otherwise; Initial Return is the
difference between first day closing and offer prices as a percentage of the offer price; Bubble
period is a dummy coded one for IPOs issued between 1999 and 2000 and zero otherwise; DOM-
IPO is a dummy variable coded one for IPOs issued by domestic (UK incorporated) companies
and zero for foreign issuers. We also include five industry dummies for financials, cyclical
services, information technology, non-cyclical consumer goods and the resource sector (using the
industry sector “Others” as the base).
As the AFT is a parametric model, it is necessary to specify the distribution of the baseline
survival function. We use the likelihood ratio or Wald tests to determine the appropriate
distribution in the case of nested models, such as comparing the Weibull against the exponential
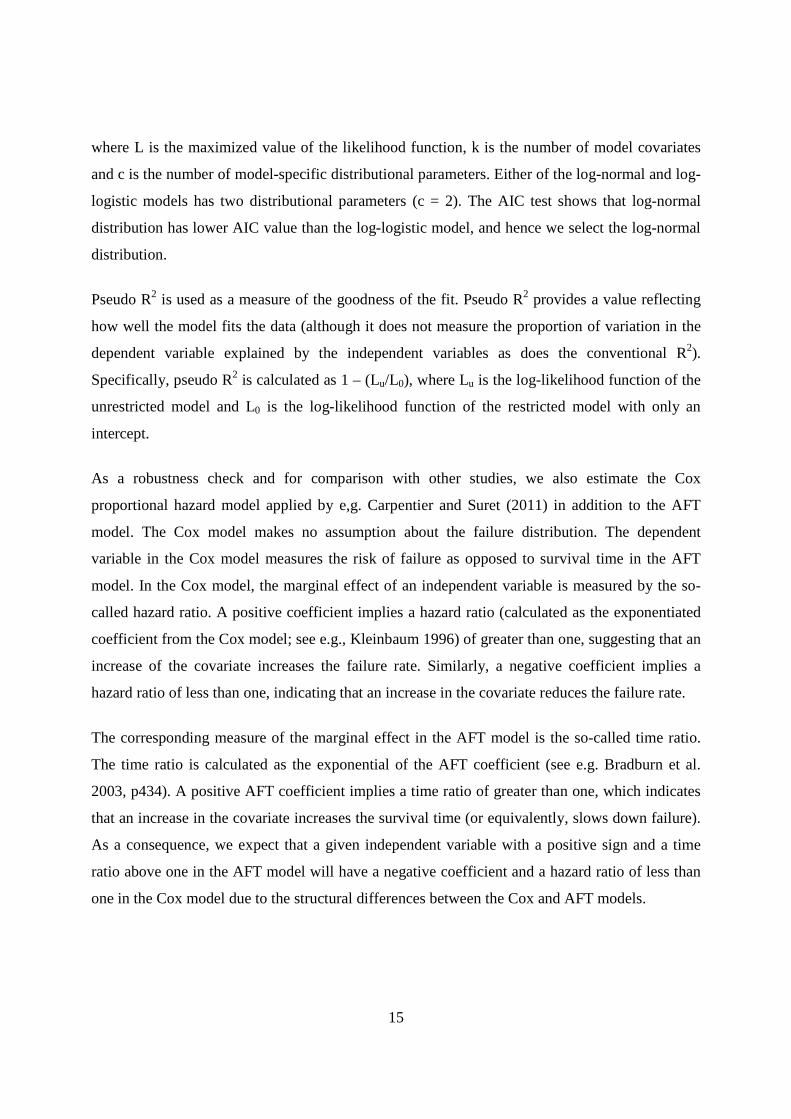
distribution, or the gamma against the Weibull or log-normal distributions. The Akaike
Information Criterion (AIC) is the appropriate test to choose the best-fitting model in the case of
non-nested models such as between the log-logistic and the log-normal distribution. The AIC is
defined as
)(22 ckLLnAIC ++−= (5)
15
where L is the maximized value of the likelihood function, k is the number of model covariates
and c is the number of model-specific distributional parameters. Either of the log-normal and log-
logistic models has two distributional parameters (c = 2). The AIC test shows that log-normal
distribution has lower AIC value than the log-logistic model, and hence we select the log-normal
distribution.
Pseudo R2 is used as a measure of the goodness of the fit. Pseudo R2 provides a value reflecting
how well the model fits the data (although it does not measure the proportion of variation in the
dependent variable explained by the independent variables as does the conventional R2).
Specifically, pseudo R2 is calculated as 1 – (Lu/L0), where Lu is the log-likelihood function of the
unrestricted model and L0 is the log-likelihood function of the restricted model with only an
intercept.
As a robustness check and for comparison with other studies, we also estimate the Cox
proportional hazard model applied by e,g. Carpentier and Suret (2011) in addition to the AFT
model. The Cox model makes no assumption about the failure distribution. The dependent
variable in the Cox model measures the risk of failure as opposed to survival time in the AFT
model. In the Cox model, the marginal effect of an independent variable is measured by the so-
called hazard ratio. A positive coefficient implies a hazard ratio (calculated as the exponentiated
coefficient from the Cox model; see e.g., Kleinbaum 1996) of greater than one, suggesting that an
increase of the covariate increases the failure rate. Similarly, a negative coefficient implies a
hazard ratio of less than one, indicating that an increase in the covariate reduces the failure rate.
The corresponding measure of the marginal effect in the AFT model is the so-called time ratio.
The time ratio is calculated as the exponential of the AFT coefficient (see e.g. Bradburn et al.
2003, p434). A positive AFT coefficient implies a time ratio of greater than one, which indicates
that an increase in the covariate increases the survival time (or equivalently, slows down failure).
As a consequence, we expect that a given independent variable with a positive sign and a time
ratio above one in the AFT model will have a negative coefficient and a hazard ratio of less than
one in the Cox model due to the structural differences between the Cox and AFT models.
16
4. Results
Descriptive Statistics and IPO Frequency
Table 4 presents descriptive statistics of the variables used in the analysis. The average age of
IPO firms joining the AIM, measured as the number of years from incorporation until AIM
listing, is three years. The youngest firm in our sample was incorporated only four months before
the IPO (which is rounded up to one year in our analysis). By contrast, the oldest company had
been incorporated for 11 years at the time of its IPO. AIM firms show a lot of variability in terms
of their size. While the average market capitalization at IPO is £21.549 million, market
capitalization ranges from a mere £234,000 to £518.6m. Over the sample period, the average
initial return is 4.5 percent, but median initial return is far lower at a mere 0.735 percent. Public
float, in terms of the proportion of IPO proceeds over market capitalization at the IPO, averages
31 percent and ranges from a mere one percent to a maximum of 95 percent. Only 11 percent of
AIM IPOs are backed by private equity or venture capital; this is discussed further below.
We measure Nomad reputation using five alternative measures (see also Table 4). The first two
are dummy variables coded one (for a given IPO company) if the Nomad ranks among the top
five Nomads according to (1) the number and (2) the proceeds of AIM IPOs backed by the
Nomad in the year prior to the IPO of the given sample company. We find 60 or 72 percent of our
sample IPOs are backed by reputable (top five) Nomads depending on whether the Nomads are
ranked by IPO numbers or by proceeds. Next, we examine the characteristics of the Nomads in
terms of their credit scores, profitability (return on assets) and Nomad age. The average credit
score of the Nomad (at the time of the advisee company’s IPO) is nearly 55 ranging from a
minimum of 9 to a maximum of 96. The return on assets of the Nomad firms (at the time of the
advisee’s IPO) is healthy averaging 20 percent but ranging from a very low -88 percent to almost
98 percent. The average age of the Nomad firm (at the advisee’s IPO) is 12.57 years ranging from
one to 57 years.
Nearly 26 percent of the IPOs considered in our sample came to the market during the dot-com
bubble years of 1999 and 2000. The majority (89 percent) of the IPOs are issued by domestic
companies. In terms of industry composition, the largest number of IPOs come from the cyclical
17
services industry (31 percent), followed by the financial sector (23 percent). The information
technology, non-cyclical consumer goods and resources industries each account for around 8 to
10 percent of our sample IPOs.8
Table 5 shows the distribution of IPOs by year of issue and by industry (based on the FTSE
Global industry classification). During our sample period from 1995 to 2004, the IPO market on
AIM tends to fluctuate around an upward sloping trend line reaching temporary peaks every four
years: first in 1996 with 94 IPOs, then in 2000 with 179 IPOs, and finally again in 2004 with the
highest number of IPOs in the sample period (243 IPOs). In 1997 and 1998, and again in 2001
and 2003, IPO numbers on AIM fell. Compared to listing activity in the U.S. which collapsed
after the internet bubble burst in 2000 and has stagnated ever since, during 2001-2004 the
numbers of IPOs (of non-financial companies) on AIM roughly matched or exceeded those in the
U.S. (for Amex, NYSE and NASDAQ together). During 2001-2004, there were 94, 60, 66 and
243 IPOs on AIM, and only 79, 66, 62 and 174 IPOs in the U.S.9 AIM also attracted more IPOs
during 2001-2004 than the upper-tier of the London Stock Exchange, the Main Market.
As noted previously, most AIM IPOs in our sample originate from the financial and cyclical
services sectors. The number of IPOs in the cyclical service sector was consistently high since the
inception of the market, while the number of IPOs in the financial sector only gathered
momentum from 1999 onwards. The number of technology firms joining AIM only picked up
during the internet bubble of 1999 and early 2000 and, as expected, dropped off after the internet
bubble burst in the spring of 2000. However, 2004 saw a renewed rise in IPOs from the IT sector.
Panel A of Table 6 breaks down the numbers and percentages of sample IPOs by year and by
Nomad reputation (Panel A), domestic versus foreign incorporation (Panel B), or venture-capital
backing of the issuing company in Panel C (where venture capital is defined broadly to include
private equity).
8 In the Appendix, we report the correlation matrix for the variables in our analysis. Based on the estimated correlation coefficients, multicollinearity is not an issue in this study.
9 See Figure 1 in the Appendix. The figures are numbers of IPOs per year. For the U.S. the figures are based on IPOs with an offer price of at least $5.00, excluding ADRs, unit offers, closed-end funds, REITs, partnerships, banks and S&Ls, and stocks not listed on CRSP. The figures are taken from Jay Ritter’s website http://bear.cba.ufl.edu/ritter; see that site for further details on U.S. IPO activity.
18
In almost each year between 44 to 59 percent of AIM IPOs involved a reputable (top-5) Nomad.
The year 2001 saw a sudden drop in the percentage of top-5 Nomad-backed IPOs to 32 percent,
and the reverse occurred during 2003 when 73 percent of IPOs were brought to the market by a
top-5 Nomad. Notably, in the hot-issue years 2001 and 2004, characterized by unusually large
numbers of IPOs (179 and 243 IPOs, respectively), the majority of IPOs were backed by
reputable Nomads (59 and 62 percent of IPOs, respectively). In 2001 and 2004, the numbers of
IPOs brought to the market by the top-5 Nomads quadrupled and tripled, respectively, relative to
the previous year. This suggests that reputable Nomad firms are able to expand their business
rapidly, probably in the face of increased demand by issuers, and are unlikely to face tight
capacity constraints during hot issue periods.
Panel B of Table 6 gives a breakdown of IPO numbers by country of incorporation and by issue
year. IPOs of foreign firms make up a relatively small proportion ranging from a minimum of
under six percent in 2000 to a maximum of over 16 percent in 2004. The highest number of
foreign IPOs took place in 2004 with 40 foreign IPOs; by contrast, throughout the previous nine
years, 1995-2003, there were only 60 foreign IPOs. As the allegations relating to the decline in
the quality of AIM entrants have often focused on issuers incorporated outside the UK, it will be
interesting to examine the survivability of this subsample with a specific focus on the final
sample year, 2004 (see below and Table 8).
Finally, Panel C shows figures on IPOs backed by venture-capital or private-equity versus non-
backed IPOs by year. The proportion of backed IPOs started to decline in 1998 from around 25
percent during 1995-1997 to under six percent in 2000 and then to a low of three percent in 2002.
This relatively low and declining proportion of venture-backed IPOs may appear surprising given
the supposed attractiveness of AIM to speculative and young ventures. However, it needs to be
appreciated that “venture capital” in the UK is mostly not in the form of seed or early-stage
funding but rather later stage funding known in the US as private equity. It seems that AIM is not
an attractive exit venue for these private-equity backers.
19
IPO Survival Rates and Times
Table 7 shows the survival rates of our sample AIM IPOs for one, three and five years after the
IPO. Specifically, the table reports median survival times and cumulative survival rates calculated
using the non-parametric Kaplan-Meier method. The median survival time (ST) for the full
sample is 76 months (Panel C); that is, half the sample IPOs survive for 76 months or less.
Median survival time varies considerably by issue year with IPOs issued during the hot markets
of 1999 and 2004 having the lowest median survival times: half the IPOs issued during 1999 and
2004 survive for only 43 and 46 months or less, respectively. By contrast, IPOs issued in 1995
had a median survival time of 103 months.
By comparison with issue year, the industry sector of the issuing company causes less survival-
time variation with median survival times ranging from 70 months for financials to 98 months for
companies in “other” industries.
Breaking these figures down further by Nomad reputation, we find that IPOs with top-5 Nomads
have (often substantially) higher median survival times for all issue years except for 2004.
As with median survival times, the figures on survival rates in Table 7 indicate a substantial
degree of variation depending on the year of issue with one-year survival rates ranging from 85 to
100 percent: Specifically, survival rates drop from the maximum of 100 percent recorded for
IPOs in 1995 and 2002 to 85 percent for issues during the internet bubble in 1999. The bubble
year 1999 is also associated with the lowest survival rates over three and five years (at 57 and 32
percent, respectively). These year differences are statistically significant as a log rank test rejects
the null hypothesis of equality of survival rates across issue years (chi-square: 42, p-value:
0.000).10
Breaking the sample down by industry, we find that survival rates vary comparatively little across
industries; e.g., survival rates over one year range from 91 percent (for IT IPOs) to 97 percent for
the non-cyclical consumer goods sector and resource companies. While there is considerable
industry variation in the five-year survival rates among non-domestic companies, this result is
10 Under the null hypothesis of equality of the subsamples the log rank test statistic is chi-square distributed with G – 1 degrees of freedom, where G is the number of groups (G=2 in this case).

20
due to the small numbers of observations in each industry sector. Overall, the industry differences
in survival rates are statistically insignificant with the log rank test across industries taking a chi-
square value of 6.623 (p-value: 0.250).
We find a substantial effect of Nomad reputation on survival rates and times. Table 7 shows the
figures separately for IPOs backed by a “Top-5 Nomad” and those backed by an “Other Nomad”.
We find that median survival times and cumulative survival rates over 1, 3 and 5 years after the
IPO are consistently higher for top-5 Nomad-backed IPOs than for others for the full sample
period, and in each issue year. The pattern is similar but not quite as clear-cut when we compare
IPOs with Top-5 and other Nomads across the issuers’ industrial sectors (in Panel C).
Table 8 breaks down the failure rates (defined as 100 percent minus the survival rate) by reason
of delisting. It also reports figures separately for IPOs with and without top-5 Nomads. Delisting
due to M&A accounts for 1.81 percent points of the overall one-year failure rate of 7 percent (see
Table 7). Of the three-year failure rate of 27 percent, over 10 percentage points are due to M&A
delistings; and for the five year window, M&A make up 16 percent out of a total failure rate of 41
percent.
We also find a clear-cut Nomad reputation effect in that the involvement of a top-5 Nomad
results in consistently lower failure rates across all three windows and all delisting reasons.
Referring back to the summary of the results of earlier studies in Table 2, we can conclude that
the failure rates we estimate for AIM IPOs are within the ranges reported in previous studies of
the US and Canadian markets (Bradley et al 2006, Kooli and Meknassi 2007, Schultz 1993).
In conclusion, we do not find support for the claims of the US regulator that the failure rate of
AIM IPOs is 30 percent within one year of the issue. Instead we find that seven percent of IPOs
are delisted within one year (treating mergers and acquisitions as failures). And this figure falls to
slightly over five percent (7–1.81 percent) when we focus solely on negative reasons for delisting
(i.e. excluding M&As).
21
Univariate Analysis of Survivors and Failures
Table 9 compares the descriptive statistics for the subsamples of survivors (stocks that remain
listed until the end of the study period on 31 December 2010) and non-survivors (stocks that are
delisted). In Panel A we classify M&As as non-survivors (failures). The results in Panel A show
that there are substantial and significant differences between survivor and non-survivor IPOs.
Survivors clearly differ from non survivors in terms of the reputation of their Nomads. The
proportion of IPOs backed by top-5 Nomads (ranked on the basis of IPOs backed in the pre-IPO
year) is significantly higher at over 62 percent among survivors than among non survivors (53
percent). Using the Nomad ranking based on IPO proceeds, 77 percent IPOs of the survivors are
backed by top-5 Nomads compared with only 68 percent of the non-survivors. The means and
medians of the continuous reputation measures (Nomad credit score, return on assets and age) are
statistically significantly higher for survivors than for non-survivors. Among survivors, the
average Nomad credit score is almost 69, but among non survivors it is only 41. The Nomads of
survivors have an average return on assets of over 21 percent, compared with 16.6 percent for the
Nomads of non survivors. The average age of the Nomad is almost 14 years among survivors but
less than 11 years among non-survivors.
In terms of the other regulatory levers, we find that surviving IPO companies are significantly
older and larger than non-surviving IPO companies. Survivor IPOs have significantly higher
initial returns (underpricing) than non survivors. Of the surviving sample IPOs only 17 percent
occurred during the bubble period compared to a significantly higher proportion of bubble IPOs
(34%) among non-survivors indicating a disproportionately higher failure risk among bubble
IPOs. The proportion of IPOs issued by domestic companies is (marginally significantly) higher
among the survivors than among non-survivors suggesting that domestic IPOs are more likely to
survive than non-domestic IPOs. There are also some significant industry effects with a higher
percentage of cyclical services IPOs among survivor IPOs than among non-survivor IPOs, and
vice versa for IPOs of companies in the resource sector. By contrast, there are no significant
differences between survivors and non-survivors in terms of public float and VC backing.
Survivors have substantially, but statistically insignificantly, higher pre-IPO profitability than
non-survivors. Survivors also differ in terms of inside ownership at the IPO; this difference is less
22
substantial than the profitability differential (with survivors having around 67 percent, and others
63 percent inside ownership) but the difference is statistically significant.
In Panel B of Table 9, M&As are classified as censored, yet the results remain qualitatively
unchanged except for the industry effect in the cyclical services sector which is no longer
significant. Instead, it is now in the financial sector where we find a significantly higher
proportion of IPOs among non-survivors than among survivors.
AFT Estimation of Survival Model
Next, we estimate an accelerated failure time (AFT) model to investigate the effects on IPO
survival time of the four regulatory levers: nomad reputation, minimum age, market capitalization
(size), and public float, controlling for other issue and firm characteristics, specifically initial
returns, VC backing, timing of the IPO during the internet bubble, domestic incorporation, and
industry effects. Based on the AIC (outlined in the Methodology section above), we choose the
log-normal distribution over alternatives such as the log-logistic distribution.
The results of the AFT model are presented in Table 10. The models in Panel A treat observations
delisted due to a merger or acquisition as non-survivors (or failures), while those in Panel B treat
some mergers and acquisitions as censored observations (i.e., delisting is not observed in the
period over which the observation is tracked). Specifically, M&A delistings of companies with
above-median performance in the year before the M&A are classified as censored survivors,
while M&A delistings of below-median performers are treated as failures. Prior studies of IPO
survival classify (some) mergers and/or acquisitions as non-survivors (e.g. Carpentier and Suret
forthcoming), while others classify them as censored survivors (Jain and Kini 2000) or exclude
them altogether from their samples (Hensler et al 1997).
We employ five alternative variables measuring Nomad reputation as outlined above and
summarized in Table 3. Model I in Table 10 (in both panels) reports the results using the binary
measure coded one for Nomads ranking among the top 5 in terms of the numbers of IPOs the
Nomads backed in the year before the IPO (Nomad Reput1). Model II uses the corresponding
binary top-5 measure based on IPO proceeds (Nomad Reput2). Models III through V use the
23
continuous reputation measures of Nomad credit score (Nomad Reput 3), Nomad return on assets
(Nomad Reput 4) and Nomad age (Nomad Reput 5).
In all five models, survival time is positively related to the four regulatory levers: Nomad
reputation, company age, size (market capitalization), and public float. In all models, the
coefficients of Nomad Reputation, Age, and Size are statistically significant, while the coefficient
of Public float is insignificant. Our results on the effect of the regulatory levers on survival are
robust to alternative classifications of M&As (see Table 10, Panel B, and Appendix Table 2) and
to variations in the measurement of Nomad reputation. We conduct further robustness tests using
a broader definition of Nomad reputation with Nomads classed as reputable if they rank among
the top 10 (instead of the top 5) ranked on either IPO numbers or proceeds. The results are
qualitatively similar but with smaller estimated coefficients on Nomad Reputation. (These results
are not reported in the tables but are available from the authors on request.)
Initial returns also have a significant positive effect on survival time. By contrast, IPO issuance
during the internet bubble period (Bubble period) significantly reduce survival time. Similarly,
venture-capital backing (VC_Backed) has a negative and in Panel A significant effect on survival
time. By contrast, the indicator of domestic incorporation of the IPO firm (DOM-IPO) is
insignificant, and there are no statistically significant industry effects.
Our results are broadly consistent with prior U.S. studies (Schultz 1993; and Hensler et al 1997)
on the determinants of the survival rate and time, indicating that age, size and initial returns at the
time of issue are positive key determinants of survival times. Although we find a negative (and in
Panel A, significant) effect of venture backing on survival, contrary to Jain and Kini (2000), this
result is probably unreliable due to the small number of venture-backed IPOs on AIM (with
venture-backed IPOs accounting for only 11 percent of our sample).
Based on the coefficients of the AFT model, our results suggest a clear role for three of the four
regulatory levers: Nomad reputation, and company age and size. Next, we assess the impact of
these four levers and the other explanatory variables on IPO survival on the basis of the estimated
time ratios. As outlined in the Methodology section, the time ratio equals the exponential of the
coefficient, exp(β), and measures the extent to which changes in the independent variable speed
up or delay the occurrence of delisting (i.e., shorten or lengthen the time to failure or delisting).
24
The regulatory lever with the strongest impact on survival is Nomad Reputation. The time ratios
of the variables show the multiple by which survival time increases for a unit increase in the
explanatory variable. The time ratios of the binary reputation measures Reput1 and Reput2 are
1.456 and 1.74 (in Panel A, Models I and II, respectively) and 1.403 and 1.85 (in Panel B,
Models I and II, respectively). This suggests that a one unit increase in either of the two binary
reputation variables from its mean extends survival time by a multiple of between 1.405 to 1.85,
or in other words by between 40 and 85 percent. However, given the binary nature of the
variables, it is difficult to interpret the effect in this way, and we use an alternative method
discussed below.
To quantify the effect of the binary variables, we calculate the effect on estimated survival time
of a binary increase in the variable from zero to one holding all parameters constant and
measuring all other variables at their means.11 For the binary Nomad reputation measures, an
increase from zero to one represents a switch from a lower ranked Nomad to one in the top 5. We
find that switching to a reputable Nomad raises estimated survival time by between 1.6 to 4.2
years (depending on the reputation measure and the classification of M&As). The lowest result
(1.6 years) is found in Model I, Panel A, where mergers and acquisitions are treated as failures
and Nomads are ranked based on IPO numbers using Nomad Reputation (1); the highest is in
Model II, Panel B, using Nomad Reputation (2) based on IPO proceeds and classifying M&A
delistings of above-median performing companies as censored survivors. These results suggest
that regulators can increase IPO survival by an economically significant one and a half to four
years by requiring all new issues to be certified and controlled by reputable financial firms (such
as the AIM Nomads or the DADs on OTCQX). This finding is of clear interest not merely to
regulators but to issuers and investors alike. It is also a feather in the cap of reputable Nomads.
The time ratios of the continuous reputation measures (based on Nomad credit score, return on
assets and age) are smaller than those of the binary measures, ranging from 1.002 (in Model IV,
Panel B) to 1.124 (Model III in Panel B). In other words, a one unit increase in one of these
measures increases survival time by between 0.2 to 12.4 percent. In interpreting these results it is
important to remember that a one unit change in the continuous variables is proportionately very
11 We are grateful to Norman Strong for suggesting this measure.
25
small (e.g. a one percentage point change in return on assets). We explore the quantitative impact
of these variables further below.
Among the three continuous levers, Age has the strongest impact on survival with a time ratio
ranging from 1.069 (in Model II, Panel A) to 1.093 (in Model IV, Panel B). These time ratios
indicate that ceteris paribus a regulator can increase survival time by a multiple of between 1.069
to 1.093, in other words by between 6.9 and 9.3 percent, by taking measures that raise the age of
the average issuing company by one year. Equally, it suggests that issuers can increase the
expected survival time of their stock by delaying their issues. The third strongest effect of the
four potential regulatory levers is that of Size. With a time ratio between 1.007 (e.g. in Models I
to III, Panel A) and 1.009 (in Models IV, Panel B), an increase in market capitalization by £1
million increases survival time by between 0.7 to 0.9 percent. While this effect seems at first
glance almost negligible, it must be borne in mind that the imposition of minimum size
constraints on AIM similar to those of NASDAQ would increase size not merely by £1 million,
but by substantially more. Relating the change in size to the standard deviation of Size (see Table
4) indicates that the proportionate impact of Size on survival time is in fact considerable; see the
sensitivity analysis below and in Table 11.
Public float appears to be the least powerful of the regulatory levers with a statistically
insignificant coefficient and low time ratios of between 0.999 (in most models in Panel A) and
1.003 (in most models in Panel B), suggesting that a one unit increase in the variable has a
statistically and economically negligible impact on survival time of between –0.1 to 0.3 percent.
The discussion of the sensitivity analysis in Table 11 below returns to this point.
Among the control variables, going public during the internet bubble period (indicated by the
dummy Bubble period) has an overwhelmingly negative impact on survival time with time ratios
of between 0.527 (in Model V, Panel A, with M&As classed as failures) and 0.448 in Model II of
Panel B (with M&As treated as censored survivors). These ratios correspond to decreases in
survival time of 47.3 percent and 55.2 percent, respectively, evaluated at the mean of the dummy
variable.
The marginal effect of changing the binary variable from zero to one shows that, ceteris paribus,
going public during the bubble period reduces survival time by between three to five years. The

26
weaker effects of around three years is found in Panel A (where M&As are failures), while the
stronger five-year result comes from Models II to V in Panel B (with the above median
performers’ M&As classed as censored) suggesting that the impact of the Bubble period is
particularly pronounced on the time to failure due to “negative” reasons (other than M&A).
IPO timing is primarily at the discretion of the issuers and their advisors. However, regulators
may find ways to limit the influx of IPOs during bubbles and hot issue periods, for instance, by
placing stock market applicants onto (artificial) waiting lists, or by adding regulatory “bottle
necks” such as requiring that every issuer retain one of a limited number of top Nomads. Our
results suggest that steering IPOs away from hot issue periods is likely to substantially improve
subsequent survival profiles of new listings.
The time ratios of the indicator of domestic incorporation DOM-IPO range from 1.127 in Model
II, Panel A, to 1.286 in Model IV, Panel B. Evaluating the impact of a binary change in the
variable from zero to one equivalent to a switch from foreign to domestic incorporation, we find
that a switch to domestic incorporation increases survival time by between 0.6 years in Model II,
Panel A, and 1.8 years in Models IV in Panel B. The stronger effect of the variable is found when
focusing on time to failure due to negative reasons (other than M&A or associated with rescue
M&As of poorly performing companies) in the models in Panel B. While the country of
incorporation may be unlikely to be a choice variable from the issuers’ perspective; it is at the
discretion of regulators to bar non-domestic issuers.12 At first glance our results suggest that
regulators may raise survival times of new listing by delaying failures due to negative reasons by
an economically significant 1.8 years. However, all DOM-IPO results are in fact statistically
insignificant. Also any regulatory barriers to foreign issuers would require careful reflection of
the (unwelcome) side effects of such a policy (see also below).
The time ratios of most industry dummies are below one (except for the non-cyclical consumer
goods and the resources sectors) suggesting that they have shorter survival times than the base
sector “Others”. However, none of these industry effects are statistically significant, suggesting
no need for regulators barring, or investors avoiding, issuers from specific industries.
12 However, the distinction between foreign and domestic companies is becoming increasingly blurred. Foreign-based companies may seek UK incorporation with a view to listing on AIM. We thank the referee for pointing this out.
27
Initial returns of the IPO have a statistically significant, positive impact on survival time with
time ratios of between 1.011 (Model II and III, Panel A) to 1.022 (Model IV, Panel B). Initial
returns may be interpreted as a proxy of intentional IPO underpricing, a variable arguably at the
discretion of issuers. Our results suggest that there is some scope for issuers to increase the
survival time of their IPO by discounting the offer price. However, the percentage increase in
survival time due to a one percentage point rise in initial returns is relatively modest at between
one to two percent.
Pre-IPO profitability (Pre ROA) has a highly (statistically) significant, positive impact on
survival time in all models in Table 10 with time ratios of between 1.006 (in Model III, Panel A)
to 1.013 (Model II, Panel B). Similarly, inside ownership at the time of the IPO has a highly
significant, positive coefficient in all models and time ratios of between 1.01 ( in Model III, Panel
B) to 1.014 (in Models I, IV, V of Panel A). The results suggest that these two variables may be
useful screening measures to help investors and practitioners (primarily Nomads) select
“appropriate” stocks, provided these players are concerned with survival times.
Sensitivity analysis
In this section we further examine the sensitivity of the expected (or predicted) survival times to
the changes in the continuous independent variables. Based on the AFT coefficient estimates of
Model I (in Table 10, Panel A), Table 11 shows the actual, absolute and percentage changes in
the median expected (or predicted) survival time due to changes in the continuous independent
variables expressed in terms of multiples of their standard deviations, σ. Changes are calculated
relative to the base of predicted survival time evaluated at the means of all independent variables;
at this base, the median predicted survival time equals 77 months. The analysis was conducted in
Stata using the command mfx following the AFT survival analysis. 13
The results of the sensitivity analysis suggest that there is considerable scope to increase survival
times by raising the age and size of the issuing company: a two-standard deviation increase in
Age would increase predicted survival time from its mean of 77 months to 111 months; and a
13 The sensitivity analysis in Table 11 is based on Table 5 in Hensler et al. (1997). We are grateful for advice from Thomas Springer (one of the co-authors of Hensler et al. 1997) and to Wesley Eddings, Senior Statistician at Stata, for helping us create this table.
28
corresponding increase in Size would raise survival time to 113 months. These changes are
equivalent to percentage increases in survival time of 44 percent and 47 percent, respectively. By
contrast, the scope for raising survival time by requiring higher public float is more limited with a
two-standard deviation increase in Public float raising expected survival time by only 16 percent
or 12 months (from 77 to 89 months).
Finally, we evaluate the impact of variations in the continuous Nomad reputation measures on
median survival time based on the estimates of Models III to V in Panel A of Table 10. We find
that a one-standard deviation increase in credit score (Reput3) extends survival time by 38
percent, and a two-standard deviation increase in Reput3 raises survival time by an economically
highly significant 56 percent. By comparison, the impact of the two other continuous reputation
measures is relatively more modest. A one- (two-) standard deviation increase in return on assets
(Reput4) raises survival time by only 5 (10) percent. The figures for the Nomad-age based
measure Reput5 are 8 and 12 percent, respectively.
In sum, our results suggest that regulators have ample scope to increase survival times of new
listings as indicated by the positive and significant estimated marginal effects on survival time of
a range of explanatory variables that can in principle be manipulated by regulators. Of course,
this interpretation of our results ignores any secondary (confounding or compounding) effects of
any changes in listing rules. It is important to note that the marginal effects are derived ceteris
paribus, and that our study uses past data that was generated under a given regulatory regime.
Any regulatory changes are likely to systematically affect the composition of the listing
population in the future, and generate other (possibly unwelcome) side effects. For instance, rules
requiring mandatory backing by reputable Nomads would increase issuers’ demand for top
Nomads’ services causing rationing (in the short term) and pushing up Nomads’ fees, raising the
direct listing costs and deterring potential issuers. Also as with the use of any rankings, Nomad
prestige can be measured in various ways resulting in unproductive controversy over which
measures to use, and intensifying the temptation for players to game the reputation measure.
Stricter listing rules and higher direct listing costs might deter the very issuers for whom AIM
was originally created, namely smaller, younger, more risky companies. By deterring smaller,
younger firms that are most at risk of failure (see Table 10), stricter rules may have positive side-
29
effects on survival (in addition to the direct effects measured in our analysis) because those
issuers that do list experience longer survival times. Of course, this beneficial self-selection effect
on listing survival must be weighed against the downside of lower real investment and loss of
economic value due to the reduced availability of finance and increased costs of capital
experienced by younger, smaller companies that are effectively barred from listing.
Robustness of the results
An obvious concern about our sample is the high percentage of observations in the latter period
2002-2004. Since we aim to study the population of IPOs in each year, this is unavoidably due to
variations in IPO activity and the particularly high numbers of IPOs in 2004 (see Table 5).
Therefore, we examine whether our AFT results in Table 10 are robust to omitting IPOs issued
after 2001. Appendix Table 1 shows the results of AFT estimations equivalent to the models
reported in Table 10, Panel B. We find our results are qualitatitively unchanged in the reduced,
pre-2002 subsample for all our variables of interest except for Age, which become less significant
or even insignificant in some models. The results for most of the control variables also remain
qualitatively unchanged except for pre-IPO profitability (pre ROA), which becomes insignificant.
We further explore the robustness of our AFT results in Models I to V of Table 10 to using
alternate performance criteria to differentiate between the M&A delistings of well and under-
performing companies. In the AFT analysis reported in Table 10, we identify M&A delistings of
well-performing companies and classify them as censored survivors by ranking companies on the
basis of four performance measures: cash to total assets, total liability to total asset, operating
income to total asset, and the current ratio (current assets over current liabilities) in the year prior
to the M&A delisting. Companies that rank above median based on all four measures are
considered censored survivors. We classify M&A delistings of below-median performing
companies as failures. In the Appendix, we check the robustness of our results by alternately
classifying M&A as survival if firm ratios are above the 25th or 75th percentiles in terms of
performance (and treating them as failure otherwise). The results, reported in Appendix Table 2,
suggest that our earlier findings are mostly robust except for a reduction in the statistical
significance in one of our Nomad reputation measures (Nomad Reput 1) when the performance
30
hurdle is the top quartile (25 percent) in Panel A of Appendix Table 2 (as opposed to the top 50
percent in Table 10, Panel B).
5. Conclusion
This paper is motivated by recent debates over the impact of stock-market regulation on stock
delistings. We examine the survival of new listings on a “reputational market”, the UK
Alternative Investment Market (AIM). AIM’s principle-based regulation delegates important
aspects of oversight to financial firms acting as nominated advisors (Nomads) to issuers and
expected to certify and control listing quality. While U.S. IPO activity stalled after 2000, AIM
has continued to attract both domestic and foreign issuers. However, AIM has been criticized for
its lax listing rules that arguably fail to screen out issues with little chance for longer-term
survival. We examine the impact of regulation on survival times focusing on four “regulatory
levers”: the reputation of the Nomad, and company age, size and public float immediately after
the IPO.
Based on data of all non-financial IPOs issued since the opening of AIM until the end of 2004,
we find historical survival rates that are in line with previously reported results for other (North
American) markets. We use the Kaplan-Meier approach to estimate survival times and rates, and
find that the median survival time is 76 months. Survival rates also vary statistically significantly
across issue years with much lower survival times of between 43 to 46 months for IPOs issued
during hot markets (in 1999 and 2004).
To investigate the effect of the regulatory levers (and other variables) on survival times, we
estimate an Accelerated Failure Time model that the impact of independent variables on survival
times to vary over the post-IPO period, e.g. by having a stronger impact on stocks nearer the IPO
than later on. The results show all four regulatory variables increase survival times, and the
impact of three of the four variables (all except public float) is statistically significant. Nomad
reputation has the strongest effect: Ceteris paribus backing by a top-5 Nomad delays the time to
failure (due to “unfavorable” reasons other than M&A, or due to rescue M&As of poorly
performing companies) by up to four years (depending on the model specification). Moreover,
holding all else equal, a two-standard deviation increase in either company age or size adds three

31
years to average predicted survival time. On the other hand, going public during the internet
bubble hastened delisting (particularly in the form of failure due to non-M&A reasons) by up to
five years.
Our findings demonstrate clear scope for central regulators to increase survival times by
tightening listing rules, in particular, by requiring that issuers retain reputable Nomads to certify
and control listing quality. They also suggest regulators (including Nomads) ought to find ways
to discourage companies from going public during stock-market bubbles.
Our results provide important lessons not just to market participants on AIM but also to the
designers, regulators and participants of market places modeled on AIM such as the upper tier of
the U.S. over-the-counter market, the OTCQX, Italy’s AIM Italia, and Japan’s AIM Tokyo.
32
References
Allison, P., 2000, Survival analysis using the SAS system: A practical guide. SAS Institute
Publishing: Texas
Audretsch, D.B., and Lehmann, E.E., 2005, The effects of experience, ownership, and knowledge
on IPO survival: Empirical evidence from Germany, Review of Accounting and Finance 4;
13-33.
Baum, C., 2006, An introduction to modern econometrics using Stata. A Stata Press Publication:
Texas, 78-82.
Bradburn, M, Clark, T, Love, S, Altman, D., 2003, Survival analysis part II: multivariate data
analysis–an introduction to concepts and methods, British Journal of Cancer 89; 431-436.
Bradley, D, Cooney, J, Dolvin, S, Jordan, B., 2006, Penny stock IPOs. Financial Management
39; 5-29.
Carpentier, C, Suret, J., 2011, The survival and success of penny stock IPOs: Canadian evidence.
Small Business Economics 36, 101-121.
Carter, R. and Manaster, S., 1990, Initial public offerings and underwriter reputation, Journal of
Finance 45, 1045-1067.
Cox, D., 1972, Regression models and life tables. Journal of Statistics Society 34; 187-220.
Cox, D, Oakes, D., 1984, Analysis of survival data. University Printing House: Cambridge
London.
Davidoff, S. M., 2007, Regulating listings in a global market, Wayne State University Law
School. Law and Economics Research Paper No. 73.
Demers, E, Joos, P., 2006, IPO failure risk. Journal of Accounting Research 45; 333-371.
33
Fama, F, French, K., 2004, New lists: Fundamentals and survival rates. Journal of Financial
Economics 73; 229-269.
Ford, C., 2010, Principles-based securities regulation in the wake of the global financial crisis,
McGill Law Review 55.
Giudici, G. and Roosenboom, P., 2004, The Rise and Fall of Europe’s New Stock Markets,
Amsterdam: Elsevier.
Goergen, M, Khurshed, A, Renneboog, L., 2009, Why are the French so different from the
Germans? Underpricing of IPOs on the Euro New Markets. International Review of Law and
Economics 29; 260-271.
Greene, W., 2003, Econometrical analysis. Pearson Prentice Hall: New Jersey.
Gregory, A., Guermat, C., Al-Shawawreh, F., 2010, UK IPOs: Long Run Returns, Behavioural
Timing and Pseudo Timing. Journal of Business Finance and Accounting 37, 5/6 (Jun/Jul
2010), 612-647.
Hamilton, L., 2006, Statistics with Stata. A Stata Press Publication: Texas.
Hensler, D, Rutherford, R, Springer, T., 1997, The survival of initial public offerings in the
aftermarket. Journal of Financial Research 20; 93-110.
Jain, B, Kini, O., 1999, The life cycle of initial public offerings. Journal of Business Finance and
Accounting 26; 1281-1307.
Jain, B, Kini, O., 2000, Does the presence of venture capitalists improve the survival profile of
IPO firms? Journal of Business Finance & Accounting 27; 1139-1176.
Jain, B, Martin, C., 2005, The association between audit quality and post-IPO performance: A
survival analysis approach. Review of Accounting and Finance 4; 50-75.
34
Jain, B, Kini, O., 2008, The Impact of strategic investment choices on post-issue operating
performance and survival of US IPO firms. Journal of Business Finance & Accounting 35;
459–490.
Kleinbaum, D., 1996, Survival analysis: A self-learning text Springer Verlag: New York.
Kooli, M, Meknassi, S., 2007, The Survival Profile of U.S. IPO Issuers: 1985-2005. Journal of
Wealth Management 10; 105-119.
London Stock Exchange, 2010, AIM Rules for Companies, Available at
http://www.londonstockexchange.com/companies-and-advisors/aim/documents/publications.htm
London Stock Exchange, 2010, AIM Rules for Nominated Advisors, Available at
http://www.londonstockexchange.com/companies-and-advisors/aim/documents/publications.htm
Mendoza, J., 2008, Securities regulation in low tier listing venues: The rise of the alternative
investment market. Fordham Journal of Corporate & Financial Law 13; 257-328.
Ritter, J., 1991, The long-run performance of initial public offerings. Journal of Finance 42; 365-
94.
Schultz, P., 1993, Unit initial public offerings. Journal of Financial Economics 34; 199-229.
Seguin, P, Smoller M., 1997, Share price and mortality: An empirical evaluation of newly listed
NASDAQ stocks. Journal of Financial Economics 45; 333-363.
Shumway, T., 2001, Forecasting bankruptcy more accurately: A simple hazard model. Journal of
Business 74; 101-124.
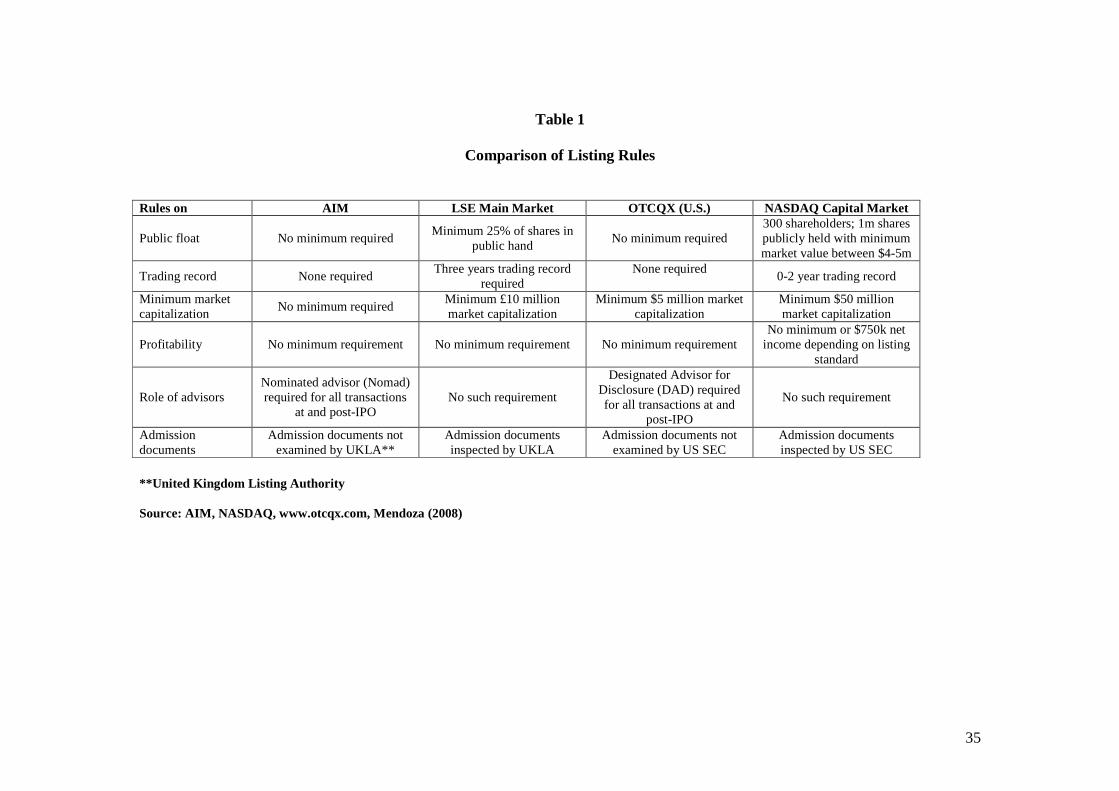
35
Table 1
Comparison of Listing Rules
Rules on AIM LSE Main Market OTCQX (U.S.) NASDAQ Capital Market
Public float No minimum required Minimum 25% of shares in
public hand
No minimum required
300 shareholders; 1m shares publicly held with minimum market value between $4-5m
Trading record None required Three years trading record
required None required
0-2 year trading record
Minimum market capitalization
No minimum required Minimum £10 million market capitalization
Minimum $5 million market capitalization
Minimum $50 million market capitalization
Profitability No minimum requirement No minimum requirement
No minimum requirement No minimum or $750k net
income depending on listing standard
Role of advisors Nominated advisor (Nomad) required for all transactions
at and post-IPO No such requirement
Designated Advisor for Disclosure (DAD) required for all transactions at and
post-IPO
No such requirement
Admission documents
Admission documents not examined by UKLA**
Admission documents inspected by UKLA
Admission documents not examined by US SEC
Admission documents inspected by US SEC
**United Kingdom Listing Authority Source: AIM, NASDAQ, www.otcqx.com, Mendoza (2008)
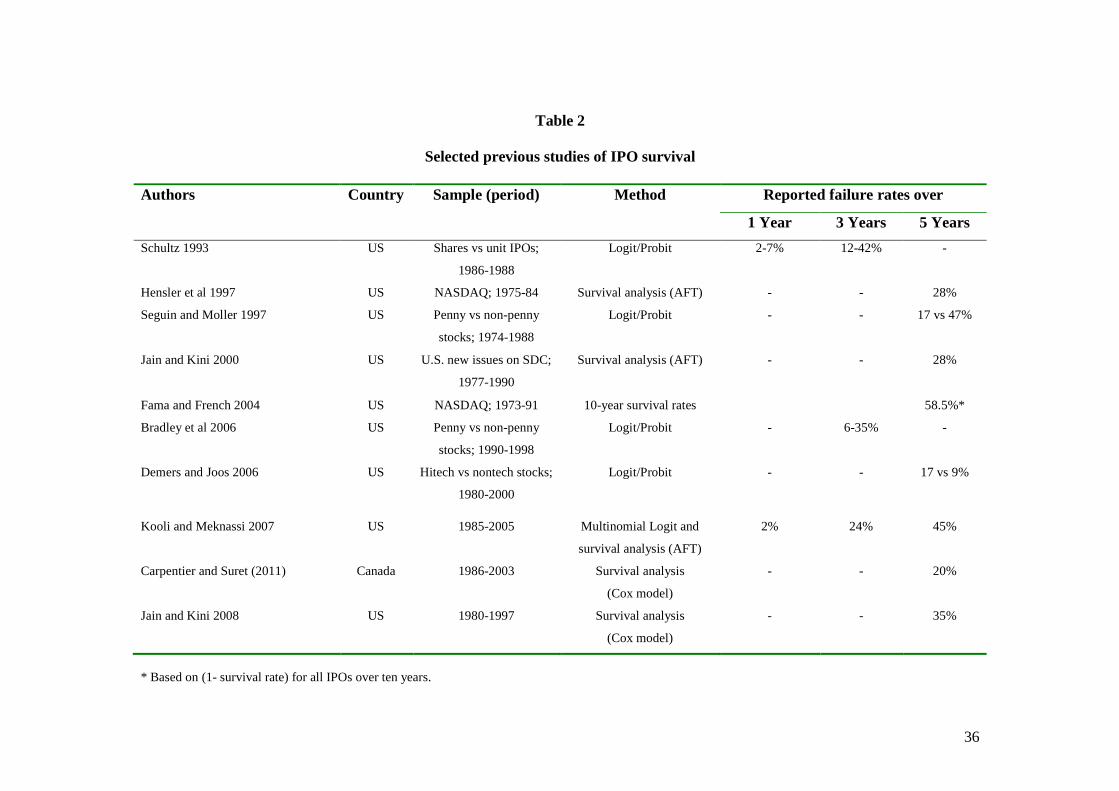
36
Table 2
Selected previous studies of IPO survival
Authors Country Sample (period) Method Reported failure rates over
1 Year 3 Years 5 Years
Schultz 1993 US Shares vs unit IPOs;
1986-1988
Logit/Probit 2-7% 12-42% -
Hensler et al 1997 US NASDAQ; 1975-84 Survival analysis (AFT) - - 28%
Seguin and Moller 1997 US Penny vs non-penny
stocks; 1974-1988
Logit/Probit - - 17 vs 47%
Jain and Kini 2000 US U.S. new issues on SDC;
1977-1990
Survival analysis (AFT) - - 28%
Fama and French 2004 US NASDAQ; 1973-91 10-year survival rates 58.5%*
Bradley et al 2006 US Penny vs non-penny
stocks; 1990-1998
Logit/Probit - 6-35% -
Demers and Joos 2006 US Hitech vs nontech stocks;
1980-2000
Logit/Probit - - 17 vs 9%
Kooli and Meknassi 2007 US 1985-2005 Multinomial Logit and
survival analysis (AFT)
2% 24% 45%
Carpentier and Suret (2011) Canada 1986-2003 Survival analysis
(Cox model)
- - 20%
Jain and Kini 2008 US 1980-1997 Survival analysis
(Cox model)
- - 35%
* Based on (1- survival rate) for all IPOs over ten years.
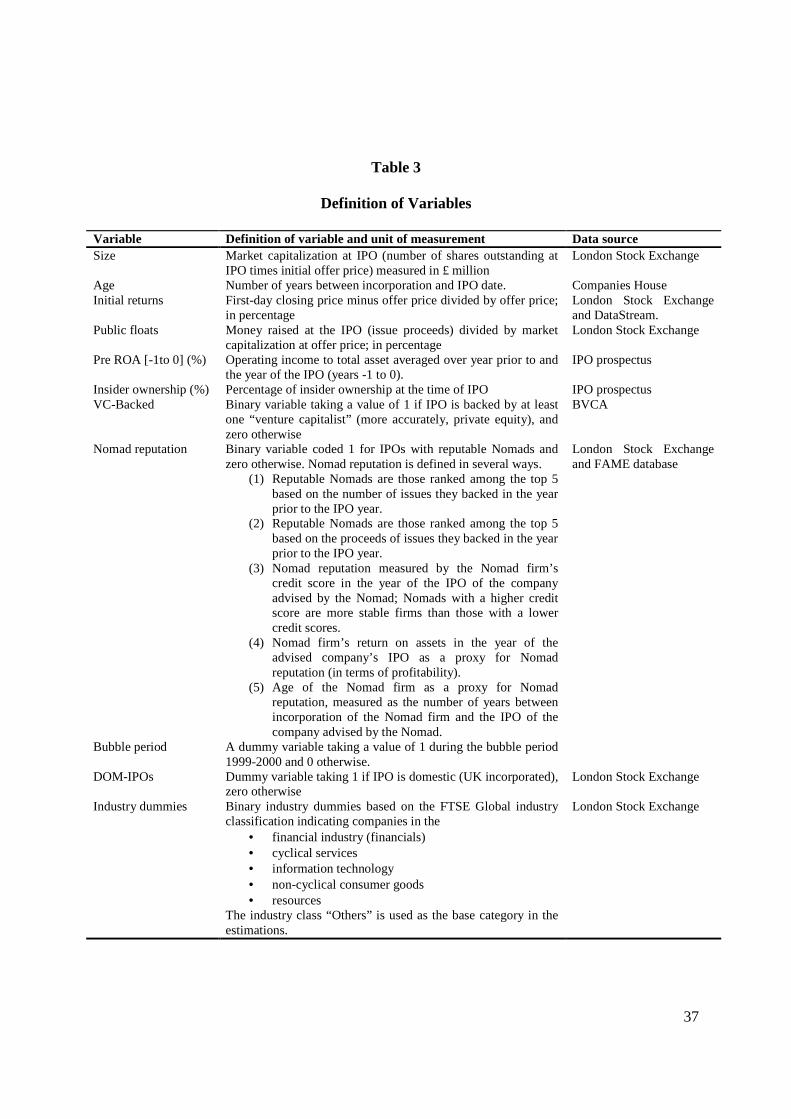
37
Table 3
Definition of Variables
Variable Definition of variable and unit of measurement Data source Size Market capitalization at IPO (number of shares outstanding at
IPO times initial offer price) measured in £ million London Stock Exchange
Age Number of years between incorporation and IPO date. Companies House Initial returns First-day closing price minus offer price divided by offer price;
in percentage London Stock Exchange and DataStream.
Public floats Money raised at the IPO (issue proceeds) divided by market capitalization at offer price; in percentage
London Stock Exchange
Pre ROA [-1to 0] (%) Operating income to total asset averaged over year prior to and the year of the IPO (years -1 to 0).
IPO prospectus
Insider ownership (%) Percentage of insider ownership at the time of IPO IPO prospectus VC-Backed Binary variable taking a value of 1 if IPO is backed by at least
one “venture capitalist” (more accurately, private equity), and zero otherwise
BVCA
Nomad reputation Binary variable coded 1 for IPOs with reputable Nomads and zero otherwise. Nomad reputation is defined in several ways.
(1) Reputable Nomads are those ranked among the top 5 based on the number of issues they backed in the year prior to the IPO year.
(2) Reputable Nomads are those ranked among the top 5 based on the proceeds of issues they backed in the year prior to the IPO year.
(3) Nomad reputation measured by the Nomad firm’s credit score in the year of the IPO of the company advised by the Nomad; Nomads with a higher credit score are more stable firms than those with a lower credit scores.
(4) Nomad firm’s return on assets in the year of the advised company’s IPO as a proxy for Nomad reputation (in terms of profitability).
(5) Age of the Nomad firm as a proxy for Nomad reputation, measured as the number of years between incorporation of the Nomad firm and the IPO of the company advised by the Nomad.
London Stock Exchange and FAME database
Bubble period A dummy variable taking a value of 1 during the bubble period 1999-2000 and 0 otherwise.
DOM-IPOs Dummy variable taking 1 if IPO is domestic (UK incorporated), zero otherwise
London Stock Exchange
Industry dummies Binary industry dummies based on the FTSE Global industry classification indicating companies in the
• financial industry (financials) • cyclical services • information technology • non-cyclical consumer goods • resources
The industry class “Others” is used as the base category in the estimations.
London Stock Exchange
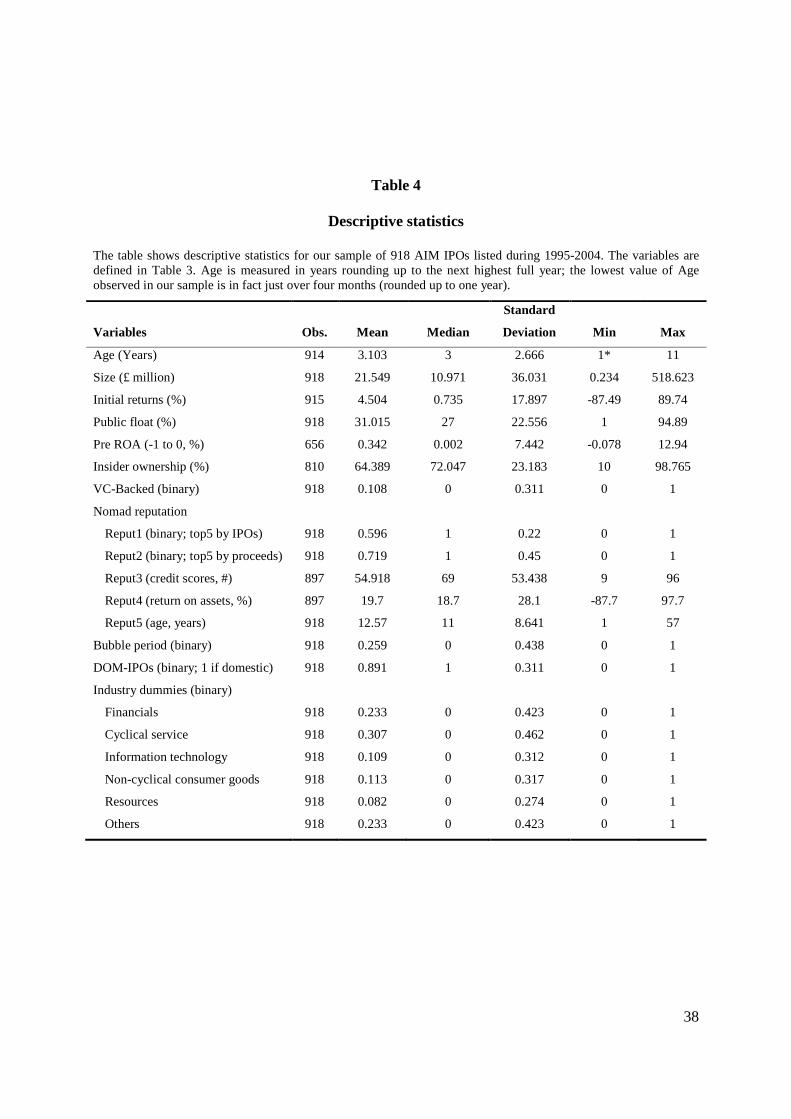
38
Table 4
Descriptive statistics
The table shows descriptive statistics for our sample of 918 AIM IPOs listed during 1995-2004. The variables are defined in Table 3. Age is measured in years rounding up to the next highest full year; the lowest value of Age observed in our sample is in fact just over four months (rounded up to one year).
Variables Obs. Mean Median
Standard
Deviation Min Max
Age (Years) 914 3.103 3 2.666 1* 11
Size (£ million) 918 21.549 10.971 36.031 0.234 518.623
Initial returns (%) 915 4.504 0.735 17.897 -87.49 89.74
Public float (%) 918 31.015 27 22.556 1 94.89
Pre ROA (-1 to 0, %) 656 0.342 0.002 7.442 -0.078 12.94
Insider ownership (%) 810 64.389 72.047 23.183 10 98.765
VC-Backed (binary) 918 0.108 0 0.311 0 1
Nomad reputation
Reput1 (binary; top5 by IPOs) 918 0.596 1 0.22 0 1
Reput2 (binary; top5 by proceeds) 918 0.719 1 0.45 0 1
Reput3 (credit scores, #) 897 54.918 69 53.438 9 96
Reput4 (return on assets, %) 897 19.7 18.7 28.1 -87.7 97.7
Reput5 (age, years) 918 12.57 11 8.641 1 57
Bubble period (binary) 918 0.259 0 0.438 0 1
DOM-IPOs (binary; 1 if domestic) 918 0.891 1 0.311 0 1
Industry dummies (binary)
Financials 918 0.233 0 0.423 0 1
Cyclical service 918 0.307 0 0.462 0 1
Information technology 918 0.109 0 0.312 0 1
Non-cyclical consumer goods 918 0.113 0 0.317 0 1
Resources 918 0.082 0 0.274 0 1
Others 918 0.233 0 0.423 0 1
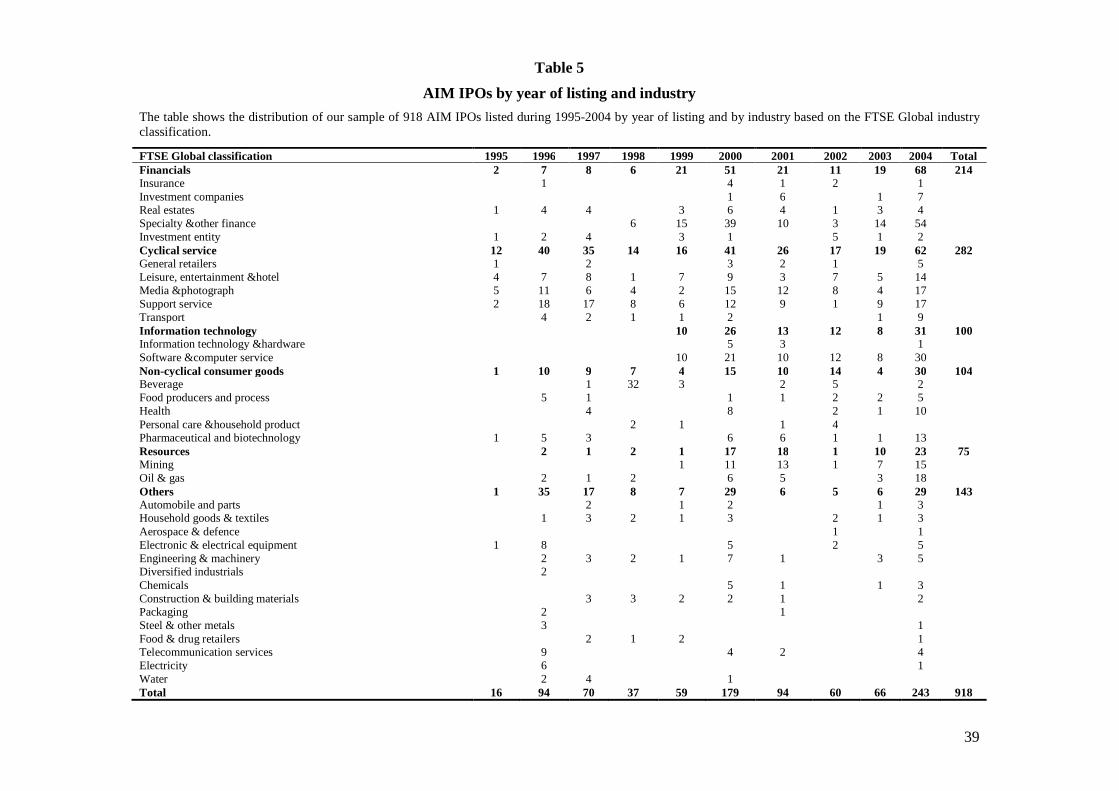
39
Table 5
AIM IPOs by year of listing and industry
The table shows the distribution of our sample of 918 AIM IPOs listed during 1995-2004 by year of listing and by industry based on the FTSE Global industry classification.
FTSE Global classification 1995 1996 1997 1998 1999 2000 2001 2002 2003 2004 Total Financials 2 7 8 6 21 51 21 11 19 68 214 Insurance 1 4 1 2 1 Investment companies 1 6 1 7 Real estates 1 4 4 3 6 4 1 3 4 Specialty &other finance 6 15 39 10 3 14 54 Investment entity 1 2 4 3 1 5 1 2 Cyclical service 12 40 35 14 16 41 26 17 19 62 282 General retailers 1 2 3 2 1 5 Leisure, entertainment &hotel 4 7 8 1 7 9 3 7 5 14 Media &photograph 5 11 6 4 2 15 12 8 4 17 Support service 2 18 17 8 6 12 9 1 9 17 Transport 4 2 1 1 2 1 9 Information technology 10 26 13 12 8 31 100 Information technology &hardware 5 3 1 Software &computer service 10 21 10 12 8 30 Non-cyclical consumer goods 1 10 9 7 4 15 10 14 4 30 104 Beverage 1 32 3 2 5 2 Food producers and process 5 1 1 1 2 2 5 Health 4 8 2 1 10 Personal care &household product 2 1 1 4 Pharmaceutical and biotechnology 1 5 3 6 6 1 1 13 Resources 2 1 2 1 17 18 1 10 23 75 Mining 1 11 13 1 7 15 Oil & gas 2 1 2 6 5 3 18 Others 1 35 17 8 7 29 6 5 6 29 143 Automobile and parts 2 1 2 1 3 Household goods & textiles 1 3 2 1 3 2 1 3 Aerospace & defence 1 1 Electronic & electrical equipment 1 8 5 2 5 Engineering & machinery 2 3 2 1 7 1 3 5 Diversified industrials 2 Chemicals 5 1 1 3 Construction & building materials 3 3 2 2 1 2 Packaging 2 1 Steel & other metals 3 1 Food & drug retailers 2 1 2 1 Telecommunication services 9 4 2 4 Electricity 6 1 Water 2 4 1 Total 16 94 70 37 59 179 94 60 66 243 918
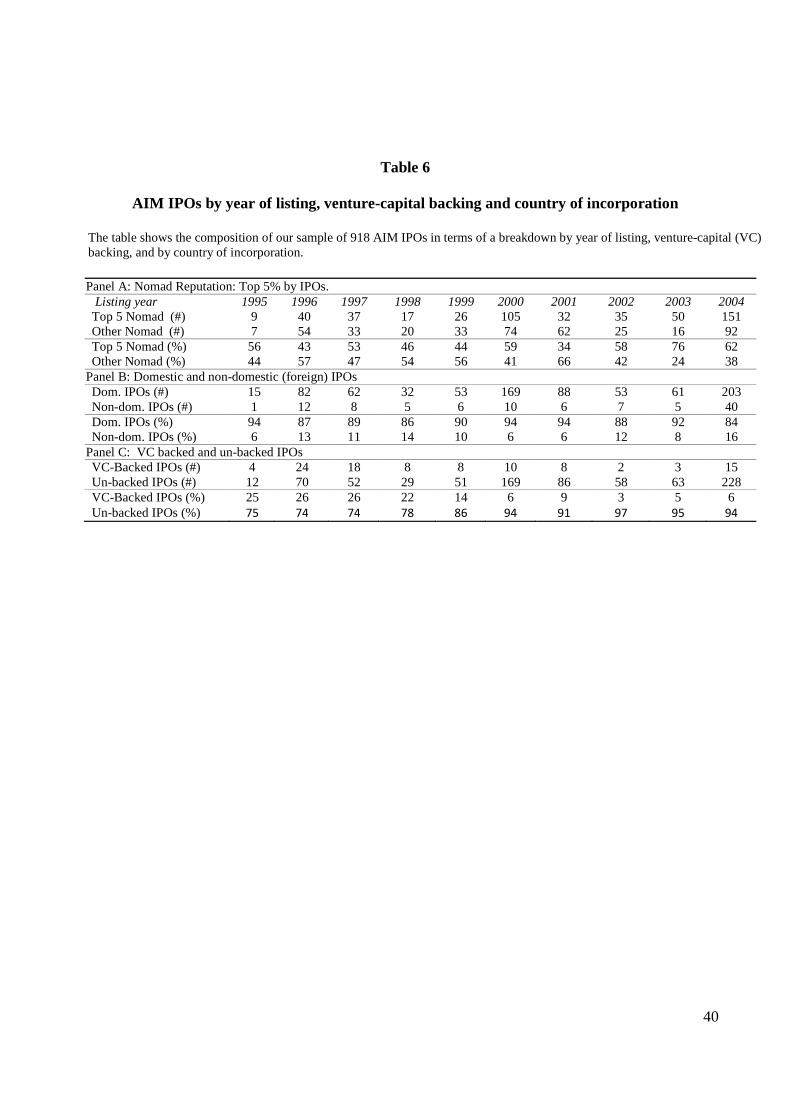
40
Table 6
AIM IPOs by year of listing, venture-capital backing and country of incorporation
The table shows the composition of our sample of 918 AIM IPOs in terms of a breakdown by year of listing, venture-capital (VC) backing, and by country of incorporation.
Panel A: Nomad Reputation: Top 5% by IPOs. Listing year 1995 1996 1997 1998 1999 2000 2001 2002 2003 2004 Top 5 Nomad (#) 9 40 37 17 26 105 32 35 50 151 Other Nomad (#) 7 54 33 20 33 74 62 25 16 92 Top 5 Nomad (%) 56 43 53 46 44 59 34 58 76 62 Other Nomad (%) 44 57 47 54 56 41 66 42 24 38
Panel B: Domestic and non-domestic (foreign) IPOs Dom. IPOs (#) 15 82 62 32 53 169 88 53 61 203 Non-dom. IPOs (#) 1 12 8 5 6 10 6 7 5 40 Dom. IPOs (%) 94 87 89 86 90 94 94 88 92 84 Non-dom. IPOs (%) 6 13 11 14 10 6 6 12 8 16
Panel C: VC backed and un-backed IPOs VC-Backed IPOs (#) 4 24 18 8 8 10 8 2 3 15 Un-backed IPOs (#) 12 70 52 29 51 169 86 58 63 228 VC-Backed IPOs (%) 25 26 26 22 14 6 9 3 5 6 Un-backed IPOs (%) 75 74 74 78 86 94 91 97 95 94
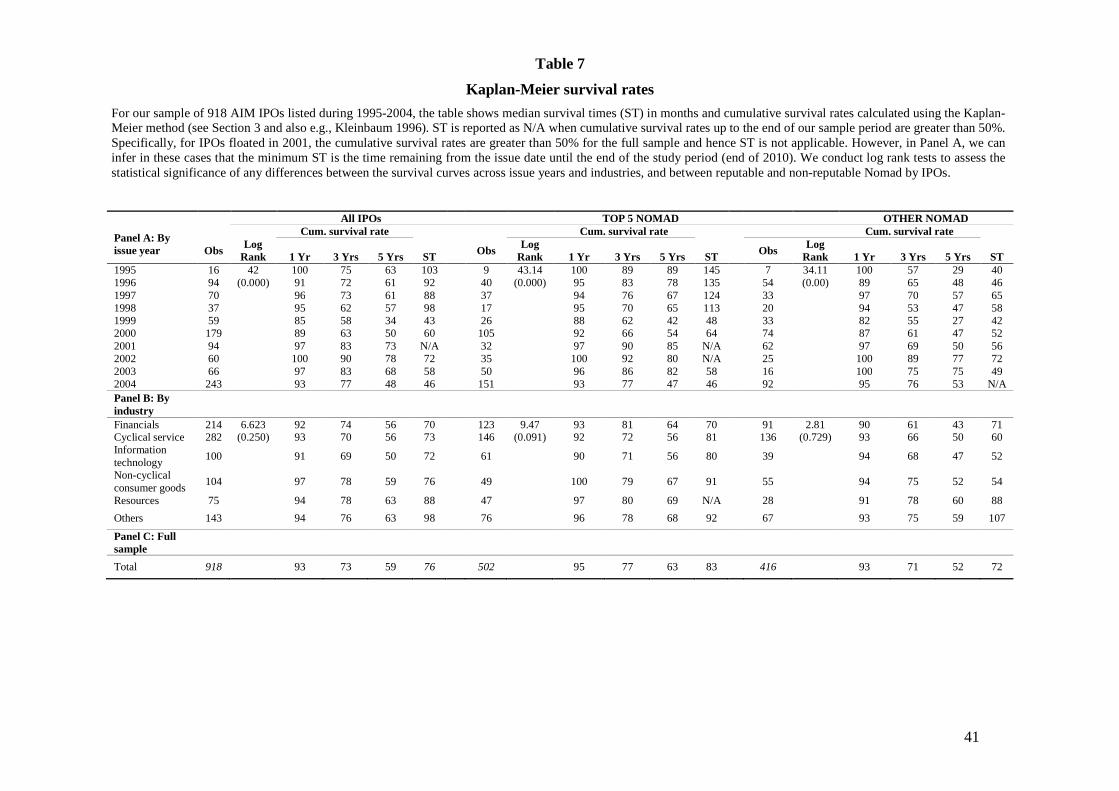
41
Table 7
Kaplan-Meier survival rates
For our sample of 918 AIM IPOs listed during 1995-2004, the table shows median survival times (ST) in months and cumulative survival rates calculated using the Kaplan-Meier method (see Section 3 and also e.g., Kleinbaum 1996). ST is reported as N/A when cumulative survival rates up to the end of our sample period are greater than 50%. Specifically, for IPOs floated in 2001, the cumulative survival rates are greater than 50% for the full sample and hence ST is not applicable. However, in Panel A, we can infer in these cases that the minimum ST is the time remaining from the issue date until the end of the study period (end of 2010). We conduct log rank tests to assess the statistical significance of any differences between the survival curves across issue years and industries, and between reputable and non-reputable Nomad by IPOs.
All IPOs TOP 5 NOMAD OTHER NOMAD
Panel A: By issue year
Cum. survival rate Cum. survival rate Cum. survival rate
Obs Log
Rank 1 Yr 3 Yrs 5 Yrs ST
Obs Log
Rank 1 Yr 3 Yrs 5 Yrs ST
Obs Log
Rank 1 Yr 3 Yrs 5 Yrs ST 1995 16 42 100 75 63 103 9 43.14 100 89 89 145 7 34.11 100 57 29 40 1996 94 (0.000) 91 72 61 92 40 (0.000) 95 83 78 135 54 (0.00) 89 65 48 46 1997 70 96 73 61 88 37 94 76 67 124 33 97 70 57 65 1998 37 95 62 57 98 17 95 70 65 113 20 94 53 47 58 1999 59 85 58 34 43 26 88 62 42 48 33 82 55 27 42 2000 179 89 63 50 60 105 92 66 54 64 74 87 61 47 52 2001 94 97 83 73 N/A 32 97 90 85 N/A 62 97 69 50 56 2002 60 100 90 78 72 35 100 92 80 N/A 25 100 89 77 72 2003 66 97 83 68 58 50 96 86 82 58 16 100 75 75 49 2004 243 93 77 48 46 151 93 77 47 46 92 95 76 53 N/A Panel B: By industry
Financials 214 6.623 92 74 56 70 123 9.47 93 81 64 70 91 2.81 90 61 43 71 Cyclical service 282 (0.250) 93 70 56 73 146 (0.091) 92 72 56 81 136 (0.729) 93 66 50 60 Information technology
100 91 69 50 72
61 90 71 56 80 39 94 68 47 52
Non-cyclical consumer goods
104 97 78 59 76
49 100 79 67 91 55 94 75 52 54
Resources 75 94 78 63 88 47 97 80 69 N/A 28 91 78 60 88
Others 143 94 76 63 98 76 96 78 68 92 67 93 75 59 107
Panel C: Full sample
Total 918 93 73 59 76 502 95 77 63 83 416 93 71 52 72
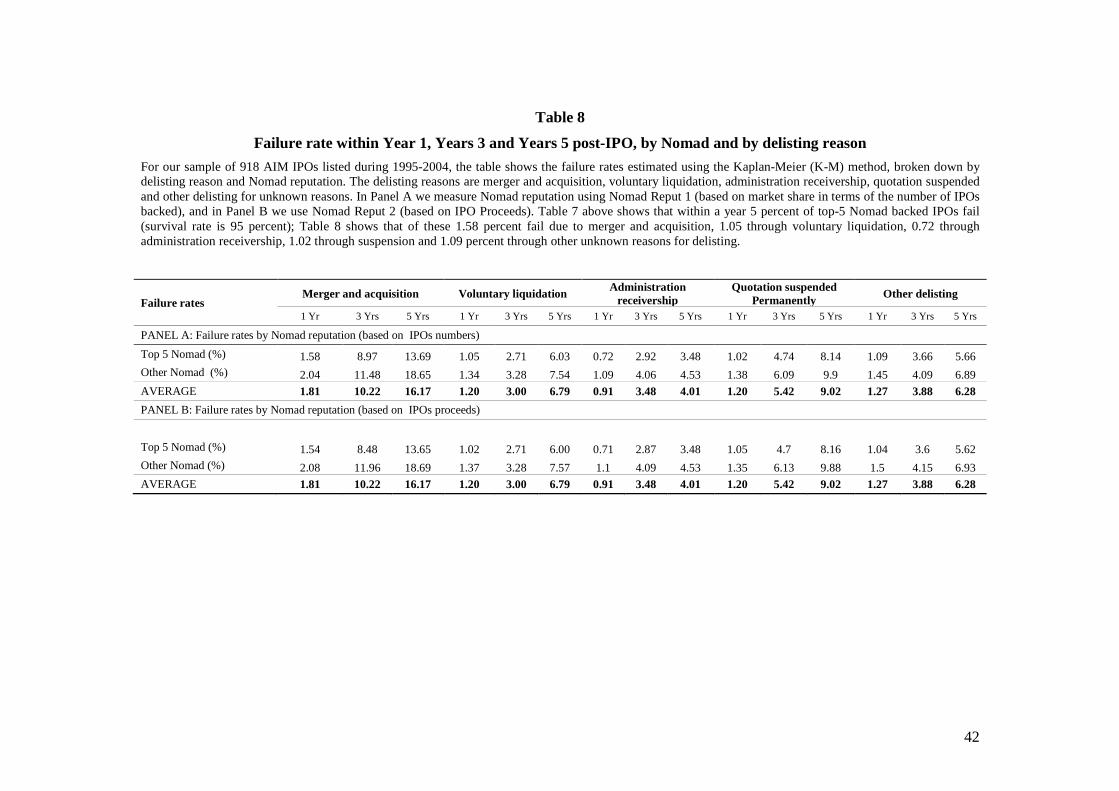
42
Table 8
Failure rate within Year 1, Years 3 and Years 5 post-IPO, by Nomad and by delisting reason
For our sample of 918 AIM IPOs listed during 1995-2004, the table shows the failure rates estimated using the Kaplan-Meier (K-M) method, broken down by delisting reason and Nomad reputation. The delisting reasons are merger and acquisition, voluntary liquidation, administration receivership, quotation suspended and other delisting for unknown reasons. In Panel A we measure Nomad reputation using Nomad Reput 1 (based on market share in terms of the number of IPOs backed), and in Panel B we use Nomad Reput 2 (based on IPO Proceeds). Table 7 above shows that within a year 5 percent of top-5 Nomad backed IPOs fail (survival rate is 95 percent); Table 8 shows that of these 1.58 percent fail due to merger and acquisition, 1.05 through voluntary liquidation, 0.72 through administration receivership, 1.02 through suspension and 1.09 percent through other unknown reasons for delisting.
Failure rates Merger and acquisition Voluntary liquidation
Administration receivership
Quotation suspended Permanently
Other delisting
1 Yr 3 Yrs 5 Yrs 1 Yr 3 Yrs 5 Yrs 1 Yr 3 Yrs 5 Yrs 1 Yr 3 Yrs 5 Yrs 1 Yr 3 Yrs 5 Yrs
PANEL A: Failure rates by Nomad reputation (based on IPOs numbers)
Top 5 Nomad (%) 1.58 8.97 13.69 1.05 2.71 6.03 0.72 2.92 3.48 1.02 4.74 8.14 1.09 3.66 5.66 Other Nomad (%) 2.04 11.48 18.65 1.34 3.28 7.54 1.09 4.06 4.53 1.38 6.09 9.9 1.45 4.09 6.89
AVERAGE 1.81 10.22 16.17 1.20 3.00 6.79 0.91 3.48 4.01 1.20 5.42 9.02 1.27 3.88 6.28
PANEL B: Failure rates by Nomad reputation (based on IPOs proceeds)
Top 5 Nomad (%) 1.54 8.48 13.65 1.02 2.71 6.00 0.71 2.87 3.48 1.05 4.7 8.16 1.04 3.6 5.62 Other Nomad (%) 2.08 11.96 18.69 1.37 3.28 7.57 1.1 4.09 4.53 1.35 6.13 9.88 1.5 4.15 6.93
AVERAGE 1.81 10.22 16.17 1.20 3.00 6.79 0.91 3.48 4.01 1.20 5.42 9.02 1.27 3.88 6.28
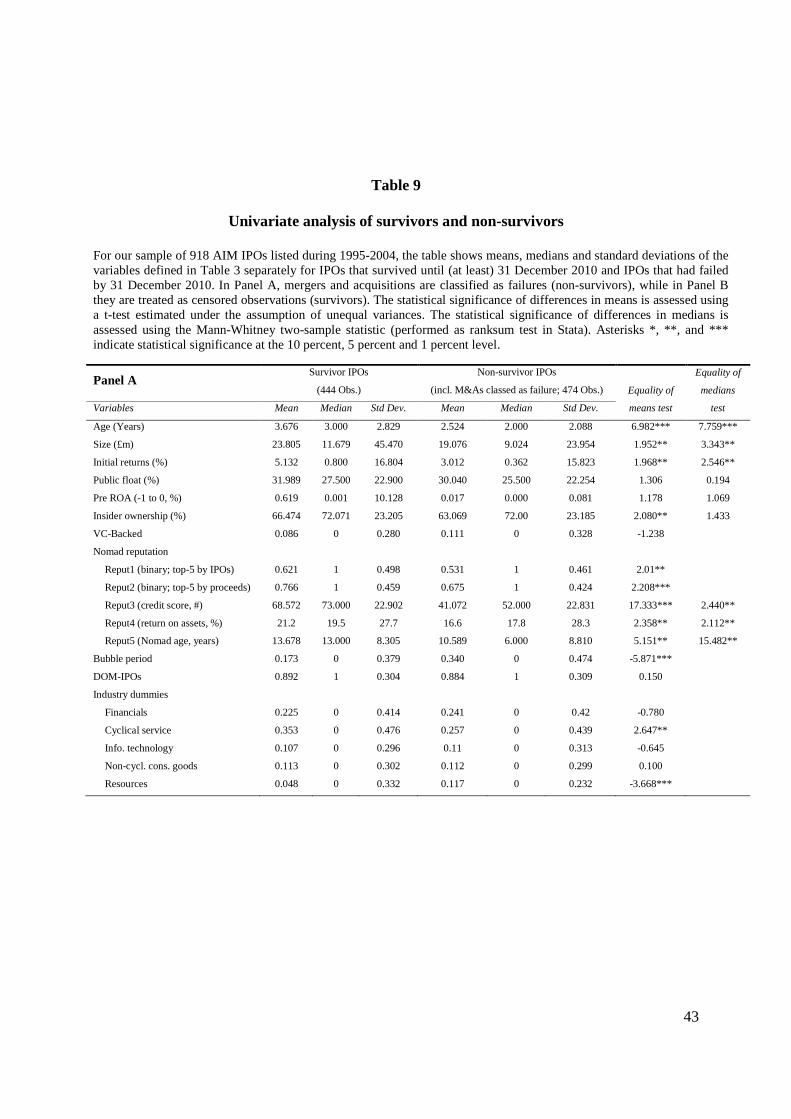
43
Table 9
Univariate analysis of survivors and non-survivors
For our sample of 918 AIM IPOs listed during 1995-2004, the table shows means, medians and standard deviations of the variables defined in Table 3 separately for IPOs that survived until (at least) 31 December 2010 and IPOs that had failed by 31 December 2010. In Panel A, mergers and acquisitions are classified as failures (non-survivors), while in Panel B they are treated as censored observations (survivors). The statistical significance of differences in means is assessed using a t-test estimated under the assumption of unequal variances. The statistical significance of differences in medians is assessed using the Mann-Whitney two-sample statistic (performed as ranksum test in Stata). Asterisks *, **, and *** indicate statistical significance at the 10 percent, 5 percent and 1 percent level.
Panel A Survivor IPOs
(444 Obs.)
Non-survivor IPOs
(incl. M&As classed as failure; 474 Obs.) Equality of
means test
Equality of
medians
test Variables Mean Median Std Dev. Mean Median Std Dev.
Age (Years) 3.676 3.000 2.829 2.524 2.000 2.088 6.982*** 7.759***
Size (£m) 23.805 11.679 45.470 19.076 9.024 23.954 1.952** 3.343**
Initial returns (%) 5.132 0.800 16.804 3.012 0.362 15.823 1.968** 2.546**
Public float (%) 31.989 27.500 22.900 30.040 25.500 22.254 1.306 0.194
Pre ROA (-1 to 0, %) 0.619 0.001 10.128 0.017 0.000 0.081 1.178 1.069
Insider ownership (%) 66.474 72.071 23.205 63.069 72.00 23.185 2.080** 1.433
VC-Backed 0.086 0 0.280 0.111 0 0.328 -1.238
Nomad reputation
Reput1 (binary; top-5 by IPOs) 0.621 1 0.498 0.531 1 0.461 2.01**
Reput2 (binary; top-5 by proceeds) 0.766 1 0.459 0.675 1 0.424 2.208***
Reput3 (credit score, #) 68.572 73.000 22.902 41.072 52.000 22.831 17.333*** 2.440**
Reput4 (return on assets, %) 21.2 19.5 27.7 16.6 17.8 28.3 2.358** 2.112**
Reput5 (Nomad age, years) 13.678 13.000 8.305 10.589 6.000 8.810 5.151** 15.482**
Bubble period 0.173 0 0.379 0.340 0 0.474 -5.871***
DOM-IPOs 0.892 1 0.304 0.884 1 0.309 0.150
Industry dummies
Financials 0.225 0 0.414 0.241 0 0.42 -0.780
Cyclical service 0.353 0 0.476 0.257 0 0.439 2.647**
Info. technology 0.107 0 0.296 0.11 0 0.313 -0.645
Non-cycl. cons. goods 0.113 0 0.302 0.112 0 0.299 0.100
Resources 0.048 0 0.332 0.117 0 0.232 -3.668***
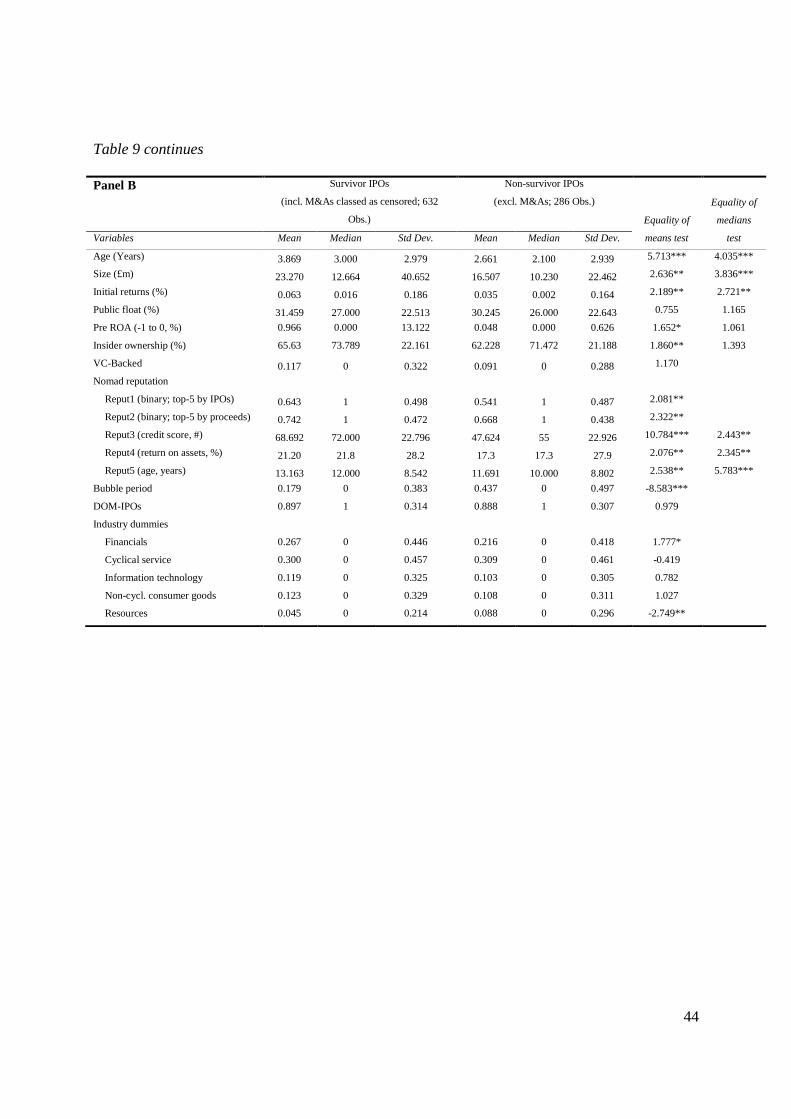
44
Table 9 continues Panel B Survivor IPOs
(incl. M&As classed as censored; 632
Obs.)
Non-survivor IPOs
(excl. M&As; 286 Obs.)
Equality of
means test
Equality of
medians
test Variables Mean Median Std Dev. Mean Median Std Dev.
Age (Years) 3.869 3.000 2.979 2.661 2.100 2.939 5.713*** 4.035***
Size (£m) 23.270 12.664 40.652 16.507 10.230 22.462 2.636** 3.836***
Initial returns (%) 0.063 0.016 0.186 0.035 0.002 0.164 2.189** 2.721**
Public float (%) 31.459 27.000 22.513 30.245 26.000 22.643 0.755 1.165
Pre ROA (-1 to 0, %) 0.966 0.000 13.122 0.048 0.000 0.626 1.652* 1.061
Insider ownership (%) 65.63 73.789 22.161 62.228 71.472 21.188 1.860** 1.393
VC-Backed 0.117 0 0.322 0.091 0 0.288 1.170
Nomad reputation
Reput1 (binary; top-5 by IPOs) 0.643 1 0.498 0.541 1 0.487 2.081**
Reput2 (binary; top-5 by proceeds) 0.742 1 0.472 0.668 1 0.438 2.322**
Reput3 (credit score, #) 68.692 72.000 22.796 47.624 55 22.926 10.784*** 2.443**
Reput4 (return on assets, %) 21.20 21.8 28.2 17.3 17.3 27.9 2.076** 2.345**
Reput5 (age, years) 13.163 12.000 8.542 11.691 10.000 8.802 2.538** 5.783***
Bubble period 0.179 0 0.383 0.437 0 0.497 -8.583***
DOM-IPOs 0.897 1 0.314 0.888 1 0.307 0.979
Industry dummies
Financials 0.267 0 0.446 0.216 0 0.418 1.777*
Cyclical service 0.300 0 0.457 0.309 0 0.461 -0.419
Information technology 0.119 0 0.325 0.103 0 0.305 0.782
Non-cycl. consumer goods 0.123 0 0.329 0.108 0 0.311 1.027
Resources 0.045 0 0.214 0.088 0 0.296 -2.749**
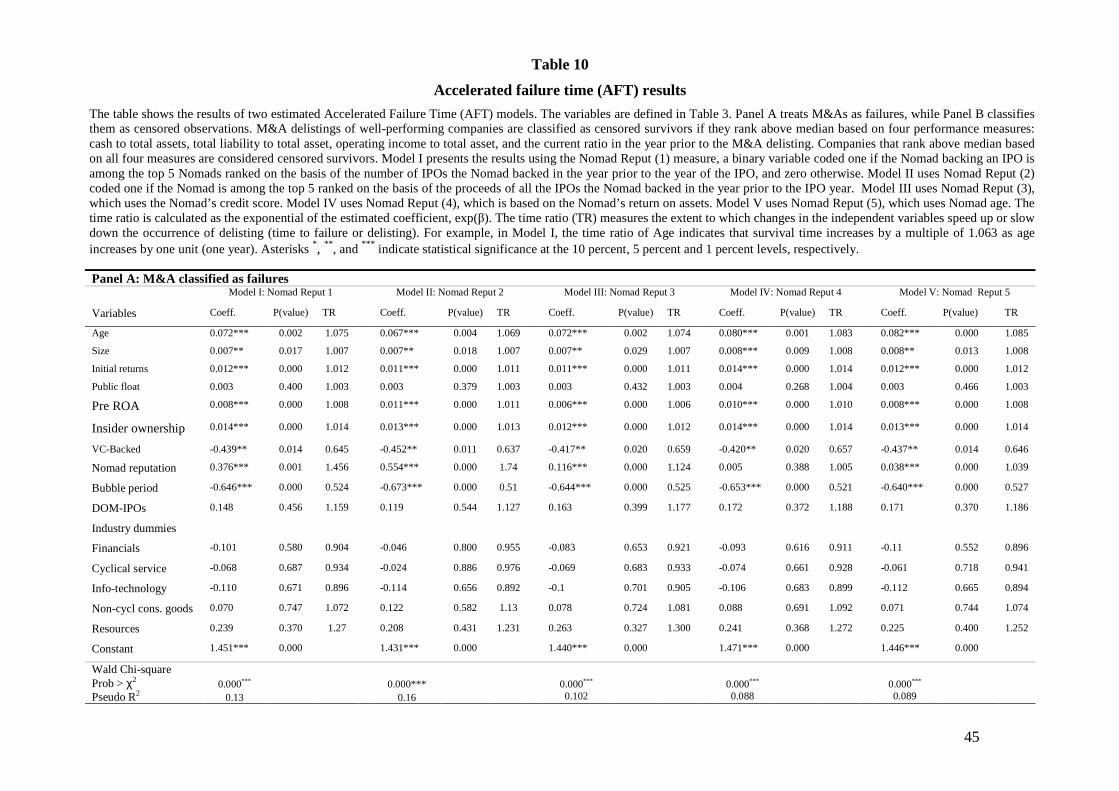
45
Table 10
Accelerated failure time (AFT) results
The table shows the results of two estimated Accelerated Failure Time (AFT) models. The variables are defined in Table 3. Panel A treats M&As as failures, while Panel B classifies them as censored observations. M&A delistings of well-performing companies are classified as censored survivors if they rank above median based on four performance measures: cash to total assets, total liability to total asset, operating income to total asset, and the current ratio in the year prior to the M&A delisting. Companies that rank above median based on all four measures are considered censored survivors. Model I presents the results using the Nomad Reput (1) measure, a binary variable coded one if the Nomad backing an IPO is among the top 5 Nomads ranked on the basis of the number of IPOs the Nomad backed in the year prior to the year of the IPO, and zero otherwise. Model II uses Nomad Reput (2) coded one if the Nomad is among the top 5 ranked on the basis of the proceeds of all the IPOs the Nomad backed in the year prior to the IPO year. Model III uses Nomad Reput (3), which uses the Nomad’s credit score. Model IV uses Nomad Reput (4), which is based on the Nomad’s return on assets. Model V uses Nomad Reput (5), which uses Nomad age. The time ratio is calculated as the exponential of the estimated coefficient, exp(β). The time ratio (TR) measures the extent to which changes in the independent variables speed up or slow down the occurrence of delisting (time to failure or delisting). For example, in Model I, the time ratio of Age indicates that survival time increases by a multiple of 1.063 as age increases by one unit (one year). Asterisks *, ** , and *** indicate statistical significance at the 10 percent, 5 percent and 1 percent levels, respectively.
Panel A: M&A classified as failures Model I: Nomad Reput 1 Model II: Nomad Reput 2 Model III: Nomad Reput 3 Model IV: Nomad Reput 4 Model V: Nomad Reput 5
Variables Coeff. P(value) TR Coeff. P(value) TR Coeff. P(value) TR Coeff. P(value) TR Coeff. P(value) TR
Age 0.072*** 0.002 1.075 0.067*** 0.004 1.069 0.072*** 0.002 1.074 0.080*** 0.001 1.083 0.082*** 0.000 1.085
Size 0.007** 0.017 1.007 0.007** 0.018 1.007 0.007** 0.029 1.007 0.008*** 0.009 1.008 0.008** 0.013 1.008
Initial returns 0.012*** 0.000 1.012 0.011*** 0.000 1.011 0.011*** 0.000 1.011 0.014*** 0.000 1.014 0.012*** 0.000 1.012
Public float 0.003 0.400 1.003 0.003 0.379 1.003 0.003 0.432 1.003 0.004 0.268 1.004 0.003 0.466 1.003
Pre ROA 0.008*** 0.000 1.008 0.011*** 0.000 1.011 0.006*** 0.000 1.006 0.010*** 0.000 1.010 0.008*** 0.000 1.008
Insider ownership 0.014*** 0.000 1.014 0.013*** 0.000 1.013 0.012*** 0.000 1.012 0.014*** 0.000 1.014 0.013*** 0.000 1.014
VC-Backed -0.439** 0.014 0.645 -0.452** 0.011 0.637 -0.417** 0.020 0.659 -0.420** 0.020 0.657 -0.437** 0.014 0.646
Nomad reputation 0.376*** 0.001 1.456 0.554*** 0.000 1.74 0.116*** 0.000 1.124 0.005 0.388 1.005 0.038*** 0.000 1.039
Bubble period -0.646*** 0.000 0.524 -0.673*** 0.000 0.51 -0.644*** 0.000 0.525 -0.653*** 0.000 0.521 -0.640*** 0.000 0.527
DOM-IPOs 0.148 0.456 1.159 0.119 0.544 1.127 0.163 0.399 1.177 0.172 0.372 1.188 0.171 0.370 1.186
Industry dummies
Financials -0.101 0.580 0.904 -0.046 0.800 0.955 -0.083 0.653 0.921 -0.093 0.616 0.911 -0.11 0.552 0.896
Cyclical service -0.068 0.687 0.934 -0.024 0.886 0.976 -0.069 0.683 0.933 -0.074 0.661 0.928 -0.061 0.718 0.941
Info-technology -0.110 0.671 0.896 -0.114 0.656 0.892 -0.1 0.701 0.905 -0.106 0.683 0.899 -0.112 0.665 0.894
Non-cycl cons. goods 0.070 0.747 1.072 0.122 0.582 1.13 0.078 0.724 1.081 0.088 0.691 1.092 0.071 0.744 1.074
Resources 0.239 0.370 1.27 0.208 0.431 1.231 0.263 0.327 1.300 0.241 0.368 1.272 0.225 0.400 1.252
Constant 1.451*** 0.000 1.431*** 0.000 1.440*** 0.000 1.471*** 0.000 1.446*** 0.000
Wald Chi-square Prob > χ2 0.000***
0.000***
0.000*** 0.000*** 0.000***
Pseudo R2 0.13 0.16 0.102 0.088 0.089

46
Table 10 continues
Panel B: M&A Top 50 classified as censored survivors Model I: Nomad Reput 1 Model II: Nomad Reput 2 Model III: Nomad Reput 3 Model IV: Nomad Reput 4 Model V: Nomad Reput 5
Variables Coeff. Pvalue TR Coeff. Pvalue TR Coeff. Pvalue TR Coeff. Pvalue TR Coeff. Pvalue TR
Age 0.082*** 0.005 1.085 0.071** 0.012 1.074 0.081*** 0.005 1.084 0.089*** 0.003 1.093 0.088*** 0.002 1.092
Size 0.008** 0.028 1.008 0.007** 0.038 1.007 0.007** 0.041 1.007 0.009** 0.020 1.009 0.008** 0.021 1.008
Initial returns 0.020*** 0.000 1.021 0.019*** 0.000 1.019 0.020*** 0.000 1.02 0.022*** 0.000 1.022 0.021*** 0.000 1.021
Public float -0.001 0.853 0.999 -0.001 0.768 0.999 0.000 0.903 1.000 0.001 0.902 1.001 -0.001 0.802 0.999
Pre ROA 0.011*** 0.000 1.011 0.013*** 0.000 1.013 0.008*** 0.000 1.008 0.012*** 0.000 1.012 0.011*** 0.000 1.011
Insider ownership 0.013*** 0.000 1.013 0.012*** 0.000 1.012 0.010*** 0.000 1.01 0.013*** 0.000 1.013 0.013*** 0.000 1.013
VC-Backed -0.045 0.851 0.956 -0.063 0.793 0.939 -0.013 0.957 0.987 -0.007 0.978 0.993 -0.054 0.824 0.947
Nomad reputation 0.339** 0.042 1.403 0.615*** 0.000 1.85 0.131*** 0.000 1.14 0.002 0.456 1.002 0.022** 0.024 1.022
Bubble period -0.768*** 0.000 0.464 -0.802*** 0.000 0.448 -0.785*** 0.000 0.456 -0.797*** 0.000 0.451 -0.785*** 0.000 0.456
DOM-IPOs 0.151 0.511 1.163 0.192 0.403 1.211 0.237 0.294 1.268 0.252 0.267 1.286 0.235 0.298 1.265
Industry dummies
Financials -0.104 0.608 0.901 -0.04 0.845 0.961 -0.058 0.777 0.943 -0.075 0.716 0.928 -0.082 0.688 0.921
Cyclical service 0.252 0.196 1.286 0.286 0.142 1.33 0.269 0.173 1.309 0.258 0.194 1.295 0.243 0.215 1.275
Info-technology -0.137 0.612 0.872 -0.151 0.572 0.86 -0.116 0.670 0.891 -0.125 0.649 0.883 -0.15 0.581 0.861
Non-cycl cons. goods -0.057 0.812 0.944 0.026 0.918 1.026 -0.032 0.898 0.969 -0.014 0.955 0.986 -0.023 0.927 0.978
Resources 0.121 0.664 1.128 0.087 0.753 1.09 0.153 0.586 1.165 0.113 0.691 1.12 0.114 0.687 1.121
Constant 1.537*** 0.000 1.507*** 0.000 1.520*** 0.000 1.550*** 0.000 1.534*** 0.000
Wald Chi-square Prob > χ2 0.000*** 0.000*** 0.000*** 0.000*** 0.000***
Pseudo R2 0.22 0.23 0.185 0.182 0.181
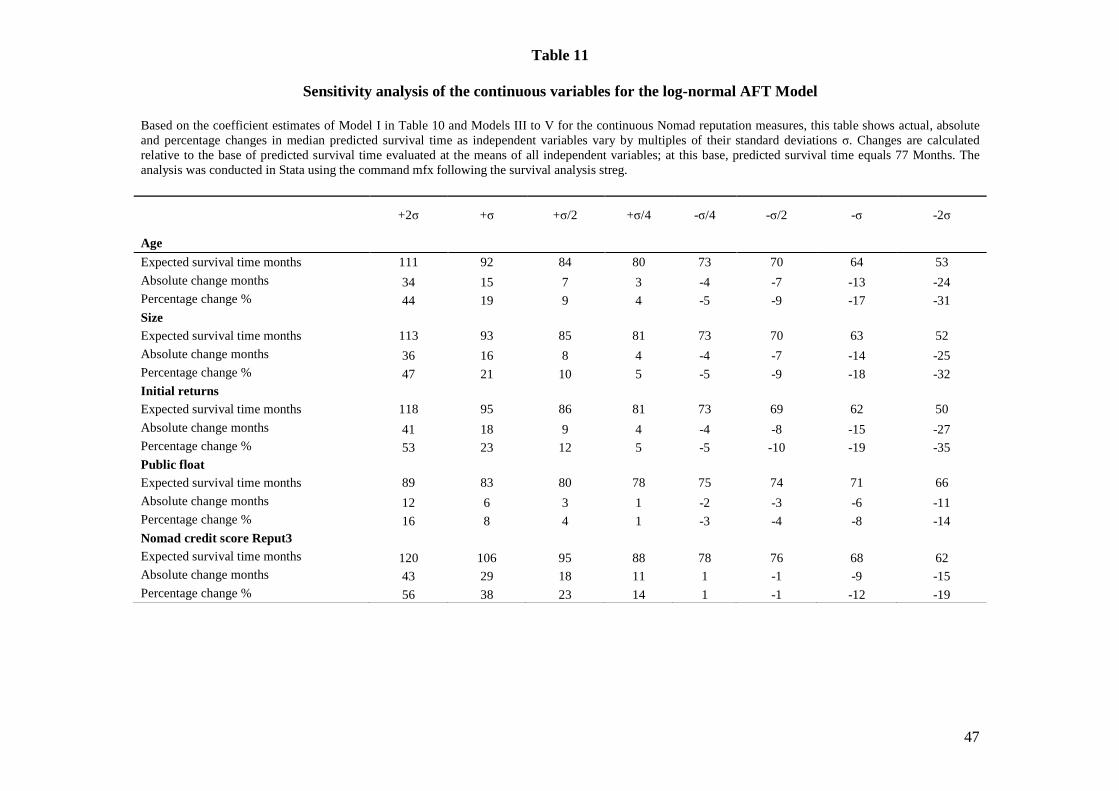
47
Table 11
Sensitivity analysis of the continuous variables for the log-normal AFT Model
Based on the coefficient estimates of Model I in Table 10 and Models III to V for the continuous Nomad reputation measures, this table shows actual, absolute and percentage changes in median predicted survival time as independent variables vary by multiples of their standard deviations σ. Changes are calculated relative to the base of predicted survival time evaluated at the means of all independent variables; at this base, predicted survival time equals 77 Months. The analysis was conducted in Stata using the command mfx following the survival analysis streg.
+2σ +σ +σ/2 +σ/4 -σ/4 -σ/2 -σ -2σ
Age
Expected survival time months 111 92 84 80 73 70 64 53
Absolute change months 34 15 7 3 -4 -7 -13 -24 Percentage change % 44 19 9 4 -5 -9 -17 -31 Size
Expected survival time months 113 93 85 81 73 70 63 52
Absolute change months 36 16 8 4 -4 -7 -14 -25 Percentage change % 47 21 10 5 -5 -9 -18 -32 Initial returns
Expected survival time months 118 95 86 81 73 69 62 50
Absolute change months 41 18 9 4 -4 -8 -15 -27 Percentage change % 53 23 12 5 -5 -10 -19 -35 Public float
Expected survival time months 89 83 80 78 75 74 71 66
Absolute change months 12 6 3 1 -2 -3 -6 -11 Percentage change % 16 8 4 1 -3 -4 -8 -14 Nomad credit score Reput3 Expected survival time months 120 106 95 88 78 76 68 62 Absolute change months 43 29 18 11 1 -1 -9 -15 Percentage change % 56 38 23 14 1 -1 -12 -19
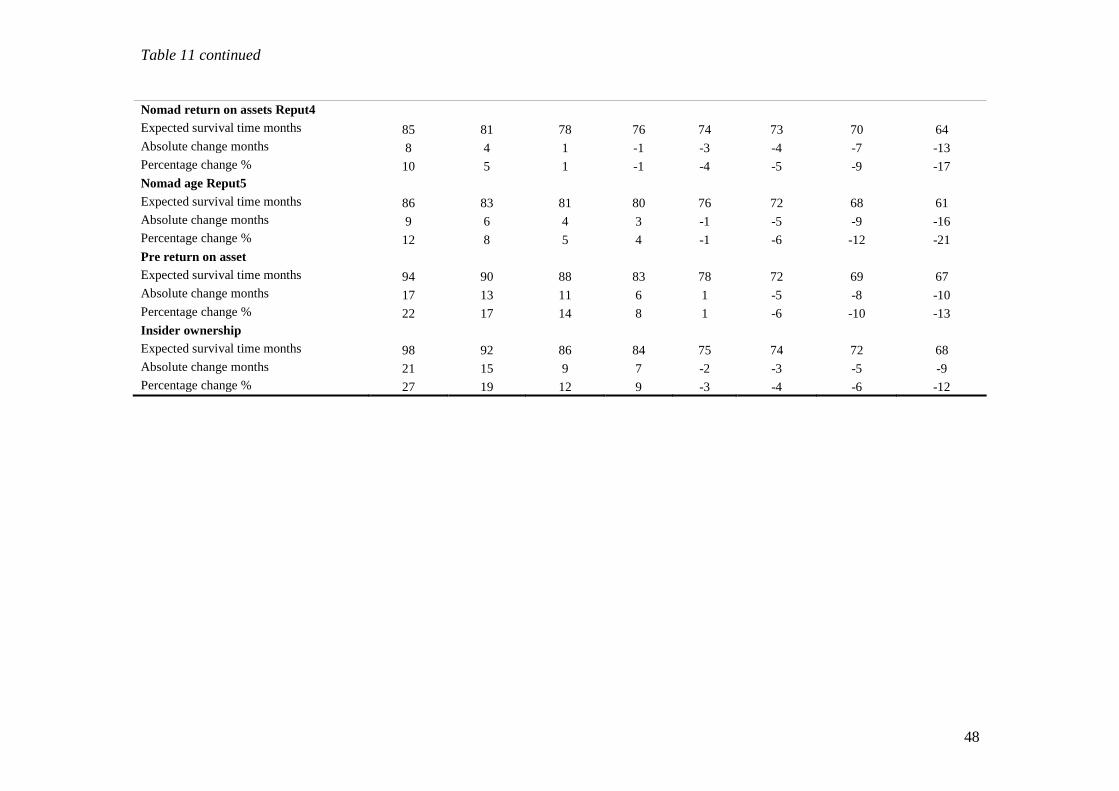
48
Table 11 continued Nomad return on assets Reput4 Expected survival time months 85 81 78 76 74 73 70 64 Absolute change months 8 4 1 -1 -3 -4 -7 -13 Percentage change % 10 5 1 -1 -4 -5 -9 -17 Nomad age Reput5 Expected survival time months 86 83 81 80 76 72 68 61 Absolute change months 9 6 4 3 -1 -5 -9 -16 Percentage change % 12 8 5 4 -1 -6 -12 -21 Pre return on asset Expected survival time months 94 90 88 83 78 72 69 67 Absolute change months 17 13 11 6 1 -5 -8 -10 Percentage change % 22 17 14 8 1 -6 -10 -13 Insider ownership Expected survival time months 98 92 86 84 75 74 72 68 Absolute change months 21 15 9 7 -2 -3 -5 -9 Percentage change % 27 19 12 9 -3 -4 -6 -12
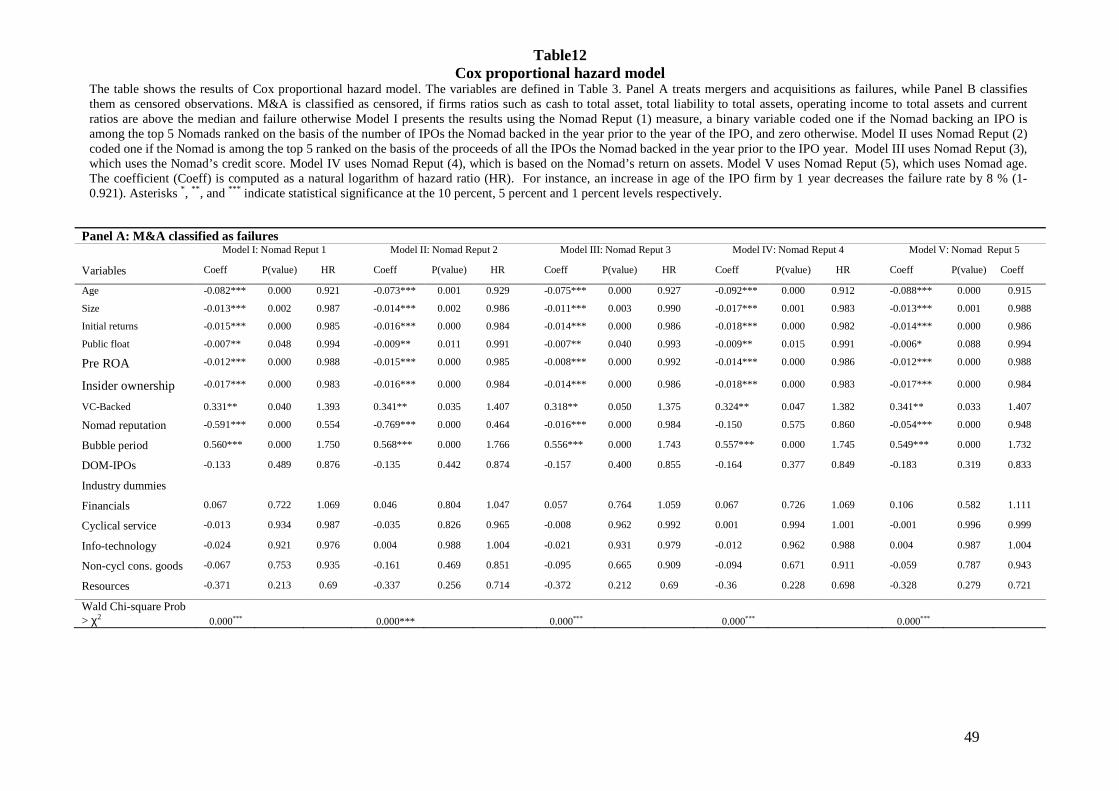
49
Table12 Cox proportional hazard model
The table shows the results of Cox proportional hazard model. The variables are defined in Table 3. Panel A treats mergers and acquisitions as failures, while Panel B classifies them as censored observations. M&A is classified as censored, if firms ratios such as cash to total asset, total liability to total assets, operating income to total assets and current ratios are above the median and failure otherwise Model I presents the results using the Nomad Reput (1) measure, a binary variable coded one if the Nomad backing an IPO is among the top 5 Nomads ranked on the basis of the number of IPOs the Nomad backed in the year prior to the year of the IPO, and zero otherwise. Model II uses Nomad Reput (2) coded one if the Nomad is among the top 5 ranked on the basis of the proceeds of all the IPOs the Nomad backed in the year prior to the IPO year. Model III uses Nomad Reput (3), which uses the Nomad’s credit score. Model IV uses Nomad Reput (4), which is based on the Nomad’s return on assets. Model V uses Nomad Reput (5), which uses Nomad age. The coefficient (Coeff) is computed as a natural logarithm of hazard ratio (HR). For instance, an increase in age of the IPO firm by 1 year decreases the failure rate by 8 % (1-0.921). Asterisks *, ** , and *** indicate statistical significance at the 10 percent, 5 percent and 1 percent levels respectively.
Panel A: M&A classified as failures Model I: Nomad Reput 1 Model II: Nomad Reput 2 Model III: Nomad Reput 3 Model IV: Nomad Reput 4 Model V: Nomad Reput 5
Variables Coeff P(value) HR Coeff P(value) HR Coeff P(value) HR Coeff P(value) HR Coeff P(value) Coeff
Age -0.082*** 0.000 0.921 -0.073*** 0.001 0.929 -0.075*** 0.000 0.927 -0.092*** 0.000 0.912 -0.088*** 0.000 0.915
Size -0.013*** 0.002 0.987 -0.014*** 0.002 0.986 -0.011*** 0.003 0.990 -0.017*** 0.001 0.983 -0.013*** 0.001 0.988
Initial returns -0.015*** 0.000 0.985 -0.016*** 0.000 0.984 -0.014*** 0.000 0.986 -0.018*** 0.000 0.982 -0.014*** 0.000 0.986
Public float -0.007** 0.048 0.994 -0.009** 0.011 0.991 -0.007** 0.040 0.993 -0.009** 0.015 0.991 -0.006* 0.088 0.994
Pre ROA -0.012*** 0.000 0.988 -0.015*** 0.000 0.985 -0.008*** 0.000 0.992 -0.014*** 0.000 0.986 -0.012*** 0.000 0.988
Insider ownership -0.017*** 0.000 0.983 -0.016*** 0.000 0.984 -0.014*** 0.000 0.986 -0.018*** 0.000 0.983 -0.017*** 0.000 0.984
VC-Backed 0.331** 0.040 1.393 0.341** 0.035 1.407 0.318** 0.050 1.375 0.324** 0.047 1.382 0.341** 0.033 1.407
Nomad reputation -0.591*** 0.000 0.554 -0.769*** 0.000 0.464 -0.016*** 0.000 0.984 -0.150 0.575 0.860 -0.054*** 0.000 0.948
Bubble period 0.560*** 0.000 1.750 0.568*** 0.000 1.766 0.556*** 0.000 1.743 0.557*** 0.000 1.745 0.549*** 0.000 1.732
DOM-IPOs -0.133 0.489 0.876 -0.135 0.442 0.874 -0.157 0.400 0.855 -0.164 0.377 0.849 -0.183 0.319 0.833
Industry dummies
Financials 0.067 0.722 1.069 0.046 0.804 1.047 0.057 0.764 1.059 0.067 0.726 1.069 0.106 0.582 1.111
Cyclical service -0.013 0.934 0.987 -0.035 0.826 0.965 -0.008 0.962 0.992 0.001 0.994 1.001 -0.001 0.996 0.999
Info-technology -0.024 0.921 0.976 0.004 0.988 1.004 -0.021 0.931 0.979 -0.012 0.962 0.988 0.004 0.987 1.004
Non-cycl cons. goods -0.067 0.753 0.935 -0.161 0.469 0.851 -0.095 0.665 0.909 -0.094 0.671 0.911 -0.059 0.787 0.943
Resources -0.371 0.213 0.69 -0.337 0.256 0.714 -0.372 0.212 0.69 -0.36 0.228 0.698 -0.328 0.279 0.721
Wald Chi-square Prob > χ2 0.000***
0.000***
0.000*** 0.000*** 0.000***
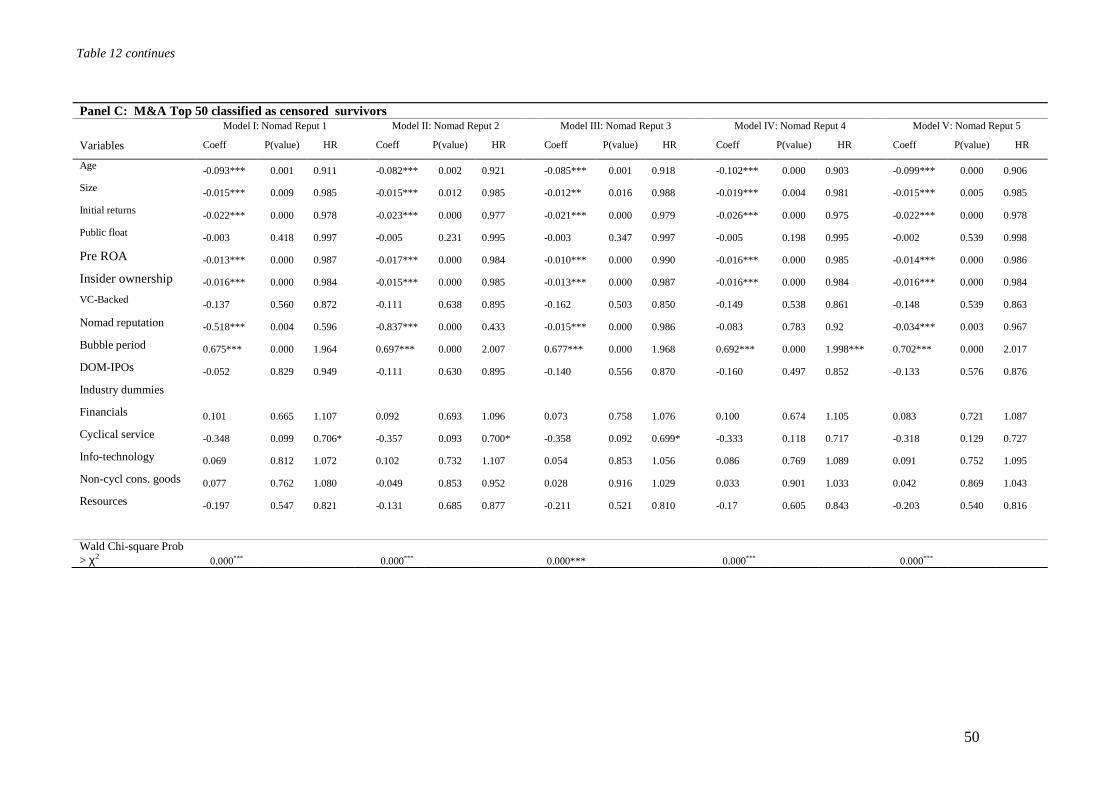
50
Table 12 continues
Panel C: M&A Top 50 classified as censored survivors Model I: Nomad Reput 1 Model II: Nomad Reput 2 Model III: Nomad Reput 3 Model IV: Nomad Reput 4 Model V: Nomad Reput 5
Variables Coeff P(value) HR Coeff P(value) HR Coeff P(value) HR Coeff P(value) HR Coeff P(value) HR
Age -0.093*** 0.001 0.911 -0.082*** 0.002 0.921 -0.085*** 0.001 0.918 -0.102*** 0.000 0.903 -0.099*** 0.000 0.906
Size -0.015*** 0.009 0.985 -0.015*** 0.012 0.985 -0.012** 0.016 0.988 -0.019*** 0.004 0.981 -0.015*** 0.005 0.985
Initial returns -0.022*** 0.000 0.978 -0.023*** 0.000 0.977 -0.021*** 0.000 0.979 -0.026*** 0.000 0.975 -0.022*** 0.000 0.978
Public float -0.003 0.418 0.997 -0.005 0.231 0.995 -0.003 0.347 0.997 -0.005 0.198 0.995 -0.002 0.539 0.998
Pre ROA -0.013*** 0.000 0.987 -0.017*** 0.000 0.984 -0.010*** 0.000 0.990 -0.016*** 0.000 0.985 -0.014*** 0.000 0.986
Insider ownership -0.016*** 0.000 0.984 -0.015*** 0.000 0.985 -0.013*** 0.000 0.987 -0.016*** 0.000 0.984 -0.016*** 0.000 0.984
VC-Backed -0.137 0.560 0.872 -0.111 0.638 0.895 -0.162 0.503 0.850 -0.149 0.538 0.861 -0.148 0.539 0.863
Nomad reputation -0.518*** 0.004 0.596 -0.837*** 0.000 0.433 -0.015*** 0.000 0.986 -0.083 0.783 0.92 -0.034*** 0.003 0.967
Bubble period 0.675*** 0.000 1.964 0.697*** 0.000 2.007 0.677*** 0.000 1.968 0.692*** 0.000 1.998*** 0.702*** 0.000 2.017
DOM-IPOs -0.052 0.829 0.949 -0.111 0.630 0.895 -0.140 0.556 0.870 -0.160 0.497 0.852 -0.133 0.576 0.876
Industry dummies
Financials 0.101 0.665 1.107 0.092 0.693 1.096 0.073 0.758 1.076 0.100 0.674 1.105 0.083 0.721 1.087
Cyclical service -0.348 0.099 0.706* -0.357 0.093 0.700* -0.358 0.092 0.699* -0.333 0.118 0.717 -0.318 0.129 0.727
Info-technology 0.069 0.812 1.072 0.102 0.732 1.107 0.054 0.853 1.056 0.086 0.769 1.089 0.091 0.752 1.095
Non-cycl cons. goods 0.077 0.762 1.080 -0.049 0.853 0.952 0.028 0.916 1.029 0.033 0.901 1.033 0.042 0.869 1.043
Resources -0.197 0.547 0.821 -0.131 0.685 0.877 -0.211 0.521 0.810 -0.17 0.605 0.843 -0.203 0.540 0.816
Wald Chi-square Prob > χ2 0.000*** 0.000*** 0.000*** 0.000*** 0.000***
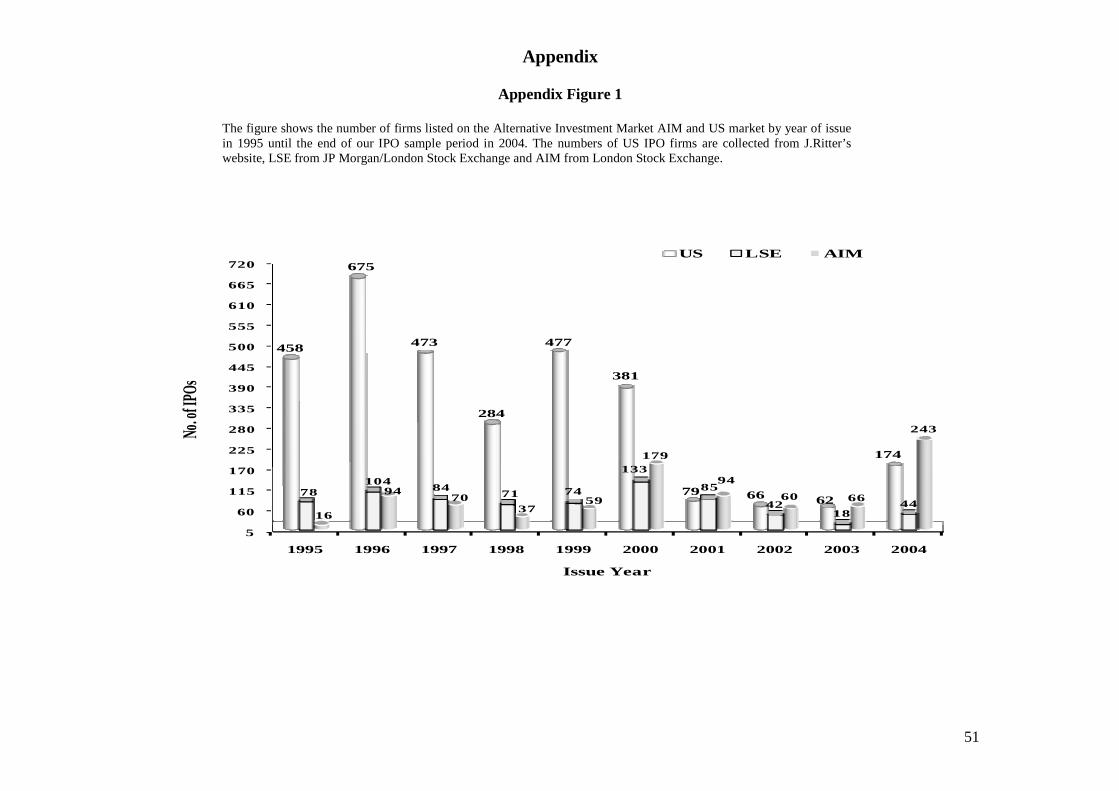
51
Appendix
Appendix Figure 1
The figure shows the number of firms listed on the Alternative Investment Market AIM and US market by year of issue in 1995 until the end of our IPO sample period in 2004. The numbers of US IPO firms are collected from J.Ritter’s website, LSE from JP Morgan/London Stock Exchange and AIM from London Stock Exchange.
5
60
115
170
225
280
335
390
445
500
555
610
665
720
1995 1996 1997 1998 1999 2000 2001 2002 2003 2004
458
675
473
284
477
381
79 66 62
174
78104
8471 74
133
85
4218
4416
9470
3759
179
94
60 66
243No. o
f IPOs
Issue Year
US LSE AIM
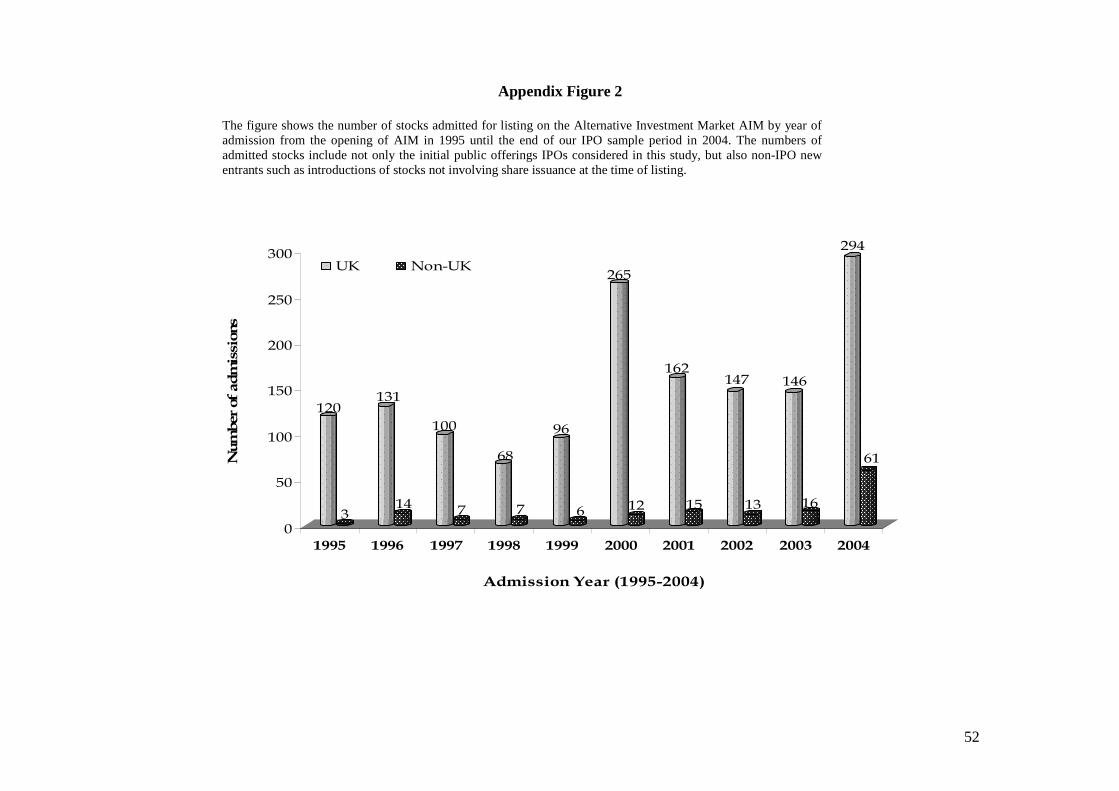
52
Appendix Figure 2
The figure shows the number of stocks admitted for listing on the Alternative Investment Market AIM by year of admission from the opening of AIM in 1995 until the end of our IPO sample period in 2004. The numbers of admitted stocks include not only the initial public offerings IPOs considered in this study, but also non-IPO new entrants such as introductions of stocks not involving share issuance at the time of listing.
120
3
131
14
100
7
68
7
96
6
265
12
162
15
147
13
146
16
294
61
0
50
100
150
200
250
300
Number of admissions
1995 1996 1997 1998 1999 2000 2001 2002 2003 2004
Admission Year (1995-2004)
UK Non-UK
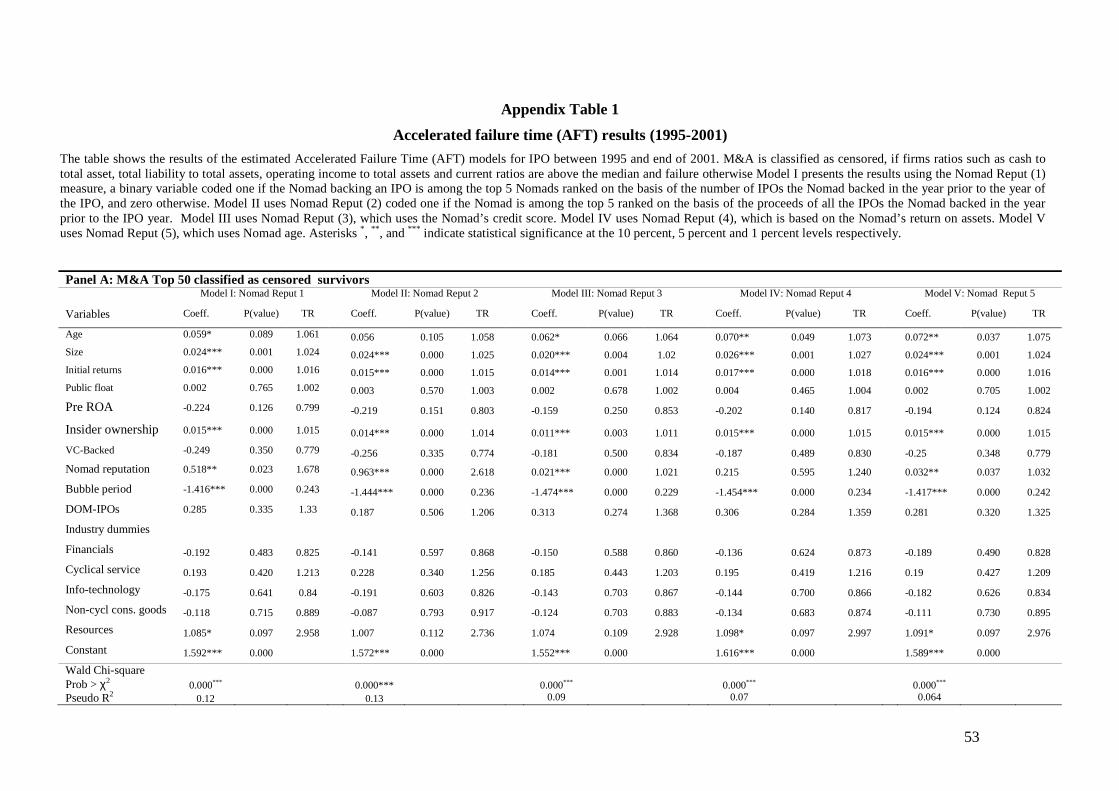
53
Appendix Table 1
Accelerated failure time (AFT) results (1995-2001)
The table shows the results of the estimated Accelerated Failure Time (AFT) models for IPO between 1995 and end of 2001. M&A is classified as censored, if firms ratios such as cash to total asset, total liability to total assets, operating income to total assets and current ratios are above the median and failure otherwise Model I presents the results using the Nomad Reput (1) measure, a binary variable coded one if the Nomad backing an IPO is among the top 5 Nomads ranked on the basis of the number of IPOs the Nomad backed in the year prior to the year of the IPO, and zero otherwise. Model II uses Nomad Reput (2) coded one if the Nomad is among the top 5 ranked on the basis of the proceeds of all the IPOs the Nomad backed in the year prior to the IPO year. Model III uses Nomad Reput (3), which uses the Nomad’s credit score. Model IV uses Nomad Reput (4), which is based on the Nomad’s return on assets. Model V uses Nomad Reput (5), which uses Nomad age. Asterisks * , ** , and *** indicate statistical significance at the 10 percent, 5 percent and 1 percent levels respectively.
Panel A: M&A Top 50 classified as censored survivors Model I: Nomad Reput 1 Model II: Nomad Reput 2 Model III: Nomad Reput 3 Model IV: Nomad Reput 4 Model V: Nomad Reput 5
Variables Coeff. P(value) TR Coeff. P(value) TR Coeff. P(value) TR Coeff. P(value) TR Coeff. P(value) TR
Age 0.059* 0.089 1.061 0.056 0.105 1.058 0.062* 0.066 1.064 0.070** 0.049 1.073 0.072** 0.037 1.075
Size 0.024*** 0.001 1.024 0.024*** 0.000 1.025 0.020*** 0.004 1.02 0.026*** 0.001 1.027 0.024*** 0.001 1.024
Initial returns 0.016*** 0.000 1.016 0.015*** 0.000 1.015 0.014*** 0.001 1.014 0.017*** 0.000 1.018 0.016*** 0.000 1.016
Public float 0.002 0.765 1.002 0.003 0.570 1.003 0.002 0.678 1.002 0.004 0.465 1.004 0.002 0.705 1.002
Pre ROA -0.224 0.126 0.799 -0.219 0.151 0.803 -0.159 0.250 0.853 -0.202 0.140 0.817 -0.194 0.124 0.824
Insider ownership 0.015*** 0.000 1.015 0.014*** 0.000 1.014 0.011*** 0.003 1.011 0.015*** 0.000 1.015 0.015*** 0.000 1.015
VC-Backed -0.249 0.350 0.779 -0.256 0.335 0.774 -0.181 0.500 0.834 -0.187 0.489 0.830 -0.25 0.348 0.779
Nomad reputation 0.518** 0.023 1.678 0.963*** 0.000 2.618 0.021*** 0.000 1.021 0.215 0.595 1.240 0.032** 0.037 1.032
Bubble period -1.416*** 0.000 0.243 -1.444*** 0.000 0.236 -1.474*** 0.000 0.229 -1.454*** 0.000 0.234 -1.417*** 0.000 0.242
DOM-IPOs 0.285 0.335 1.33 0.187 0.506 1.206 0.313 0.274 1.368 0.306 0.284 1.359 0.281 0.320 1.325
Industry dummies
Financials -0.192 0.483 0.825 -0.141 0.597 0.868 -0.150 0.588 0.860 -0.136 0.624 0.873 -0.189 0.490 0.828
Cyclical service 0.193 0.420 1.213 0.228 0.340 1.256 0.185 0.443 1.203 0.195 0.419 1.216 0.19 0.427 1.209
Info-technology -0.175 0.641 0.84 -0.191 0.603 0.826 -0.143 0.703 0.867 -0.144 0.700 0.866 -0.182 0.626 0.834
Non-cycl cons. goods -0.118 0.715 0.889 -0.087 0.793 0.917 -0.124 0.703 0.883 -0.134 0.683 0.874 -0.111 0.730 0.895
Resources 1.085* 0.097 2.958 1.007 0.112 2.736 1.074 0.109 2.928 1.098* 0.097 2.997 1.091* 0.097 2.976
Constant 1.592*** 0.000 1.572*** 0.000 1.552*** 0.000 1.616*** 0.000 1.589*** 0.000
Wald Chi-square Prob > χ2 0.000***
0.000***
0.000*** 0.000*** 0.000***
Pseudo R2 0.12 0.13 0.09 0.07 0.064
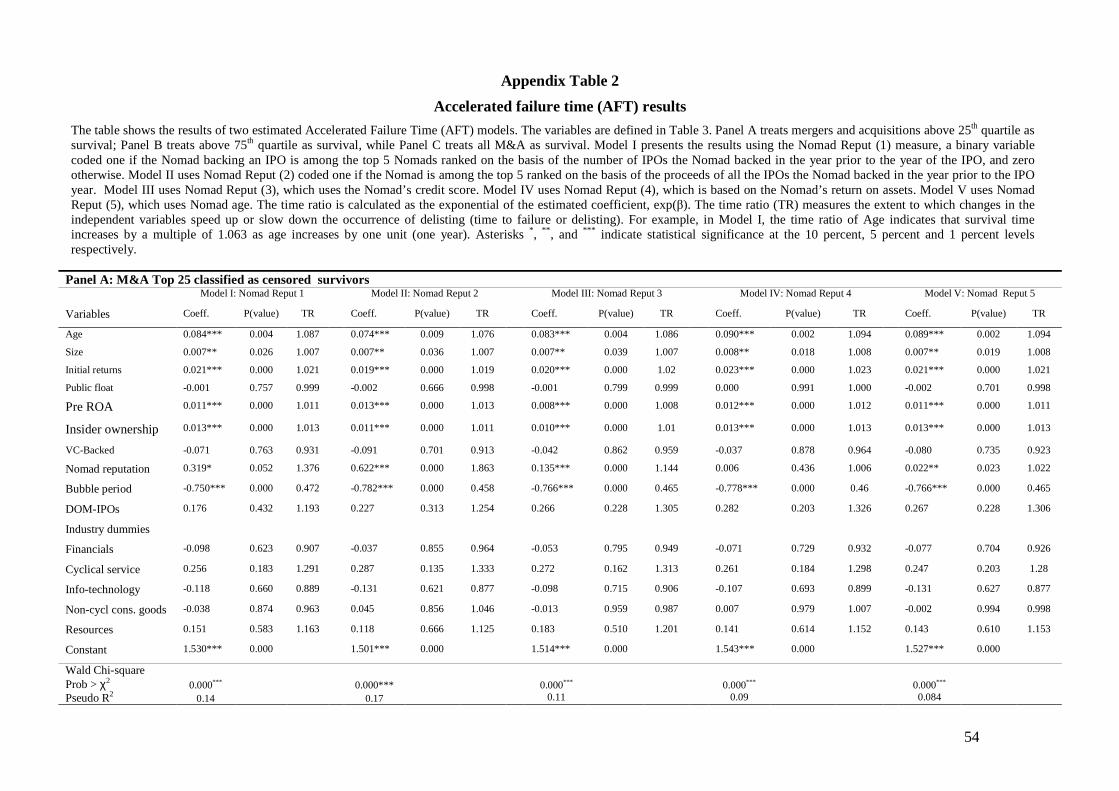
54
Appendix Table 2
Accelerated failure time (AFT) results
The table shows the results of two estimated Accelerated Failure Time (AFT) models. The variables are defined in Table 3. Panel A treats mergers and acquisitions above 25th quartile as survival; Panel B treats above 75th quartile as survival, while Panel C treats all M&A as survival. Model I presents the results using the Nomad Reput (1) measure, a binary variable coded one if the Nomad backing an IPO is among the top 5 Nomads ranked on the basis of the number of IPOs the Nomad backed in the year prior to the year of the IPO, and zero otherwise. Model II uses Nomad Reput (2) coded one if the Nomad is among the top 5 ranked on the basis of the proceeds of all the IPOs the Nomad backed in the year prior to the IPO year. Model III uses Nomad Reput (3), which uses the Nomad’s credit score. Model IV uses Nomad Reput (4), which is based on the Nomad’s return on assets. Model V uses Nomad Reput (5), which uses Nomad age. The time ratio is calculated as the exponential of the estimated coefficient, exp(β). The time ratio (TR) measures the extent to which changes in the independent variables speed up or slow down the occurrence of delisting (time to failure or delisting). For example, in Model I, the time ratio of Age indicates that survival time increases by a multiple of 1.063 as age increases by one unit (one year). Asterisks *, ** , and *** indicate statistical significance at the 10 percent, 5 percent and 1 percent levels respectively.
Panel A: M&A Top 25 classified as censored survivors Model I: Nomad Reput 1 Model II: Nomad Reput 2 Model III: Nomad Reput 3 Model IV: Nomad Reput 4 Model V: Nomad Reput 5
Variables Coeff. P(value) TR Coeff. P(value) TR Coeff. P(value) TR Coeff. P(value) TR Coeff. P(value) TR
Age 0.084*** 0.004 1.087 0.074*** 0.009 1.076 0.083*** 0.004 1.086 0.090*** 0.002 1.094 0.089*** 0.002 1.094
Size 0.007** 0.026 1.007 0.007** 0.036 1.007 0.007** 0.039 1.007 0.008** 0.018 1.008 0.007** 0.019 1.008
Initial returns 0.021*** 0.000 1.021 0.019*** 0.000 1.019 0.020*** 0.000 1.02 0.023*** 0.000 1.023 0.021*** 0.000 1.021
Public float -0.001 0.757 0.999 -0.002 0.666 0.998 -0.001 0.799 0.999 0.000 0.991 1.000 -0.002 0.701 0.998
Pre ROA 0.011*** 0.000 1.011 0.013*** 0.000 1.013 0.008*** 0.000 1.008 0.012*** 0.000 1.012 0.011*** 0.000 1.011
Insider ownership 0.013*** 0.000 1.013 0.011*** 0.000 1.011 0.010*** 0.000 1.01 0.013*** 0.000 1.013 0.013*** 0.000 1.013
VC-Backed -0.071 0.763 0.931 -0.091 0.701 0.913 -0.042 0.862 0.959 -0.037 0.878 0.964 -0.080 0.735 0.923
Nomad reputation 0.319* 0.052 1.376 0.622*** 0.000 1.863 0.135*** 0.000 1.144 0.006 0.436 1.006 0.022** 0.023 1.022
Bubble period -0.750*** 0.000 0.472 -0.782*** 0.000 0.458 -0.766*** 0.000 0.465 -0.778*** 0.000 0.46 -0.766*** 0.000 0.465
DOM-IPOs 0.176 0.432 1.193 0.227 0.313 1.254 0.266 0.228 1.305 0.282 0.203 1.326 0.267 0.228 1.306
Industry dummies
Financials -0.098 0.623 0.907 -0.037 0.855 0.964 -0.053 0.795 0.949 -0.071 0.729 0.932 -0.077 0.704 0.926
Cyclical service 0.256 0.183 1.291 0.287 0.135 1.333 0.272 0.162 1.313 0.261 0.184 1.298 0.247 0.203 1.28
Info-technology -0.118 0.660 0.889 -0.131 0.621 0.877 -0.098 0.715 0.906 -0.107 0.693 0.899 -0.131 0.627 0.877
Non-cycl cons. goods -0.038 0.874 0.963 0.045 0.856 1.046 -0.013 0.959 0.987 0.007 0.979 1.007 -0.002 0.994 0.998
Resources 0.151 0.583 1.163 0.118 0.666 1.125 0.183 0.510 1.201 0.141 0.614 1.152 0.143 0.610 1.153
Constant 1.530*** 0.000 1.501*** 0.000 1.514*** 0.000 1.543*** 0.000 1.527*** 0.000
Wald Chi-square Prob > χ2 0.000***
0.000***
0.000*** 0.000*** 0.000***
Pseudo R2 0.14 0.17 0.11 0.09 0.084
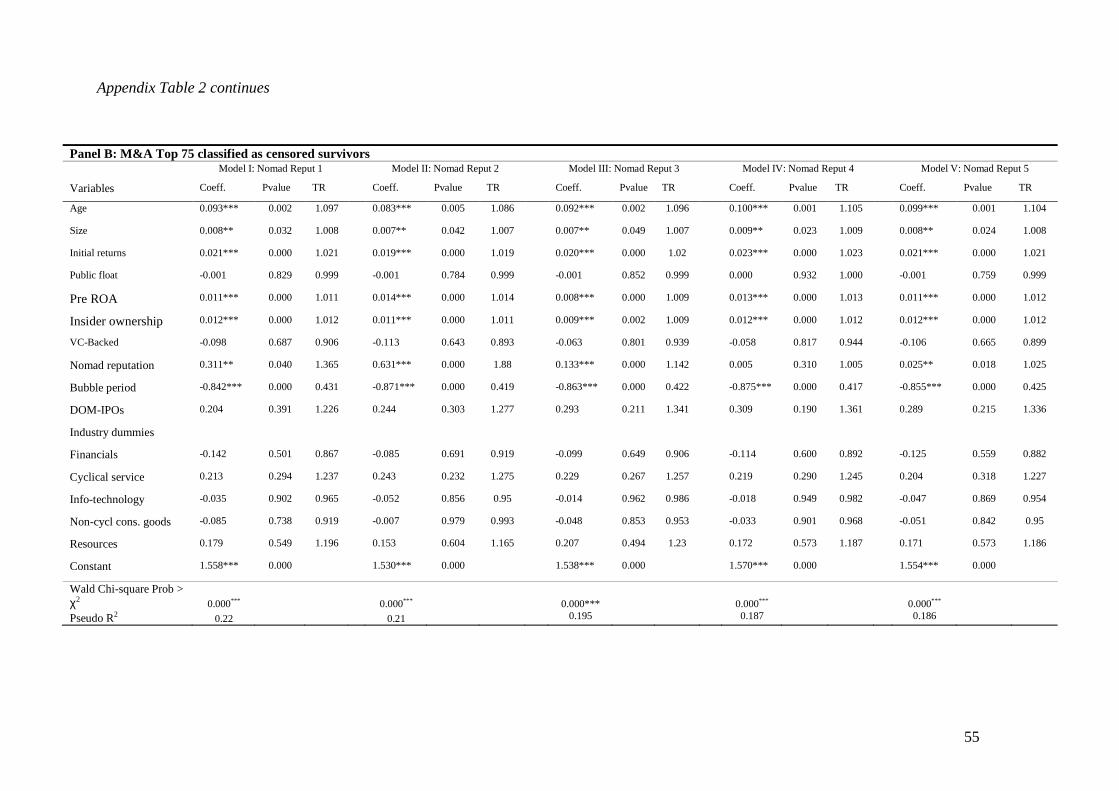
55
Appendix Table 2 continues
Panel B: M&A Top 75 classified as censored survivors Model I: Nomad Reput 1 Model II: Nomad Reput 2 Model III: Nomad Reput 3 Model IV: Nomad Reput 4 Model V: Nomad Reput 5
Variables Coeff. Pvalue TR Coeff. Pvalue TR Coeff. Pvalue TR Coeff. Pvalue TR Coeff. Pvalue TR
Age 0.093*** 0.002 1.097 0.083*** 0.005 1.086 0.092*** 0.002 1.096 0.100*** 0.001 1.105 0.099*** 0.001 1.104
Size 0.008** 0.032 1.008 0.007** 0.042 1.007 0.007** 0.049 1.007 0.009** 0.023 1.009 0.008** 0.024 1.008
Initial returns 0.021*** 0.000 1.021 0.019*** 0.000 1.019 0.020*** 0.000 1.02 0.023*** 0.000 1.023 0.021*** 0.000 1.021
Public float -0.001 0.829 0.999 -0.001 0.784 0.999 -0.001 0.852 0.999 0.000 0.932 1.000 -0.001 0.759 0.999
Pre ROA 0.011*** 0.000 1.011 0.014*** 0.000 1.014 0.008*** 0.000 1.009 0.013*** 0.000 1.013 0.011*** 0.000 1.012
Insider ownership 0.012*** 0.000 1.012 0.011*** 0.000 1.011 0.009*** 0.002 1.009 0.012*** 0.000 1.012 0.012*** 0.000 1.012
VC-Backed -0.098 0.687 0.906 -0.113 0.643 0.893 -0.063 0.801 0.939 -0.058 0.817 0.944 -0.106 0.665 0.899
Nomad reputation 0.311** 0.040 1.365 0.631*** 0.000 1.88 0.133*** 0.000 1.142 0.005 0.310 1.005 0.025** 0.018 1.025
Bubble period -0.842*** 0.000 0.431 -0.871*** 0.000 0.419 -0.863*** 0.000 0.422 -0.875*** 0.000 0.417 -0.855*** 0.000 0.425
DOM-IPOs 0.204 0.391 1.226 0.244 0.303 1.277 0.293 0.211 1.341 0.309 0.190 1.361 0.289 0.215 1.336
Industry dummies
Financials -0.142 0.501 0.867 -0.085 0.691 0.919 -0.099 0.649 0.906 -0.114 0.600 0.892 -0.125 0.559 0.882
Cyclical service 0.213 0.294 1.237 0.243 0.232 1.275 0.229 0.267 1.257 0.219 0.290 1.245 0.204 0.318 1.227
Info-technology -0.035 0.902 0.965 -0.052 0.856 0.95 -0.014 0.962 0.986 -0.018 0.949 0.982 -0.047 0.869 0.954
Non-cycl cons. goods -0.085 0.738 0.919 -0.007 0.979 0.993 -0.048 0.853 0.953 -0.033 0.901 0.968 -0.051 0.842 0.95
Resources 0.179 0.549 1.196 0.153 0.604 1.165 0.207 0.494 1.23 0.172 0.573 1.187 0.171 0.573 1.186
Constant 1.558*** 0.000 1.530*** 0.000 1.538*** 0.000 1.570*** 0.000 1.554*** 0.000
Wald Chi-square Prob > χ2 0.000*** 0.000*** 0.000*** 0.000*** 0.000***
Pseudo R2 0.22 0.21 0.195 0.187 0.186
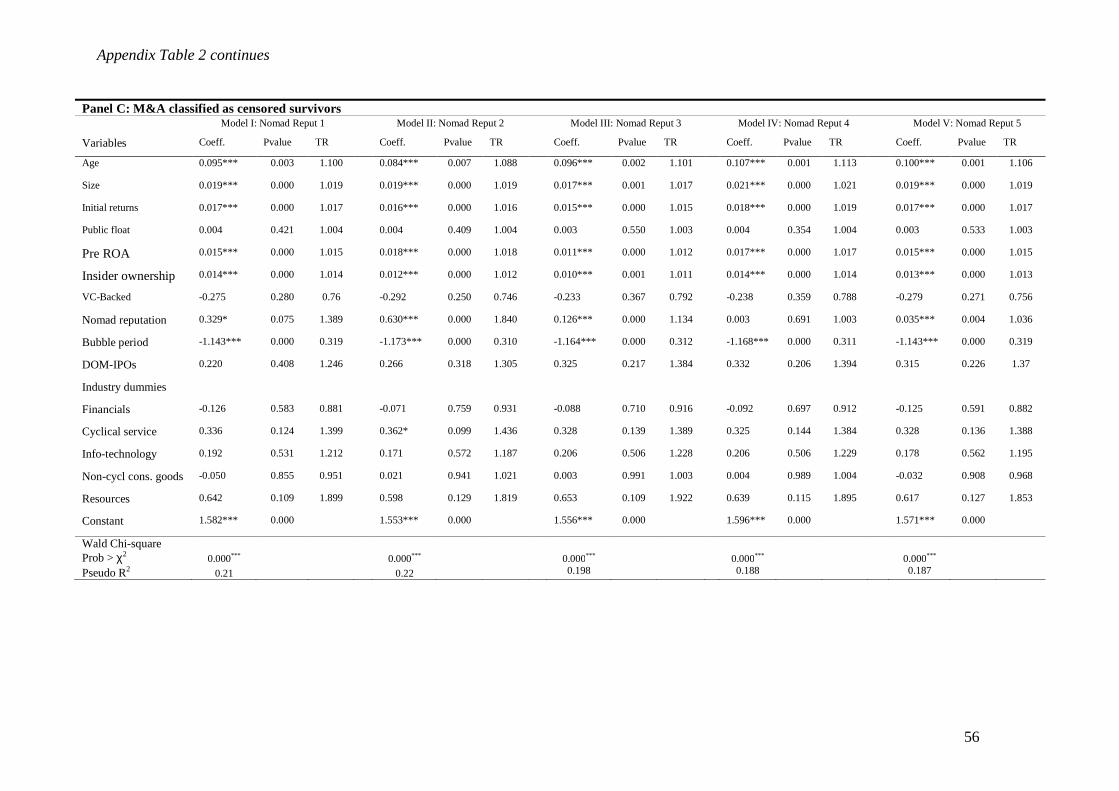
56
Appendix Table 2 continues
Panel C: M&A classified as censored survivors Model I: Nomad Reput 1 Model II: Nomad Reput 2 Model III: Nomad Reput 3 Model IV: Nomad Reput 4 Model V: Nomad Reput 5
Variables Coeff. Pvalue TR Coeff. Pvalue TR Coeff. Pvalue TR Coeff. Pvalue TR Coeff. Pvalue TR
Age 0.095*** 0.003 1.100 0.084*** 0.007 1.088 0.096*** 0.002 1.101 0.107*** 0.001 1.113 0.100*** 0.001 1.106
Size 0.019*** 0.000 1.019 0.019*** 0.000 1.019 0.017*** 0.001 1.017 0.021*** 0.000 1.021 0.019*** 0.000 1.019
Initial returns 0.017*** 0.000 1.017 0.016*** 0.000 1.016 0.015*** 0.000 1.015 0.018*** 0.000 1.019 0.017*** 0.000 1.017
Public float 0.004 0.421 1.004 0.004 0.409 1.004 0.003 0.550 1.003 0.004 0.354 1.004 0.003 0.533 1.003
Pre ROA 0.015*** 0.000 1.015 0.018*** 0.000 1.018 0.011*** 0.000 1.012 0.017*** 0.000 1.017 0.015*** 0.000 1.015
Insider ownership 0.014*** 0.000 1.014 0.012*** 0.000 1.012 0.010*** 0.001 1.011 0.014*** 0.000 1.014 0.013*** 0.000 1.013
VC-Backed -0.275 0.280 0.76 -0.292 0.250 0.746 -0.233 0.367 0.792 -0.238 0.359 0.788 -0.279 0.271 0.756
Nomad reputation 0.329* 0.075 1.389 0.630*** 0.000 1.840 0.126*** 0.000 1.134 0.003 0.691 1.003 0.035*** 0.004 1.036
Bubble period -1.143*** 0.000 0.319 -1.173*** 0.000 0.310 -1.164*** 0.000 0.312 -1.168*** 0.000 0.311 -1.143*** 0.000 0.319
DOM-IPOs 0.220 0.408 1.246 0.266 0.318 1.305 0.325 0.217 1.384 0.332 0.206 1.394 0.315 0.226 1.37
Industry dummies
Financials -0.126 0.583 0.881 -0.071 0.759 0.931 -0.088 0.710 0.916 -0.092 0.697 0.912 -0.125 0.591 0.882
Cyclical service 0.336 0.124 1.399 0.362* 0.099 1.436 0.328 0.139 1.389 0.325 0.144 1.384 0.328 0.136 1.388
Info-technology 0.192 0.531 1.212 0.171 0.572 1.187 0.206 0.506 1.228 0.206 0.506 1.229 0.178 0.562 1.195
Non-cycl cons. goods -0.050 0.855 0.951 0.021 0.941 1.021 0.003 0.991 1.003 0.004 0.989 1.004 -0.032 0.908 0.968
Resources 0.642 0.109 1.899 0.598 0.129 1.819 0.653 0.109 1.922 0.639 0.115 1.895 0.617 0.127 1.853
Constant 1.582*** 0.000 1.553*** 0.000 1.556*** 0.000 1.596*** 0.000 1.571*** 0.000
Wald Chi-square Prob > χ2 0.000*** 0.000*** 0.000*** 0.000*** 0.000***
Pseudo R2 0.21 0.22 0.198 0.188 0.187
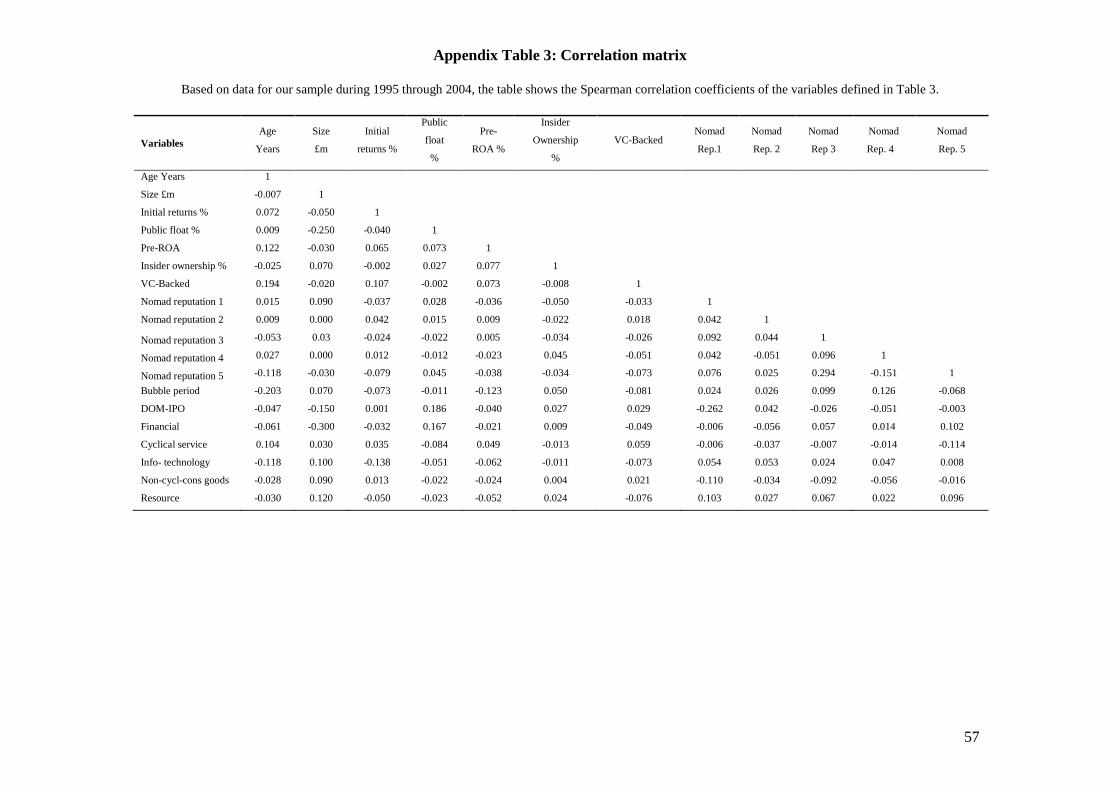
57
Appendix Table 3: Correlation matrix
Based on data for our sample during 1995 through 2004, the table shows the Spearman correlation coefficients of the variables defined in Table 3.
Variables Age
Years
Size
£m
Initial
returns %
Public
float
%
Pre-
ROA %
Insider
Ownership
%
VC-Backed Nomad
Rep.1
Nomad
Rep. 2
Nomad
Rep 3
Nomad
Rep. 4
Nomad
Rep. 5
Age Years 1
Size £m -0.007 1
Initial returns % 0.072 -0.050 1
Public float % 0.009 -0.250 -0.040 1
Pre-ROA 0.122 -0.030 0.065 0.073 1
Insider ownership % -0.025 0.070 -0.002 0.027 0.077 1
VC-Backed 0.194 -0.020 0.107 -0.002 0.073 -0.008 1
Nomad reputation 1 0.015 0.090 -0.037 0.028 -0.036 -0.050 -0.033 1
Nomad reputation 2 0.009 0.000 0.042 0.015 0.009 -0.022 0.018 0.042 1
Nomad reputation 3 -0.053 0.03 -0.024 -0.022 0.005 -0.034 -0.026 0.092 0.044 1
Nomad reputation 4 0.027 0.000 0.012 -0.012 -0.023 0.045 -0.051 0.042 -0.051 0.096 1
Nomad reputation 5 -0.118 -0.030 -0.079 0.045 -0.038 -0.034 -0.073 0.076 0.025 0.294 -0.151 1
Bubble period -0.203 0.070 -0.073 -0.011 -0.123 0.050 -0.081 0.024 0.026 0.099 0.126 -0.068
DOM-IPO -0.047 -0.150 0.001 0.186 -0.040 0.027 0.029 -0.262 0.042 -0.026 -0.051 -0.003
Financial -0.061 -0.300 -0.032 0.167 -0.021 0.009 -0.049 -0.006 -0.056 0.057 0.014 0.102
Cyclical service 0.104 0.030 0.035 -0.084 0.049 -0.013 0.059 -0.006 -0.037 -0.007 -0.014 -0.114
Info- technology -0.118 0.100 -0.138 -0.051 -0.062 -0.011 -0.073 0.054 0.053 0.024 0.047 0.008
Non-cycl-cons goods -0.028 0.090 0.013 -0.022 -0.024 0.004 0.021 -0.110 -0.034 -0.092 -0.056 -0.016
Resource -0.030 0.120 -0.050 -0.023 -0.052 0.024 -0.076 0.103 0.027 0.067 0.022 0.096
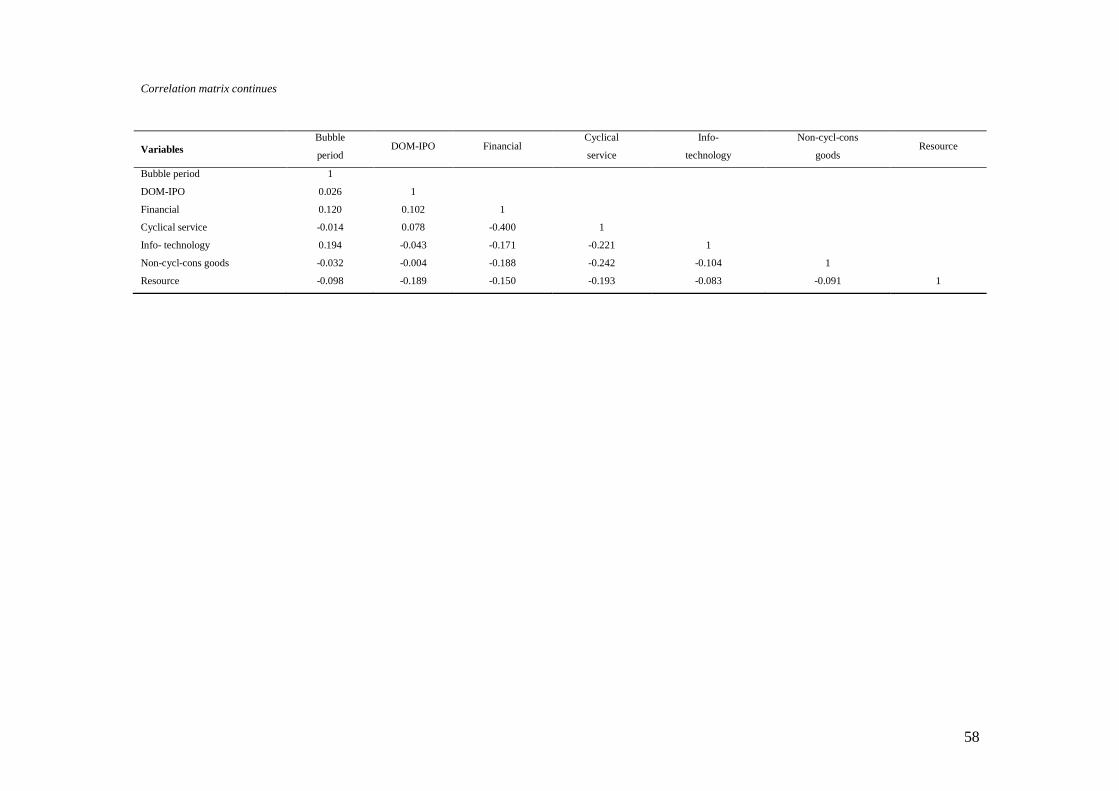
58
Correlation matrix continues
Variables Bubble
period DOM-IPO Financial
Cyclical
service
Info-
technology
Non-cycl-cons
goods Resource
Bubble period 1
DOM-IPO 0.026 1
Financial 0.120 0.102 1
Cyclical service -0.014 0.078 -0.400 1
Info- technology 0.194 -0.043 -0.171 -0.221 1
Non-cycl-cons goods -0.032 -0.004 -0.188 -0.242 -0.104 1
Resource -0.098 -0.189 -0.150 -0.193 -0.083 -0.091 1