Embed Size (px)
Citation preview
11
Harry [email protected]
Content
• Simulation Setup— Reference Network
— Traffic source: – TCP: real world traffic profile– UDP: for steady state
• Simulation — Performance metrics
— Result
• What’s Next
22
Harry [email protected]
Independent Control Messages on the Ring
• Message only lives within the bound of a ring— Infrequent
– On demand and soft state
• Scalable— OC-3 to OC-192 WAN rate
• Low overhead
• Easily Upgradeable— Support CoS
— Support unfairness
— Flexible
33
Harry [email protected]
Performance Metrics
• Single Ring Network Performance— Head of Line Delay: head of line delay at the queue output
— Access Delay: measured from packet accepted into the box
— Nodal Throughput: average throughput
— Link utilization: average ring utilization
— Fair performance: equal behavior for all participants
— Good Reaction time: ~1 ms response time
— Stable performance: small oscillation and convergence time time
— Scalable solution
• 10 us delay per link
44
Harry [email protected]
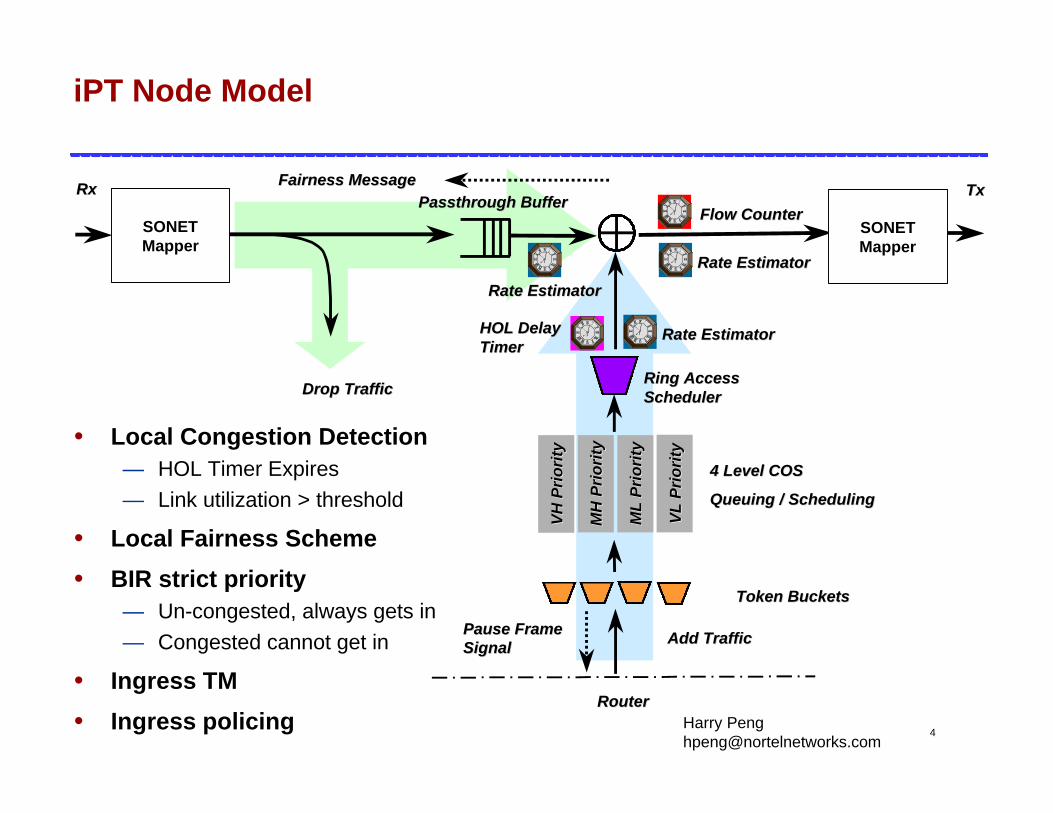
iPT Node Model
• Local Congestion Detection— HOL Timer Expires
— Link utilization > threshold
• Local Fairness Scheme
• BIR strict priority— Un-congested, always gets in
— Congested cannot get in
• Ingress TM
• Ingress policing
Drop TrafficDrop Traffic
TxTxRxRxPassthrough BufferPassthrough Buffer
Pause FramePause FrameSignalSignal
Ring Access Ring Access SchedulerScheduler
Token BucketsToken Buckets
4 Level COS4 Level COS
Queuing / SchedulingQueuing / Scheduling
Add TrafficAdd Traffic
HOL Delay HOL Delay TimerTimer
RouterRouter
VH
Pri
ori
tyV
H P
rio
rity
MH
MH
Pri
ori
tyP
rio
rity
ML
Pri
ori
tyM
L P
rio
rity
VL
VL
Pri
ori
tyP
rio
rity
Rate EstimatorRate Estimator
Rate EstimatorRate Estimator
Rate EstimatorRate Estimator
Flow CounterFlow CounterSONETMapper
SONETMapper
Fairness MessageFairness Message
55
Harry [email protected]
Nodal Components
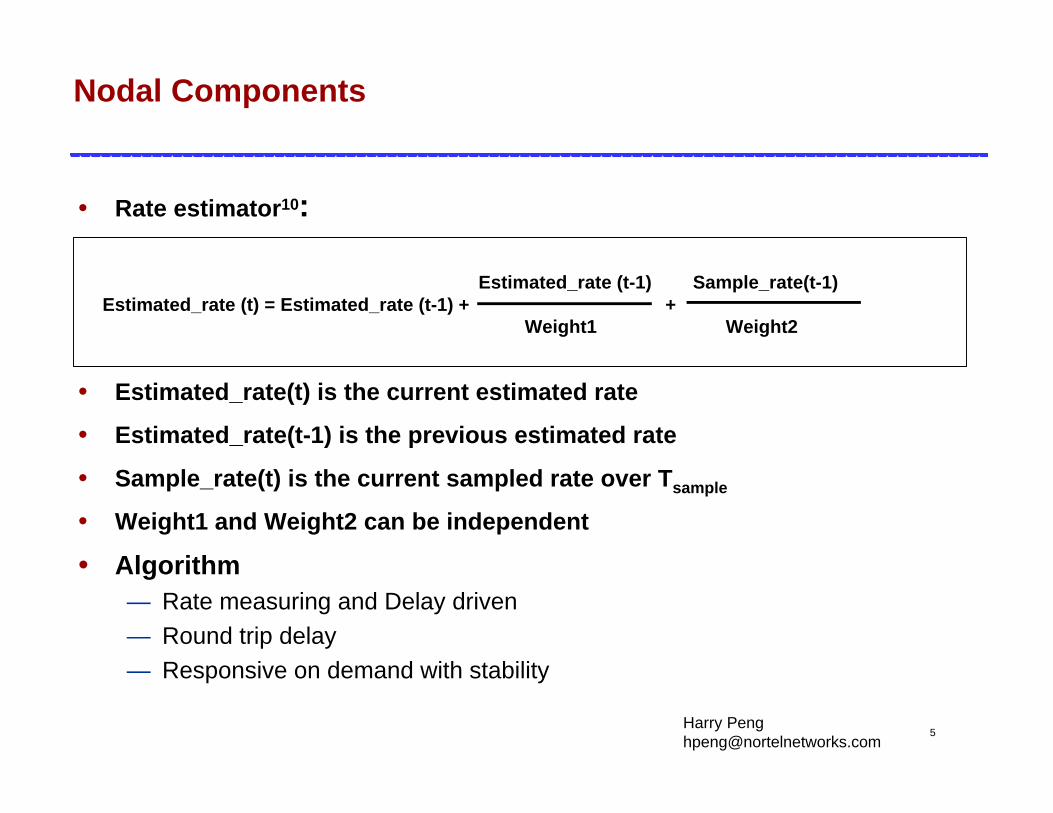
• Rate estimator10:
• Estimated_rate(t) is the current estimated rate
• Estimated_rate(t-1) is the previous estimated rate
• Sample_rate(t) is the current sampled rate over Tsample
• Weight1 and Weight2 can be independent
• Algorithm— Rate measuring and Delay driven— Round trip delay— Responsive on demand with stability
Estimated_rate (t-1) Sample_rate(t-1)Estimated_rate (t) = Estimated_rate (t-1) + +
Weight1 Weight2
66
Harry [email protected]
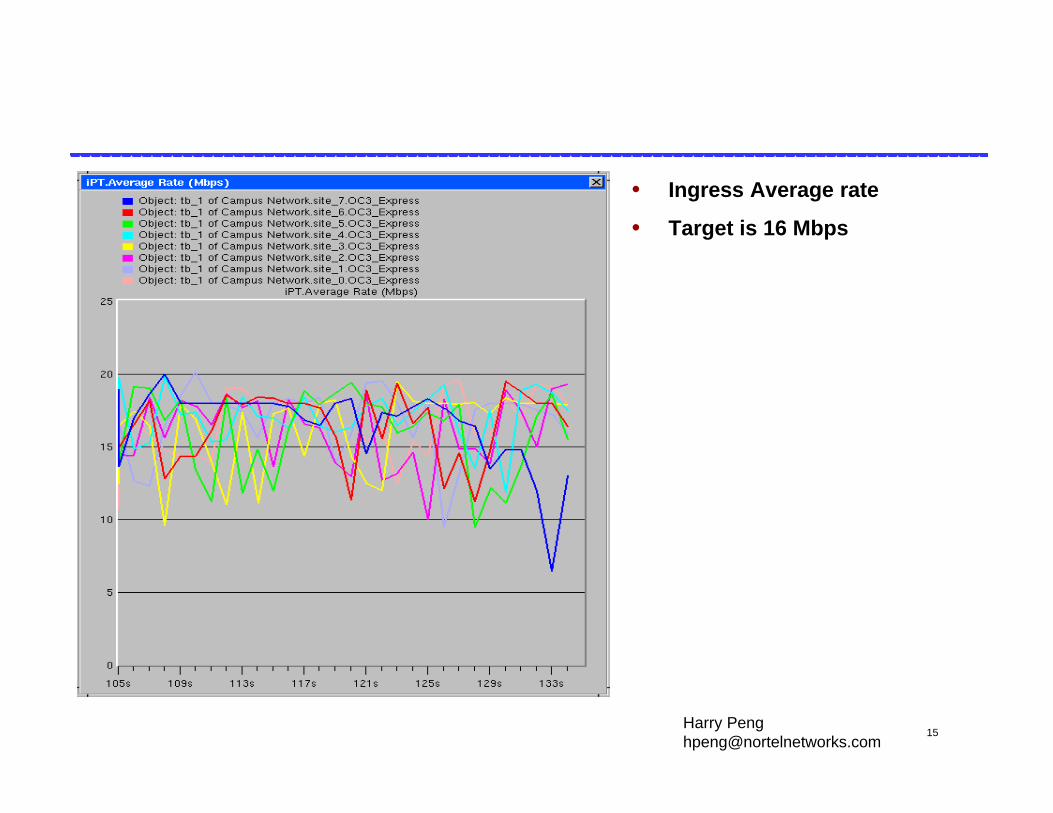
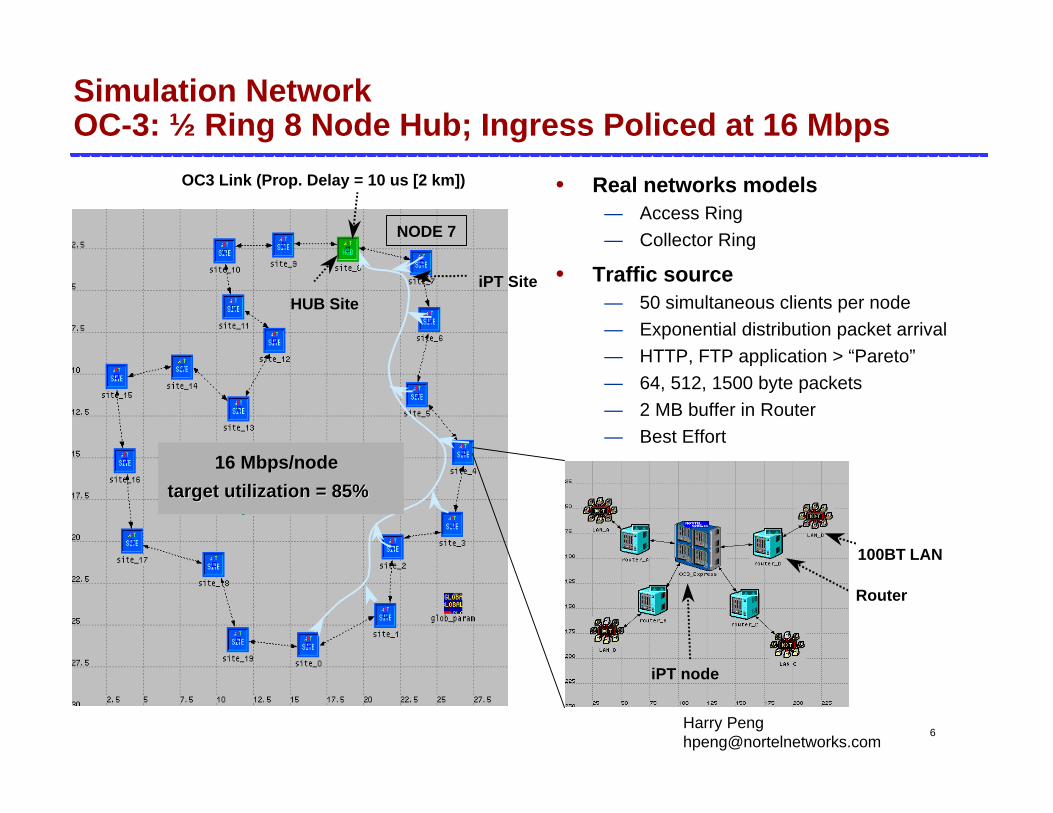
Simulation NetworkOC-3: ½ Ring 8 Node Hub; Ingress Policed at 16 Mbps
• Real networks models— Access Ring
— Collector Ring
• Traffic source— 50 simultaneous clients per node
— Exponential distribution packet arrival
— HTTP, FTP application > “Pareto”
— 64, 512, 1500 byte packets
— 2 MB buffer in Router
— Best Effort
iPT node
Router
100BT LAN
iPT Site
OC3 Link (Prop. Delay = 10 us [2 km])
HUB Site
target utilization = 85%target utilization = 85%
NODE 7
16 Mbps/node16 Mbps/node
77
Harry [email protected]
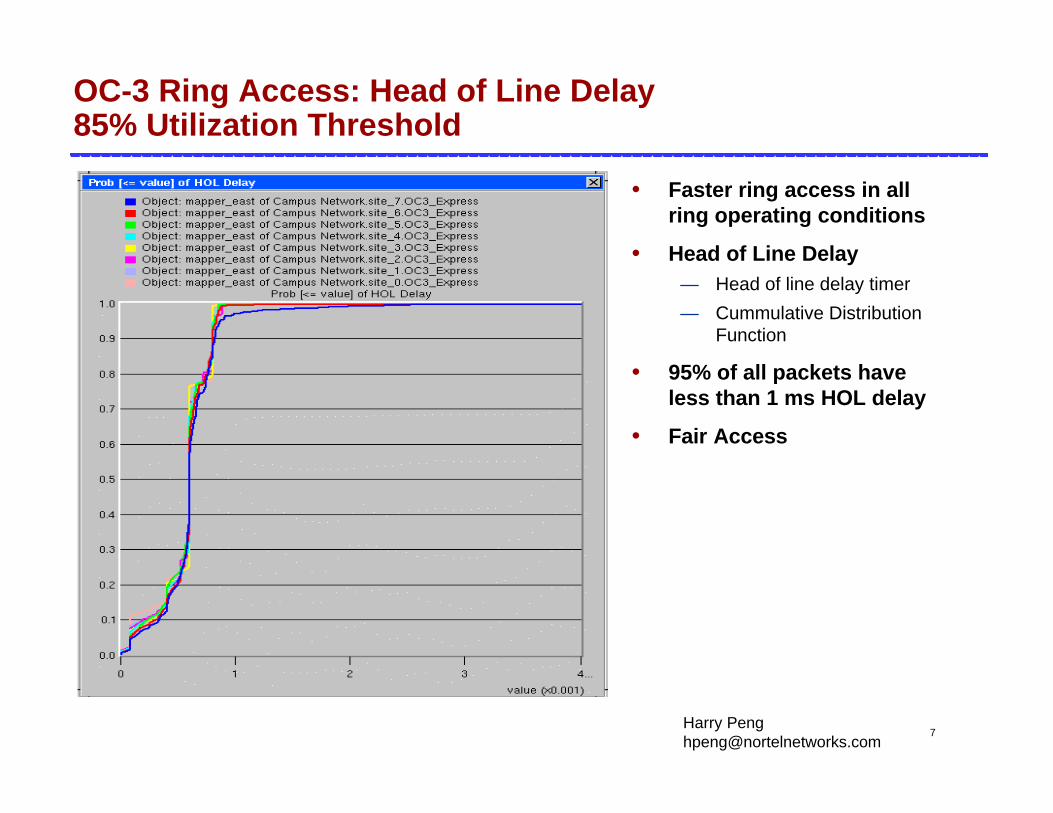
OC-3 Ring Access: Head of Line Delay85% Utilization Threshold
• Faster ring access in all ring operating conditions
• Head of Line Delay— Head of line delay timer
— Cummulative Distribution Function
• 95% of all packets have less than 1 ms HOL delay
• Fair Access
88
Harry [email protected]
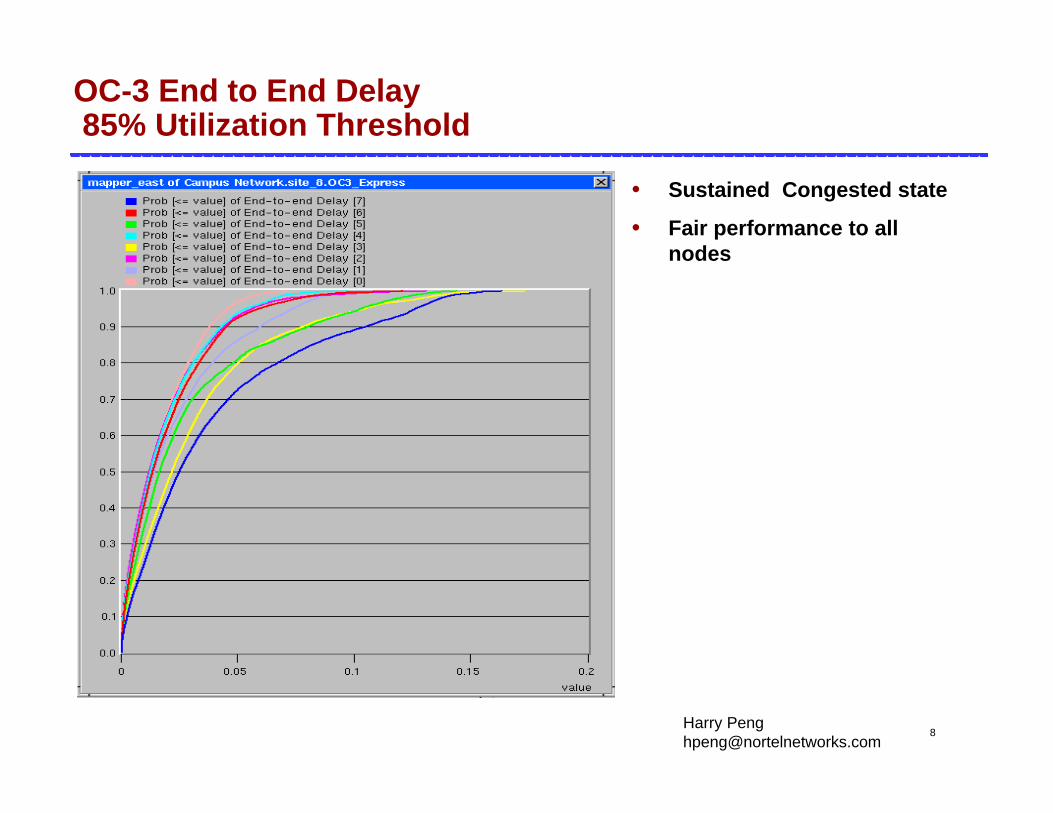
OC-3 End to End Delay85% Utilization Threshold
• Sustained Congested state
• Fair performance to all nodes
99
Harry [email protected]
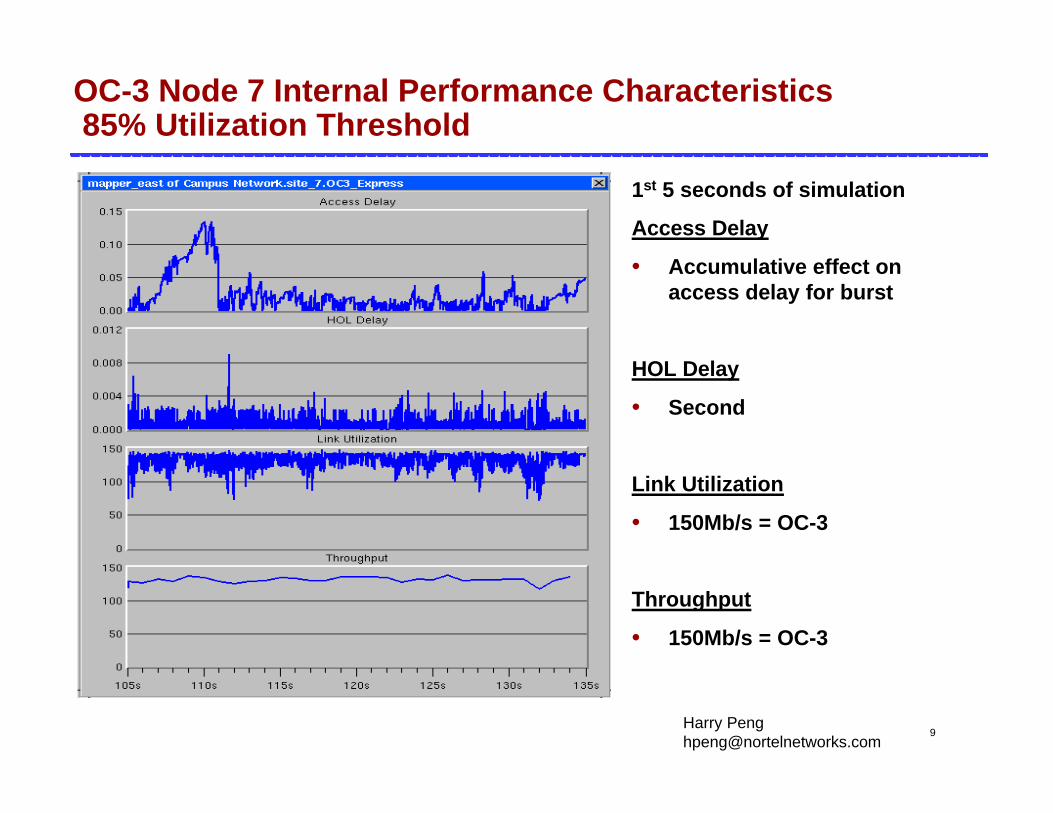
OC-3 Node 7 Internal Performance Characteristics85% Utilization Threshold
1st 5 seconds of simulation
Access Delay
• Accumulative effect on access delay for burst
HOL Delay
• Second
Link Utilization
• 150Mb/s = OC-3
Throughput
• 150Mb/s = OC-3
1010
Harry [email protected]
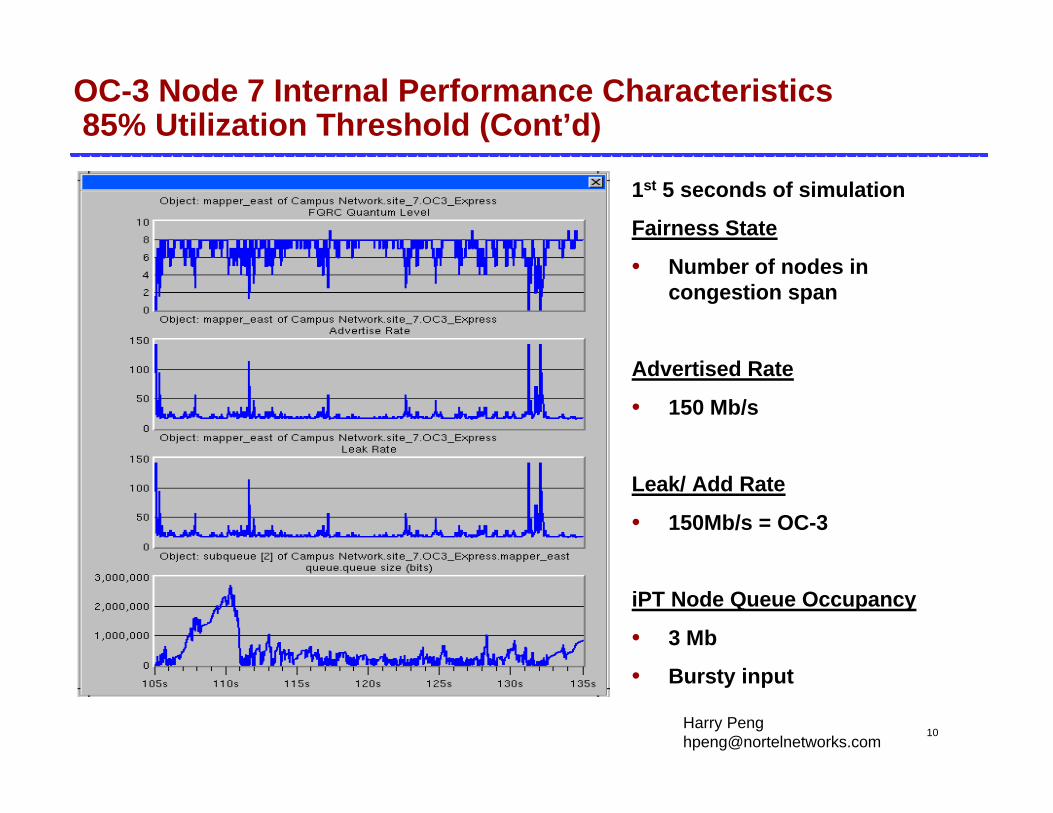
OC-3 Node 7 Internal Performance Characteristics85% Utilization Threshold (Cont’d)
1st 5 seconds of simulation
Fairness State
• Number of nodes in congestion span
Advertised Rate
• 150 Mb/s
Leak/ Add Rate
• 150Mb/s = OC-3
iPT Node Queue Occupancy
• 3 Mb
• Bursty input
1111
Harry [email protected]
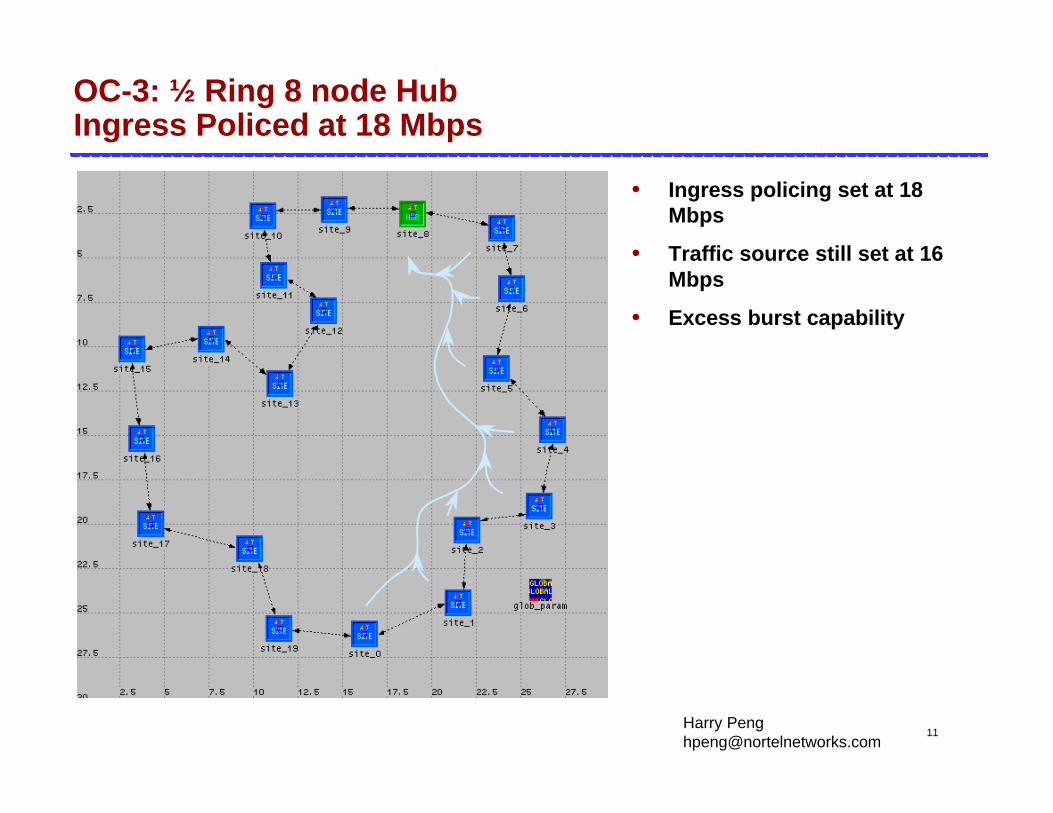
OC-3: ½ Ring 8 node HubIngress Policed at 18 Mbps
• Ingress policing set at 18 Mbps
• Traffic source still set at 16 Mbps
• Excess burst capability
1212
Harry [email protected]
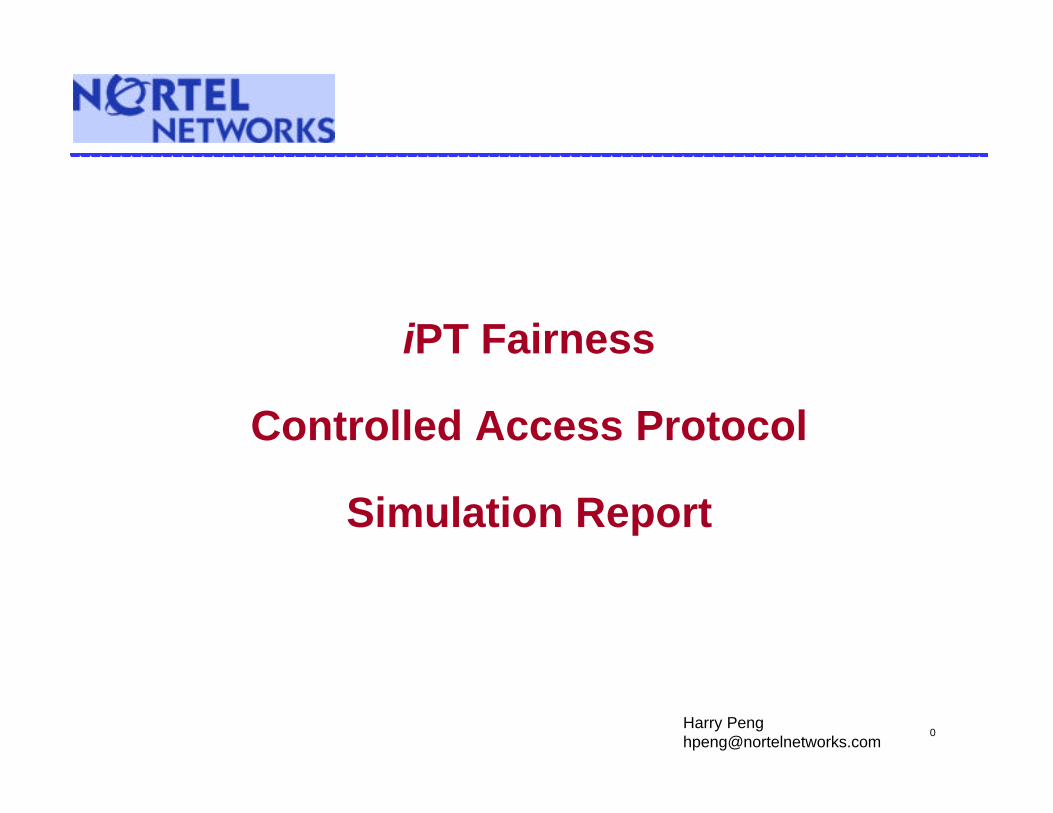
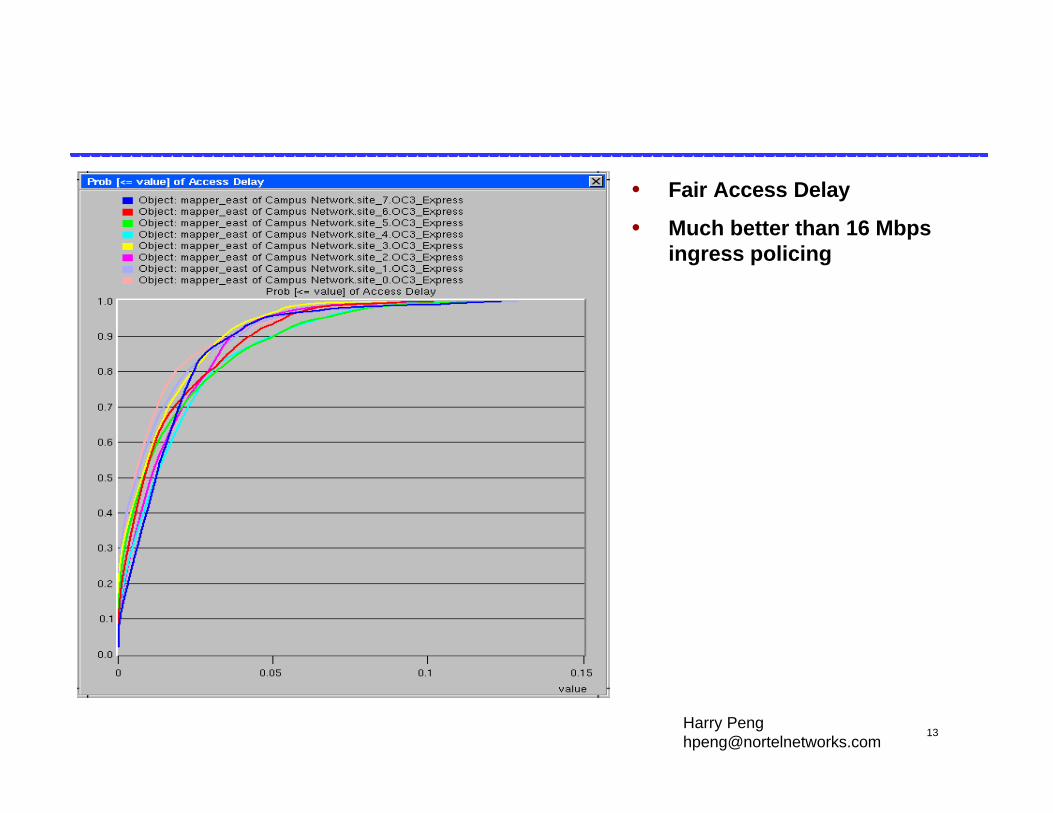
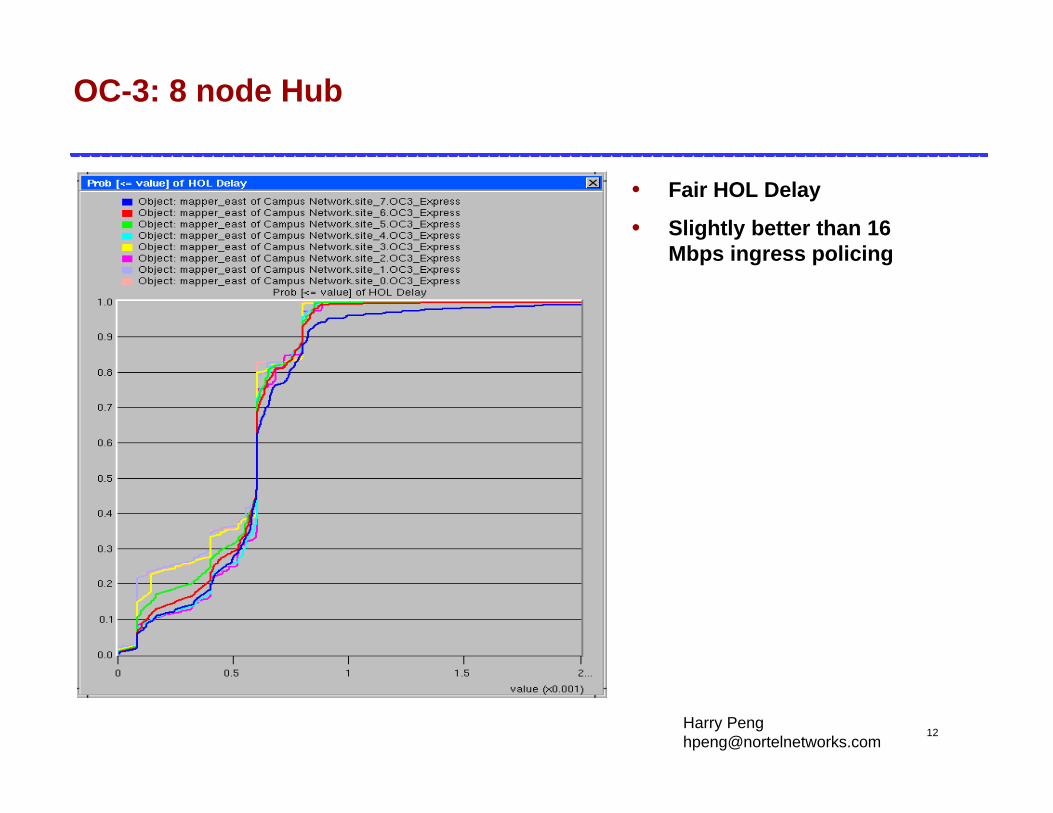
OC-3: 8 node Hub
• Fair HOL Delay
• Slightly better than 16 Mbps ingress policing
1616
Harry [email protected]
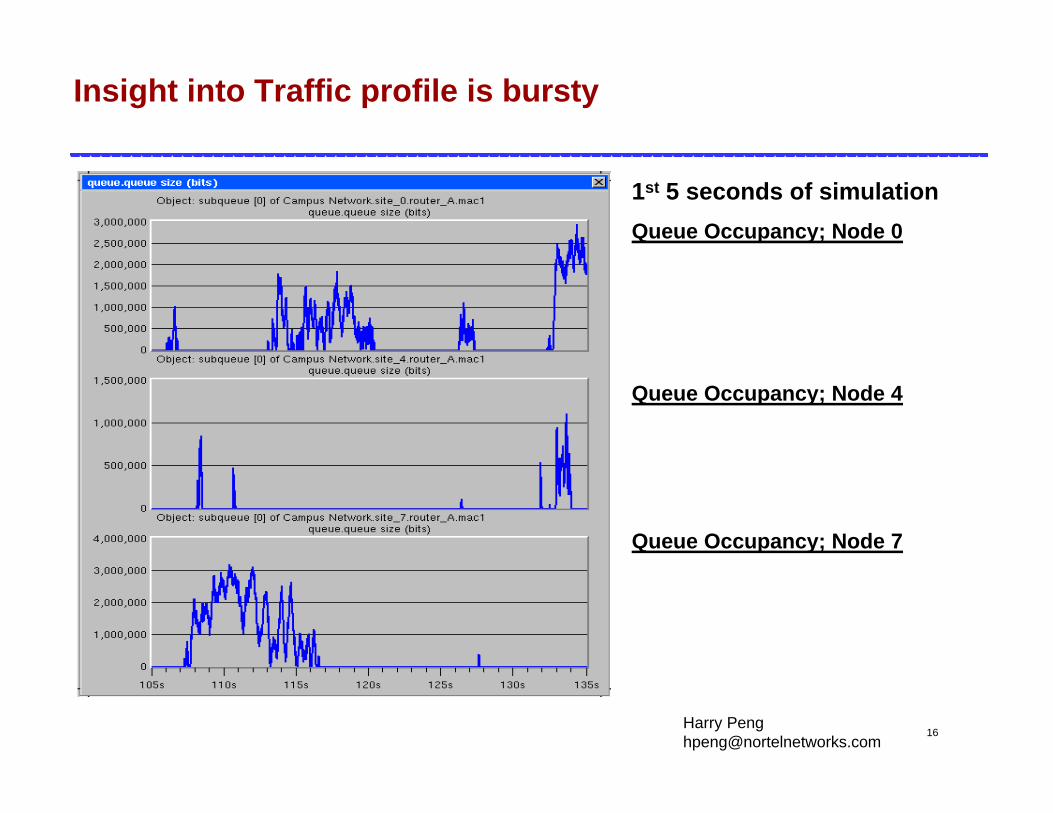
Insight into Traffic profile is bursty
1st 5 seconds of simulation
Queue Occupancy; Node 0
Queue Occupancy; Node 4
Queue Occupancy; Node 7
1717
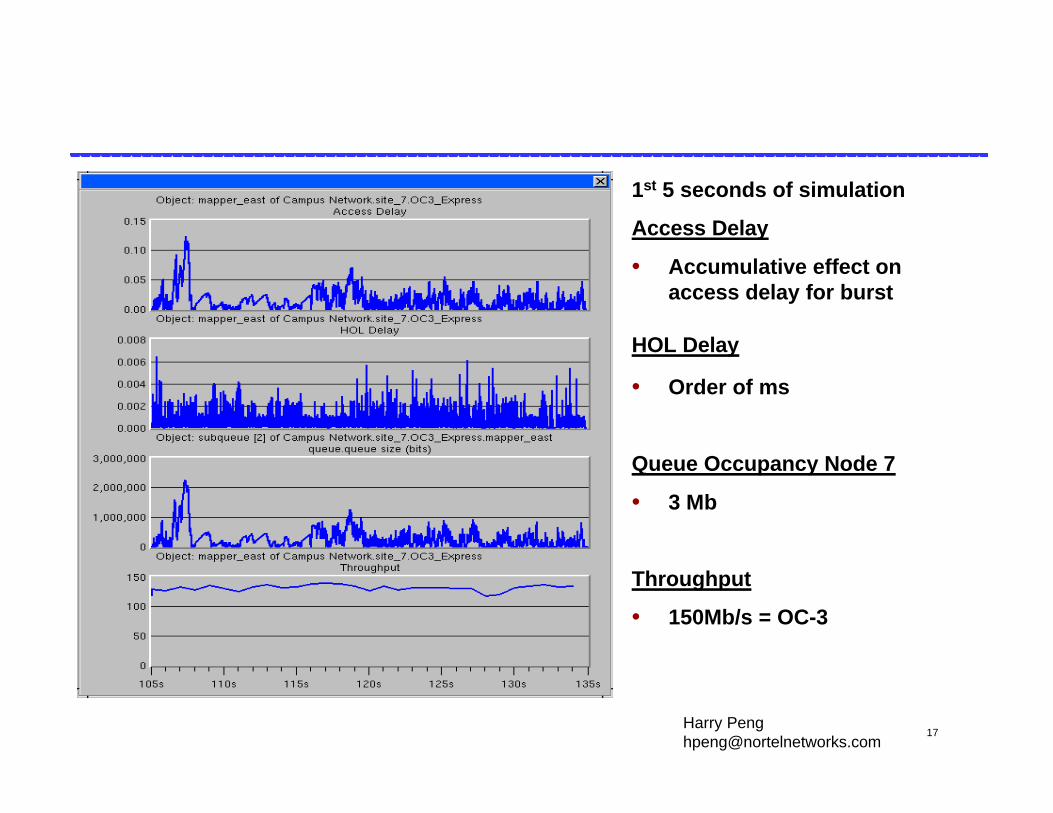
Harry [email protected]
1st 5 seconds of simulation
Access Delay
• Accumulative effect on access delay for burst
HOL Delay
• Order of ms
Queue Occupancy Node 7
• 3 Mb
Throughput
• 150Mb/s = OC-3
1818
Harry [email protected]
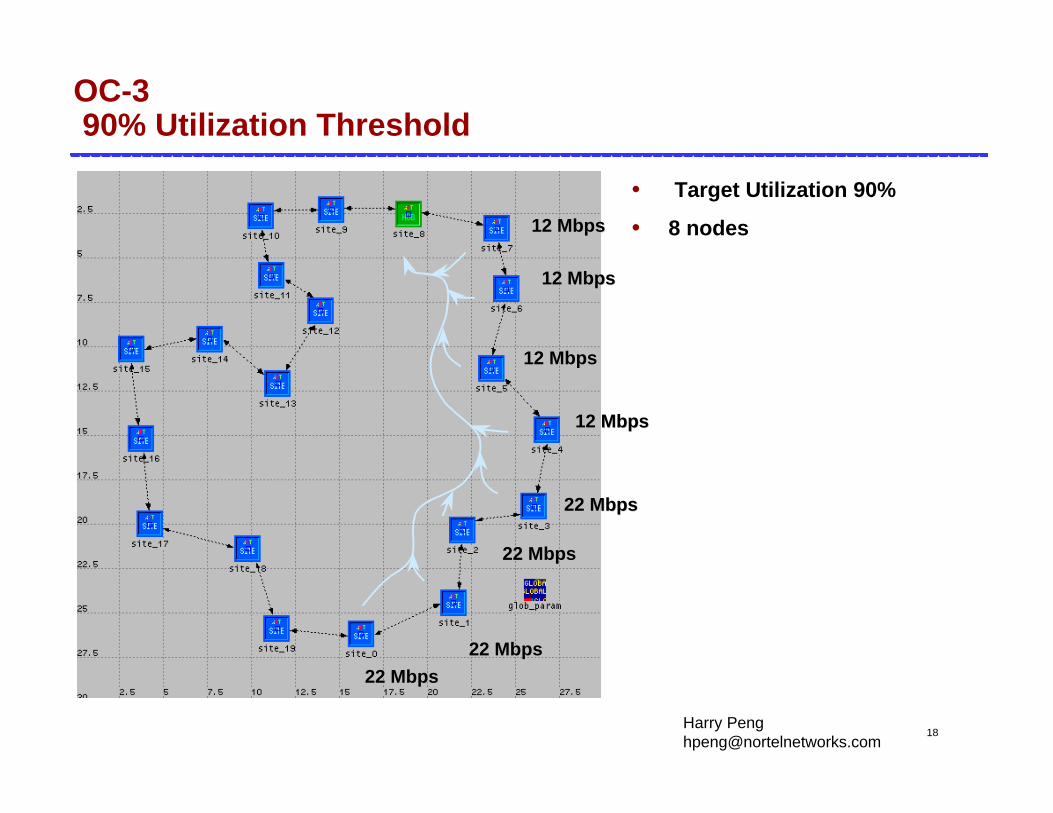
OC-3 90% Utilization Threshold
• Target Utilization 90%
• 8 nodes
22 Mbps22 Mbps
22 Mbps22 Mbps
22 Mbps22 Mbps
22 Mbps22 Mbps
12 Mbps12 Mbps
12 Mbps12 Mbps
12 Mbps12 Mbps
12 Mbps12 Mbps
1919
Harry [email protected]
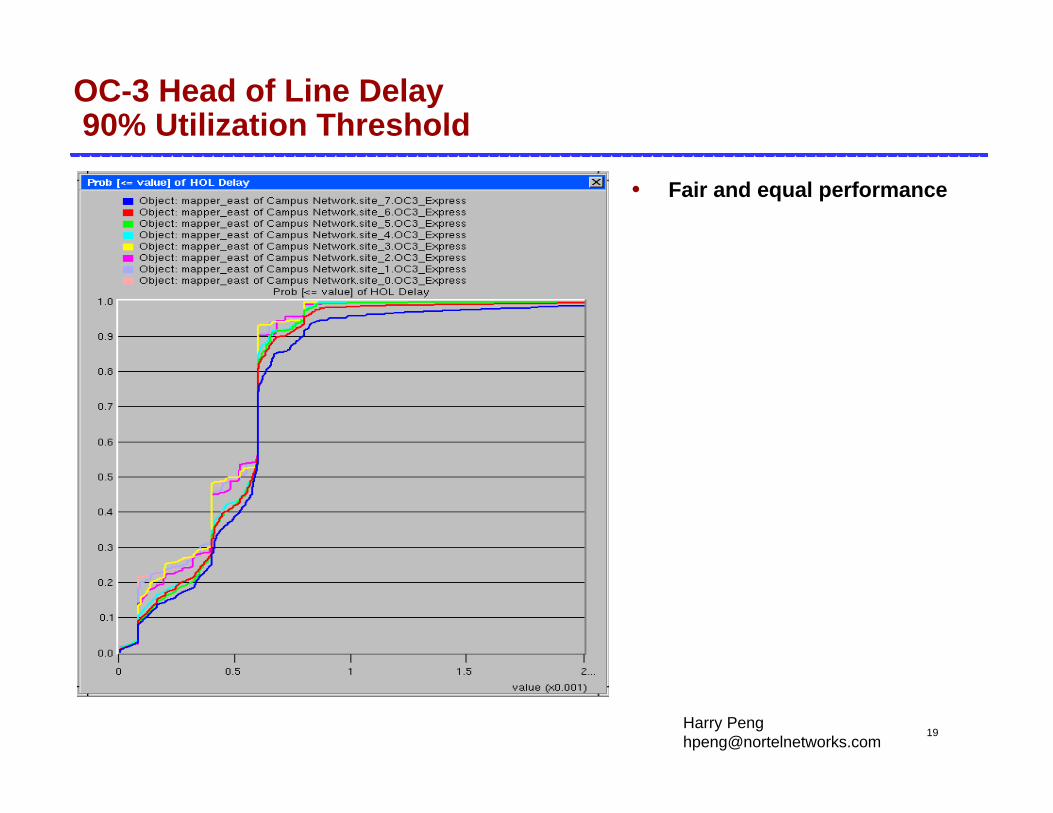
OC-3 Head of Line Delay90% Utilization Threshold
• Fair and equal performance
2020
Harry [email protected]
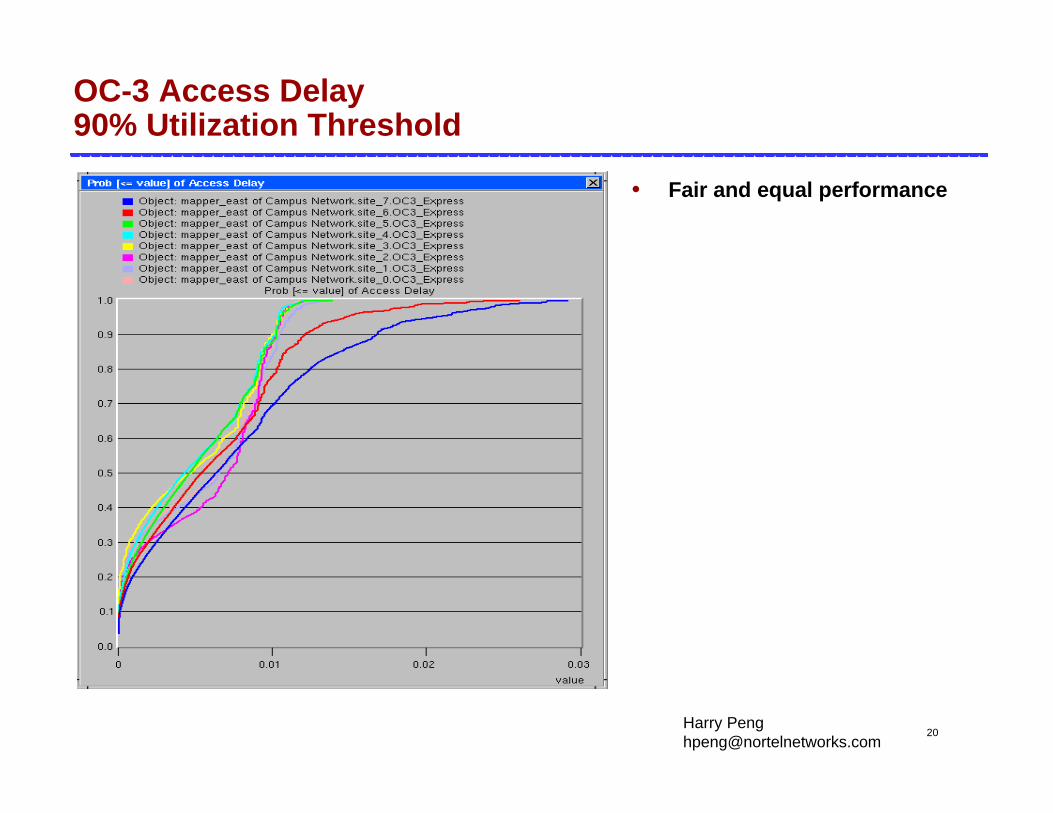
OC-3 Access Delay90% Utilization Threshold
• Fair and equal performance
2121
Harry [email protected]
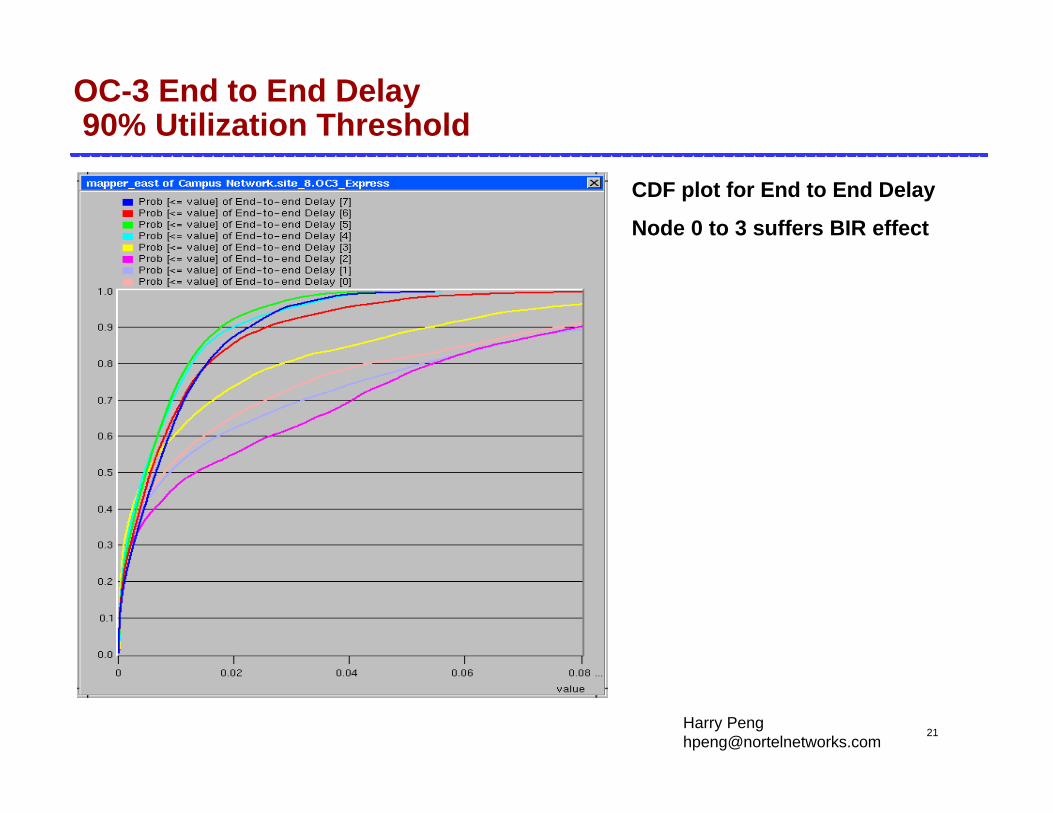
OC-3 End to End Delay90% Utilization Threshold
CDF plot for End to End Delay
Node 0 to 3 suffers BIR effect
2222
Harry [email protected]
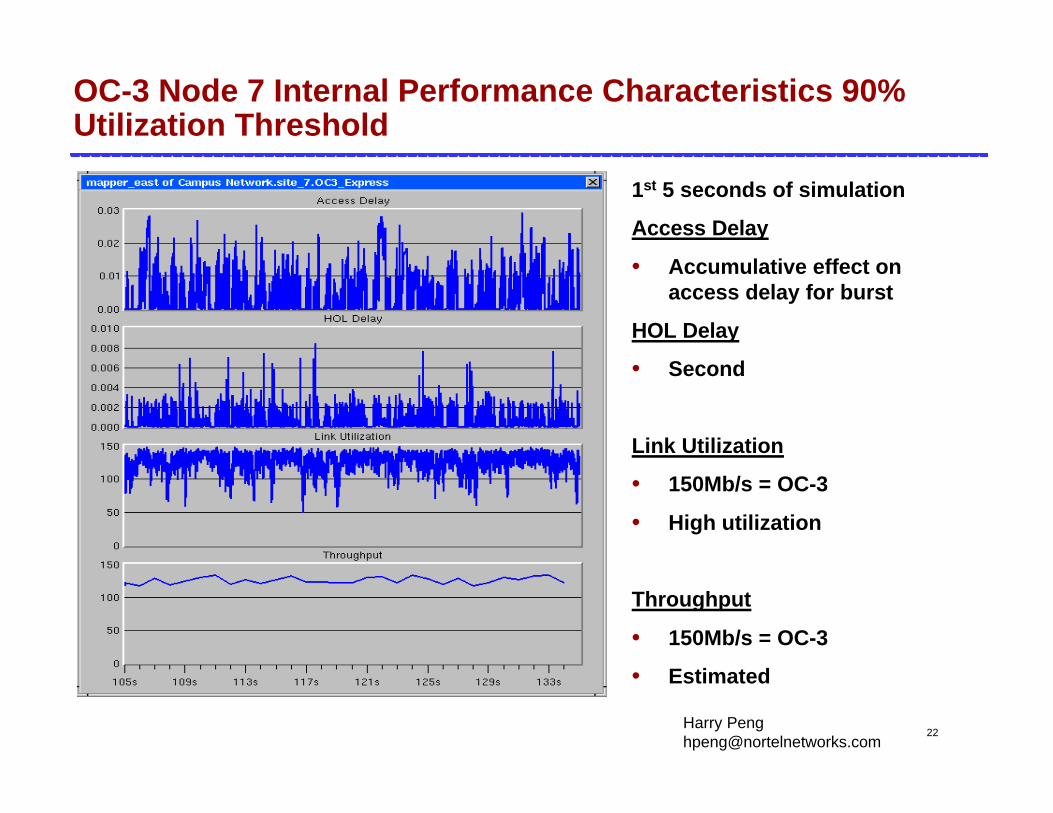
OC-3 Node 7 Internal Performance Characteristics 90% Utilization Threshold
1st 5 seconds of simulation
Access Delay
• Accumulative effect on access delay for burst
HOL Delay
• Second
Link Utilization
• 150Mb/s = OC-3
• High utilization
Throughput
• 150Mb/s = OC-3
• Estimated
2323
Harry [email protected]
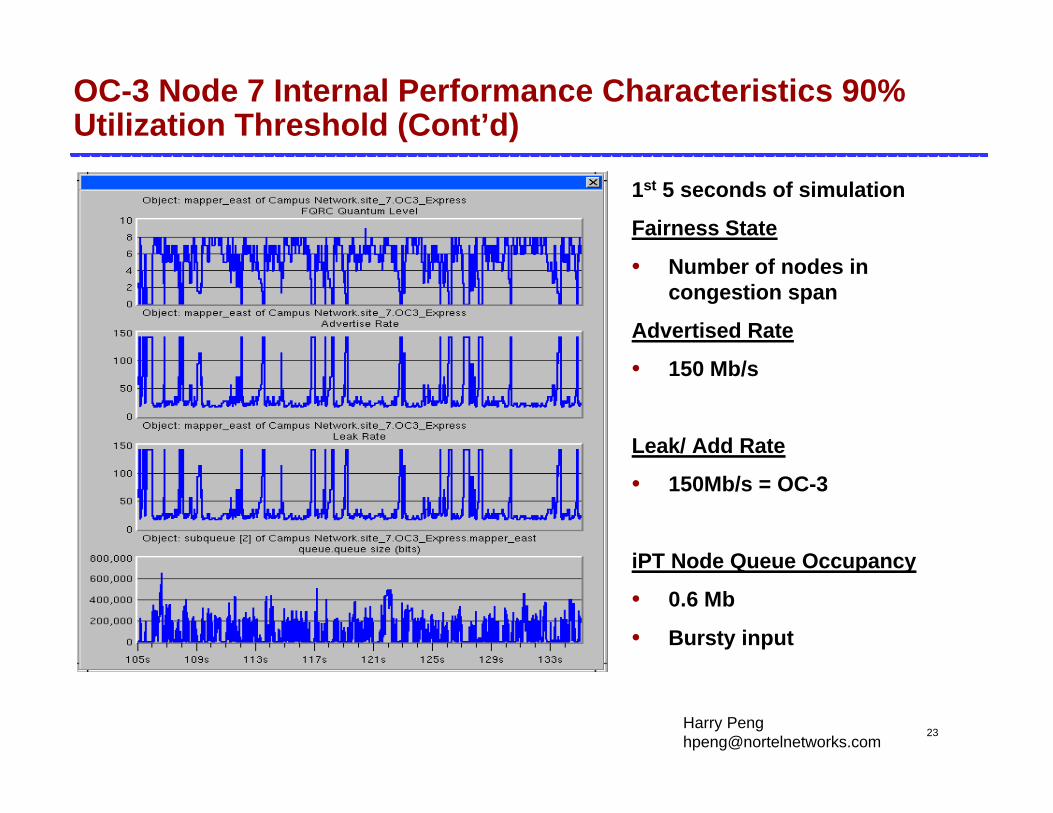
OC-3 Node 7 Internal Performance Characteristics 90% Utilization Threshold (Cont’d)
1st 5 seconds of simulation
Fairness State
• Number of nodes in congestion span
Advertised Rate
• 150 Mb/s
Leak/ Add Rate
• 150Mb/s = OC-3
iPT Node Queue Occupancy
• 0.6 Mb
• Bursty input
2424
Harry [email protected]
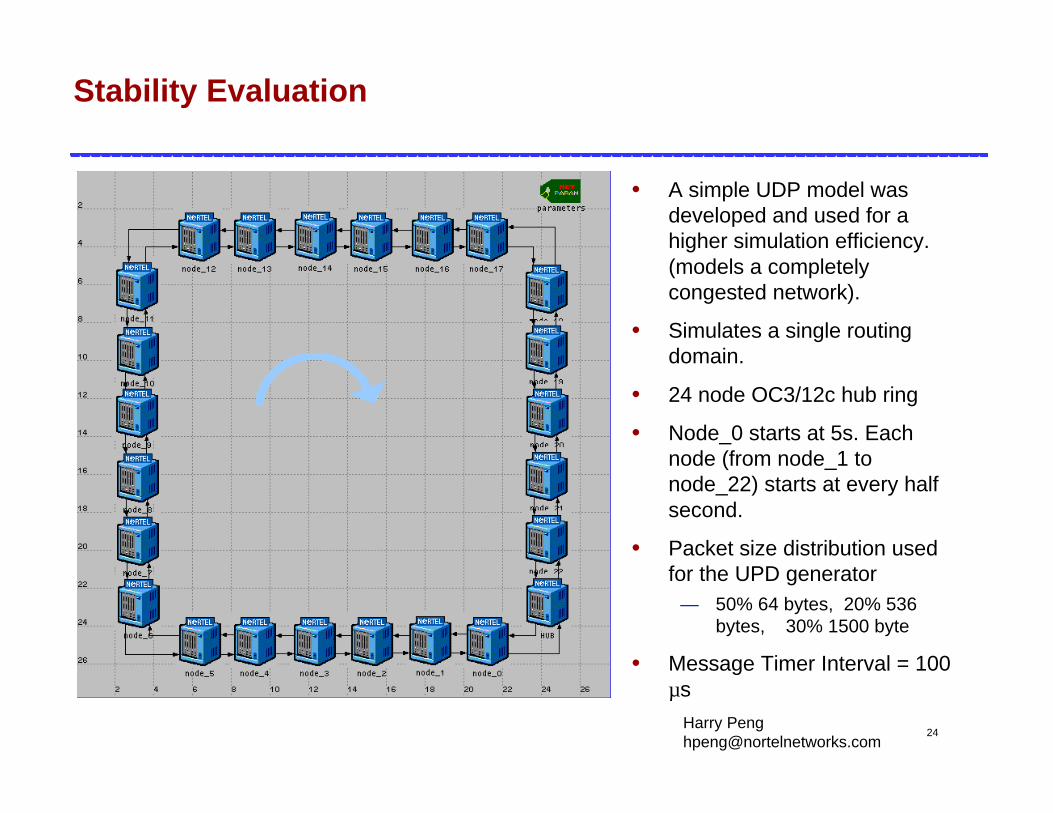
Stability Evaluation
• A simple UDP model was developed and used for a higher simulation efficiency. (models a completely congested network).
• Simulates a single routing domain.
• 24 node OC3/12c hub ring
• Node_0 starts at 5s. Each node (from node_1 to node_22) starts at every half second.
• Packet size distribution used for the UPD generator
— 50% 64 bytes, 20% 536 bytes, 30% 1500 byte
• Message Timer Interval = 100 µs
2525
Harry [email protected]
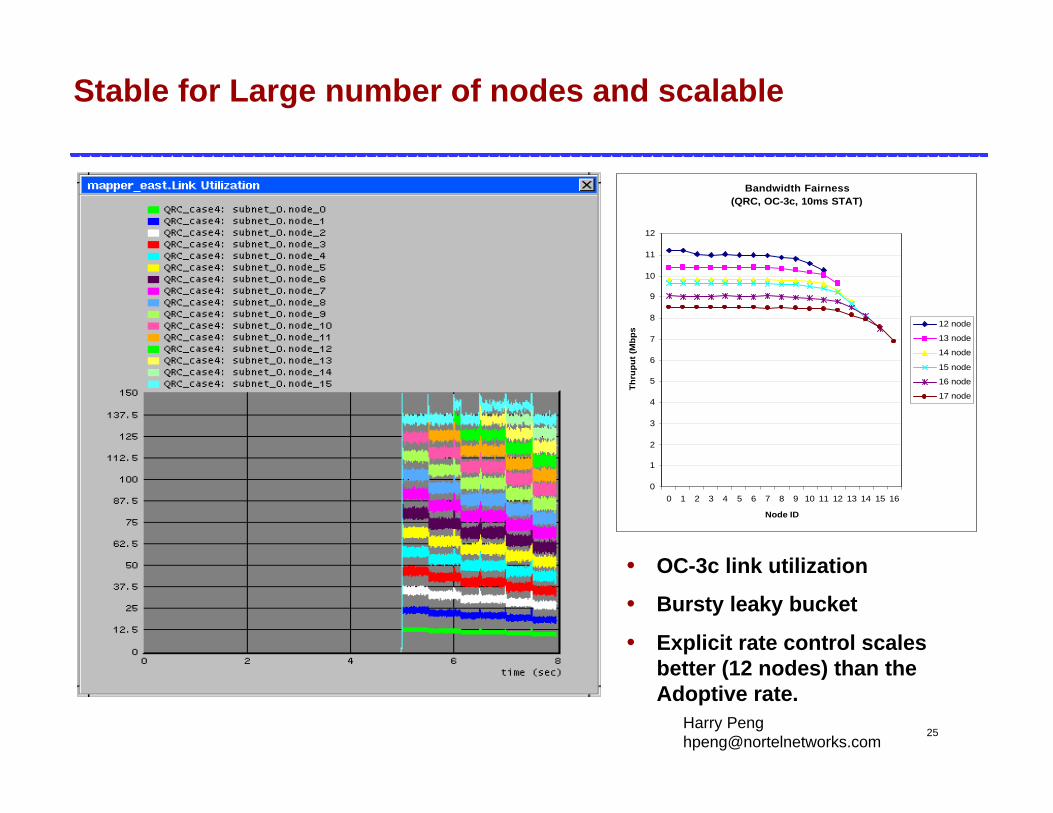
Stable for Large number of nodes and scalable
• OC-3c link utilization
• Bursty leaky bucket
• Explicit rate control scales better (12 nodes) than the Adoptive rate.
Bandwidth Fairness(QRC, OC-3c, 10ms STAT)
0
1
2
3
4
5
6
7
8
9
10
11
12
0 1 2 3 4 5 6 7 8 9 10 11 12 13 14 15 16
Node ID
Th
rup
ut
(Mb
ps
) 12 node
13 node
14 node
15 node
16 node
17 node
2626
Harry [email protected]
Summary
• Performance effected by1. Buffer Insertion Ring Effect.
– Head node slightly worse performance
2. Bursty traffic pattern.– Heavy Tail Effect.
• Trade-off between stability, responsiveness, delay— HOL timer
— Rate estimator
• Scalable with WAN BW, using explicit rate advertising — Better performance with fewer number of nodes
• Achieve Fairness on real network topology.
2727
Harry [email protected]
What’s Next
• Higher BW simulation— OC-48
— OC-192
• QoS support— 4 ingress priorities
— iPT CoS Fairness messages
• Meshed traffic flow
2828
Harry [email protected]
References
1. Harry Peng, “iPT Fairness Design Specification”, v0.1, July 1999.
2. Yang Lee, “Evaluation of Fairness Algorithms”, v1.1, June 1999.3. M. Mathis, Sally Floyd, “TCP Selective Acknowledgement Options”, RFC 2018, October 1996.
4. B. Raahemi, L. Khan, P. Cottreau, “A Novel Algorithm For Local Fairness On Dual Ring LAN/WANsUsing Adaptive Rate Control”, Version 3.0, December 1998.
5. I. Cidon, Y. Ofek, “MetaRing A full duplex ring with fairness and spatial reuse”, IEEE Transactions on Communications, Vol.41, No.1, January 1993, pp.110-120.
6. T. Saito, H. Aida, T. Aoki, Y. Kishi, and P. Setthawong, “ QOS Guarantees for high-speed variable-length packet LANs”, www.sail.t.u-tokyo.ac.jp/pisai/research
7. J.S.C.Chen, I. Cidon, and Y. Ofek, “A local fairness algorithm for Gigabit LANs/MANs with spatial reuse”, IEEE Journal on Selected Areas in Communications, Vol.11, No.8, October 1993, pp. 1183-1192.
8. “Dynamic Packet Transport Technology and Applications Overview” ,White Paper, February 1999.
9. “Dynamic Packet Transport (DPT) Technology and Products, February 1999.
10. “On Estimating End-to-end Network Path Properties”, Mark Allman and Vern Paxson, ACM;SIGCOMM 1999.