Embed Size (px)
Citation preview

At SSGA, we think systematic, rules-based approaches can get you much of the way toward return goals. But not all the way. In this active-manager punch list for the passive-plus era, we help you identify truly idiosyncratic forms of alpha worth paying extra for, where we believe to look for it, and when the added effort is likely to prove most fruitful.
WHERE & WHEN TO GO
Marcus Schulmerich, Ph.D., CFA, FRMVice President and Global Portfolio Strategist Active Quantitative Equities
Vladimir Zdorovtsov, Ph.D.Managing Director, Director of ResearchActive Quantitative Equities
Brett Collins, CFAChief Operating OfficerInvestment Solutions Group
ACTIVE
IQ Q3 2015 Excerpt

2 State Street Global Advisors | IQ Q3 2015 Excerpt
What is true skill in active management? Holistically speaking, it’s an ability to deliver improved risk-adjusted investment outcomes through proprietary insight. Some in the investment management industry still cling to old definitions of active skill (i.e., beating cap-weighted benchmarks).1 But new definitions may not suffice either. Increasingly, we observe that what may at first seem like genuine alpha is actually the result of tilts toward commoditized factor premia, coupled with basic off-the-shelf portfolio
construction tools. We ask, does this really amount to skill, worthy of active fees? And if not, where are we most likely to find true proprietary skill and how and when can this skill best be used?
As the scope of smart beta solutions expands, the bar continues to rise for active management, thinning the herd and shining a brighter spotlight on those who genuinely deserve to be considered “active.”2 The response of State Street Global Advisors’ Active Quantitative Equities team to this trend has been: Bring it on! We are ready for this
challenge and have been proactively undertaking analyses documenting our true skill, its origins and its evolution — while continuing to pedal ahead to ensure it doesn’t erode. In our view, active management has a favored place in many markets, regardless of the economic cycle, and, given persistent behavioral biases and market frictions, we believe there are opportunities for astute investors to generate alpha. Indeed, with growing interest in active quantitative equity management,3 investors clearly still see an important role for active investing.
ACTIVE*Hint: Now could be an opportune time.
*

Back to Basics for Active: Is There a Truly Prescient Manager?
In thinking about where proprietary value can emanate from, we go back to basics and look at stock forecasting. One of the ways to tackle how active managers can add value is through the Fundamental Law of Active Management. In this law, active managers’ performance is a function of three basic drivers: the precision of their forecasts, the number of independent forecasts they can tap into, and the degree to which they can incorporate these forecasts into their portfolios.4
In other words, and in our experience, it helps to have more accurate forecasts, a larger quantity of active forecasts and a smaller number of impediments preventing those forecasts from informing your bets. A good active manager can add value on each of these dimensions. Practically speaking, this means determining the proper return drivers and then applying them in new and different ways, including:
• Embedding proprietary refinements into existing, well-known return drivers (e.g., a smarter version of the basic momentum factor that better captures the underlying under-reaction mechanism5 );
• Discovering new factors that have not been included in smart beta products or are not otherwise in the public domain. This could include predicting earnings of retail outlets by monitoring foot traffic in retail stocks (partly driven by the “big data” movement 6);
• Identifying better ways of blending the above and other elements (e.g., finding insights into how they may interact with each other and condition each other’s behavior);
• Varying exposures to all of these return drivers over time, recognizing that their efficacy will ebb and flow in ways that can often be amenable to forecasting (e.g., adapting portfolio positioning to risk-on/risk-off market swings or macroeconomic conditions);
• Making improvements to risk modeling and portfolio construction. This could include building proprietary risk models, dynamic portfolio construction settings or proprietary transaction-cost models.
As the domain of “skill” expands to new return factors, areas previously considered unpredictable shrink, and the application of skill to the portfolio increases. Intuitively, what were once risks to the portfolio that needed to be constrained are now areas that can be forecast and potentially captured as additional sources of alpha. In other words, skill, the quantity of forecasts, and the transferability of those forecasts improve, boding well for active performance.
If at some level even Warren Buffett is just an extraordinarily effective factor investor, what hope is there for the rest of us?
This is true proprietary skill-based active management. Such processes can ensure that the performance of the portfolio is driven by forces on which active managers can apply their skills, while mitigating the effects of those forces outside of managers’ control. The litmus test then is whether the performance achieved by these processes is greater than what can be captured with a bundle of commoditized building blocks available at a fraction of the cost.
The Building Blocks of Active Management Returns
How many active managers pass this litmus test? It’s a valid question. In 2012, Frazzini et al7 analyzed Berkshire Hathaway’s high and consistent alpha. Remarkably, they found that once they controlled for “betting-against-beta”8 and “quality-minus-junk”9 factors, the alpha became insignificant.10 Or, in the words of Swedroe et al, “It is Warren Buffett’s strategy, or exposure to factors, that explains his success, not his stock-picking skills.”11 Swedroe does acknowledge that choosing the right factors is, in itself, a measure of investing skill. Still, if at some level even Warren Buffett is just an extremely effective factor investor, what hope is there for the rest of us?
Below we take a scientific look at an actively managed portfolio to show how one can start to tease out whether a manager’s returns are really emanating from skills that cannot be captured by smart application of simple, passive well-known factor-based investing.
We analyzed the returns of an SSGA active strategy, SSGA Active Quantitative Equity (AQE) Global Managed Volatility Alpha, to break out what can and cannot be captured by a collection of smart beta vehicles. The strategy is marketed globally.
We regressed SSGA AQE Global Managed Volatility Alpha gross returns on some of the most common return drivers: value, momentum, size, volatility and quality.
Recall that in linear regression analysis, the calculations result in a “best fit” line among data points. In a simple algebraic line, the intercept shows the value of the line on the y-axis, when the x value is 0. Similarly, in our regression analysis, the “intercept” shows how our portfolio would perform when returns from the
3 State Street Global Advisors | IQ Q3 2015 Excerpt
Where and When to Go Active
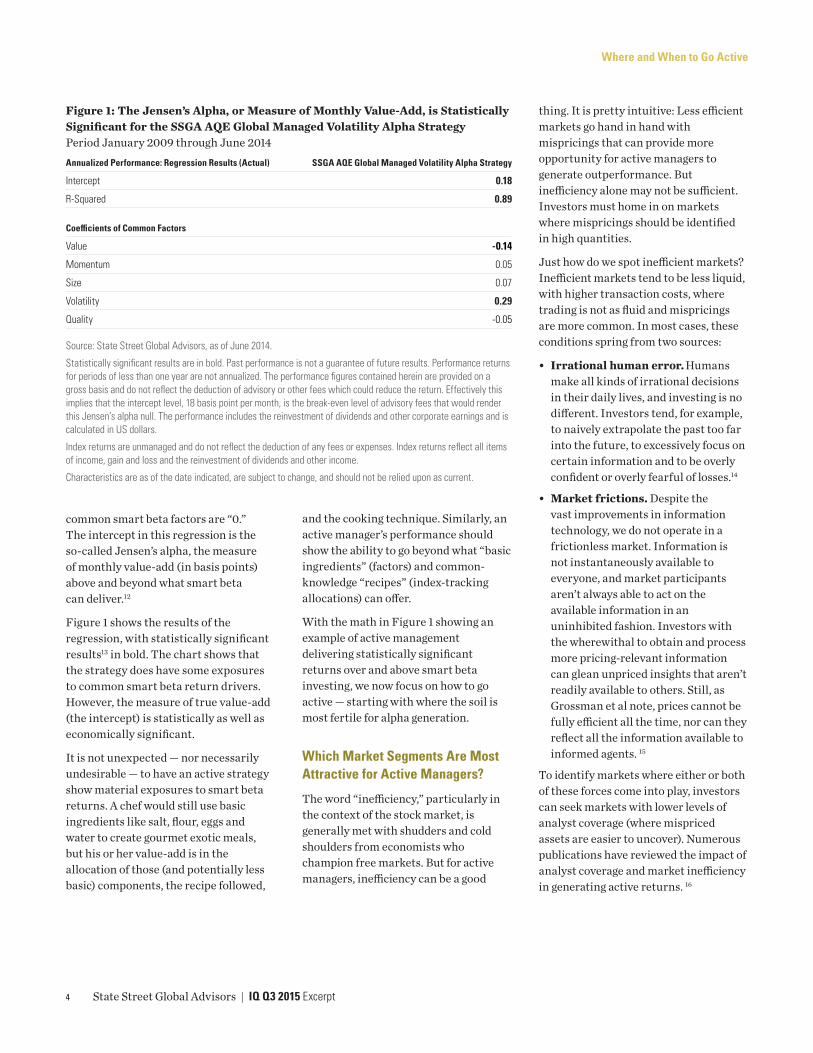
common smart beta factors are “0.” The intercept in this regression is the so-called Jensen’s alpha, the measure of monthly value-add (in basis points) above and beyond what smart beta can deliver.12
Figure 1 shows the results of the regression, with statistically significant results13 in bold. The chart shows that the strategy does have some exposures to common smart beta return drivers. However, the measure of true value-add (the intercept) is statistically as well as economically significant.
It is not unexpected — nor necessarily undesirable — to have an active strategy show material exposures to smart beta returns. A chef would still use basic ingredients like salt, flour, eggs and water to create gourmet exotic meals, but his or her value-add is in the allocation of those (and potentially less basic) components, the recipe followed,
and the cooking technique. Similarly, an active manager’s performance should show the ability to go beyond what “basic ingredients” (factors) and common-knowledge “recipes” (index-tracking allocations) can offer.
With the math in Figure 1 showing an example of active management delivering statistically significant returns over and above smart beta investing, we now focus on how to go active — starting with where the soil is most fertile for alpha generation.
Which Market Segments Are Most Attractive for Active Managers?
The word “inefficiency,” particularly in the context of the stock market, is generally met with shudders and cold shoulders from economists who champion free markets. But for active managers, inefficiency can be a good
thing. It is pretty intuitive: Less efficient markets go hand in hand with mispricings that can provide more opportunity for active managers to generate outperformance. But inefficiency alone may not be sufficient. Investors must home in on markets where mispricings should be identified in high quantities.
Just how do we spot inefficient markets? Inefficient markets tend to be less liquid, with higher transaction costs, where trading is not as fluid and mispricings are more common. In most cases, these conditions spring from two sources:
• Irrational human error. Humans make all kinds of irrational decisions in their daily lives, and investing is no different. Investors tend, for example, to naively extrapolate the past too far into the future, to excessively focus on certain information and to be overly confident or overly fearful of losses.14
• Market frictions. Despite the vast improvements in information technology, we do not operate in a frictionless market. Information is not instantaneously available to everyone, and market participants aren’t always able to act on the available information in an uninhibited fashion. Investors with the wherewithal to obtain and process more pricing-relevant information can glean unpriced insights that aren’t readily available to others. Still, as Grossman et al note, prices cannot be fully efficient all the time, nor can they reflect all the information available to informed agents. 15
To identify markets where either or both of these forces come into play, investors can seek markets with lower levels of analyst coverage (where mispriced assets are easier to uncover). Numerous publications have reviewed the impact of analyst coverage and market inefficiency in generating active returns. 16
Figure 1: The Jensen’s Alpha, or Measure of Monthly Value-Add, is Statistically Significant for the SSGA AQE Global Managed Volatility Alpha StrategyPeriod January 2009 through June 2014Annualized Performance: Regression Results (Actual) SSGA AQE Global Managed Volatility Alpha Strategy
Intercept 0.18
R-Squared 0.89
Coefficients of Common Factors
Value -0.14
Momentum 0.05
Size 0.07
Volatility 0.29
Quality -0.05
Source: State Street Global Advisors, as of June 2014.
Statistically significant results are in bold. Past performance is not a guarantee of future results. Performance returns for periods of less than one year are not annualized. The performance figures contained herein are provided on a gross basis and do not reflect the deduction of advisory or other fees which could reduce the return. Effectively this implies that the intercept level, 18 basis point per month, is the break-even level of advisory fees that would render this Jensen’s alpha null. The performance includes the reinvestment of dividends and other corporate earnings and is calculated in US dollars.
Index returns are unmanaged and do not reflect the deduction of any fees or expenses. Index returns reflect all items of income, gain and loss and the reinvestment of dividends and other income.
Characteristics are as of the date indicated, are subject to change, and should not be relied upon as current.
4 State Street Global Advisors | IQ Q3 2015 Excerpt
Where and When to Go Active
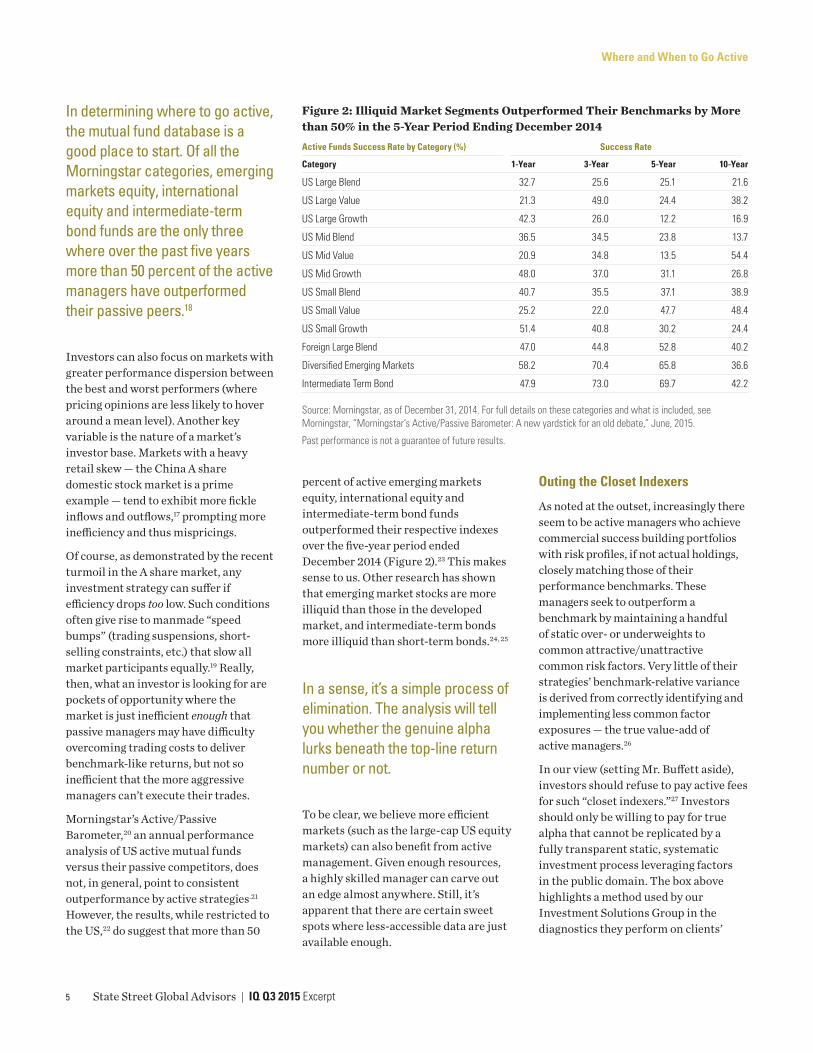
In determining where to go active, the mutual fund database is a good place to start. Of all the Morningstar categories, emerging markets equity, international equity and intermediate-term bond funds are the only three where over the past five years more than 50 percent of the active managers have outperformed their passive peers.18
Investors can also focus on markets with greater performance dispersion between the best and worst performers (where pricing opinions are less likely to hover around a mean level). Another key variable is the nature of a market’s investor base. Markets with a heavy retail skew — the China A share domestic stock market is a prime example — tend to exhibit more fickle inflows and outflows,17 prompting more inefficiency and thus mispricings.
Of course, as demonstrated by the recent turmoil in the A share market, any investment strategy can suffer if efficiency drops too low. Such conditions often give rise to manmade “speed bumps” (trading suspensions, short-selling constraints, etc.) that slow all market participants equally.19 Really, then, what an investor is looking for are pockets of opportunity where the market is just inefficient enough that passive managers may have difficulty overcoming trading costs to deliver benchmark-like returns, but not so inefficient that the more aggressive managers can’t execute their trades.
Morningstar’s Active/Passive Barometer,20 an annual performance analysis of US active mutual funds versus their passive competitors, does not, in general, point to consistent outperformance by active strategies.21 However, the results, while restricted to the US,22 do suggest that more than 50
percent of active emerging markets equity, international equity and intermediate-term bond funds outperformed their respective indexes over the five-year period ended December 2014 (Figure 2).23 This makes sense to us. Other research has shown that emerging market stocks are more illiquid than those in the developed market, and intermediate-term bonds more illiquid than short-term bonds.24, 25
In a sense, it’s a simple process of elimination. The analysis will tell you whether the genuine alpha lurks beneath the top-line return number or not.
To be clear, we believe more efficient markets (such as the large-cap US equity markets) can also benefit from active management. Given enough resources, a highly skilled manager can carve out an edge almost anywhere. Still, it’s apparent that there are certain sweet spots where less-accessible data are just available enough.
Outing the Closet Indexers
As noted at the outset, increasingly there seem to be active managers who achieve commercial success building portfolios with risk profiles, if not actual holdings, closely matching those of their performance benchmarks. These managers seek to outperform a benchmark by maintaining a handful of static over- or underweights to common attractive/unattractive common risk factors. Very little of their strategies’ benchmark-relative variance is derived from correctly identifying and implementing less common factor exposures — the true value-add of active managers.26
In our view (setting Mr. Buffett aside), investors should refuse to pay active fees for such “closet indexers.”27 Investors should only be willing to pay for true alpha that cannot be replicated by a fully transparent static, systematic investment process leveraging factors in the public domain. The box above highlights a method used by our Investment Solutions Group in the diagnostics they perform on clients’
Figure 2: Illiquid Market Segments Outperformed Their Benchmarks by More than 50% in the 5-Year Period Ending December 2014Active Funds Success Rate by Category (%) Success Rate
Category 1-Year 3-Year 5-Year 10-Year
US Large Blend 32.7 25.6 25.1 21.6
US Large Value 21.3 49.0 24.4 38.2
US Large Growth 42.3 26.0 12.2 16.9
US Mid Blend 36.5 34.5 23.8 13.7
US Mid Value 20.9 34.8 13.5 54.4
US Mid Growth 48.0 37.0 31.1 26.8
US Small Blend 40.7 35.5 37.1 38.9
US Small Value 25.2 22.0 47.7 48.4
US Small Growth 51.4 40.8 30.2 24.4
Foreign Large Blend 47.0 44.8 52.8 40.2
Diversified Emerging Markets 58.2 70.4 65.8 36.6
Intermediate Term Bond 47.9 73.0 69.7 42.2
Source: Morningstar, as of December 31, 2014. For full details on these categories and what is included, see Morningstar, “Morningstar’s Active/Passive Barometer: A new yardstick for an old debate,” June, 2015.
Past performance is not a guarantee of future results.
5 State Street Global Advisors | IQ Q3 2015 Excerpt
Where and When to Go Active
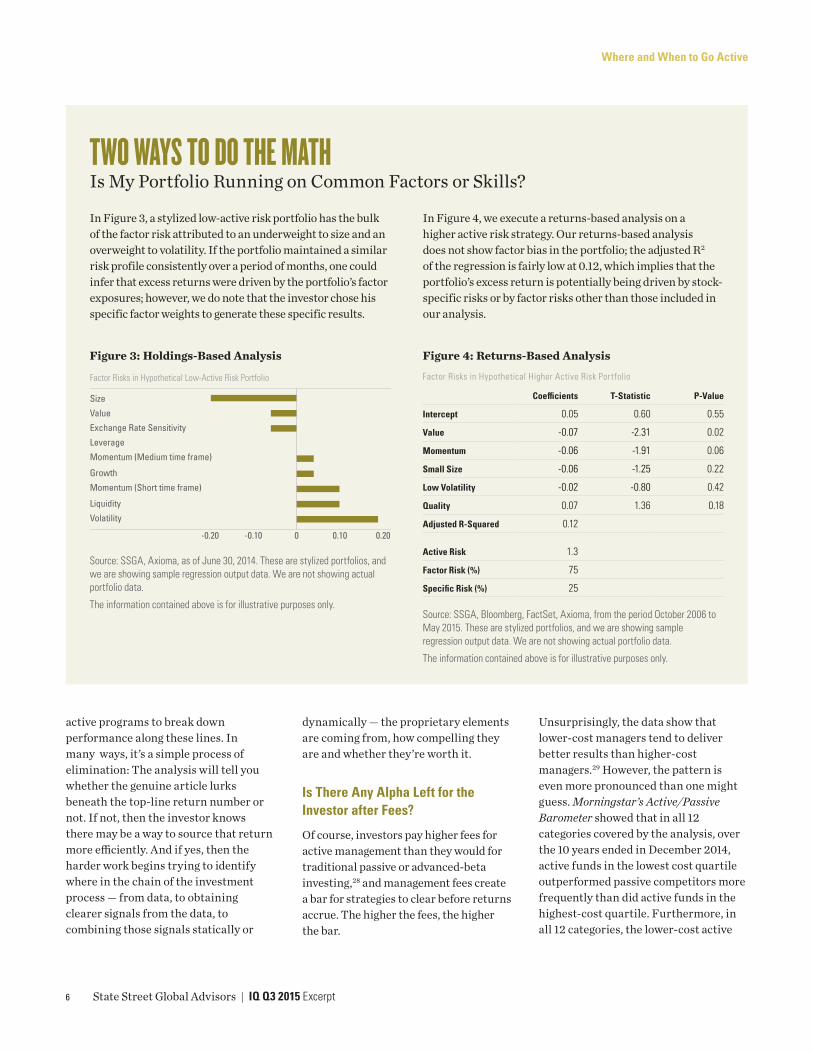
TWO WAYS TO DO THE MATHIs My Portfolio Running on Common Factors or Skills?
In Figure 3, a stylized low-active risk portfolio has the bulk of the factor risk attributed to an underweight to size and an overweight to volatility. If the portfolio maintained a similar risk profile consistently over a period of months, one could infer that excess returns were driven by the portfolio’s factor exposures; however, we do note that the investor chose his specific factor weights to generate these specific results.
In Figure 4, we execute a returns-based analysis on a higher active risk strategy. Our returns-based analysis does not show factor bias in the portfolio; the adjusted R2 of the regression is fairly low at 0.12, which implies that the portfolio’s excess return is potentially being driven by stock-specific risks or by factor risks other than those included in our analysis.
Figure 4: Returns-Based Analysis
Factor Risks in Hypothetical Higher Active Risk Portfolio
Coefficients T-Statistic P-Value
Intercept 0.05 0.60 0.55
Value -0.07 -2.31 0.02
Momentum -0.06 -1.91 0.06
Small Size -0.06 -1.25 0.22
Low Volatility -0.02 -0.80 0.42
Quality 0.07 1.36 0.18
Adjusted R-Squared 0.12
Active Risk 1.3
Factor Risk (%) 75
Specific Risk (%) 25
Source: SSGA, Bloomberg, FactSet, Axioma, from the period October 2006 to May 2015. These are stylized portfolios, and we are showing sample regression output data. We are not showing actual portfolio data.
The information contained above is for illustrative purposes only.
Figure 3: Holdings-Based Analysis
-0.20
Size
Value
Exchange Rate Sensitivity
Leverage
Momentum (Medium time frame)
Growth
Momentum (Short time frame)
Liquidity
Volatility
-0.10 0 0.10 0.20
Factor Risks in Hypothetical Low-Active Risk Portfolio
Source: SSGA, Axioma, as of June 30, 2014. These are stylized portfolios, and we are showing sample regression output data. We are not showing actual portfolio data.
The information contained above is for illustrative purposes only.
active programs to break down performance along these lines. In many ways, it’s a simple process of elimination: The analysis will tell you whether the genuine article lurks beneath the top-line return number or not. If not, then the investor knows there may be a way to source that return more efficiently. And if yes, then the harder work begins trying to identify where in the chain of the investment process — from data, to obtaining clearer signals from the data, to combining those signals statically or
dynamically — the proprietary elements are coming from, how compelling they are and whether they’re worth it.
Is There Any Alpha Left for the Investor after Fees?
Of course, investors pay higher fees for active management than they would for traditional passive or advanced-beta investing,28 and management fees create a bar for strategies to clear before returns accrue. The higher the fees, the higher the bar.
Unsurprisingly, the data show that lower-cost managers tend to deliver better results than higher-cost managers.29 However, the pattern is even more pronounced than one might guess. Morningstar’s Active/Passive Barometer showed that in all 12 categories covered by the analysis, over the 10 years ended in December 2014, active funds in the lowest cost quartile outperformed passive competitors more frequently than did active funds in the highest-cost quartile. Furthermore, in all 12 categories, the lower-cost active
6 State Street Global Advisors | IQ Q3 2015 Excerpt
Where and When to Go Active
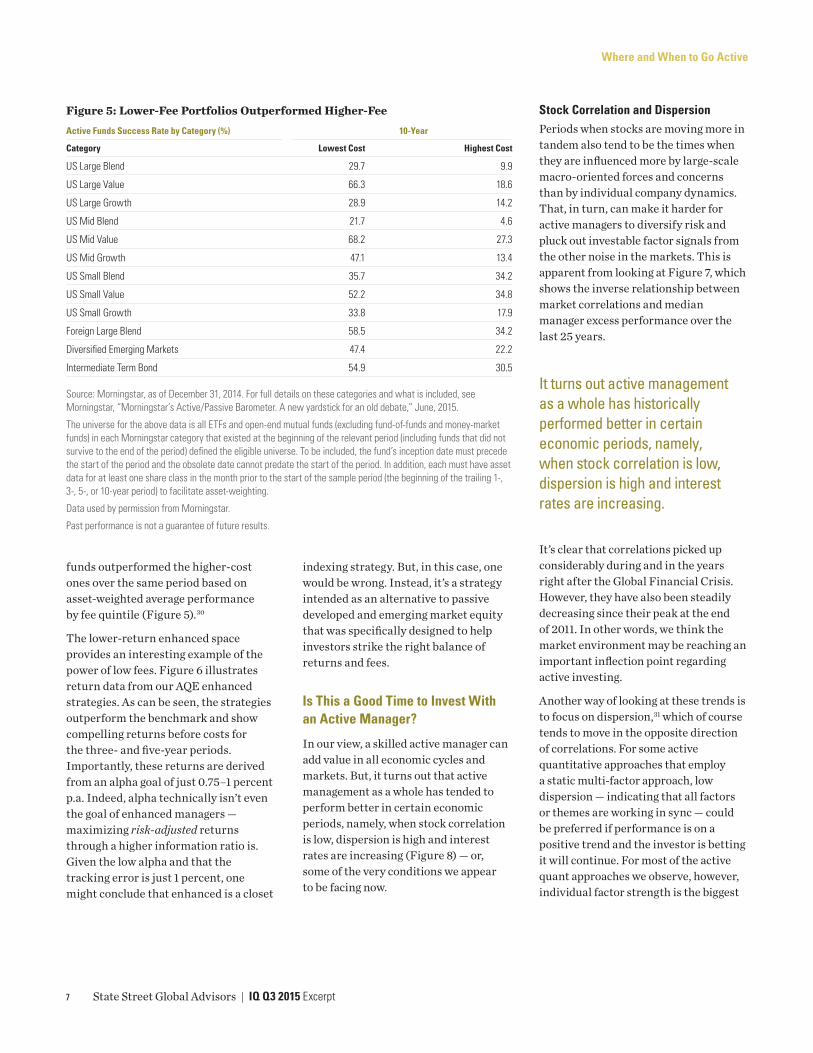
funds outperformed the higher-cost ones over the same period based on asset-weighted average performance by fee quintile (Figure 5).30
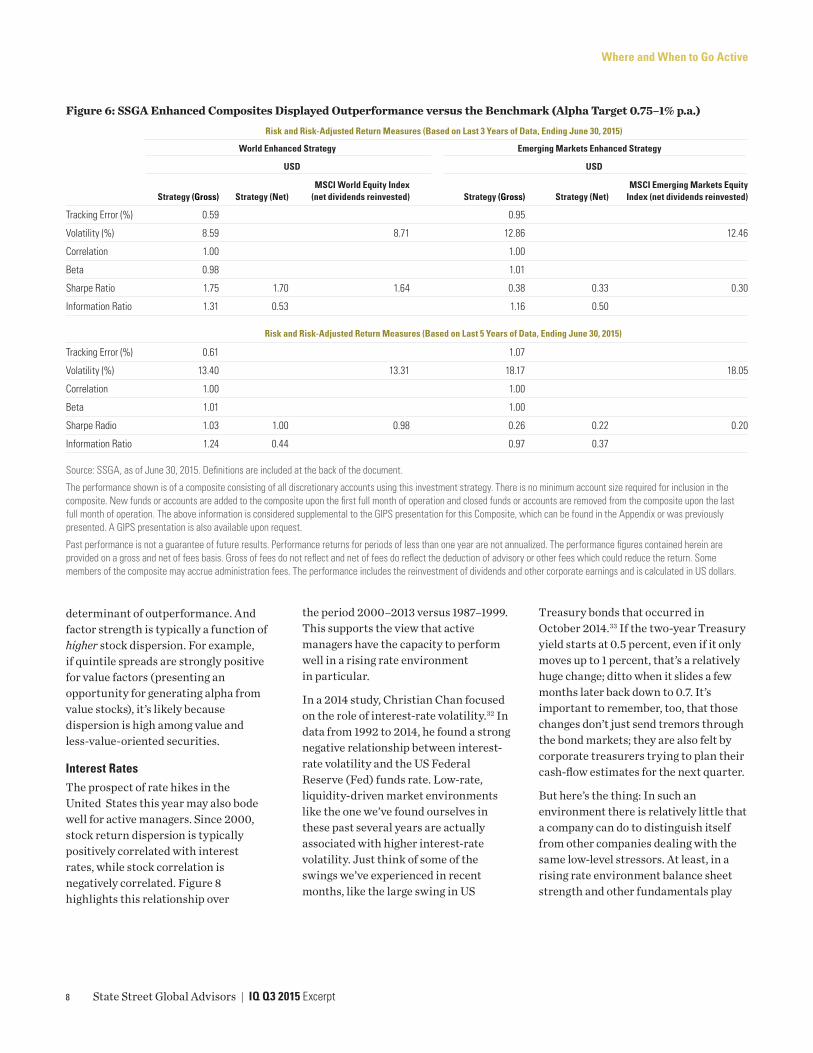
The lower-return enhanced space provides an interesting example of the power of low fees. Figure 6 illustrates return data from our AQE enhanced strategies. As can be seen, the strategies outperform the benchmark and show compelling returns before costs for the three- and five-year periods. Importantly, these returns are derived from an alpha goal of just 0.75–1 percent p.a. Indeed, alpha technically isn’t even the goal of enhanced managers — maximizing risk-adjusted returns through a higher information ratio is. Given the low alpha and that the tracking error is just 1 percent, one might conclude that enhanced is a closet
indexing strategy. But, in this case, one would be wrong. Instead, it’s a strategy intended as an alternative to passive developed and emerging market equity that was specifically designed to help investors strike the right balance of returns and fees.
Is This a Good Time to Invest With an Active Manager?
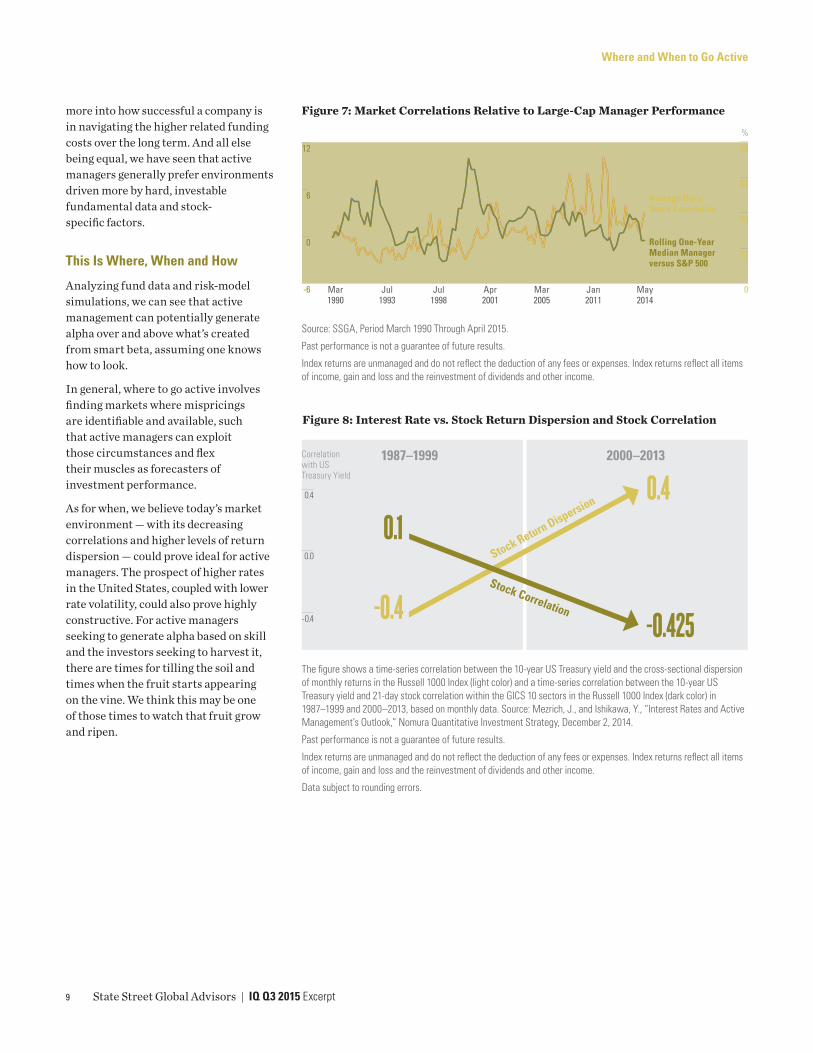
In our view, a skilled active manager can add value in all economic cycles and markets. But, it turns out that active management as a whole has tended to perform better in certain economic periods, namely, when stock correlation is low, dispersion is high and interest rates are increasing (Figure 8) — or, some of the very conditions we appear to be facing now.
Stock Correlation and DispersionPeriods when stocks are moving more in tandem also tend to be the times when they are influenced more by large-scale macro-oriented forces and concerns than by individual company dynamics. That, in turn, can make it harder for active managers to diversify risk and pluck out investable factor signals from the other noise in the markets. This is apparent from looking at Figure 7, which shows the inverse relationship between market correlations and median manager excess performance over the last 25 years.
It turns out active management as a whole has historically performed better in certain economic periods, namely, when stock correlation is low, dispersion is high and interest rates are increasing.
It’s clear that correlations picked up considerably during and in the years right after the Global Financial Crisis. However, they have also been steadily decreasing since their peak at the end of 2011. In other words, we think the market environment may be reaching an important inflection point regarding active investing.
Another way of looking at these trends is to focus on dispersion,31 which of course tends to move in the opposite direction of correlations. For some active quantitative approaches that employ a static multi-factor approach, low dispersion — indicating that all factors or themes are working in sync — could be preferred if performance is on a positive trend and the investor is betting it will continue. For most of the active quant approaches we observe, however, individual factor strength is the biggest
Figure 5: Lower-Fee Portfolios Outperformed Higher-FeeActive Funds Success Rate by Category (%) 10-Year
Category Lowest Cost Highest Cost
US Large Blend 29.7 9.9
US Large Value 66.3 18.6
US Large Growth 28.9 14.2
US Mid Blend 21.7 4.6
US Mid Value 68.2 27.3
US Mid Growth 47.1 13.4
US Small Blend 35.7 34.2
US Small Value 52.2 34.8
US Small Growth 33.8 17.9
Foreign Large Blend 58.5 34.2
Diversified Emerging Markets 47.4 22.2
Intermediate Term Bond 54.9 30.5
Source: Morningstar, as of December 31, 2014. For full details on these categories and what is included, see Morningstar, “Morningstar’s Active/Passive Barometer. A new yardstick for an old debate,” June, 2015.
The universe for the above data is all ETFs and open-end mutual funds (excluding fund-of-funds and money-market funds) in each Morningstar category that existed at the beginning of the relevant period (including funds that did not survive to the end of the period) defined the eligible universe. To be included, the fund’s inception date must precede the start of the period and the obsolete date cannot predate the start of the period. In addition, each must have asset data for at least one share class in the month prior to the start of the sample period (the beginning of the trailing 1-, 3-, 5-, or 10-year period) to facilitate asset-weighting.
Data used by permission from Morningstar.
Past performance is not a guarantee of future results.
7 State Street Global Advisors | IQ Q3 2015 Excerpt
Where and When to Go Active
determinant of outperformance. And factor strength is typically a function of higher stock dispersion. For example, if quintile spreads are strongly positive for value factors (presenting an opportunity for generating alpha from value stocks), it’s likely because dispersion is high among value and less-value-oriented securities.
Interest Rates The prospect of rate hikes in the United States this year may also bode well for active managers. Since 2000, stock return dispersion is typically positively correlated with interest rates, while stock correlation is negatively correlated. Figure 8 highlights this relationship over
the period 2000–2013 versus 1987–1999. This supports the view that active managers have the capacity to perform well in a rising rate environment in particular.
In a 2014 study, Christian Chan focused on the role of interest-rate volatility.32 In data from 1992 to 2014, he found a strong negative relationship between interest-rate volatility and the US Federal Reserve (Fed) funds rate. Low-rate, liquidity-driven market environments like the one we’ve found ourselves in these past several years are actually associated with higher interest-rate volatility. Just think of some of the swings we’ve experienced in recent months, like the large swing in US
Treasury bonds that occurred in October 2014.33 If the two-year Treasury yield starts at 0.5 percent, even if it only moves up to 1 percent, that’s a relatively huge change; ditto when it slides a few months later back down to 0.7. It’s important to remember, too, that those changes don’t just send tremors through the bond markets; they are also felt by corporate treasurers trying to plan their cash-flow estimates for the next quarter.
But here’s the thing: In such an environment there is relatively little that a company can do to distinguish itself from other companies dealing with the same low-level stressors. At least, in a rising rate environment balance sheet strength and other fundamentals play
Figure 6: SSGA Enhanced Composites Displayed Outperformance versus the Benchmark (Alpha Target 0.75–1% p.a.)Risk and Risk-Adjusted Return Measures (Based on Last 3 Years of Data, Ending June 30, 2015)
World Enhanced Strategy Emerging Markets Enhanced Strategy
USD USD
Strategy (Gross) Strategy (Net)MSCI World Equity Index
(net dividends reinvested) Strategy (Gross) Strategy (Net)MSCI Emerging Markets Equity
Index (net dividends reinvested)
Tracking Error (%) 0.59 0.95
Volatility (%) 8.59 8.71 12.86 12.46
Correlation 1.00 1.00
Beta 0.98 1.01
Sharpe Ratio 1.75 1.70 1.64 0.38 0.33 0.30
Information Ratio 1.31 0.53 1.16 0.50
Risk and Risk-Adjusted Return Measures (Based on Last 5 Years of Data, Ending June 30, 2015)
Tracking Error (%) 0.61 1.07
Volatility (%) 13.40 13.31 18.17 18.05
Correlation 1.00 1.00
Beta 1.01 1.00
Sharpe Radio 1.03 1.00 0.98 0.26 0.22 0.20
Information Ratio 1.24 0.44 0.97 0.37
Source: SSGA, as of June 30, 2015. Definitions are included at the back of the document.
The performance shown is of a composite consisting of all discretionary accounts using this investment strategy. There is no minimum account size required for inclusion in the composite. New funds or accounts are added to the composite upon the first full month of operation and closed funds or accounts are removed from the composite upon the last full month of operation. The above information is considered supplemental to the GIPS presentation for this Composite, which can be found in the Appendix or was previously presented. A GIPS presentation is also available upon request.
Past performance is not a guarantee of future results. Performance returns for periods of less than one year are not annualized. The performance figures contained herein are provided on a gross and net of fees basis. Gross of fees do not reflect and net of fees do reflect the deduction of advisory or other fees which could reduce the return. Some members of the composite may accrue administration fees. The performance includes the reinvestment of dividends and other corporate earnings and is calculated in US dollars.
8 State Street Global Advisors | IQ Q3 2015 Excerpt
Where and When to Go Active
more into how successful a company is in navigating the higher related funding costs over the long term. And all else being equal, we have seen that active managers generally prefer environments driven more by hard, investable fundamental data and stock-specific factors.
This Is Where, When and How
Analyzing fund data and risk-model simulations, we can see that active management can potentially generate alpha over and above what’s created from smart beta, assuming one knows how to look.
In general, where to go active involves finding markets where mispricings are identifiable and available, such that active managers can exploit those circumstances and flex their muscles as forecasters of investment performance.
As for when, we believe today’s market environment — with its decreasing correlations and higher levels of return dispersion — could prove ideal for active managers. The prospect of higher rates in the United States, coupled with lower rate volatility, could also prove highly constructive. For active managers seeking to generate alpha based on skill and the investors seeking to harvest it, there are times for tilling the soil and times when the fruit starts appearing on the vine. We think this may be one of those times to watch that fruit grow and ripen.
Figure 7: Market Correlations Relative to Large-Cap Manager Performance
%
0
6
Mar1990
Jul1993
Jul1998
Mar2005
Apr2001
Jan2011
May2014
12
-6
Rolling One-Year Median Manager versus S&P 500
20
0
40
60
80
Average Daily Stock Correlation
Source: SSGA, Period March 1990 Through April 2015.
Past performance is not a guarantee of future results.
Index returns are unmanaged and do not reflect the deduction of any fees or expenses. Index returns reflect all items of income, gain and loss and the reinvestment of dividends and other income.
9 State Street Global Advisors | IQ Q3 2015 Excerpt
Figure 8: Interest Rate vs. Stock Return Dispersion and Stock Correlation
The figure shows a time-series correlation between the 10-year US Treasury yield and the cross-sectional dispersion of monthly returns in the Russell 1000 Index (light color) and a time-series correlation between the 10-year US Treasury yield and 21-day stock correlation within the GICS 10 sectors in the Russell 1000 Index (dark color) in 1987–1999 and 2000–2013, based on monthly data. Source: Mezrich, J., and Ishikawa, Y., “Interest Rates and Active Management’s Outlook,” Nomura Quantitative Investment Strategy, December 2, 2014.
Past performance is not a guarantee of future results.
Index returns are unmanaged and do not reflect the deduction of any fees or expenses. Index returns reflect all items of income, gain and loss and the reinvestment of dividends and other income.
Data subject to rounding errors.
1987–1999
0.0
0.4
-0.4 -0.4
0.4
-0.425
0.1Stock Return Dispersion
Stock Correlation
2000–2013Correlation with US Treasury Yield
Where and When to Go Active

Definitions
Active Risk Risk created by an active investment manager attempting to outperform its benchmark.
Adjusted R-Squared A version of R-Squared that has been adjusted for the number of predictors in the model.
Beta A measure of the risk of a portfolio from systemic, or market movements, rather than idiosyncratic factors.
Coefficient In simple linear regressions, the independent variable coefficients represent the rate of change of the dependent variable with a 1-unit move in the independent variable.
Correlation Coefficient The correlation coefficient measures the strength and direction of a linear relationship between two variables. It measures the degree to which the deviations of one variable from its mean are related to those of a different variable from its respective mean.
Factor Risk A systematic risk in multi-factor models describing the investment manager’s style and deviation from the benchmark.
Information Ratio A unit of measure showing the difference between a portfolio’s return and that of its benchmark index, per unit of volatility.
Intercept In simple linear regressions, the intercepts represent how the dependent variable would perform when independent variables are “0.”
Leverage A factor risk from debt held by a company.
Low Volatility A designation for stocks with relatively less movement in share price.
Momentum The tendency for a stock price to maintain a certain direction of price trajectory.
P-Value A statistical measure of how likely it is that sample data will “reject
the null hypothesis (the hypothesis that the data is actually not proving what the researcher sets out to prove)”, even when the null hypothesis is true. High p-values imply your data are likely with a true null. Low p-values imply your data are unlikely with a true null. Therefore, results of regressions with low p-values are generally considered more reliable results and suggest that the researcher can reject the null.
R-Squared Coefficient of Multiple Determination — The percent of the variance in the dependent variable that can be explained by all of the independent variables taken together. That is, the strength of the independent variables of a regression in explaining the value of the dependent variable.
Sharpe Ratio A unit of measure showing the difference between a portfolio’s return and that of the risk-free rate, per unit of volatility.
Specific Risk Idiosyncratic, uncorrelated risk emanating from individual securities.
T-Statistic T-tests are statistical tests measuring the difference between population means or between the population mean and a hypothesized value. The t-value measures the size of the difference relative to the variation in the sample data. Or, the t-statistic is the calculated difference between means represented in units of standard error. The greater the magnitude of T, the greater the evidence against the null hypothesis (the hypothesis that the data is actually not proving what the researcher sets out to prove). The closer T is to 0, the more likely there isn’t a significant difference in the sample mean.
Tracking Error The standard deviation of a portfolio’s excess returns over a benchmark, annualized.
Value A designation for a stock that tends to trade below the price suggested by the company’s fundamentals.
1 Morningstar, as of various dates.2 “Prior to the development of the three factor model,
actively managed funds could produce higher returns than a benchmark, such as the Russell 3000 Index or the S&P 500 Index, by ‘tilting’ their portfolio to either small or value stocks, thus giving them more exposure to size and value factors than the benchmark index. The fund would then claim its outperformance was, in fact, alpha. Today, regression analysis would show that their outperformance was simply the result of exposure to certain factors: In effect, what was once alpha has now become beta, or loading on a factor, which could be purchased in a less expensive way.” Swedroe, L.E., and Berlin, A.L. “The Incredible Shrinking Alpha,” Buckingham, 2015.
3 Chandrashekaran, Vinod. “The Evolution of Quantitative Investment Strategies,” Investment Viewpoints, American Century Investments (March 2015): https://institutional.americancentury.com/content/dam/americancentury/institutional/pdfs/viewpt/investment-viewpoints-evolution-of-quantitative-investment-strategies-3-2015-inst-uk-hk.pdf
4 The Journal of Portfolio Management, Vol. 15, No. 3 (Spring 1989). DOI: 10.3905/jpm.1989.409211. The Fundamental Law of Active Management relates skill, breadth and value-add of strategies to performance of active managers.
5 There is a tendency for asset prices to underreact to news in the short-run. Momentum traders attempt to profit from this underreaction via a trend-following strategy, investing in stocks with rising prices that have not fully priced in latest news or fundamental changes. Hong, Harrison, and Stein, Jeremy C., “A Unified Theory of Underreaction, Momentum Trading and Overreaction in Asset Markets,” National Bureau of Economic Research, December 1997.
6 Big data seeks to pull enormous reams of rapidly available data from various forms (including social networking sites, GPS, sensors or other sources), and to use it for analytics. See McAffe, Eric, and Brynjolfsson, Erik, “Big Data: The Management Revolution,” Harvard Business Review, October 2012; https://hbr.org/2012/10/big-data-the-management-revolution/ar.
7 Frazzini, A., Kabiller, D., and Pedersen, L.H., “Buffett’s Alpha,” AQR Capital Management, November 21, 2012.
8 This behavior of tilting toward high-beta assets suggests that risky high-beta assets require lower risk-adjusted returns than low-beta assets, which require leverage. Therefore, betting against beta (or underweighting high-beta assets) is one factor strategy taken by some investors. Frazzini, A., and Pedersen, L. E., “Betting Against Beta,” Journal of Financial Economics, 111, 2014.
9 Quality-minus-junk is a factor strategy that goes long on high-quality stocks and shorts low-quality stocks. This strategy earns significant risk-adjusted returns in the United States and globally across 24 countries. Clifford S. Asness, Andrea Frazzini and Lasse H. Pedersen, “Quality Minus Junk,” October 9, 2013.
10 At SSGA, we define quality as high profitability, low earnings variability and low leverage, and believe that these safe, profitable and solid businesses will produce superior returns over the long term. See Taie Wang and Bruce Zhang, “Why Quality Investing,” State Street Global Advisors, 2014: http://www.iq.ssga.com/article/why-quality-investing.
10 State Street Global Advisors | IQ Q3 2015 Excerpt
Where and When to Go Active

11 Swedroe, L.E., and Berlin, A. L., “The Incredible Shrinking Alpha,” Buckingham, 2015.
12 Jensen, Michael C., “The Performance of Mutual Funds in the Period 1945–1964,” Social Science Electronic Publishing (SSEP), Inc.; Harvard Business School; National Bureau of Economic Research (NBER); European Corporate Governance Institute (ECGI)( May 1, 1967), Journal of Finance, Vol. 23, No. 2, 1967.
13 Statistics refers to a null hypothesis, or the hypothesis that there is no relationship between measured phenomena. A “Type I” error occurs when one rejects the null hypothesis and determines a relationship, when there is not one. A 95 percent significance level indicates that there is a 5 percent chance of a Type I error; this is also known as a “P-value” of 0.05. By convention, P < 0.05 is generally considered “statistically significant.” State Street Global Advisors, as of March 31, 2015.
14 “SSGA’s Michael Ho Issues Warning on Market Complacency and Myopic Short Volatility Plays,” Hedgeweek, November 11, 2000. http://www.hedgeweek.com/2014/11/25/213465/ssga%E2%80%99s-michael-ho-issues-warning-market-complacency-and-myopic-short-volatility-pl
15 Grossman, S. J., and Stiglitz, J. E., “On the Impossibility of Informationally Efficient Markets,” The American Economic Review 70, 1980.
16 E. Chatron, O. Ekambi and T. Ngwena, “Unlocking Value in Small Caps with a Systematic Approach,” State Street Global Advisors, IQ Insights, December 2014); Hong, T. Lim and J. C. Stein, “Bad News Travels Slowly: Size, Analyst Coverage and the Profitability of Momentum Strategies,” Journal of Finance, 55 (1) 265-295, 2000; Lazard, “A Case for Active Non-US Equities,” Lazard Asset Management, May 8, 2015.
17 Ng, Sunny, “The Factors That Work in China,” IQ Magazine, State Street Global Advisors, Q2 2015.
18 Morningstar, data and calculations as of December 31, 2014.19 Hope, Bradley, and Vaishampayan, Saumya, “Glitch
Freezes NYSE Trading for Hours,” the Wall Street Journal, July 8, 2015. http://www.wsj.com/articles/trading-halted-on-new-york-stock-exchange-1436372190
20 Morningstar, as of June 2015. http://corporate.morningstar.com/US/documents/ResearchPapers/MorningstarActive-PassiveBarometerJune2015.pdf. Used by permission.
21 Note that Morningstar data is public data and does not reflect results from separately managed accounts.
22 We do note, however, that this Morningstar analysis is restricted to US data and so these three categories do not necessarily constitute an exhaustive list of categories where active outperformed passive and does not illustrate the potential benefits of active management outside the US (i.e., in Europe, Asia and Australia).
23 Morningstar’s results are based on net of fee performance among funds in their database. Mutual fund fees are typically higher than management fees for institutional investment strategies, thus active manager net of fee performance is typically stronger within an institutional universe.
24 Rouwenhorst, K. G., “Local Return Factors and Turnover in Emerging Stock Markets,” working paper, Yale University, 1998.
25 Yakov, A., “Illiquidity and Stock Returns: Cross-Section and Time-Series Effects,” Stern School of Business, New York University, 2000.
26 Ferri, Ricki, “To Tilt Or Not To Tilt Your Portfolio Design,” Forbes blog post, July 17, 2014.
27 A caveat is that the benchmark that active managers should be compared to ought to be an ex-ante, pre-blended mix of common factors, not an ex-post regression of their performance on these factors as such regression will fit the weights to those factors with perfect foresight. In other words, compare the manager to a mix of advanced beta factors (AB’s) that’s fixed, not to a mix of AB’s that explains that manager’s performance the best. The manager might have known how to blend those AB’s ex-ante, and the regression will deprive him or her of that source of skill.
28 Egan, Matt, “86% of Investment Managers Stunk in 2014,” CNN, March 12, 2015. http://money.cnn.com/2015/03/12/investing/investing-active-versus-passive-funds/
29 AFM — The Netherlands Authority of the Financial Markets, “The Status of Academic Research Regarding the Results of Active and Passive Investing,” AFM Amsterdam, October 2011.
30 Morningstar, as of June 2015. http://corporate.morningstar.com/US/documents/ResearchPapers/MorningstarActive-PassiveBarometerJune2015.pdf. Morningstar data used by permission.
31 Correlation calculates how the returns of two stocks over time are correlated. You can do this pair-wise for companies in an index such as the S&P 500 Index, for example. One could look at the 500 stock returns within the S&P 500 on a particular trading day and calculate the cross-sectional correlations of those: How do they interact? If the market is going up steadily, one would expect low correlation as all stocks need to go up (more or less) in such a situation. By contrast, dispersion measures a spread; e.g., view the P/E ratios of the S&P 500 Index stocks, and then take the difference between the highest and lowest value. This is the dispersion. If the dispersion is low, the market thinks similarly about all stocks.
32 Chan, C., “Why Active, Why Now?”, Wells Fargo Capital Management, July 2014. Information is publicly available at Wells Capital Management website, http://www.wellscap.com.
33 Bloomberg, October 2014.
For investment professional use only. Not for use with the public.
Investing involves risk including the risk of loss of principal.
The whole or any part of this work may not be reproduced, copied or transmitted or any of its contents disclosed to third parties without SSGA’s express written consent.
The information provided does not constitute investment advice and it should not be relied on as such. It should not be considered a solicitation to buy or an offer to sell a security. It does not take into account any investor’s particular investment objectives, strategies, tax status or investment horizon. You should consult your tax and financial advisor. All material has been obtained from sources believed to be reliable. There is no representation or warranty as to the accuracy of the information and State Street shall have no liability for decisions based on such information.
The views expressed in this material are the views of Marcus Schulmerich, Vladimir Zdorovtsov, and Brett Collins through the period ended September 1, 2015 and are subject to change based on market and other
conditions. This document contains certain statements that may be deemed forward-looking statements. Please note that any such statements are not guarantees of any future performance and actual results or developments may differ materially from those projected.
Risk associated with equity investing include stock values which may fluctuate in response to the activities of individual companies and general market and economic conditions.
SSGA Active Quantitative Equity (AQE) Global Managed Volatility Alpha does not seek to replicate the performance of a specified index.
SSGA Active Quantitative Equity (AQE) Global Managed Volatility Alpha is actively managed and may underperform its benchmarks. An investment in the Strategy is not appropriate for all investors and is not intended to be a complete investment program. Investing in the strategy/Fund involves risks, including the risk that investors may receive little or no return on the investment or that investors may lose part or even all of the investment.
For the purpose of complying with the Global Investment Performance Standards (GIPS), the firm (“SSGA-Global”) is defined as all portfolios managed across the global offices of State Street Global Advisors (SSGA) and SSGA Funds Management, Inc., with the exception of business units which are held out to the marketplace as distinct business entities - Fiduciary Advisory Solutions (formerly known as the Office of the Fiduciary Advisor [OFA]) and Charitable Asset Management (CAM). Prior to 1/1/2011, SSGA-Global also excluded its wrap fee business (Intermediary Business Group [IBG]) and assets accounted for on a book value basis (global cash and stable value assets). In January 2011, SSGA acquired the Bank of Ireland Asset Management Limited (now known as SSGA Ireland Limited), a GIPS Compliant firm. On 1/1/2012 SSGA Ireland Limited assets were merged into SSGA-Global. SSGA-Global claims compliance with the Global Investment Performance Standards (GIPS).
The Global Managed Volatility Alpha Composite (the “Composite”), inception date 1/1/2009, seeks to achieve the Investment Objective described above using the Investment Strategy described above, and includes portfolios managed across the global offices of SSGA-Global. To receive a complete list and description of SSGA-Global’s composites and/or a GIPS compliant presentation, please contact your SSGA Representative
This document provides summary information regarding the Strategy. This document should be read in conjunction with the Strategy’s Disclosure Document, which is available from SSGA. The Strategy Disclosure Document contains important information about the Strategy, including a description of a number of risks.
11 State Street Global Advisors | IQ Q3 2015 Excerpt
Where and When to Go Active

ssga.com
State Street Global Advisors Worldwide Entities
Australia: State Street Global Advisors, Australia, Limited (ABN 42 003 914 225) is the holder of an Australian Financial Services Licence (AFSL Number 238276). Registered Office: Level 17, 420 George Street, Sydney, NSW 2000, Australia. T: +612 9240 7600. F: +612 9240 7611. Belgium: State Street Global Advisors Belgium, Chausse de La Hulpe 120, 1000 Brussels, Belgium. T: +32 2 663 2036, F: +32 2 672 2077. SSGA Belgium is a branch office of State Street Global Advisors Limited. State Street Global Advisors Limited is authorised and regulated by the Financial Conduct Authority in the United Kingdom. Canada: State Street Global Advisors, Ltd., 770 Sherbrooke Street West, Suite 1200 Montreal, Quebec, H3A 1G1, T: +514 282 2400 and 30 Adelaide Street East Suite 500, Toronto, Ontario M5C 3G6. T: +647 775 5900. Dubai: State Street Bank and Trust Company (Representative Office), Boulevard Plaza 1, 17th Floor, Office 1703 Near Dubai Mall & Burj Khalifa, P.O Box 26838, Dubai, United Arab Emirates. T: +971 (0)4 4372800. F: +971 (0)4 4372818. France: State Street Global Advisors France. Authorised and regulated by the Autorité des Marchés Financiers. Registered with the Register of Commerce and Companies of Nanterre under the number: 412 052 680. Registered Office: Immeuble Défense Plaza, 23-25 rue Delarivière-Lefoullon, 92064 Paris La Défense Cedex, France. T: +33 1 44 45 40 00. F: +33 1 44 45 41 92. Germany: State Street Global Advisors GmbH, Brienner Strasse 59, D-80333 Munich. T: +49 (0)89 55878 100. F: +49 (0)89 55878 440. Hong Kong: State Street Global Advisors Asia Limited, 68/F, Two International Finance Centre, 8 Finance Street, Central, Hong Kong. T: +852 2103 0288. F: +852 2103 0200. Ireland: State Street Global Advisors Ireland Limited is regulated by the Central Bank of Ireland. Incorporated and registered in Ireland at Two Park Place, Upper Hatch Street, Dublin 2. Registered Number: 145221. Member of the Irish Association of Investment Managers. T: +353 (0)1 776 3000. F:
+353 (0)1 776 3300. Italy: State Street Global Advisors Limited, Milan Branch (Sede Secondaria di Milano) is a branch of State Street Global Advisors Limited, a company registered in the UK, authorised and regulated by the Financial Conduct Authority (FCA ), with a capital of GBP 71'650'000.00, and whose registered office is at 20 Churchill Place, London E14 5HJ. State Street Global Advisors Limited, Milan Branch (Sede Secondaria di Milano), is registered in Italy with company number 06353340968 - R.E.A. 1887090 and VAT number 06353340968 and whose office is at Via dei Bossi, 4 - 20121 Milano, Italy. T: +39 02 32066 100. F: +39 02 32066 155. Japan: State Street Global Advisors (Japan) Co., Ltd., Japan, Toranomon Hills Mori Tower 25F, 1-23-1 Toranomon, Minato-ku, Tokyo, 105-6325. T: +81 (0)3 4530 7380 Financial Instruments Business Operator, Kanto Local Financial Bureau (Kinsho #345) Membership: Japan Investment Advisers Association, The Investment Trust Association, Japan, Japan Securities Dealers' Association. Netherlands: State Street Global Advisors Netherlands, Adam Smith Building, Thomas Malthusstraat 1-3, 1066 JR Amsterdam, Netherlands. T: +31 (0)20 7181701. State Street Global Advisors Netherlands is a branch office of State Street Global Advisors Limited. State Street Global Advisors Limited is authorised and regulated by the Financial Conduct Authority in the United Kingdom. Singapore: State Street Global Advisors Singapore Limited, 168 Robinson Road, #33-01 Capital Tower, Singapore 068912 (Company Registered Number: 200002719D). T: +65 6826 7500. F: +65 6826 7501. Switzerland: State Street Global Advisors AG, Beethovenstrasse. 19, Postfach, CH-8027 Zurich. T: +41 (0)44 245 70 00. F: +41 (0)44 245 70 16. United Kingdom: State Street Global Advisors Limited. Authorised and regulated by the Financial Conduct Authority. Registered in England. Registered Number: 2509928. VAT Number: 5776591 81. Registered Office: 20 Churchill Place, Canary Wharf, London, E14 5HJ. T: +020 3395 6000. F: +020 3395 6350. United States: State Street Global Advisors, One Lincoln Street, Boston, MA 02111-2900. T: +1 617 664 7727.
State Street Global Advisors© 2015 State Street Corporation. All Rights Reserved.
ID4865-INST-5881 0915 Exp. Date: 08/31/2016