Embed Size (px)
Citation preview
in t e rna l r epor t 521
Hydrology and
suspended sediment of
the Ngarradj catchment,
Northern Territory:
2005–2006 wet season
monitoring
DR Moliere, MJ Saynor, KG Evans
& BL Smith
February 2007
(Release status - unrestricted)

Hydrology and suspended sediment of the Ngarradj catchment, Northern Territory:
2005–2006 wet season monitoring
DR Moliere, MJ Saynor, KG Evans & BL Smith
Hydrological and Geomorphic Processes Program
Environmental Research Institute of the Supervising Scientist
Supervising Scientist Division
GPO Box 461, Darwin NT 0801
February 2007
Registry File SG2006/0094
(Release status – unrestricted)

How to cite this report:
Moliere DR, Saynor MJ, Evans KG & Smith BL 2007. Hydrology and suspended sediment of the Ngarradj catchment, Northern Territory: 2005–2006 wet season monitoring. Internal Report 521, February, Supervising Scientist, Darwin. Unpublished paper.
Location of final PDF file in SSD Explorer
\Publications Work\Publications and other productions\Internal Reports (IRs)\Nos 500 to 599\IR521_Hydrology Ngarradj catchment 2005–2006 (Moliere et al).pdf

Contents
Executive summary iv
Acknowledgements iv
1 Introduction 1
1.1 Study area 1
2 Rainfall data 3
2.1 Missing data 4
3 Runoff data 4
3.1 Hydrology data summary – 1998–2006 10
4 Suspended sediment data 11
5 Impact assessment 16
5.1 Cyclone Monica 19
6 Conclusions 21
7 References 22
Appendix A – Mud pulse characteristics 24
iii

Executive summary Ngarradj is a major right bank tributary of Magela Creek, which flows directly into the Magela Creek floodplain. The Jabiluka uranium deposit is located in the catchment of Ngarradj and, therefore, this catchment will be the first to be affected should any impact occur as a result of mining operations at Jabiluka. It is important to determine pre-mining stream conditions within the Ngarradj catchment to be in a position to reliably assess mining-related impacts. Continuous rainfall, runoff and mud concentration data collected at gauging stations on Ngarradj during 2005–06 are presented in this report. The mud concentration data collected upstream and downstream of the mine during 2005–06 were used to establish preliminary trigger values for an event-based Before-After-Control-Impact, paired difference design (BACIP). This comparison of event mud loads observed upstream and downstream of the mine will be used to provide the basis for future impact assessment.
Acknowledgements Jeff Klein, Klein Electronics Pty Ltd, helped with the installation and the maintenance of the gauging station equipment.
iv
Hydrology and suspended sediment of the Ngarradj catchment, Northern Territory:
2005–2006 wet season monitoring
DR Moliere, MJ Saynor, KG Evans & BL Smith
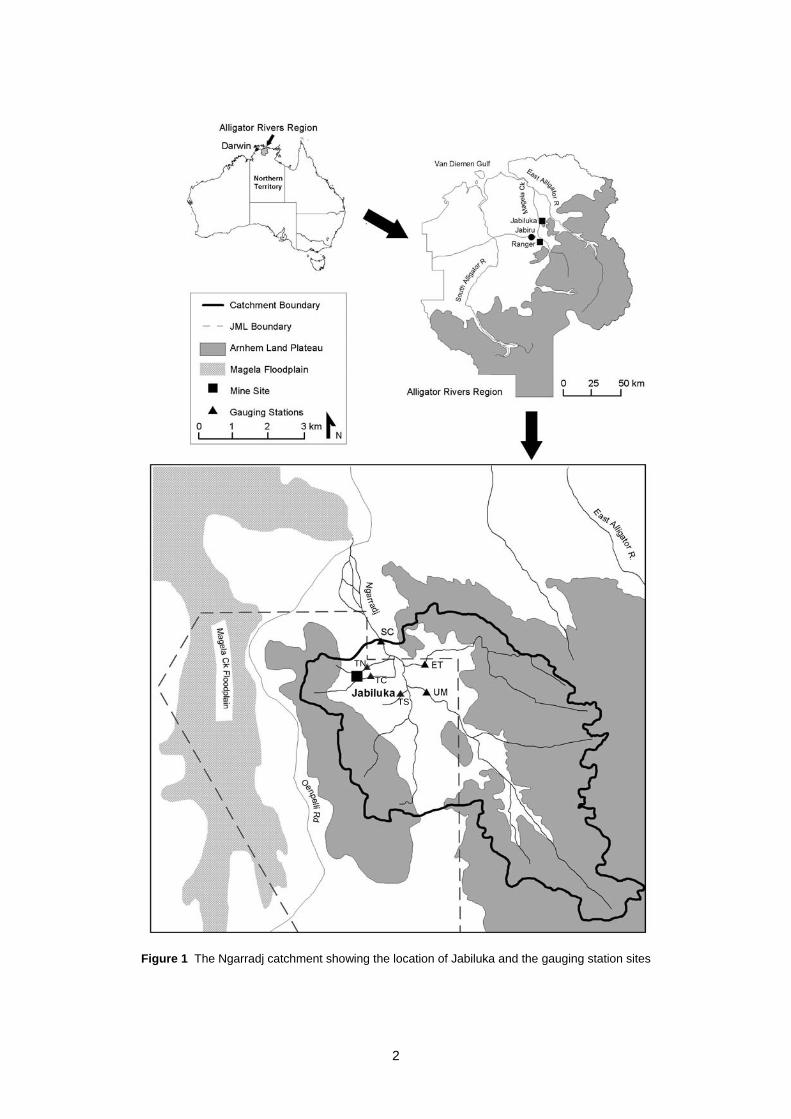
1 Introduction The Jabiluka uranium deposit is located in the catchment of Ngarradj in the wet-dry tropics of the Northern Territory, Australia (Fig 1). Ngarradj is a major downstream right-bank tributary of Magela Creek, which flows directly into the Magela Creek floodplain. The Magela Creek and floodplain are listed as Wetlands of International Importance under the Ramsar Convention and recognised under the World Heritage Convention.
The Ngarradj catchment will be the first to be affected should any impact occur as a result of mining operations at Jabiluka. In 1998 the Environmental Research Institute of the Supervising Scientist (eriss) established a stream gauging network to determine the pre-mining hydrological and suspended sediment transport characteristics of the Ngarradj catchment. Stream gauging stations were installed upstream (Upper Main – UM; East Tributary – ET) and downstream (Swift Creek – SC) (Fig 1) of Jabiluka (Erskine et al 2001). Gauging stations were also operated at tributaries North, Central and South (TN, TC and TS respectively) (Fig 1) by Energy Resources of Australia (ERA), however, data collected from these stations are not discussed in this report. A site description of the three eriss gauging stations is given in Moliere et al (2005a).
The purpose of this report is to present the hydrology and mud concentration data collected from the three stream gauging stations within the Ngarradj catchment during the 2005–06 wet season. These data were collected as part of the long-term study on the impact of mining at Jabiluka on the Ngarradj catchment.
1.1 Study area The Ngarradj catchment is located approximately 230 km east of Darwin and 20 km north-east of Jabiru (Fig 1). Oenpelli, Arnhem Land, is a further 20 km north-east of the Ngarradj catchment. Located in the monsoon tropics climatic zone, the catchment experiences a distinct wet season from October to April, and a dry season for the remainder of the year. Stream flow, as a consequence, is highly seasonal. The average annual rainfall for the region is approximately 1410 mm (Moliere et al 2002).
Ngarradj main channel flows in a well-defined valley in a northwesterly direction from the Arnhem Land sandstone plateau to the Magela Creek floodplain with one major right bank tributary (East Tributary) (Fig 1). Both the upper reaches of the Ngarradj main channel and East Tributary flow in essentially a bedrock confined channel on the plateau (Fig 1). There are several left bank tributaries that drain predominantly wooded lowland areas and have significantly smaller areas of bedrock and escarpment than the main channel and East Tributary. The total catchment area of the Ngarradj catchment (upstream of SC) is approximately 43.6 km2.
1
TS
TC
TN
Figure 1 The Ngarradj catchment showing the location of Jabiluka and the gauging station sites
2
ARI (y)
1.01 1.11 2 10 100
Ann
ual r
ainf
all (
mm
)
2500
2000
1500
1000
500
Observed data -Ngarradj catchment
98/99
99/00
00/01
99 98 95 90 80 70 60 50 40 30 20 10 5 2 1
Annual exceedance probability (%)
03/04
01/02
Fitted distribution
02/03
04/05
2005-06
2 Rainfall data A 0.2 mm tipping bucket rain gauge was installed at each eriss gauging station within Ngarradj catchment and readings were taken at 6-minute intervals (Saynor et al 2001). Daily rainfall data have been collected at Jabiluka (Fig 1) during previous years by Energy Resources of Australia, however, rainfall data were not collected during 2005–06. The total rainfall (September to June) at each gauging station (SC, UM and ET) during the 2005–06 wet season is shown in Table 1. The total annual rainfall over the Ngarradj catchment, determined using the Thiessen Polygon method (Thiessen 1911) to spatially average the total rainfall measured at the three gauging stations during the year, was 1936 mm (Table 1).
Table 1 Total rainfall over the Ngarradj catchment during 2005–06 derived using the Thiessen Polygon method
Station Rainfall Polygon area
(mm) (% of total area)
SC 1984 0.324
UM 1883 0.482
ET 2012 0.105
Total [ARI] 1936 [1:29] 1.00
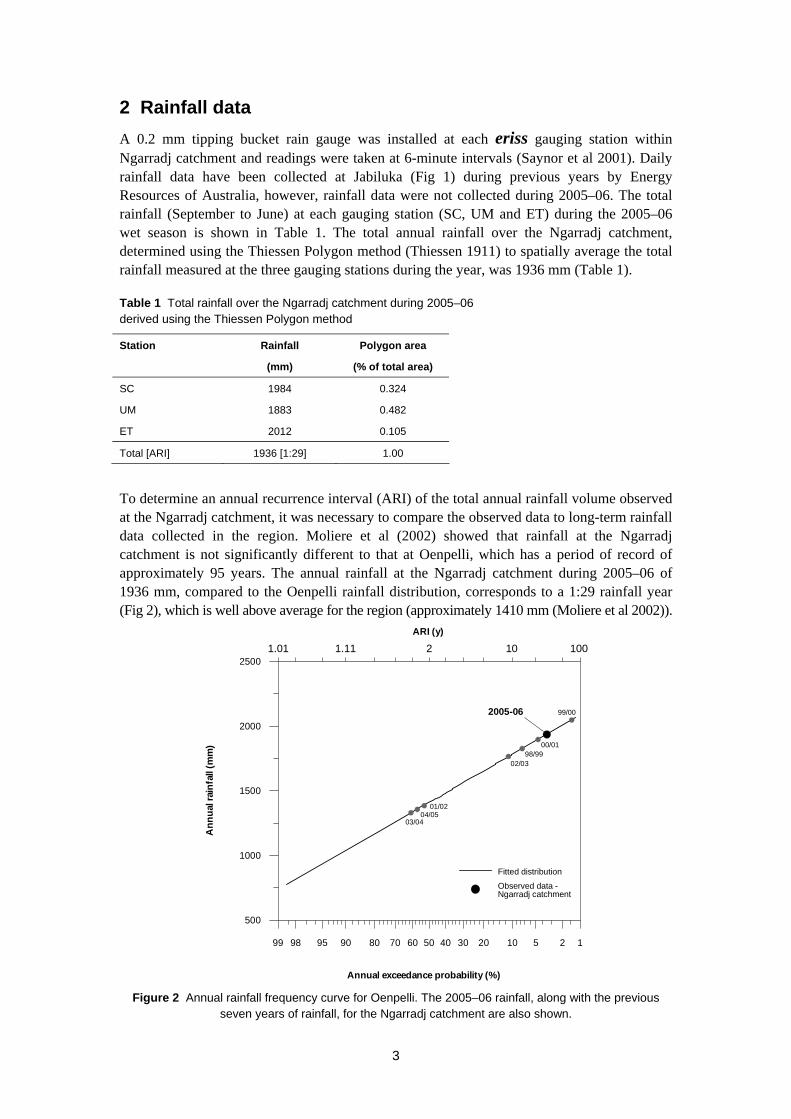
To determine an annual recurrence interval (ARI) of the total annual rainfall volume observed at the Ngarradj catchment, it was necessary to compare the observed data to long-term rainfall data collected in the region. Moliere et al (2002) showed that rainfall at the Ngarradj catchment is not significantly different to that at Oenpelli, which has a period of record of approximately 95 years. The annual rainfall at the Ngarradj catchment during 2005–06 of 1936 mm, compared to the Oenpelli rainfall distribution, corresponds to a 1:29 rainfall year (Fig 2), which is well above average for the region (approximately 1410 mm (Moliere et al 2002)).
Figure 2 Annual rainfall frequency curve for Oenpelli. The 2005–06 rainfall, along with the previous seven years of rainfall, for the Ngarradj catchment are also shown.
3
The above average wet season can be largely attributed to the late wet season rainfall which occurred over the region. Total rainfall over the Ngarradj catchment in April 2006 was 362 mm, the highest rainfall for April recorded during the monitoring period (1998–2006). Total monthly rainfall for April at Oenpelli has only exceeded this total twice throughout the 95 year period of record – 1948 (414 mm) and 1985 (390 mm).
2.1 Missing data Periods where missing data occurred during the 2005–06 wet season at two of the rain gauges are given in Table 2. The reason for the gap, and whether the gap was infilled, is also documented. It should be noted that rainfall data collected at UM were used to infill gaps in the rainfall record at ET as Moliere et al (2002) showed that rainfall at these two stations are statistically similar.
Table 2 Missing data during 2005–06 at Ngarradj rain gauges
Station Missing period Comments
UM 6 June – 31 Aug Fire destroyed rain gauge cable. However, no rainfall was recorded at SC during this period.
ET 1 Sept – 10 Jan Problem with the as used to infill the gap (~ 618 m
datataker. Rainfall record at UM w m)
25 Apr – 31 Aug Cable to rain gau ected during Cyclone Monica (see Section 5.1). Rainfall reco ~ 57mm).
ge disconn rd at UM was used to infill the gap (
3 Runoff data Stage height (m) at each gauging station was measur ed at 6-minute intervals by both a pressure transducer and a shaft encoder (Saynor et al 2001). During th e 2005–06 wet season at ET, the shaft encoder was the primary instrument for stage data collection, while the data collected by the pressure transducer were used as back-up. At UM, a shaft encoder was not operated during 2005–06 due to equipm ent failure, therefore, the pressure transducer was the only water level recorder at the station. At SC, a shaft encoder was not operated at the station until 8 March 2006. Therefore, until then, the pressure transducer was the only water level recorder at SC, after which the shaft encoder became the primary instrument for stage data collection.
The stage data measured by either the shaft encoder or the pressure transducer were checked against the true stage of the stream (gauge board) at regular intervals throughout the period of flow (approximately monthly). These checks showed that the instrument readings were generally similar to that at the gauge board. Table 3 shows the similarity between stage measured at the gauge board and that measured by the primary instrument for co ntinuous stage collection at each site during 2005–06.
4
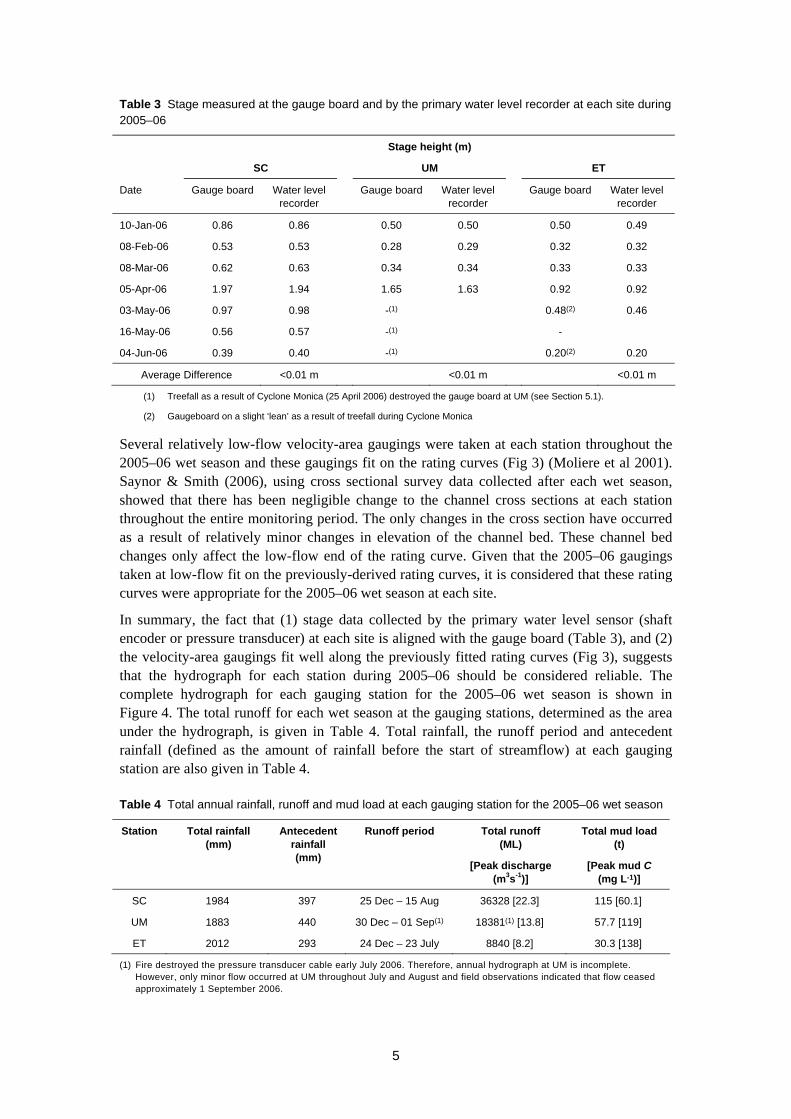
Table 3 Stage measured at the gauge board and by the primary water level recorder at each site during 2005–06
Stage height (m)
SC UM ET
Date Gauge board Water level Gauge board Water level Gauge board Water level recorder recorder recorder
10-Jan-06 0.86 0.86 0.50 0.50 0.50 0.49
08-Feb-06 0.53 0.53 0.28 0.29 0.32 0.32
08-Mar-06 0.62 0.63 0.34 0.34 0.33 0.33
05-Apr-06 1.97 1.94 1.65 1.63 0.92 0.92
03-May-06 0.97 0.98 -(1) 0.48(2) 0.46
16-May-06 0.56 0.57 -(1) -
04-Jun-06 0.39 0.40 -(1) 0.20(2) 0.20
Average Difference <0.01 m <0.01 m <0.01 m
(1) Treefall as a result of Cyclone Monica (25 April 2006) destroyed the gauge board at UM (see Section 5.1).
(2) Gaugeboard on a slight ‘lean’ as a result of treefall during Cyclone Monica
Several relatively low-flow velocity-area gaugings were taken at each station throughout the 2005–06 wet season and these gaugings fit on the rating curves (Fig 3) (Moliere et al 2001). Saynor & Smith (2006), using cross sectional survey data collected after each wet season, showed that there has been negligible change to the channel cross sections at each station throughout the entire monitoring period. The only changes in the cross section have occurred as a result of relatively minor changes in elevation of the channel bed. These channel bed changes only affect the low-flow end of the rating curve. Given that the 2005–06 gaugings taken at low-flow fit on the previously-derived rating curves, it is considered that these rating curves were appropriate for the 2005–06 wet season at each site.
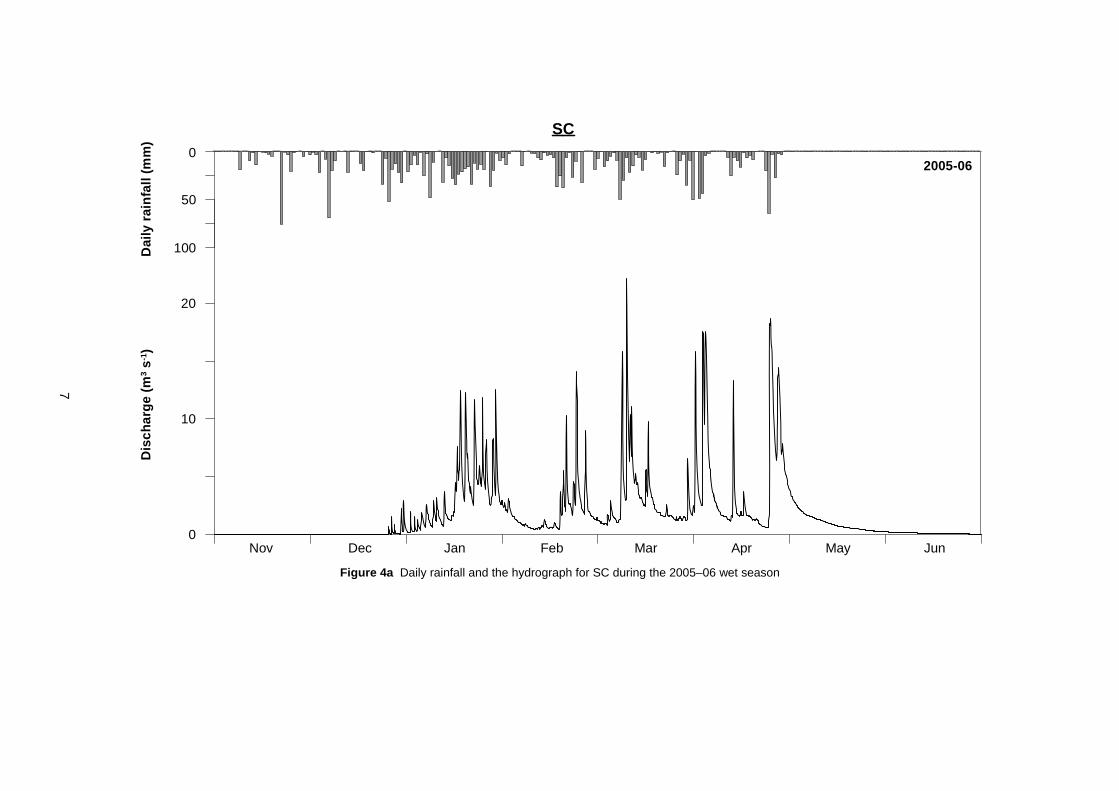
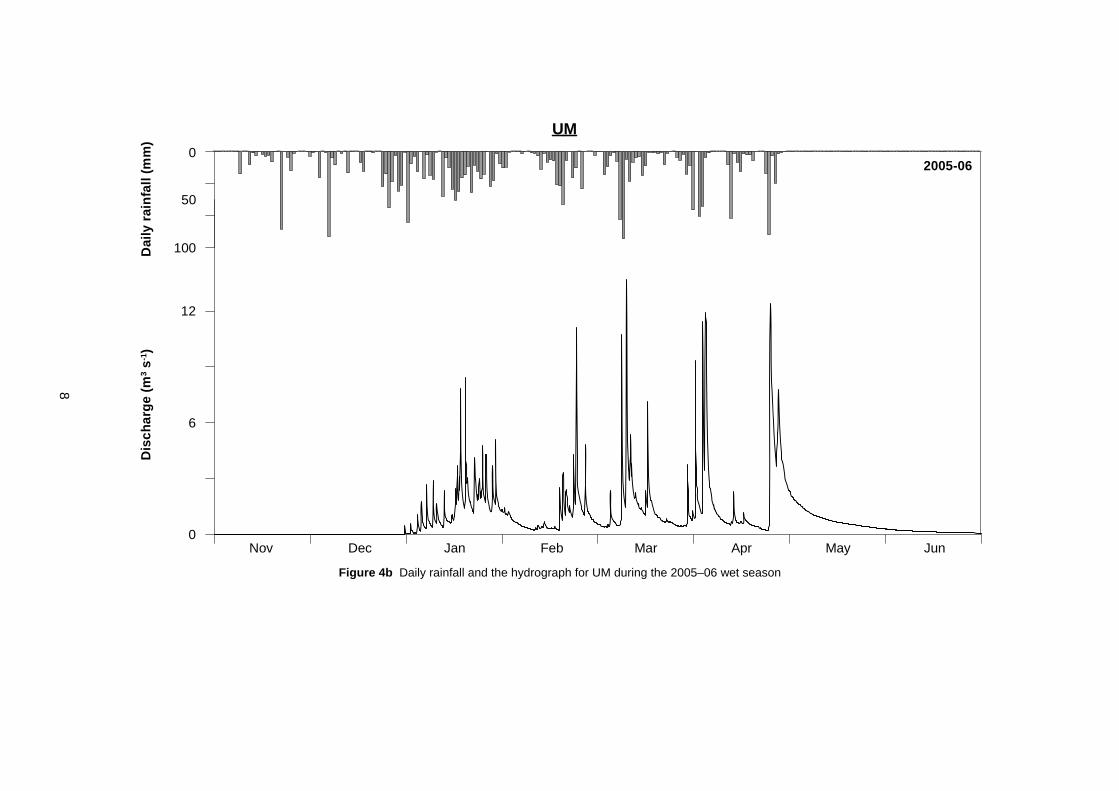
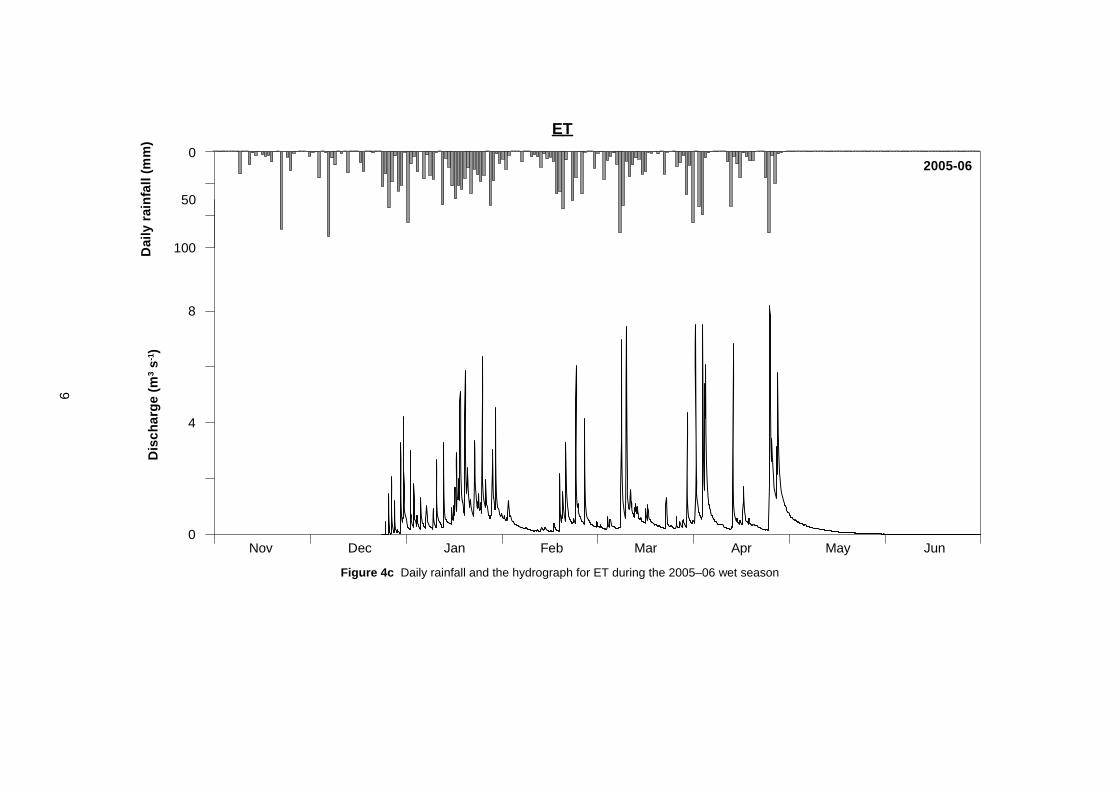
In summary, the fact that (1) stage data collected by the primary water level sensor (shaft encoder or pressure transducer) at each site is aligned with the gauge board (Table 3), and (2) the velocity-area gaugings fit well along the previously fitted rating curves (Fig 3), suggests that the hydrograph for each station during 2005–06 should be considered reliable. The complete hydrograph for each gauging station for the 2005–06 wet season is shown in Figure 4. The total runoff for each wet season at the gauging stations, determined as the area under the hydrograph, is given in Table 4. Total rainfall, the runoff period and antecedent rainfall (defined as the amount of rainfall before the start of streamflow) at each gauging station are also given in Table 4.
Table 4 Total annual rainfall, runoff and mud load at each gauging station for the 2005–06 wet season
Station Total rainfall (mm)
Antecedent rainfall (mm)
Runoff period Total runoff (ML)
[Peak discharge (m3s-1)]
Total mud load (t)
[Peak mud C (mg L-1)]
SC 1984 397 25 Dec – 15 Aug 36328 [22.3] 115 [60.1]
UM 1883 440 30 Dec – 01 Sep(1) 18381(1) [13.8] 57.7 [119]
ET 2012 293 24 Dec – 23 July 8840 [8.2] 30.3 [138]
(1) Fire destroyed the pressure transducer cable early July 2006. Therefore, annual hydrograph at UM is incomplete. However, only minor flow occurred at UM throughout July and August and field observations indicated that flow ceased approximately 1 September 2006.
5
0
0.5
1
1.5
2
2.5
Sta
ge h
eigh
t (m
)
SC
0 5 10 15 20 25
0
0.5
1
1.5
2
2.5
Sta
ge h
eigh
t (m
)
UM
0 4 8 12 16
0
0.4
0.8
1.2
1.6
2
Sta
ge h
eigh
t (m
)
ET
Rating curve
2005-06 gaugings
0 2 4 6 8 10
Discharge (m3 s-1)
Figure 3 Rating curves for SC, UM and ET with the gauging points taken during 2005–06 shown
6
0 2005-06
Dis
char
ge (m
3 s-1)
Dai
ly ra
infa
ll (m
m)
SC
50
100
20
10
0 Nov Dec Jan Feb Mar Apr May Jun
7
Figure 4a Daily rainfall and the hydrograph for SC during the 2005–06 wet season
2005-06
UM D
isch
arge
(m3 s
-1)
Dai
ly ra
infa
ll (m
m)
0
50
100
12
6
0 Nov Dec Jan Feb Mar Apr May Jun
8
Figure 4b Daily rainfall and the hydrograph for UM during the 2005–06 wet season
2005-06
ET D
aily
rain
fall
(mm
) D
isch
arge
(m3 s
-1)
0
50
100
8
4
0 Nov Dec Jan Feb Mar Apr May Jun
9
Figure 4c Daily rainfall and the hydrograph for ET during the 2005–06 wet season
Year
Total rainfall (mm)
[ARI (y)]
Rainfall period Station Antecedent rainfall (mm)
Runoff period Total runoff (ML)
[Peak discharge (m3s-1)]
1998-99 1826 [1:13] 20 Sep – 28 Apr SC 430 9 Dec – 27 May 33665 [22.3]
UM
ET
440
415
12 Dec – 10 Jun
9 Dec – 27 May
15666 [15.0]
7621 [8.5]
1999-00
2047 [1:71]
14 Oct – 24 May
SC
UM
ET
260
305
280
20 Nov – 14 Jul
20 Nov – 20 Jul
20 Nov – 25 Jun
34899 [18.1]
17426 [12.2]
8532 [8.1]
2000-01
1897 [1:21]
14 Oct – 27 Apr
SC
UM
250
250
29 Nov – 14 Jun
3 Dec – 14 Jun
34781 [20.6]
17052 [13.0]
ET 245 28 Nov – 21 May 8275 [8.2]
2001-02
1390 [1:2]
17 Oct – 14 Apr
SC
UM
420
370
31 Dec – 15 Apr
31 Dec – 1 May
14382 [22.0]
7495 [13.6]
ET 330 28 Dec – 25 Apr 3963 [8.3]
2002-03 1769 [1:9] 13 Sep – 1 May SC 225 22 Dec – 7 May 33245 [21.2]
UM
ET
250
355
20 Dec – 1 Jun
1 Jan – 7 May
18101 [12.9]
7249 [8.2]
2003-04 1330 [1:1.6] 7 Oct – 31 May SC 280 21 Dec – 10 Jun 20227 [16.7]
UM
ET
305
190
23 Dec – 10 Jun
21 Dec – 8 May
10608 [12.7]
5605 [7.8]
2004-05 1356 [1:1.7] 20 Nov – 21 Apr SC 255 23 Dec – 20 May 16755 [33.2]
UM
ET
320
240
29 Dec – 20 May
23 Dec – 10 May
8839 [15.2]
4712 [9.0]
2005-06
1936 [1:29]
23 Oct – 29 Apr
SC
UM
ET
395
440
295
25 Dec – 15 Aug
30 Dec – 1 Sep
24 Dec – 23 July
36328 [22.3]
18381 [13.8]
8840 [8.2]
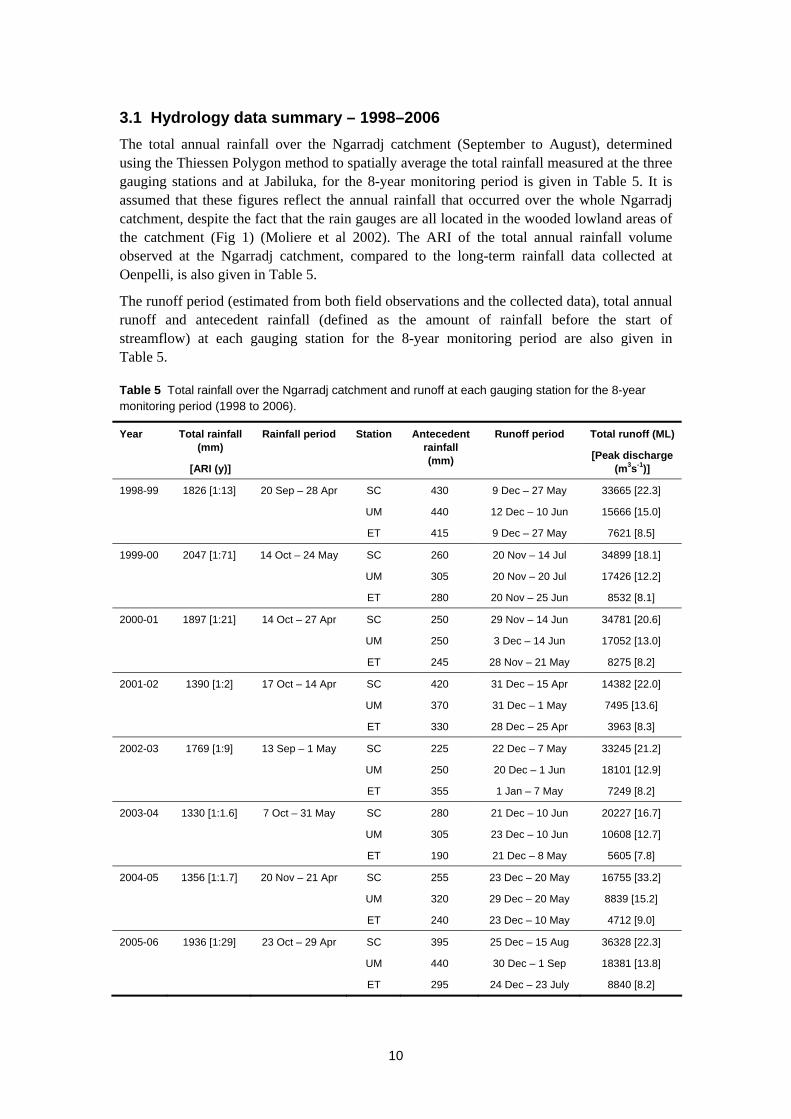
3.1 Hydrology data summary – 1998–2006 The total annual rainfall over the Ngarradj catchment (September to August), determined using the Thiessen Polygon method to spatially average the total rainfall measured at the three gauging stations and at Jabiluka, for the 8-year monitoring period is given in Table 5. It is assumed that these figures reflect the annual rainfall that occurred over the whole Ngarradj catchment, despite the fact that the rain gauges are all located in the wooded lowland areas of the catchment (Fig 1) (Moliere et al 2002). The ARI of the total annual rainfall volume observed at the Ngarradj catchment, compared to the long-term rainfall data collected at Oenpelli, is also given in Table 5.
The runoff period (estimated from both field observations and the collected data), total annual runoff and antecedent rainfall (defined as the amount of rainfall before the start of streamflow) at each gauging station for the 8-year monitoring period are also given in Table 5.
Table 5 Total rainfall over the Ngarradj catchment and runoff at each gauging station for the 8-year monitoring period (1998 to 2006).
10
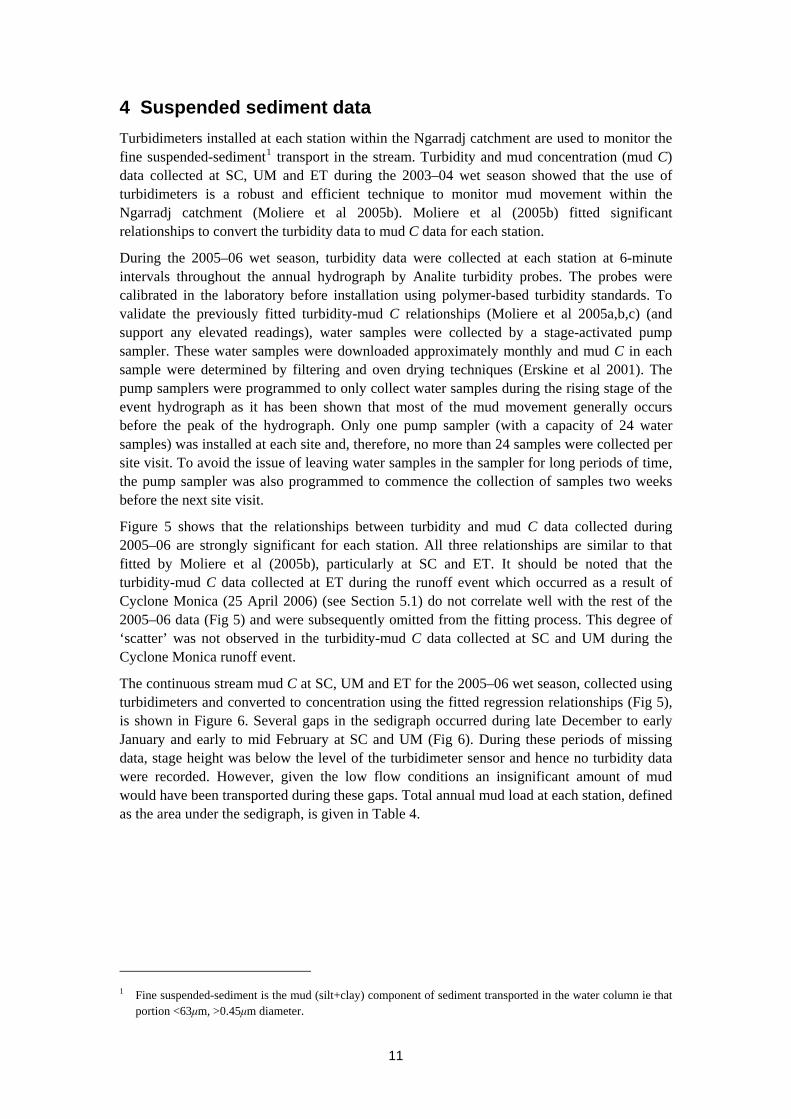
4 Suspended sediment data Turbidimeters installed at each station within the Ngarradj catchment are used to monitor the fine suspended-sediment1 transport in the stream. Turbidity and mud concentration (mud C) data collected at SC, UM and ET during the 2003–04 wet season showed that the use of turbidimeters is a robust and efficient technique to monitor mud movement within the Ngarradj catchment (Moliere et al 2005b). Moliere et al (2005b) fitted significant relationships to convert the turbidity data to mud C data for each station.
During the 2005–06 wet season, turbidity data were collected at each station at 6-minute intervals throughout the annual hydrograph by Analite turbidity probes. The probes were calibrated in the laboratory before installation using polymer-based turbidity standards. To validate the previously fitted turbidity-mud C relationships (Moliere et al 2005a,b,c) (and support any elevated readings), water samples were collected by a stage-activated pump sampler. These water samples were downloaded approximately monthly and mud C in each sample were determined by filtering and oven drying techniques (Erskine et al 2001). The pump samplers were programmed to only collect water samples during the rising stage of the event hydrograph as it has been shown that most of the mud movement generally occurs before the peak of the hydrograph. Only one pump sampler (with a capacity of 24 water samples) was installed at each site and, therefore, no more than 24 samples were collected per site visit. To avoid the issue of leaving water samples in the sampler for long periods of time, the pump sampler was also programmed to commence the collection of samples two weeks before the next site visit.
Figure 5 shows that the relationships between turbidity and mud C data collected during 2005–06 are strongly significant for each station. All three relationships are similar to that fitted by Moliere et al (2005b), particularly at SC and ET. It should be noted that the turbidity-mud C data collected at ET during the runoff event which occurred as a result of Cyclone Monica (25 April 2006) (see Section 5.1) do not correlate well with the rest of the 2005–06 data (Fig 5) and were subsequently omitted from the fitting process. This degree of ‘scatter’ was not observed in the turbidity-mud C data collected at SC and UM during the Cyclone Monica runoff event.
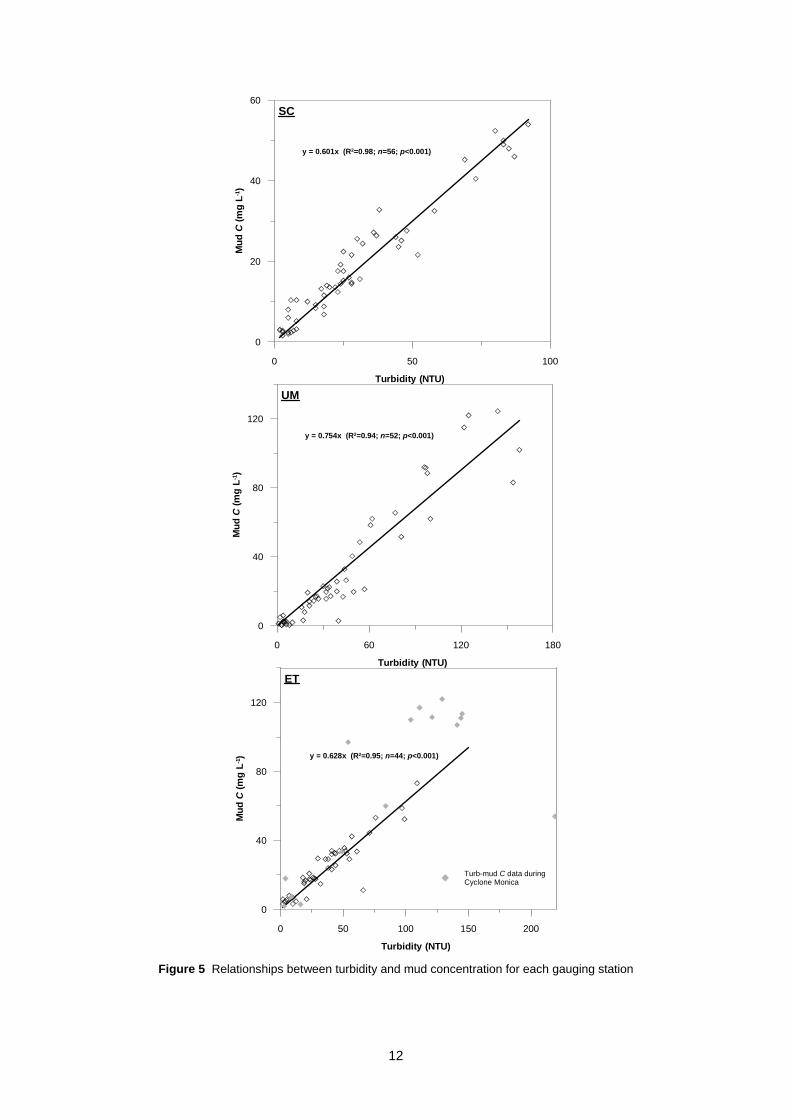
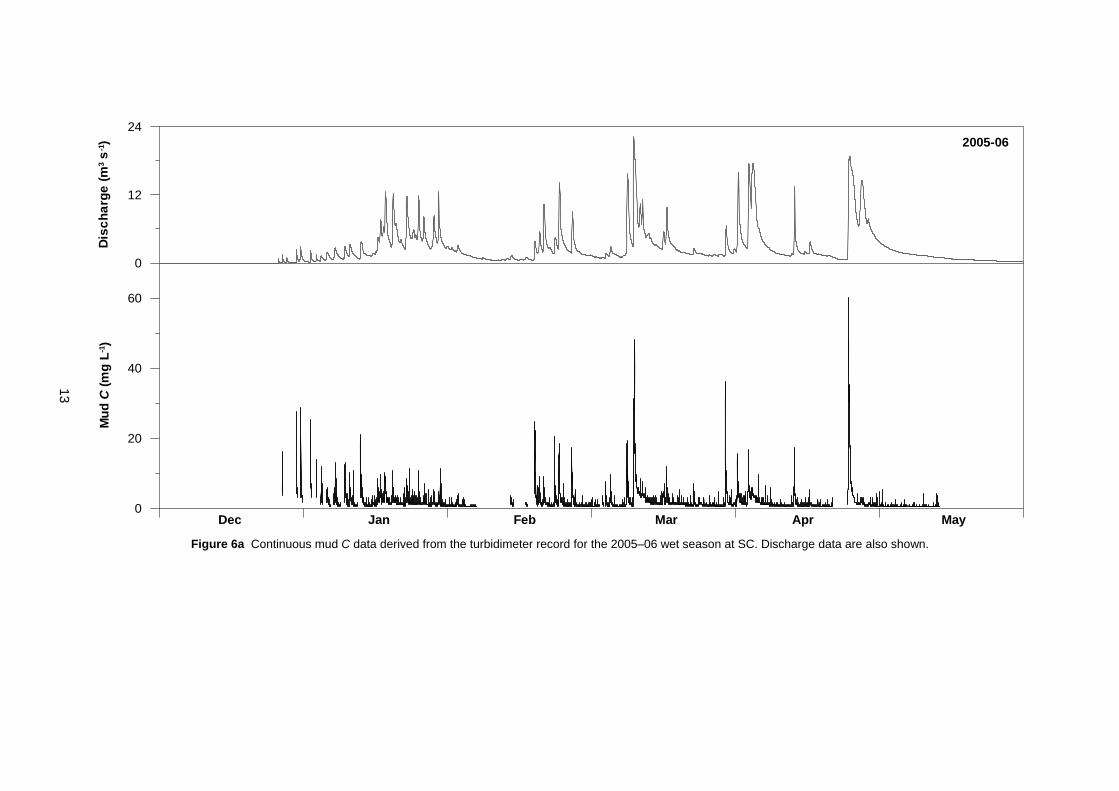
The continuous stream mud C at SC, UM and ET for the 2005–06 wet season, collected using turbidimeters and converted to concentration using the fitted regression relationships (Fig 5), is shown in Figure 6. Several gaps in the sedigraph occurred during late December to early January and early to mid February at SC and UM (Fig 6). During these periods of missing data, stage height was below the level of the turbidimeter sensor and hence no turbidity data were recorded. However, given the low flow conditions an insignificant amount of mud would have been transported during these gaps. Total annual mud load at each station, defined as the area under the sedigraph, is given in Table 4.
Fine suspended-sediment is the mud (silt+clay) component of sediment transported in the water column ie that portion <63μm, >0.45μm diameter.
11
1
0
20
40
60
Mud
C (m
g L-1
)
SC
y = 0.601x (R2=0.98; n=56; p<0.001)
0 50
Turbidity (NTU)
0
40
80
120
Mud
C (m
g L-1
)
UM
y = 0.754x (R2=0.94; n=52; p<0.001)
0 60 120
Turbidity (NTU)
0
40
80
120
Mud
C (m
g L-1
)
Turb-mud C data during Cyclone Monica
ET
y = 0.628x (R2=0.95; n=44; p<0.001)
0 50 100 150 200
Turbidity (NTU)
100
180
Figure 5 Relationships between turbidity and mud concentration for each gauging station
12
Mud
C (m
g L-1
) D
isch
arge
(m3 s
-1)
24
12
0
60
40
20
0 Jan Feb Mar
2005-06
Apr MayDec
13
Figure 6a Continuous mud C data derived from the turbidimeter record for the 2005–06 wet season at SC. Discharge data are also shown.
0
50
100
Mud
C (m
g L-1
)
0
7
14 D
isch
arge
(m3 s
-1 )
Jan Feb Mar
2005-06
Apr MayDec
14
Figure 6b Continuous mud C data derived from the turbidimeter record for the 2005–06 wet season at UM. Discharge data are also shown.
-1
Mud
C (m
g L
)D
isch
arge
(m3 s
-1)
10
5
0
100
50
0 Jan Feb Mar
2005-06
Apr MayDec
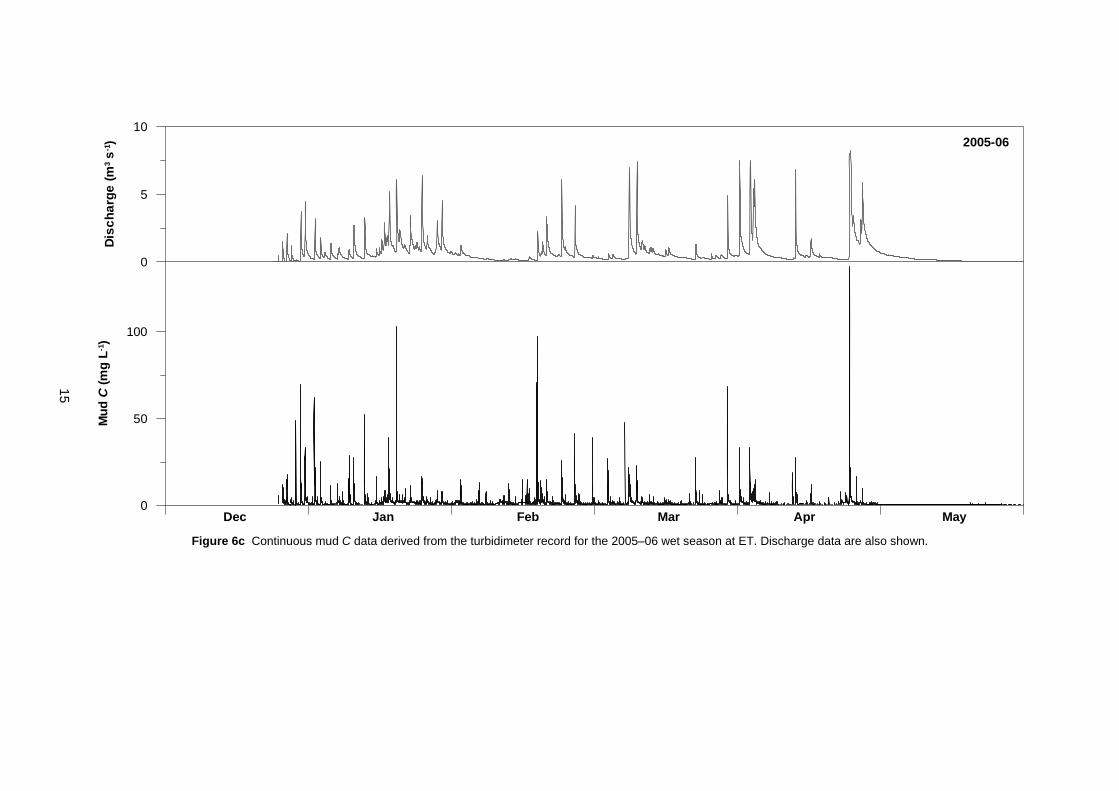
Figure 6c Continuous mud C data derived from the turbidimeter record for the 2005–06 wet season at ET. Discharge data are also shown.
15
Even
t mud
load
ratio
(SC
:UM
+ET)
3
2.5
2
1.5
1
0.5
0
80th percentile
95th percentile
10 Mar 06
Jan-04 Apr-04 Aug-04 Dec-04 Apr-05 Aug-05 Dec-05 Apr-06
Date
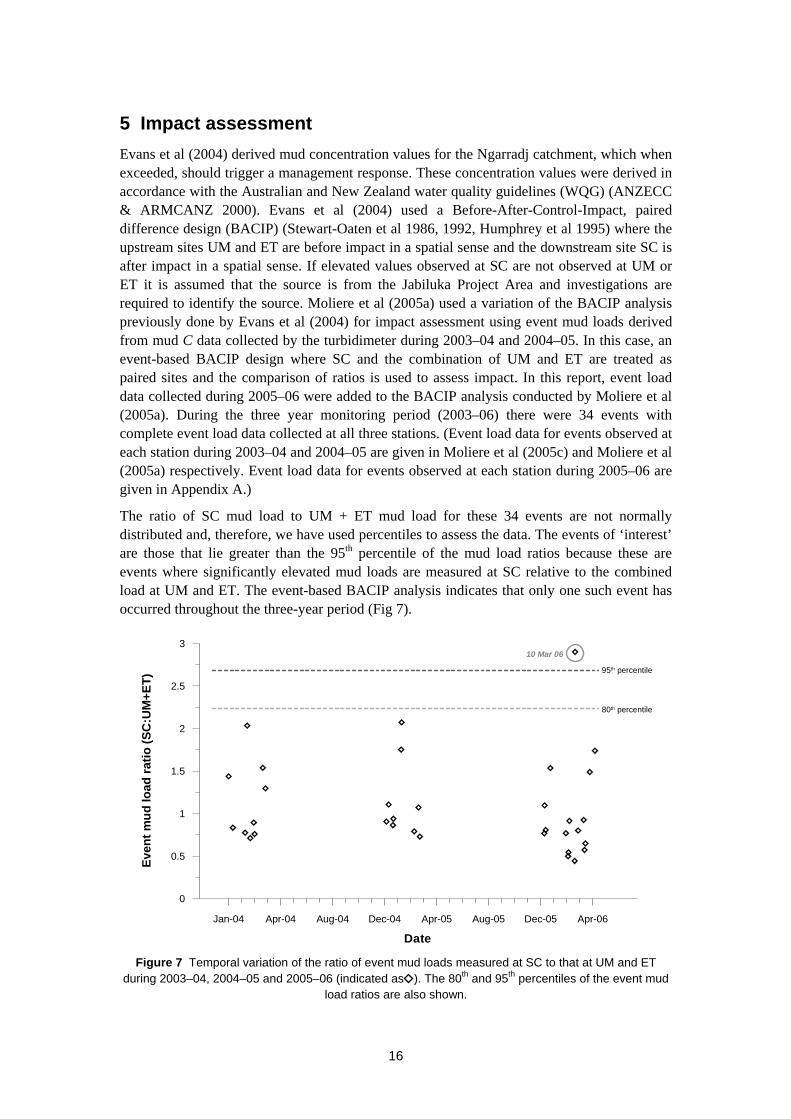
5 Impact assessment Evans et al (2004) derived mud concentration values for the Ngarradj catchment, which when exceeded, should trigger a management response. These concentration values were derived in accordance with the Australian and New Zealand water quality guidelines (WQG) (ANZECC & ARMCANZ 2000). Evans et al (2004) used a Before-After-Control-Impact, paired difference design (BACIP) (Stewart-Oaten et al 1986, 1992, Humphrey et al 1995) where the upstream sites UM and ET are before impact in a spatial sense and the downstream site SC is after impact in a spatial sense. If elevated values observed at SC are not observed at UM or ET it is assumed that the source is from the Jabiluka Project Area and investigations are required to identify the source. Moliere et al (2005a) used a variation of the BACIP analysis previously done by Evans et al (2004) for impact assessment using event mud loads derived from mud C data collected by the turbidimeter during 2003–04 and 2004–05. In this case, an event-based BACIP design where SC and the combination of UM and ET are treated as paired sites and the comparison of ratios is used to assess impact. In this report, event load data collected during 2005–06 were added to the BACIP analysis conducted by Moliere et al (2005a). During the three year monitoring period (2003–06) there were 34 events with complete event load data collected at all three stations. (Event load data for events observed at each station during 2003–04 and 2004–05 are given in Moliere et al (2005c) and Moliere et al (2005a) respectively. Event load data for events observed at each station during 2005–06 are given in Appendix A.)
The ratio of SC mud load to UM + ET mud load for these 34 events are not normally distributed and, therefore, we have used percentiles to assess the data. The events of ‘interest’ are those that lie greater than the 95th percentile of the mud load ratios because these are events where significantly elevated mud loads are measured at SC relative to the combined load at UM and ET. The event-based BACIP analysis indicates that only one such event has occurred throughout the three-year period (Fig 7).
Figure 7 Temporal variation of the ratio of event mud loads measured at SC to that at UM and ET during 2003–04, 2004–05 and 2005–06 (indicated as ). The 80th and 95th percentiles of the event mud
load ratios are also shown.
16

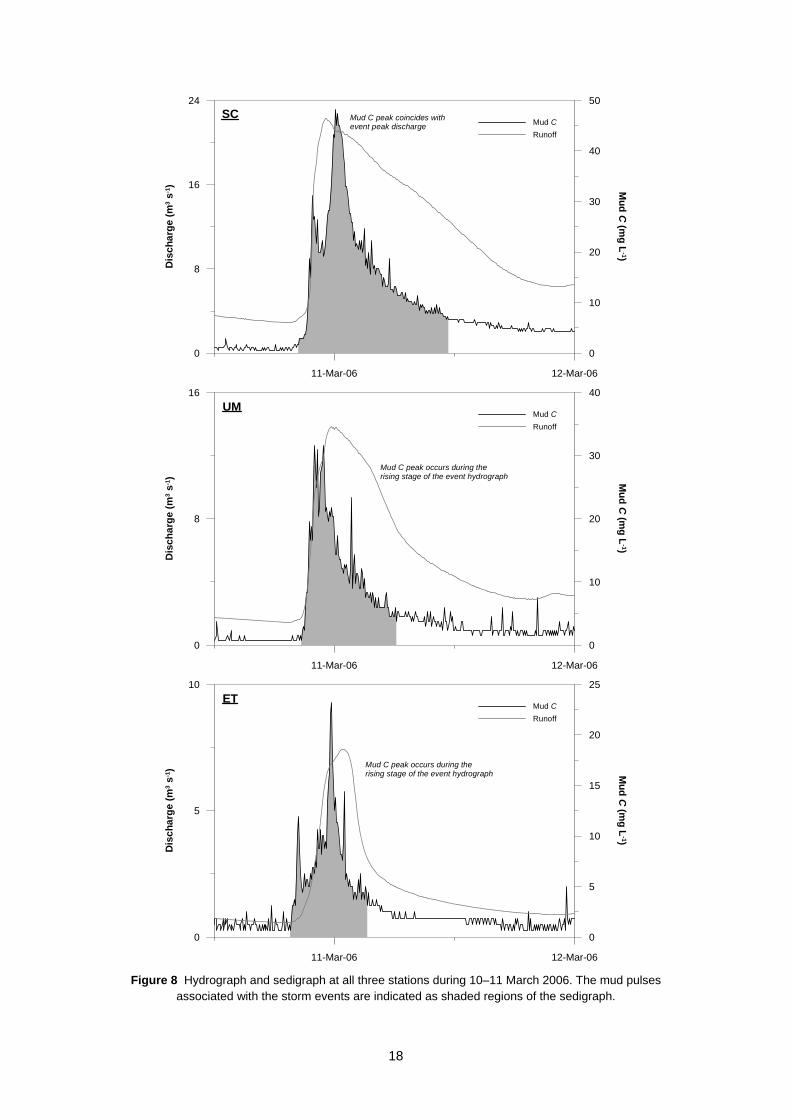
The event that lies above the 95th percentile of the mud load ratios on Figure 7 occurred on 10 March 2006. Peak runoff associated with this event was the highest for 2005–06 at SC and UM (and fourth largest at ET). However, similar to an event which occurred on 4 February 2005 and discussed in Moliere et al (2005a), the mud pulse for this event at SC peaked at about the same time as the hydrograph (Fig 8). It is well documented that the peak of the sedigraph generally peaks before the hydrograph (as shown in Figure 8 at UM and ET). As a result of this ‘shift’ in the timing of the mud C peak at SC, the mud load measured at SC is elevated compared to the load at UM and ET. The total mud load for this event was 15% of the total annual load at SC and only 9% and 4% of the total annual load at UM and ET respectively. It is possible that the contribution of mud load at SC from the ungauged tributaries within the western part of the Ngarradj catchment may have been relatively high during this runoff event and subsequently affected the timing of the sedigraph peak. This highlights the need to monitor flow and mud C on these western tributaries to better assess elevated mud loads observed downstream of Jabiluka compared to the upstream stations, particularly if mining should proceed at Jabiluka.
17
Dis
char
ge (m
3 s-1)
24
16
8
0
Mud C Runoff
SC Mud C peak coincides with event peak discharge
50
40
30
20
10
0
Mud C
(mg L
-1)
11-Mar-06 12-Mar-06
0
8
16
Dis
char
ge (m
3 s -1
)
0
10
20
30
40
Mud C
(mg L
-1)
Mud C Runoff
UM
Mud C peak occurs during the rising stage of the event hydrograph
11-Mar-06 12-Mar-06
0
5
10
Dis
char
ge (m
3 s-1
)
0
5
10
15
20
25
Mud C
(mg L
-1)
Mud C Runoff
ET
Mud C peak occurs during the rising stage of the event hydrograph
11-Mar-06 12-Mar-06
Figure 8 Hydrograph and sedigraph at all three stations during 10–11 March 2006. The mud pulses associated with the storm events are indicated as shaded regions of the sedigraph.
18

5.1 Cyclone Monica Cyclone Monica (Category 3 cyclone) moved through the Ngarradj catchment early on 25 April 2006. Substantial tree fall occurred throughout the catchment as a result of this event, particularly the riparian vegetation along the Ngarradj channel (Fig 9). Approximately 70 mm of rainfall occurred during this storm event which contributed to a relatively large flood event (event details are given in Appendix A). Annual peak mud C occurred during this event at all three stations (Fig 6). However, the rainfall and subsequent flood waters were relatively minor compared to other storm events observed throughout the monitoring period (1998–2006). Most of the immediate damage within the catchment was caused by high wind velocities at a time when the soil was saturated towards the end of the wet season. The damage to, and around, each gauging station is discussed below.
Figure 9 Treefall along Ngarradj and the Jabiluka project area
SC gauging station Relatively minor damage occurred at SC compared to the upstream stations. Fallen trees and branches damaged the solar panel and stretched the cables connecting the solar panel to the station.
19
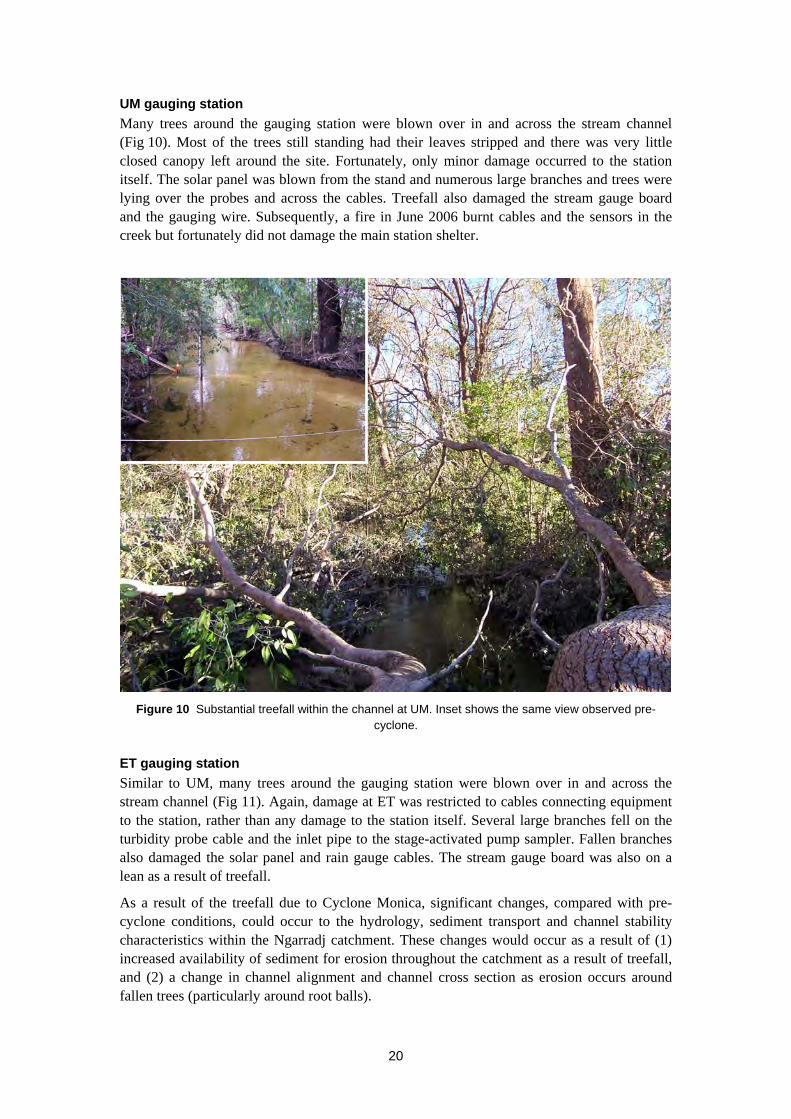
UM gauging station Many trees around the gauging station were blown over in and across the stream channel (Fig 10). Most of the trees still standing had their leaves stripped and there was very little closed canopy left around the site. Fortunately, only minor damage occurred to the station itself. The solar panel was blown from the stand and numerous large branches and trees were lying over the probes and across the cables. Treefall also damaged the stream gauge board and the gauging wire. Subsequently, a fire in June 2006 burnt cables and the sensors in the creek but fortunately did not damage the main station shelter.
Figure 10 Substantial treefall within the channel at UM. Inset shows the same view observed pre-cyclone.
ET gauging station Similar to UM, many trees around the gauging station were blown over in and across the stream channel (Fig 11). Again, damage at ET was restricted to cables connecting equipment to the station, rather than any damage to the station itself. Several large branches fell on the turbidity probe cable and the inlet pipe to the stage-activated pump sampler. Fallen branches also damaged the solar panel and rain gauge cables. The stream gauge board was also on a lean as a result of treefall.
As a result of the treefall due to Cyclone Monica, significant changes, compared with pre-cyclone conditions, could occur to the hydrology, sediment transport and channel stability characteristics within the Ngarradj catchment. These changes would occur as a result of (1) increased availability of sediment for erosion throughout the catchment as a result of treefall, and (2) a change in channel alignment and channel cross section as erosion occurs around fallen trees (particularly around root balls).
20
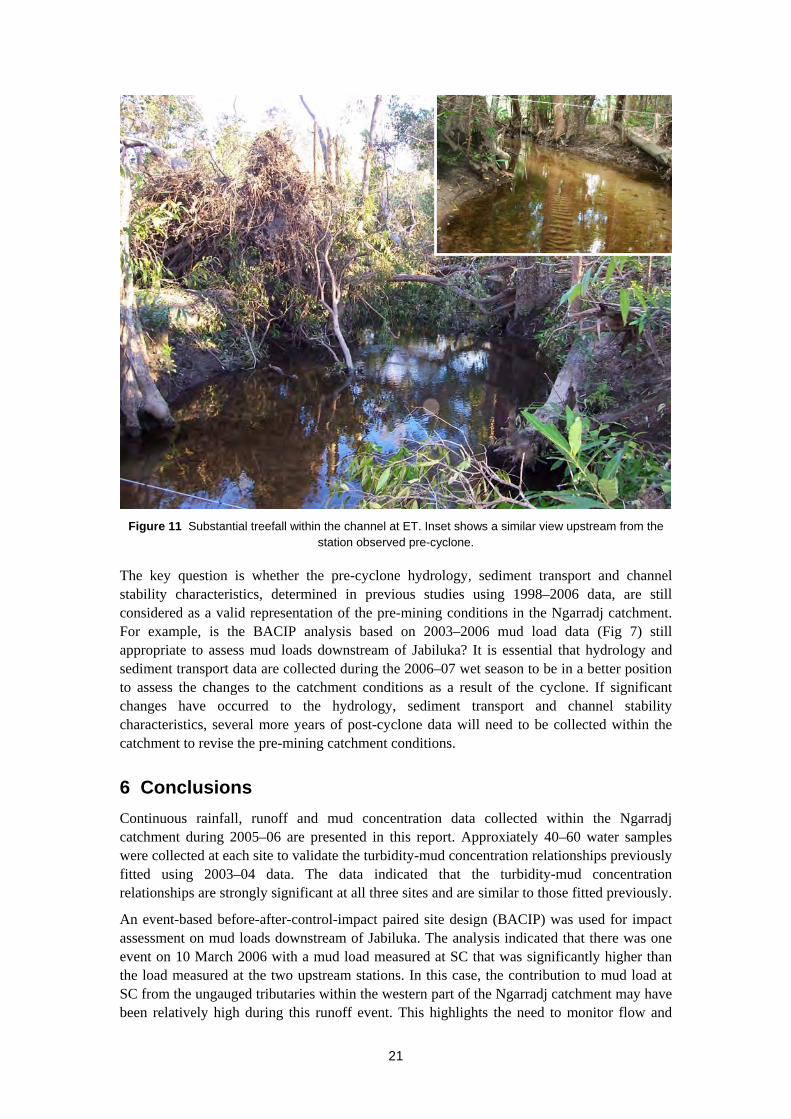
Figure 11 Substantial treefall within the channel at ET. Inset shows a similar view upstream from the station observed pre-cyclone.
The key question is whether the pre-cyclone hydrology, sediment transport and channel stability characteristics, determined in previous studies using 1998–2006 data, are still considered as a valid representation of the pre-mining conditions in the Ngarradj catchment. For example, is the BACIP analysis based on 2003–2006 mud load data (Fig 7) still appropriate to assess mud loads downstream of Jabiluka? It is essential that hydrology and sediment transport data are collected during the 2006–07 wet season to be in a better position to assess the changes to the catchment conditions as a result of the cyclone. If significant changes have occurred to the hydrology, sediment transport and channel stability characteristics, several more years of post-cyclone data will need to be collected within the catchment to revise the pre-mining catchment conditions.
6 Conclusions Continuous rainfall, runoff and mud concentration data collected within the Ngarradj catchment during 2005–06 are presented in this report. Approxiately 40–60 water samples were collected at each site to validate the turbidity-mud concentration relationships previously fitted using 2003–04 data. The data indicated that the turbidity-mud concentration relationships are strongly significant at all three sites and are similar to those fitted previously.
An event-based before-after-control-impact paired site design (BACIP) was used for impact assessment on mud loads downstream of Jabiluka. The analysis indicated that there was one event on 10 March 2006 with a mud load measured at SC that was significantly higher than the load measured at the two upstream stations. In this case, the contribution to mud load at SC from the ungauged tributaries within the western part of the Ngarradj catchment may have been relatively high during this runoff event. This highlights the need to monitor flow and
21
mud C on these western tributaries to better assess elevated mud loads observed downstream of Jabiluka compared to the upstream stations, particularly if mining should proceed at Jabiluka.
It is strongly recommended that hydrology and mud concentration data are collected within the Ngarradj catchment during the 2006–07 wet season to be in a better position to assess any changes to the catchment conditions as a result of Cyclone Monica (25 April 2006). If significant changes have occurred to the hydrology, sediment transport and channel stability characteristics, several more years of post-cyclone data may need to be collected within the catchment to revise the pre-mining catchment conditions.
7 References ANZECC (Australian and New Zealand Environment and Conservation Council) &
ARMCANZ (Agriculture and Resource Management Council of Australia and New Zealand) 2000. Australian Guidelines for Water Quality Monitoring and Reporting. National Water Quality Management Strategy, No. 7, Canberra. 6–17 to 6–21.
Erskine WD, Saynor MJ, Evans KG & Boggs GS 2001. Geomorphic research to determine the off-site impacts of the Jabiluka Mine on Swift (Ngarradj) Creek, Northern Territory. Supervising Scientist Report 158, Supervising Scientist, Darwin.
Evans KG, Moliere DR, Saynor MJ, Erskine WD & Bellio MG 2004. Baseline suspended-sediment, solute, EC and turbidity characteristics for the Ngarradj catchment, Northern Territory, and the impact of mine construction. Supervising Scientist Report 179, Supervising Scientist, Darwin NT.
Humphrey CL, Faith DP & Dostine PL 1995. Baseline requirements for assessment of mining impact using biological monitoring. Australian Journal of Ecology 20, 150–166.
Moliere DR, Evans KG, Saynor MJ & Boggs GS 2001. Hydrology of the Ngarradj catchment, Northern Territory — 1998–1999 and 1999–2000 wet season monitoring: Interim Report. Internal Report 366, Supervising Scientist, Darwin. Unpublished paper.
Moliere DR, Boggs GS, Evans KG, Saynor MJ & Erskine WD 2002. Baseline hydrology characteristics of the Ngarradj catchment, Northern Territory. Supervising Scientist Report 172, Supervising Scientist, Darwin NT.
Moliere DR, Saynor MJ, Evans KG & Smith BL 2005a. Hydrology and suspended sediment of the Ngarradj catchment, Northern Territory: 2004–2005 wet season monitoring. Internal Report 504, August, Supervising Scientist, Darwin. Unpublished paper.
Moliere DR, Saynor MJ & Evans KG 2005b. Suspended sediment concentration-turbidity relationships for Ngarradj – a seasonal stream in the wet-dry tropics. Aust J Water Resources, Engineers Australia, in press.
Moliere DR, Evans KG, Saynor MJ & Smith BL 2005c. Hydrology and suspended sediment of the Ngarradj catchment, Northern Territory: 2003–2004 wet season monitoring. Internal Report 497, February, Supervising Scientist, Darwin. Unpublished paper.
Saynor MJ, Dawson JC, Smith BL, Crisp E & Moliere DR 2001. Installation, maintenance and running of gauging stations in the Swift (Ngarradj) Creek catchment, Northern Territory. Internal Report 384, Supervising Scientist, Darwin. Unpublished paper.
22

Saynor MJ & Smith BL 2006. Cross section, scour chain and particle size data for Gulungul and Ngarradj Creeks 2005. Internal Report 514, February, Supervising Scientist, Darwin. Unpublished paper.
Stewart-Oaten A, Murdoch WW & Parker KR 1986. Environmental impact assessment: ‘Pseudoreplication’ in time? Ecology 67, 929–940.
Stewart-Oaten A, Bence, JR & Osenberg CW 1992. Assessing effects of unreplicated perturbations: No simple solutions. Ecology 73, 1396–1404.
Thiessen AH 1911. Precipitation averages for large areas. Monthly Weather Review 39, 1082– 1084.
23

Appendix A Mud pulse characteristics
24
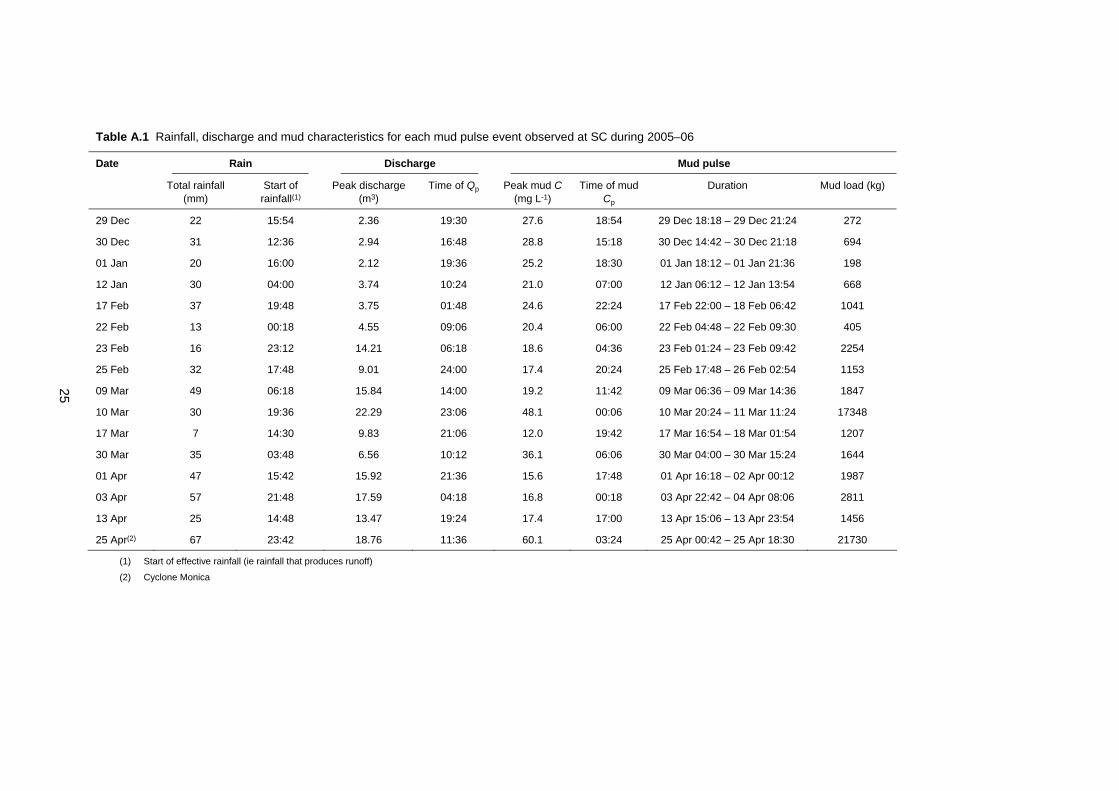
Table A.1 Rainfall, discharge and mud characteristics for each mud pulse event observed at SC during 2005–06
25
Date Rain Discharge Mud pulse
Total rainfall (mm)
Start of rainfall(1)
Peak discharge (m3)
Time of Qp Peak mud C (mg L-1)
Time of mud Cp
Duration Mud load (kg)
29 Dec 22 15:54 2.36 19:30 27.6 18:54 29 Dec 18:18 – 29 Dec 21:24 272
30 Dec 31 12:36 2.94 16:48 28.8 15:18 30 Dec 14:42 – 30 Dec 21:18 694
01 Jan 20 16:00 2.12 19:36 25.2 18:30 01 Jan 18:12 – 01 Jan 21:36 198
12 Jan 30 04:00 3.74 10:24 21.0 07:00 12 Jan 06:12 – 12 Jan 13:54 668
17 Feb 37 19:48 3.75 01:48 24.6 22:24 17 Feb 22:00 – 18 Feb 06:42 1041
22 Feb 13 00:18 4.55 09:06 20.4 06:00 22 Feb 04:48 – 22 Feb 09:30 405
23 Feb 16 23:12 14.21 06:18 18.6 04:36 23 Feb 01:24 – 23 Feb 09:42 2254
25 Feb 32 17:48 9.01 24:00 17.4 20:24 25 Feb 17:48 – 26 Feb 02:54 1153
09 Mar 49 06:18 15.84 14:00 19.2 11:42 09 Mar 06:36 – 09 Mar 14:36 1847
10 Mar 30 19:36 22.29 23:06 48.1 00:06 10 Mar 20:24 – 11 Mar 11:24 17348
17 Mar 7 14:30 9.83 21:06 12.0 19:42 17 Mar 16:54 – 18 Mar 01:54 1207
30 Mar 35 03:48 6.56 10:12 36.1 06:06 30 Mar 04:00 – 30 Mar 15:24 1644
01 Apr 47 15:42 15.92 21:36 15.6 17:48 01 Apr 16:18 – 02 Apr 00:12 1987
03 Apr 57 21:48 17.59 04:18 16.8 00:18 03 Apr 22:42 – 04 Apr 08:06 2811
13 Apr 25 14:48 13.47 19:24 17.4 17:00 13 Apr 15:06 – 13 Apr 23:54 1456
25 Apr(2) 67 23:42 18.76 11:36 60.1 03:24 25 Apr 00:42 – 25 Apr 18:30 21730
(1) Start of effective rainfall (ie rainfall that produces runoff)
(2) Cyclone Monica
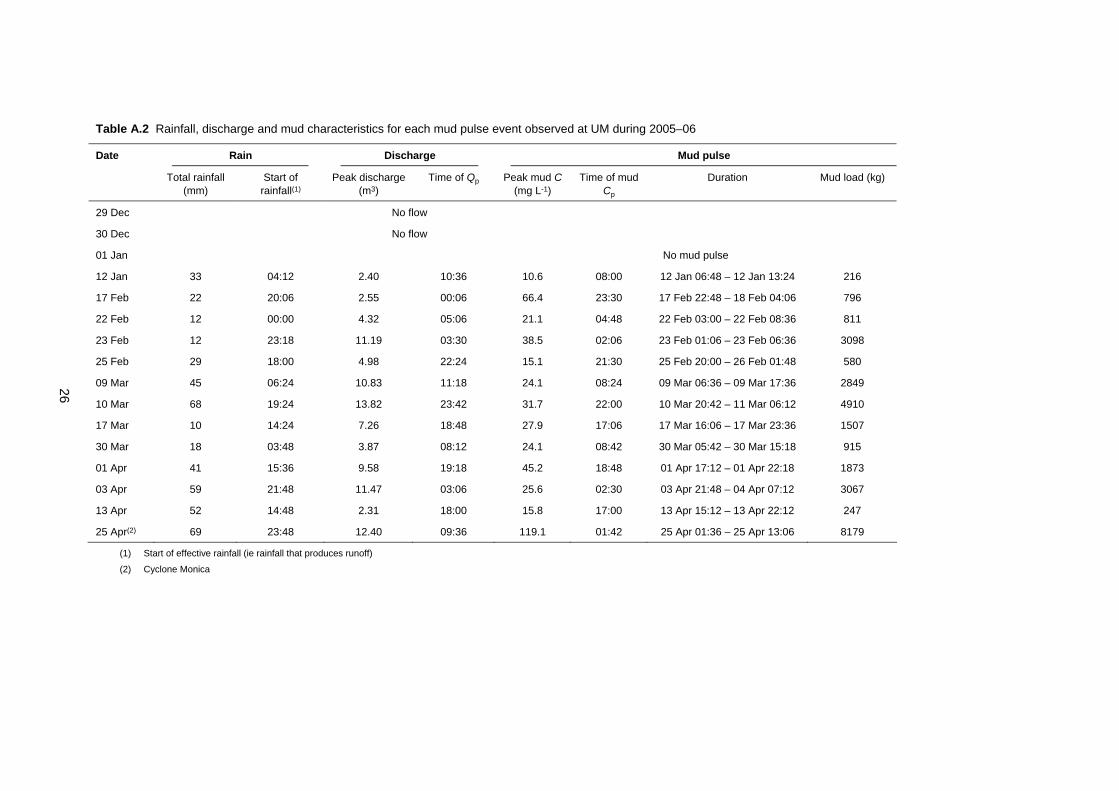
Table A.2 Rainfall, discharge and mud characteristics for each mud pulse event observed at UM during 2005–06
26
Date Rain Discharge Mud pulse
Total rainfall (mm)
Start of rainfall(1)
Peak discharge (m3)
Time of Qp Peak mud C (mg L-1)
Time of mud Cp
Duration Mud load (kg)
29 Dec No flow
30 Dec No flow
01 Jan No mud pulse
12 Jan 33 04:12 2.40 10:36 10.6 08:00 12 Jan 06:48 – 12 Jan 13:24 216
17 Feb 22 20:06 2.55 00:06 66.4 23:30 17 Feb 22:48 – 18 Feb 04:06 796
22 Feb 12 00:00 4.32 05:06 21.1 04:48 22 Feb 03:00 – 22 Feb 08:36 811
23 Feb 12 23:18 11.19 03:30 38.5 02:06 23 Feb 01:06 – 23 Feb 06:36 3098
25 Feb 29 18:00 4.98 22:24 15.1 21:30 25 Feb 20:00 – 26 Feb 01:48 580
09 Mar 45 06:24 10.83 11:18 24.1 08:24 09 Mar 06:36 – 09 Mar 17:36 2849
10 Mar 68 19:24 13.82 23:42 31.7 22:00 10 Mar 20:42 – 11 Mar 06:12 4910
17 Mar 10 14:24 7.26 18:48 27.9 17:06 17 Mar 16:06 – 17 Mar 23:36 1507
30 Mar 18 03:48 3.87 08:12 24.1 08:42 30 Mar 05:42 – 30 Mar 15:18 915
01 Apr 41 15:36 9.58 19:18 45.2 18:48 01 Apr 17:12 – 01 Apr 22:18 1873
03 Apr 59 21:48 11.47 03:06 25.6 02:30 03 Apr 21:48 – 04 Apr 07:12 3067
13 Apr 52 14:48 2.31 18:00 15.8 17:00 13 Apr 15:12 – 13 Apr 22:12 247
25 Apr(2) 69 23:48 12.40 09:36 119.1 01:42 25 Apr 01:36 – 25 Apr 13:06 8179
(1) Start of effective rainfall (ie rainfall that produces runoff)
(2) Cyclone Monica
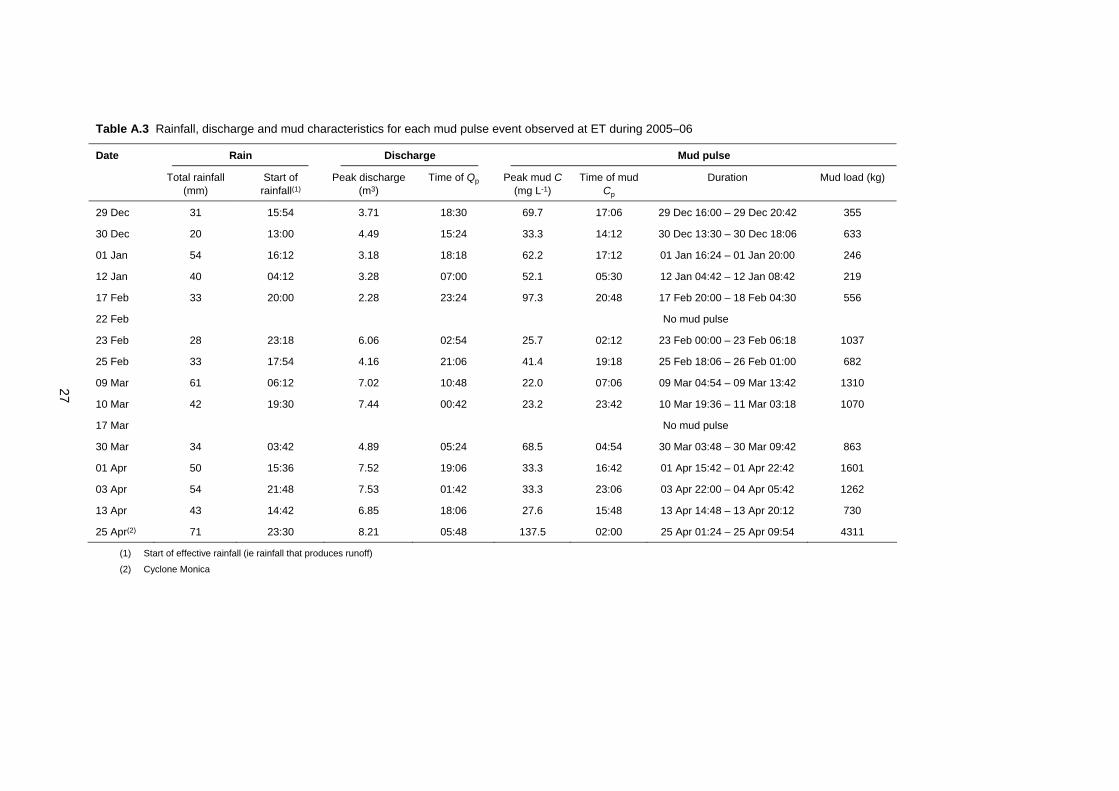
Table A.3 Rainfall, discharge and mud characteristics for each mud pulse event observed at ET during 2005–06
27
Date Rain Discharge Mud pulse
Total rainfall (mm)
Start of rainfall(1)
Peak discharge (m3)
Time of Qp Peak mud C (mg L-1)
Time of mud Cp
Duration Mud load (kg)
29 Dec 31 15:54 3.71 18:30 69.7 17:06 29 Dec 16:00 – 29 Dec 20:42 355
30 Dec 20 13:00 4.49 15:24 33.3 14:12 30 Dec 13:30 – 30 Dec 18:06 633
01 Jan 54 16:12 3.18 18:18 62.2 17:12 01 Jan 16:24 – 01 Jan 20:00 246
12 Jan 40 04:12 3.28 07:00 52.1 05:30 12 Jan 04:42 – 12 Jan 08:42 219
17 Feb 33 20:00 2.28 23:24 97.3 20:48 17 Feb 20:00 – 18 Feb 04:30 556
22 Feb No mud pulse
23 Feb 28 23:18 6.06 02:54 25.7 02:12 23 Feb 00:00 – 23 Feb 06:18 1037
25 Feb 33 17:54 4.16 21:06 41.4 19:18 25 Feb 18:06 – 26 Feb 01:00 682
09 Mar 61 06:12 7.02 10:48 22.0 07:06 09 Mar 04:54 – 09 Mar 13:42 1310
10 Mar 42 19:30 7.44 00:42 23.2 23:42 10 Mar 19:36 – 11 Mar 03:18 1070
17 Mar No mud pulse
30 Mar 34 03:42 4.89 05:24 68.5 04:54 30 Mar 03:48 – 30 Mar 09:42 863
01 Apr 50 15:36 7.52 19:06 33.3 16:42 01 Apr 15:42 – 01 Apr 22:42 1601
03 Apr 54 21:48 7.53 01:42 33.3 23:06 03 Apr 22:00 – 04 Apr 05:42 1262
13 Apr 43 14:42 6.85 18:06 27.6 15:48 13 Apr 14:48 – 13 Apr 20:12 730
25 Apr(2) 71 23:30 8.21 05:48 137.5 02:00 25 Apr 01:24 – 25 Apr 09:54 4311
(1) Start of effective rainfall (ie rainfall that produces runoff)
(2) Cyclone Monica


![Modelling Spatiotemporal Dynamics of Large Wood ... · from tributary catchments into the main river channel [45,50–53]. Moreover, small mountain torrents, wide gravel-bed rivers,](https://img.pdfslide.net/doc/110x75/5f5c64586acae929b43f35a4/modelling-spatiotemporal-dynamics-of-large-wood-from-tributary-catchments-into.jpg)