Embed Size (px)
Citation preview

AbstractArtificial Neural Network (ANN) and Support Vector Machine
(SVM) approaches have been on the cutting edge of science and technology for pattern recognition and data classification. In the ANN model, classification accuracy can be achieved by using the feed-forward of inputs, back-propagation of errors, and the adjustment of connection weights. In conjunction with the computational shortcut of kernel functions, the SVM classifier maps input data from the input space into the high-dimensional feature space, and seeks an optimal hyperplane to separate data from different classes. Both ANN and SVM machine learning algorithms can be used to establish nonlinear relationships between variables and rank the importance of variables, thereby, contributing to the effectiveness of medical curriculum assessment. The purpose of this investigation is to shed light on how to construct the most suitable ANN and SVM curriculum assessment models based on student perceptions. These are then compared with logistic regression. Participants were 216 graduating medical students, representing a 90% response rate, each of whom took part in a survey in years 2006, 2007, or 2008. The outcome variable of interest was student satisfaction or dissatisfaction with the overall basic science curriculum. Twelve independent variables included student agreement that the basic science curriculum is responsive to student feedback, open to innovation, well-coordinated, and integrated to prepare future physicians for complex clinical problem-solving. Important variables found in the ANN and SVM models were highly significant for curriculum assessment and development. These results were consistent with the logistic regression model. Moreover, the classification accuracy of the ANN and SVM were compared to the logistic regression model based on criteria of sensitivity, specificity, combined accuracy, and the F-measure. It
Using Advanced Tools, Techniques, and Methodologies
IR ApplicationsVolume 29, December 15, 2010
©Copyright 2010, Association for Institutional Research
Supporting quality data and decisions for higher education.
Chau-Kuang ChenMeharry Medical College
Curriculum Assessment Using Artificial Neural Network and Support Vector Machine Modeling Approaches: A Case Study

is evident that the resulting models of the ANN and SVM have demonstrated the model applicability, validity, and accuracy for curriculum assessment. Therefore, the researcher recommends ANN and SVM modeling approaches be applied to curriculum assessment in institutions of higher education.
IntroductionCurriculum assessment is a process of collecting,
analyzing, and utilizing data from various sources to improve student learning and development (Wolf, Hill, & Evers, 2006). This assessment provides a strong rationale for securing curriculum change and helps administrators and faculty make effective decisions about program content (Epstein, 2007). A reasonable and workable curriculum assessment model should be able to help medical students identify and respond to their own learning needs, and improve their overall satisfaction. An additional purpose for curriculum assessment is to demonstrate accountability reporting to meet the accreditation mandates.
U.S. medical schools and accrediting agencies have made efforts to provide reliable and valid assessments of student competence since the 1990s (Epstein & Hundert, 2002; Leung, 2002). These assessments include, but are not limited to, written examinations, multiple-choice questions, and standardized patients, which directly measure student performances and provide direction for future learning. The written examinations are in the open-ended format, encompassing rich descriptions of the clinical context related to clinical practice (Schuwirth, Verheggen, van der Vleuten, Boshuizen, & Dinant, 2001). Multiple-choice questions are commonly used for assessment in multidiscipline areas that can be analyzed quantitatively (Schuwirth, van der Vleuten, & Donkers, 1996). Lastly, standardized patients are faculty and staff evaluators who are trained to portray patients during an interview and physical examination with medical students and are incorporated into the objective structured clinical examinations (OSCEs; Hodges & McIlroy, 2003). The OSCEs have been part of the assessment process for clinical performance in medical schools in the last decade.
All methods of curriculum assessment have strengths and limitations. The use of different assessment methods can overcome many limitations of an individual assessment (Epstein, 2007). The questionnaire surveys can serve as an assessment tool to gather information on student satisfaction with program issues and perceptions for curriculum quality, and continuous program improvement. Students need to be active partners in curriculum assessment. The wide variety of information that can be collected is part of the appeal of student surveys (Palomba & Banta, 1999). Student surveys help achieve many elements of educational practice, and they help create high expectation for students and create opportunities for active learning. In addition to using multiple methods of assessment, researchers in medical education should be mindful of the impact of assessment on students.
To fulfill its mission in providing excellent health science education for its students, Meharry Medical College has implemented a policy of curriculum assessment. This policy is an integral part of the process to monitor and improve the curriculum and quality of instruction (Meharry Medical College, 2004). The basic science curriculum assessment began when an organ system structure made up of 11 major systems (e.g., muscular, nervous, digestion) was developed from a traditional discipline-based curriculum in 2004. The student evaluations of the medical curriculum consider clarity and accomplishment of objectives, organization of the course content, relevance of examination to course content, and contribution of the curriculum to student professional development. Student perceptions of the overall strengths and weaknesses of the medical curriculum as well as suggestions for improvements were solicited.
Medicine is a discipline that brings basic scientific knowledge full circle from basic science course teaching and learning through applied clinical practice. To succeed in medical school, it is important for medical students to understand different facets of human disease processes such as treatment, drug indications and side effects, as well as effects on other organ systems, etiology of
Page 2 IR Applications, Number 29, Curriculum Assessment Using Artificial Neural Network

disease, and prevention. Medical school curriculum must be well-coordinated and integrated to prepare future physicians for clinical problem-solving that requires the coordination and integration of basic scientific knowledge. Before medical students are even allowed to experience and excel in the clinical side of medicine, they must first succeed in the two didactic years that focus on longitudinal courses, attempting to integrate learning about specific organ systems and diseases (e.g., Infection, Immunity, Inflammation) which has replaced traditional courses (e.g., Anatomy, Physiology, Pathology). Thus, it is crucial for basic science curriculum to offer adequate scientific knowledge throughout the didactic years with students being assessed both by internal discipline examinations and also external standardized tests such as National Board of Medical Examiner (NBME), subject board (comprehensive exam), and the U.S. Medical Licensing Examination (USMLE) Step 1.
Strong basic science knowledge is tested repeatedly throughout the medical school curriculum with the NBME subject board examinations and the USMLE scores, which uses basic science knowledge to assess students’ understanding of medical concepts that are heavily weighted to determine students’ clerkship and residency placement. Test scores on the NBME subject boards and the USMLE scores are used to assess students’ capacity to explore some of the most complex and competitive medical specialties. Meharry has chosen to make subject board examinations mandatory for all medical students in order to better prepare them for the USMLE Step 1. Passing each class is contingent upon passing the corresponding NBME subject board examination. Therefore, it is vital for courses in the basic science disciplines to sufficiently prepare students for the subject board examinations.
Meharry’s new curriculum and curriculum assessment policy provide the empirical precedent for the present investigation. This study sought to examine the functional relationship between the overall student satisfaction of a basic science curriculum and the following variables: basic science curriculum being well-coordinated and
integrated; offering student adequate scientific knowledge; and preparing students well for the subject board examinations. Artificial Neural Network (ANN) and Support Vector Machine (SVM) models were used to assess the satisfaction of the students with the medical school curriculum for the College based on graduating student questionnaires. ANN and SVM models are machine learning algorithms, which can play a crucial role in handling multidimensional data for curriculum assessment. In constructing ANN and SVM models, the following question should be raised: “How well does a model demonstrate applicability and validity?” Part of this answer was addressed by using logistic regression analysis, a generalized linear modeling approach, as a benchmarking model. It is the intent of this paper to provide a conceptual framework and practical application of ANN and SVM methods for curriculum assessment, a summary of the assessment results, and a brief discussion of the strengths and limitations of the methodologies.
Usefulness of the ANN and SVM ModelsANN is becoming more popular in scientific
research for pattern recognition and data classification. This network has been used in many different fields such as business, economics, computer sciences, engineering, and medicine (Bernhard, 2001; Chen & Shih, 2006; Dawson & Wilby, 1998; Reich, Gomez, & Dawidowski, 1999; Ronco, 1999; Sargent, 2001; Sordo, 2002). It is an information processing paradigm inspired by the function of the human brain (Freeman & Skapura, 1991; Hinton, 1992; Zutada, 1992). The network consists of many processing units (neurons or nodes) that are linked together and embedded in the input, hidden, and output layers. These links multiply the neurons of the input and hidden layers by an individual weighting factor, which is a value analogous to the connection strength at a synapse (Dreiseitl & Ohno-Machado, 2002; Freeman & Skapura, 1991). The synaptic process of the ANN stores the knowledge needed to solve specific problems.
The state-of-the-art SVM classifier was originally introduced by Vapnik (1995) and was promoted
Page 3 IR Applications, Number 29, Curriculum Assessment Using Artificial Neural Network

in text categorization and image classification (Cristianini & Shawe-Taylor, 2000; Joachims, 1998). It is a machine learning method operated on the principle of structural risk minimization that is designed to minimize true risk of misclassifying examples during the model training (Vapnik, 1995). True risk is a function of the empirical risk (average error committed by training function on testing data) and the complexity of the training function (Takeuchi & Collier, 2005). SVM has been successfully implemented for data classification in many fields such as finance, biology, engineering, and health sciences (Burges, 1998; Cao & Tay, 2001; Hua & Sun, 2001; Luo, Wu, Guo, & Ye, 2008; Schoelkopf, Burges, & Smola, 1999; Shin, Lee, & Kim, 2005; Zeng, Xu, Gu, Liu, & Xu, 2008). The SVM classifier has its advantage in the practical application for small samples and generalization because of structural risk minimization (Vapnik, 1999; Wan & Campbell, 2008; Zeng, et al., 2008). It can be used to perform data separation effectively by finding the optimal separating plane so as to maximize the margin, a distance between the hyperplane and the nearest data points (support vector; Cristianini & Shawe-Taylor, 2000; Min & Lee, 2005; Mitia & Hayastu, 2006). In addition, the SVM can be applied to the classification of multiple categories as multinomial logistic regression analysis and the prediction of continuous outcome variables as multiple linear regression analysis (Cristianini & Shawe-Taylor, 2000).
Fundamentally, the ANN and SVM models are adaptive learning algorithms used to establish nonlinear relationships among inputs (attributes) and outputs (targets; Cortes & Vapnik, 1995; Fausett, 1994; Haykin, 1999). The inputs contain data points corresponding to the values of independent variables, whereas the outputs represent categorical data corresponding to each class of dependent variables. Activation functions are readily available to describe the relationship between neurons of individual and successive layers for the ANN models, while kernel functions in the SVM models give the weights of the nearby data points in making an estimate and calculate the inner product to increase high dimension for easy separation of
different classes. Activation and kernel functions are mathematical algorithms that allow models to be properly transformed to establish nonlinear relationships among variables. The network topology and learning algorithm of the ANN and SVM models are adapted and changed, which are geared towards problem-solving (Abraham & Nath, 2001). Meanwhile, the important inputs in relation to outputs can be identified, ranked, and interpreted without the requirement of statistical assumptions such as normality and independence. Both ANN and SVM models perform cross-validation to obtain a more reliable estimate of model error to achieve a greater accuracy of data classification. The ANN model can be developed from the training dataset including 70% of the data examples and evaluated by the test data including the remaining 30% of the dataset (SPSS, Inc., 2008). In the SVM model, the training examples are first partitioned into several subsets of equal size called folds. One fold is then tested using the remaining folds of the model being trained (Cortes & Vapnik, 1995).
Primarily in education, the ANN model has been adopted to accurately predict student success in the Master of Business Administration (MBA) program. It was used to classify student applicants into successful and marginal student pools based on undergraduate grade-point average (GPA), Graduate Management Admission Test (GMAT) scores, undergraduate major, and other relevant information (Naik & Rogothaman, 2004). The ANN model correctly classified 93% of the successful students and 81% of the marginal students, with an overall classification accuracy of 89%. This study result demonstrated that the ANN model performed as well as previous statistical models used. In another study, the ANN and discriminant function models were used to classify student applicants into one of the five categories, ranging from “FLOP (class five)” to “TOP (class one)” of technical colleges in northern India (Puri & Kohli, 2007). The ANN model was shown to excel over the discriminant analysis in modeling the complex interaction variables. A neural network model also performed as well as a linear regression model in predicting the rank order of residency applicants in
Page 4 IR Applications, Number 29, Curriculum Assessment Using Artificial Neural Network

an emergency medical program based on medical school grades, autobiography, interviews, letters of recommendation, and National Board scores (Pilon & Tandberg, 1997).
The SVM model also has been useful in education. For instance, it was implemented to predict if a student candidate would be admitted to the School of Physical Education when the physical ability test score was collected beforehand (Acikkar & Akay, 2009). The classification accuracy of 97% and 91% in 2006 and 2007, respectively, demonstrated that the SVM classifier was a promising tool for applicant screening. In addition, the SVM model could classify data in order to predict students’ performance as well as compare the prediction with the students’ midterm examination grades (Huang, Chu, & Guan, 2007). By training one particular domain and leading to a better model performance, the SVM’s feature selection procedure has enhanced the results of a study in a simplified manner and outperformed the Lexile method in dealing with reading assessments for disabled children (Wu, Huang, & Meng, 2008).
With the exception of student application areas however, ANN and SVM have not been popular in education. However, they are promising research tools by virtue of their ability to address the possibly nonadditive and nonlinear issue of curriculum assessment. The ANN and SVM models are powerful for the problem characterized by nonlinearity, high dimension, and capability of learning. In particular, SVM is known for its application of problem-solving by small sample and capability of generalization (Haykin, 1999; Sunn, 1998). Both modeling approaches were used in this study to investigate their possible unique contribution to college curriculum assessment.
Overview of the ANN Model ANN techniques include, but are not limited to,
Radial basis function network and Feed-forward neural network. The Radial basis function network technique uses radial basis functions as activation functions for interpolation in multidimensional space. These functions are built into a distance criterion with respect to a center. The Feed-forward
neural network is the first and simplest type of artificial neural network formulated. In this network, the information flows in only one forward direction from the input layer neurons, through the hidden layer neurons, and to the output layer neurons. There are no cycles or loops in the network. In Multilayer Perceptron (MLP), the generalized feed-forward network is modified to use two or more layers with nonlinear activation functions; it is more powerful than the previously described method in that it can distinguish data that are not linearly separable. The ANN model used in this study is MLP with a back-propagation algorithm generated by the Statistical Package for Social Sciences (SPSS).
MLP consists of processing units and connection weights that are embedded in input, hidden, and output layers (Freeman & Skapura, 1991; SPSS, Inc., 2008). The input layer does not perform processing, but simply feeds data into the network. Actual processing of information in the ANN occurs in the neurons of the hidden and output layers. This process is accomplished with activation functions that describe nonlinear relationships between input layer neurons and hidden layer neurons, and nonlinear relationship between hidden layer neurons and output layer neurons. On one hand, the activation functions, such as hyperbolic tangent and sigmoid, are mathematically differentiable as a part of the model architecture in the input and hidden layers. On the other hand, the same activation functions plus softmax and identity, which are also mathematically differentiable, may be chosen in the hidden and output layers to ensure easy training.
In the MLP model, data in the input layer are processed through successive neurons in a forward direction on a layer-by-layer basis during the feed-forward stage as shown in Figure 1. First, the MLP converts inputs (Xs) into the outputs (Os), based on the transformation function; Ok = f[∑Wkj, f(∑WjiXi)], where i, j, and k index the ith input , jth hidden, and kth output neurons; Wji denotes a set of connection weights between input and hidden layers; and Wkj denotes a different set of connection weights between hidden and output layers (Freeman & Skapura, 1991; SPSS, Inc., 2008). Specifically, the
Page 5 IR Applications, Number 29, Curriculum Assessment Using Artificial Neural Network

input layer distributes all input data, or information, in the system to the hidden layer. The neurons in the hidden layer summarize the input data, or information, based on the predefined weights. Data or information in the input and hidden layers are processed by the activation functions and the neurons convert the result as mathematical expressions of all inputs to the output layer.
The back-propagation method is the sophisticated training technique used to minimize the difference between the predicted and the observed outputs by reversely adjusting the connection weights of Wji and Wkj, where Wji is from the output layer neurons to the hidden layer neurons, and Wkj is from the hidden layer neurons to the input layer neurons in an iterative process (Freeman & Skapura, 1991; SPSS, Inc., 2008). A MLP is trained using examples and the performance of a gained model, which is tested and validated with independent examples. In addition to the activation functions and connection weights, the bias is one of three basic components that train data examples in which a numerical value of one is associated with its weights.
The activation functions are readily available for the implementation in the ANN: These functions include 1. hyperbolic tangent, f(net) = [exp(net) - exp(-net)]
/ [exp(net) + exp(-net)]; 2. sigmoid (or binary logit), f(net) = 1/(1 + exp(-net));
and 3. softmax (or multinomial logit), f(net) = exp(net)/
[∑exp(net)]; and (4) identity, f(net) = net, where exp is the base of the natural logarithm which equals to 2.718, net = ∑WjiXi for the connection between input and hidden layers, and net = ∑Wkj for the connection between hidden and output layers (Freeman & Skapura, 1991; SPSS, Inc., 2008). The activation functions have a unique property of being mathematically differentiable forms that can be easily expressed in terms of successive layers. This property allows the back-propagation method to obtain a better approximation of connection weights for the model architecture. In constructing the ANN model, 70% of the
examples is generally used as a training set while the remaining 30% is used for testing. The purpose
InputVariable 1
Bias
BiasX1
X2
Xi
H1
O1
Wji
Wkj
InputLayer
HiddenLayer
OutputLayer
Ok=f [∑Wkj, f(∑WjiXi)]
OkHj
InputVariable 2
InputVariable i
Figure 1. Simplified topology of the ANN with single hidden layer.
Page 6 IR Applications, Number 29, Curriculum Assessment Using Artificial Neural Network

of this training is to yield the minimum error (i.e., maximum accuracy) between computed outputs and actual outputs through the weight adjustment on each connection of neurons. Classification accuracy is derived for both training and testing datasets, respectively. Specifically, the ANN is designed to test the accuracy performance (i.e., predicting the outputs correctly for the given inputs that are originally used to train the network), and it is also designed to test generalization performance (i.e., predicting the outputs correctly for the given inputs that are not in the training set).
Hence, the ANN is suitable for establishing a nonlinear relationship between multidimensional variables without any underlying logic or reasoning. It is a data-driven or curve-fitting modeling process rather than a model-driven or statistical one. Therefore, the design of the ANN architecture is a trial-and-error process to find the optimal model with a single hidden layer considered to meet the simplicity criterion or parsimony principle.
Overview of the SVM ClassifierSVM has been suggested in the field of Machine
Learning as a promising technique that allows researchers to construct a nonlinear classifier as the solution to a quadratic problem to yield a minimum of error function. It seeks an optimal hyperplane to separate data from different categories through the computational shortcut of kernel functions (Cortes & Vapnik, 1995; Cristianini & Shawe-Taylor, 2000). The basic role of the kernel function is to calculate inner product values through a transformation in high-dimensional feature space, and ultimately maximize the margin of separation to yield high accuracy of data separation. Justified by Cover’s theorem, any dataset can be separable if the data dimension grows (Cover, 1965). The SVM module in the Decision Tree Regression (DTREG) software package (Sherrod, 2007) was used to construct the SVM models.
All four kernel functions are involved in the model construction: linear, radial basis function (RBF), polynomial, and sigmoid. Each SVM analysis is equipped with only one kernel function to fit a hyperplane between different classes of examples.
The kernels are mathematically defined as: 1. Linear kernel, k(u, v) = u’v; 2. RBF kernel, k(u, v) = exp(-γ |u – v|2); 3. Sigmoid kernel, k(u, v) = tanh (γ u’v + constant);
and 4. Polynomial kernel, k(u, v) = (γ u’v + constant)d,
where u and v are input vectors: exp is the base of the natural logarithm, and d represents the number of degrees in polynomial kernel (Cortes & Vapnik, 1995; Rüping, 2000; Sherrod, 2007). In order to yield the best performance model,
the SVM model adopts the iterative process of grid-search (searches values of each parameter across the specified search range) and pattern search (searches the center and makes trial steps in each direction for each parameter) to find the optimal value of parameters (Sherrod, 2007). All pairs of optimal parameters such as kernel function weight (gamma “γ”) and the cost of error (“C’) in the system are being tried, and the best pair is generated (Boser, Guyon, & Vapnik, 1992; Cortes & Vapnik, 1995). The SVM also implements m-fold cross-verification to obtain the reliable estimation of model error, where for each of m experiments, the system uses m-1 folds for training and the remaining one for testing. In the validation process, the average of model errors for distinct categories is calculated to evaluate the model accuracy. The advantage of m-fold cross-verification is that all examples in the dataset are eventually used for both training and testing to avoid sampling bias problems. Researchers who are interested in the mathematical theory of SVM are encouraged to read the brief introduction of the SVM classifier in Appendix I of this paper and the textbook (Cristianini & Shawe-Taylor, 2000).
Overview of the Logistic Regression ModelLogistic regression analysis has been widely
used to fit an S-shaped curve into a binary outcome with data points of one and zero (success or failure). It allows researchers to interpret the effects of the explanatory variables on the occurrence of binary outcome. The maximum likelihood estimation technique is used to estimate the regression coefficients. This technique maximizes the
Page 7 IR Applications, Number 29, Curriculum Assessment Using Artificial Neural Network

probability of getting the observed data given the fitted regression coefficients (Hosemer & Lemeshow, 1989).
The logistic regression model is primarily written as Y = P(X) + E, where Y is the binary outcome—success coded as 1 or failure coded as 0 (Hosemer & Lemeshow, 1989). The probability P(X) of obtaining the binary outcome is considered to be the estimated value given the explanatory variables (X) are known observations. The error term (E), also called the residual, represents the difference between the actual binary outcome (Y) and the estimated probability P(X). The model is commonly written as P(X) = eZ/(1+eZ), where Z stands for a linear combination of ßo + ß1X1 + ß2X2 +...+ ßpXp (Hosemer & Lemeshow, 1989). The “e” term in the equation is the base of the natural logarithm, which is approximately 2.718. The regression coefficients (ß) are unknown parameters to be estimated. Moreover, the model assumes that residuals have a mean of zero and a constant variance of P(X)[1-P(X)], which are statistically independent of one another.
Study Method The basic sciences curriculum at Meharry
Medical College transitioned from a traditional discipline-based structure to organ systems in 2004. The theme of curriculum change includes a replacement of discipline-based instruction with coursework anchored in content integrated across disciplines. Embedded within the curriculum structure is a series of the NBME subject boards, which require medical students to solve scientific and clinical problems. Although student performance on the NBME subject boards measures the learning taken place specific to their respective course and clinical clerkship, the test scores reflect educational development resulting from the overall medical school experience.
In order to determine how to best identify student learning needs and to evaluate curriculum change and program content in medical school, the ANN and SVM models were used for the data analysis. Researchers can better understand the ANN and SVM architecture by examining
fundamental steps for the model construction as shown schematically in Figure 2.
Step 1 involved a research dataset consisting of one dependent variable and multiple independent variables collected from annual graduating student surveys as part of an ongoing assessment process. The questionnaire items measure important components of the basic science curriculum, which have been judged as “essential” by the Vice President for Academic Affairs, the Dean of the School of Medicine, and other medical education specialists. Therefore, the survey instrument itself has content validity.
In Step 2, the underlying models were developed by the choice of activation functions for the ANN and the selection of kernel functions for the SVM. It was difficult to know in advance which activation or kernel function would be the most suitable. Thus, the only strategy was a trial-and-error process by applying all activation and kernel functions for the ANN and SVM, respectively. The ANN network architecture consisted of eight models from two activation functions between input and hidden layers (hyperbolic tangent and sigmoid) and four activation functions between hidden and output layers (identity, softmax, hyperbolic tangent, and sigmoid). Further doubling and adopting of the number of the eight models resulted in 16 by using the two optimization algorithms (scaled conjugate and gradient descent). For the SVM classifier, there were four kernel functions readily available for model construction: linear, RBF, polynomial, and sigmoid.
In Steps 3 and 4, all possible ANN and SVM candidate models were trained and tested to achieve minimal classification error by means of adjusting connection weight and performing cross-validation. In the ANN modeling approach, the dataset was partitioned into two subsets for training and testing with approximately 70% of the data points randomly selected as the training set to estimate parameters. These parameters were then used to calculate the fitted probability of event occurrence for each observation in the training set. Moreover, the gained model with the same parameters was applied to the remaining 30% of
Page 8 IR Applications, Number 29, Curriculum Assessment Using Artificial Neural Network
data points (test set). For the SVM classifier, a 10-fold cross-validation was implemented to minimize the bias generated by random sampling of the training and testing datasets. The input dataset was divided into 10 mutually exclusive subsets, where nine subsets were available for training and one subset was used for testing purpose. The process was repeated 10 times to ensure that the model was tested in each subset The average results from 10 repeated processes were used to represent the classification results for training and test examples. In addition, the model performance was gradually improved by generating and selecting the best parameters using the grid search process.
In Step 5, the results of the ANN and SVM models were evaluated and compared with the logistic regression model to see if they were suitable in the application of curriculum assessment. As described earlier, for the purpose of comparison, all independent variables were standardized in the ANN model. Moreover, the “Enter” procedure for logistic regression in SPSS was adopted to force all independent variables into its equation in one step. The benchmark comparison was carried out by comparing the normalized importance, rank order of independent variables, and classification accuracy on the ANN and SVM to those of the logistic regression.
In Step 5, four most commonly used criteria were implemented to measure and compare the classification accuracy: sensitivity, specificity, combined accuracy, and the F-measure (Lewis & Gale, 1994). A 2 x 2 table (confusion matrix) containing classification results was shown in the printouts of the ANN and logistic regression models generated from the SPSS and the printout of the SVM classifier from the DTREG software. The first two cells (upper left cell and lower right cell) denote the correctly classified numbers of individuals. Specifically, the upper left cell denotes the number of individuals classified as false who were actually false (true negative or TN), and the lower right cell denotes the number of individuals classified as true who were actually true (true positive or TP). The other two cells (upper right cell and lower left cell) denote the numbers of individuals misclassified. The
upper right cell denotes the number of individuals classified as true who were actually false (false positive or FP), and the lower left cell denotes the number of individuals classified as false who were actually true (false negative or FN).
When the confusion matrix with the classification results was constructed, the four criteria were easily calculated as: Sensitivity or Recall = TP/(TP + FN); Specificity or Fall-out = TN/(TN + FP); Combined Accuracy = (TP + TN) /(TP + FP + TN + FN); Precision or Positive Predictive Value = TP/(TP + FP); and F-measure = [2 x (Sensitivity x Precision)] / [Sensitivity + Precision] (Lewis & Gale, 1994). Sensitivity is defined as a measure of the ability of the model to detect those individuals indicating satisfaction with the basic science curriculum. Specificity is a measure of the ability of the model to specify dissatisfaction with the basic science curriculum. The combined accuracy is defined as the measure of the ability of the model to accurately classify the satisfaction and dissatisfaction with basic science curriculum overall. To cover sensitivity and precision, the F-measure was used, which is the weighted harmonic mean of sensitivity and precision. Additional Decision Theory along with its Bayesian statistics can be used to help researchers make judgments about classification accuracy, especially an appropriate cutoff point that needs to be found for a continuous outcome measure (Sawyer, 1996).
In Step 6, the principle of parsimony (e.g., simplicity) is addressed. When fewer independent variables are sufficient to account for the dependent variable, the researcher does not need to include unnecessary independent variables in the models. To maintain model simplicity, variables with zero value of normalized importance can be manually eliminated. In Step 7, the top important variables and related rank orders of variables for the ANN and SVM models were generated to facilitate variable explanation. The normalized importance was calculated by dividing the value of the highest relative importance into the value of the other relative importance. The normalized importance provides a hierarchal viewpoint of the ranking of the explanatory variables. However, it does not
Page 9 IR Applications, Number 29, Curriculum Assessment Using Artificial Neural Network

show the direction of relationship between the individual explanatory variable and the outcome variable. It is important to compute correlation coefficients as shown in Table 1.
In Table 1, it is also crucial to assess the model collinearity for the logistic regression model since the problem of collinearity may lead to inaccurate results of logit as well as odds ratio. The collinearity exists if one explanatory variable is a function of other explanatory variables. In this study, there was no evidence of model collinearity because the tolerances were large (a range of 0.37 to 0.66), where TOLi = 1 – Ri
2, and Ri is a multiple correlation coefficient between one explanatory variable (Xi) and the other explanatory variables (Xs) in the equation (Menard, 1995; Norusis, 1985). For the logistic regression model, residuals are assumed to have a mean of zero and a variance of P(X) [1-P(X)]. Researchers must check for violation of the assumption by plotting the histogram and scatter diagram for residuals. The model assumption is satisfied if the histogram of the residuals is normally distributed with a mean of zero, and the residuals on the scatter diagram appear to be parallel with the X-axis (i.e., the indication of a constant variance). Unlike the logistic regression model, researchers do not need to check the violation of statistical assumptions for ANN and SVM models since they are mathematical models rather than statistical models.
Empirical Results A total of 240 questionnaires were issued to
students graduating in the years of 2006, 2007, and 2008 with a total of 213 returned questionnaires, yielding a 89% response rate (213/240). The ANN and SVM models were constructed on a total of 213 respondents.
According to descriptive statistics calculated from this study and The Report of Meharry Medical College Student Evaluation of Medical Curriculum (Fort, 2004), medical students agreed that they were satisfied with the quality of their basic science curriculum overall. Medical students agreed that their curriculum was well-organized and congruent with the College’s mission. They also agreed that the curriculum offerings were integrated across disciplines and emphasized application of principles and concepts to problem-solving. In addition, medical students found that basic science
Figure 2. Flowchart for ANN and SVM model construction.
Step 1:Collect Data
Step 2:Choose Topology
Step 5:Most Accurate
Model?
Step 6:Parsimony?
Step 7:Interpret Results
Stop
Start
No
No
Yes
Yes
Step 3:Train Examples
Step 4:Test Examples
Page 10 IR Applications, Number 29, Curriculum Assessment Using Artificial Neural Network

+ Dependent variable was coded as 0 for “strongly disagree or disagree” and 1 for “agree or strongly agree.”++ All independent variables used a 5-point Likert scale: 0 for “not applicable,” 1 for “strongly disagree,” 2 for “disagree,” 3 for “agree,” and 4 for “strongly agree.” * p < 0.05** p < 0.01
Table 1Study Variables, Related Correlation Coefficients, and Tolerances
VariableName
O1_OVER
V1_FEED
V2_INNOV
V3_COORD
V4_MISSI
V5_SMALL
V6_PATIE
V7_SCIEN
V8_RESEA
V9_ORGAN
V10_SUBJ
V11_MENT
V12_TIME
Dependent (Output or Target) Variable+
Agreement states that “overall, I am satisfied with the basic science curriculum.”
Independent (Input or Attribute) Variables++
Agreement states that “basic science curriculum remains responsive to student feedback.”
Agreement states that “basic science curriculum is open to innovation.”
Agreement states that “basic science curriculum is well-coordinated and integrated.”
Agreement states that “delivery of the basic science curriculum is coherent and compatible with the College’s mission.”
Agreement states that “basic science curriculum promotes small-group (8–12 students) teaching.”
Agreement states that “basic science curriculum increases the use of standardized patients.”
Agreement states that “basic science curriculum offers me adequate scientific knowledge.”
Agreement states that “basic science curriculum provides me with opportunities to conduct my own research projects.”
Agreement states that “courses in the basic science discipline are well organized.”
Agreement states that “courses in the basic science discipline prepared me well for the Subject Board Examination.”
Agreement states that “I have adequate opportunity to be mentored or advised by a faculty member.”
Agreement states that “I receive timely feedback on my academic performance.”
CorrelationCoefficient
N/A
0.42**
0.37**
0.50**
0.42**
0.15*
0.23**
0.45**
0.25**
0.54**
0.60**
0.21**
0.32**
Tolerance
N/A
0.37
0.46
0.44
0.40
0.49
0.53
0.52
0.66
0.39
0.51
0.64
0.63
Page 11 IR Applications, Number 29, Curriculum Assessment Using Artificial Neural Network
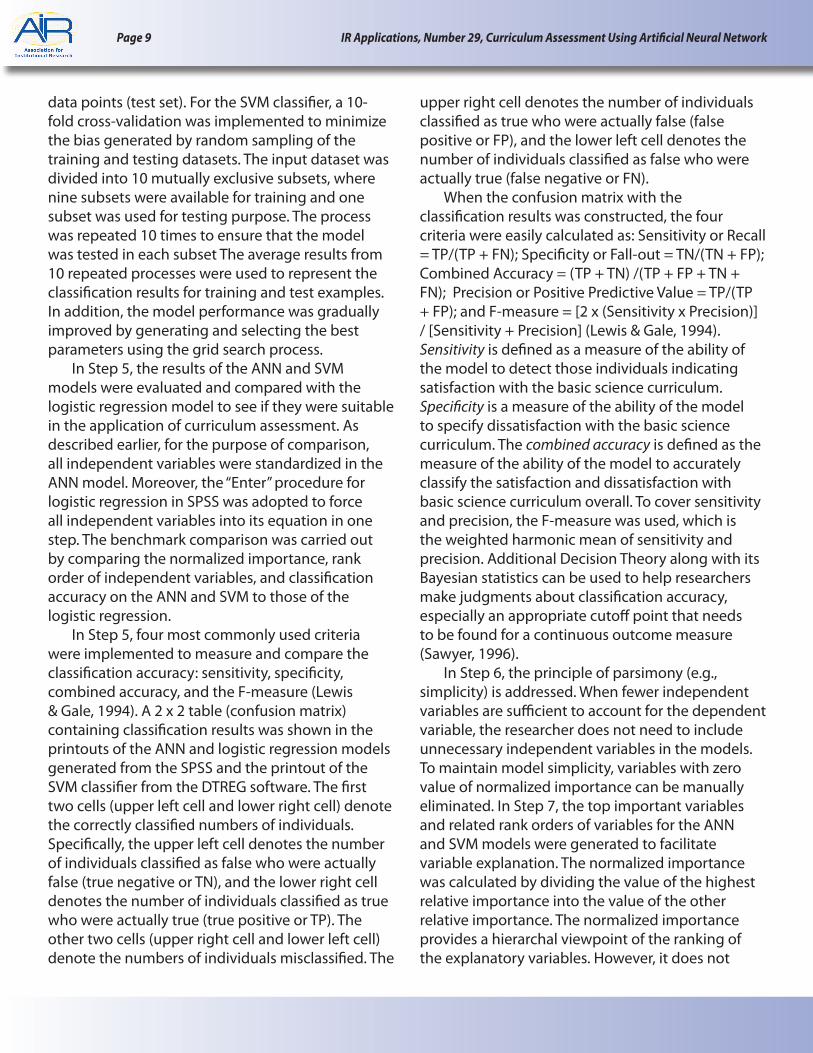
curriculum remained responsive to their feedback; most felt there were opportunities to develop a mentor relationship with faculty members. As displayed in Table 2, all independent variables were entered into the three models, A, B, and C as the full variable models. Normalized importance along with rank orders gave an indication of their important contribution to the dependent variable. The consistent results were clearly shown across all three models. The four variables showing the largest influence on student satisfaction with the basic science curriculum were V10_SUBJ, V3_COORD, V7_SCIEN,
and V1_FEED with lower ranks of (1, 1), (2, 3), (3, 2), and (4, 7), respectively. Also, three variables (V10_SUBJ, V3_COORD, and V7_SCIEN) significantly contributed to the outcome variable in the logistic regression model (p < 0.05). Hence, these three variables should be considered as a high priority related to student satisfaction with the basic science curriculum: (a) courses in the basic science discipline prepare students well for the Subject Board Examination; (b) the basic science curriculum is well-coordinated and integrated; and (c) the basic science curriculum offers students adequate scientific knowledge.
Table 2Variables in the Equations for the Full Variable Models
+ Top four important variables that contribute to the outcome variable in ANN and SVM full variable models* Significant variables with p < 0.05 using the Wald test in the logistic regression modela Polynomial kernel function with a degree of 3; C = 0.1; Gamma = 0.009; and constant term = 0.599b The model fitting statistics for the logistic regression model are: (1) Nagelkerke R-squared value of 0.76; and (2) model chi-square of 123.53 with df of 12 and p < 0.001.
V1_FEED+ 0.307 4 0.046 7 0.763 0.282
V2_INNOV 0.156 6 close to 0 8 -0.131 0.840
V3_COORD+ 0.759 2 0.143 3 2.580 0.002*
V4_MISSI 0.093 11 0.048 5 -0.901 0.259
V5_SMALL 0.119 8 close to 0 8 -0.383 0.584
V6_PATIE 0.115 9 0.095 4 0.670 0.272
V7_SCIEN+ 0.581 3 0.238 2 2.308 0.026*
V8_RESEA 0.085 12 close to 0 8 -0.426 0.429
V9_ORGAN 0.248 5 close to 0 8 0.943 0.191
V10_SUBJ+ 1.000 1 1.000 1 3.428 0.000*
V11_MENT 0.115 10 close to 0 8 -0.031 0.960
V12_TIME 0.122 7 0.047 6 0.509 0.427
Variable inEquation
Model AANN Model:
Sigmoid/Sigmoid(Scaled Conjugate)
Model BSVM Model:Polynomial a
Model CLogistic Regression
Model:Enter Procedure b
NormalizedImportance(Coefficient)
RankOrder
RankOrder
NormalizedImportance(Coefficient)
RegressionCoefficient
P value
Page 12 IR Applications, Number 29, Curriculum Assessment Using Artificial Neural Network

Partitioning data into training and testing subsets is an important process of evaluating classification accuracy for machine learning models, ANN and SVM. The classification accuracy of logistic regression, ANN, and SVM models can also be assessed by using the entire dataset without folds or holdout. In Table 3, the classification accuracy of the full variable Model A–ANN is based on the result from training and testing subsets along with the prediction from an entire dataset. The classification accuracy for the full variable Model B–SVM is also based on training, testing (i.e., validation set or the average of model errors from the cross-verification), and the prediction from an entire dataset. Validation in the SVM model is used to evaluate the model accuracy to achieve the learning of the network, where the model does not need to be tuned. The classification accuracy of the full variable Model C–Logistic Regression is derived from the prediction
result of logistic regression without partitioning data into training and testing sets.
For the logistic regression model, if the probability of a student obtaining the overall satisfaction of the basic science curriculum is greater than or equal to a cut-off point (defaulted value of one half ), that student is placed into the predicted satisfaction group. However, if the probability of a student obtaining the overall satisfaction of the basic science curriculum is less than one half, then that student is categorized into the predicted dissatisfaction group (SPSS, Inc, 2008). Therefore, by comparing the predictive results and actual observations, the researcher was able to calculate the prediction accuracy for the satisfaction and dissatisfaction groups, as well as for the combined satisfaction and dissatisfaction group.
As shown in Table 3, the combined accuracy, sensitivity, and F-measure remained high
Table 3Classification Accuracy of the Full Variable Models
* Scoring option was executed for ANN and SVM models using the complete dataset without folds or holdout. For logistic regression model, the complete dataset was used for testing while no data were used for training.
Criteria for Accuracy
Combined Accuracy {Predicting Entire Set}* [Training Subset] (Testing Subset)
Sensitivity {Predicting Entire Set}* [Training Subset] (Testing Subset)
Specificity {Predicting Entire Set}* [Training Subset] (Testing Subset)
F-measure {Predicting Entire Set}* [Training Subset] (Testing Subset)
Model AANN Model:
Sigmoid/Sigmoid(Scaled Conjugate)
{89%}[97%](92%)
{93%} [99%](94%)
{74%}[88%](85%)
{0.93)[0.98](0.95)
Model BSVM Model:Polynomial
{91%}[90%](89%)
{94%}[93%](94%)
{75%}[75%](71%)
{0.94}[0.93](0.93)
Model CLogistic Regression
Model:Enter Procedure
{91%}
{96%}
{74%}
{0.95}
Page 13 IR Applications, Number 29, Curriculum Assessment Using Artificial Neural Network

(approximately above 90%) across all these models in training and testing subsets as well as the prediction from an entire dataset. However, the specificity was not as high (ranged from 71% to 88%) as other measures. The Model C–Logistic Regression and Model B–SVM slightly outperformed the Model A–ANN in all four criteria of classification accuracy for the entire dataset. However, the Model A–ANN performed more accurately than the Model B–SVM in all four criteria of classification accuracy in training and testing subsets, respectively.
Making use of fewer variables tended to adhere to simplicity or the principle of parsimony. Five variables (V2_INNOV, V5_SMALL, V8_RESEA, V9_ORGAN, and V11_MENT) in Table 2 with normalized importance closer to zero were excluded from the model reconstruction. In other words, only seven variables entered the equations as the reduced variable models in Table 4. It is interesting to note that the following top important variables in the
reduced variable models, D, E, and F in Table 4 were consistent with those in the full variable models: V10_SUBJ, V3_COORD, V1_FEED, and V7_SCIEN with lower ranks of (1, 1), (3, 2), (2, 3), and (4, 4), respectively.
As expected, three variables (V10_SUBJ, V3_COORD, and V7_SCIEN) significantly contributed to the outcome variable in the logistic regression model (p < 0.05). Therefore, the following variables were the most important in contributing to student satisfaction with the basic science curriculum: (a) courses in the basic science discipline prepare students well for the Subject Board Examination; (b) the basic science curriculum is well-coordinated and integrated; and (c) the basic science curriculum offers students adequate scientific knowledge. It is worth noting that the model structure between the full variable models and the reduced variable models is consistent.
V1_FEED+ 0.715 2 0.207 3 0.527 0.307
V3_COORD+ 0.444 3 0.276 2 1.773 0.002*
V4_MISSI 0.124 6 0.103 5 -0.333 0.569
V6_PATIE 0.078 7 close to 0 6 0.451 0.273
V7_SCIEN+ 0.311 4 0.138 4 1.989 0.011*
V10_SUBJ+ 1.000 1 1.000 1 2.464 0.000*
V12_TIME 0.210 5 close to 0 6 0.564 0.235
Variables in Equation
Model D ANN Model:
Sigmoid/Sigmoid (Scaled Conjugate)
Model ESVM Model:Polynomial a
Model FLogistic Regression
Model:Enter Procedure b
NormalizedImportance(Coefficient)
RankOrder
RankOrder
NormalizedImportance(Coefficient)
RegressionCoefficient
P value
+ Top four important variables that contribute to the outcome variable in ANN and SVM reduced variable models
* Significant variables with p < 0.05 using the Wald test in the logistic regression modela Polynomial kernel function with a degree of 3; C = 0.430; Gamma = 0.027; and coefficient = 0.599b The model fitting statistics for the logistic regression model are: (1) Nagelkerke R-squared value of 0.69; and (2) model chi-square of 115.66 with df of 7 and p < 0.001.
Table 4Variables in the Equations for the Reduced Variable Models
Page 14 IR Applications, Number 29, Curriculum Assessment Using Artificial Neural Network

As exhibited in Table 5, all classification accuracy remained relatively high and stable across the board in training, testing, and entire sets with the exception of specificity. The reduced variable models of ANN and logistic regression became more accurate compared to the reduced variable SVM model in the criteria of combined accuracy and sensitivity. The Model D–ANN performed more accurately than the Model E–SVM in all four criteria of classification accuracy in training, testing, and entire sets, respectively. However, the specificity of the reduced variable ANN and SVM models outperformed the reduced variable model in logistic regression. It is interesting to note that the specificity of the logistic regression model (69%) in the prediction of an entire dataset lagged behind the ANN model (80%) and SVM model
(75%), especially when it decreased 5% for logistic regression from 74% in the full variable model to 69% in the reduced variable model. For testing and entire sets, the accuracy of ANN in the criteria of combined accuracy and sensitivity for the reduced variable models slightly increased as compared to those of the full variable models in Table 3. On the other hand, for the training and testing sets, the accuracy of SVM in the criteria of combined accuracy and sensitivity for the reduced variable models slightly decreased as compared to those of the full variable models.
Conclusion, Implication, and AlternativeThe ANN and SVM models have received much
attention recently in the field of Machine Learning, proving that they have significantly contributed
Table 5Classification Accuracy of the Reduced Variable Models
* Scoring option was executed for ANN and SVM models using the complete dataset without folds or holdout. For the logistic regression model, the complete dataset was used for testing while no data were used for training.
Criteria for Accuracy
Combined Accuracy {Predicting Entire Set}* [Training Subset] (Testing Subset)
Sensitivity {Predicting Entire Set}* [Training Subset] (Testing Subset)
Specificity {Predicting Entire Set}* [Training Subset] (Testing Subset)
F-measure {Predicting Entire Set}* [Training Subset] (Testing Subset)
Model DANN Model:
Sigmoid/Sigmoid(Scaled Conjugate)
{94%}[94%](93%)
{97%}[98%](96%)
{80%}[79%](83%)
{0.96}[0.96](0.96)
Model ESVM Model:Polynomial
{88%}[92%](90%)
{90%}[96%](95%)
{75%}[75%](71%)
{0.92}[0.95](0.94)
Model F Logistic Regression
Model: Enter Procedure
{91%}
{97%}
{69%}
{0.94}
Page 15 IR Applications, Number 29, Curriculum Assessment Using Artificial Neural Network

to pattern recognition and data classification. By constructing reasonable and workable ANN and SVM models, this study has accomplished its goal of assessing the medical school curriculum. It is important to assess student satisfaction with the medical curriculum in the areas of program content, delivery format, and method. The study results showed that top important variables identified by the ANN and SVM models were comparable to those of the logistic regression model. The consistency in the results may demonstrate the model reliability, meaning that graduating student questionnaires are reliable in measuring the average of minimal error. Student satisfaction with the basic science curriculum was attributed to the medical curriculum itself preparing students well for the Subject Board Examination, being well-coordinated and integrated, and offering students adequate scientific knowledge. By locating the most important variables that contribute to student satisfaction regarding the basic science curriculum overall, faculty and college administrators can make better decisions to facilitate student learning and development.
Findings mentioned above are of great significance for the assessment of the medical school curriculum and are congruent with research literature. First, the basic science discipline preparing students well for the Subject Board Examination ranked number one. This is essentially tied to the overall satisfaction of the medical curriculum. The Subject Board Examinations require students to apply what they have learned in the basic science courses to clinical knowledge, which ultimately leads to the completion of the first two years of medical school training (Holtman, Swanson, Ripley, & Case, 2001). Secondly, the coordination of teaching and learning within a basic science curriculum is an essential step for promoting student growth and success. The extent to which a program can integrate concepts of the basic and clinical sciences ensures students’ achievement on the USMLE Step 1 and future clinical practice. The USMLE is a single pathway for primary licensure for medical graduates who seek clinical training and licensure in the United States (Anderson, 2009). Lastly, adequate scientific knowledge gained within
the basic science curriculum is a foundation for problem-solving skills used in medical diagnosis and treatment. This foundation is an important part of a medical education program assessment developed by the Accreditation Council of Graduate Medical Education (Epstein, 2007).
The logistic regression model is the most commonly used approach because of its ease of construction and data interpretation. However, it is a generalized linear model that is less adept than the ANN and SVM models in solving nonlinear and multidimensional problems. In logistic regression, there is only one sigmoid function to link input variables with the output variable while the ANN model may use different sigmoid functions between the input layer to hidden layer and the hidden layer to output layer in addition to other functions such as hyperbolic and polynomial functions; the SVM model may fit sigmoid function into the data, which adopts the kernel function to reduce the computational complexity. It is important to note that logistic regression can only deal with binary and dichotomy outcome while ANN and SVM models can lead to multiclass problem (e.g., multinomial logistic) and linear regression where the outcome variable is continuous (Cristianini & Shawe-Taylor, 2000; Sherrod, 2007).
Both ANN and SVM models are promising for numerous reasons. First, working ANN and SVM models can be developed by newcomers within a relatively short time frame, conditional on the availability of an appropriate dataset and neural network software. Secondly, knowledge is gained through learning and testing, which make them suitable in establishing valid relationships between variables. Thirdly, the ANN model has greater classification accuracy compared to other models, which is congruent to the literature reviews that the ANN model generally produces superior prediction results. The classification accuracy from the SVM model remained relatively constant in both full and reduced variable models, indicating that this approach is minimally affected by the number of variables and is the most stable of the three models compared. Fourthly, the SVM has a promising property, that is, the generalization capability
Page 16 IR Applications, Number 29, Curriculum Assessment Using Artificial Neural Network

depends on the implementation of m-fold cross-validation. Fifthly, ANN and SVM have the capability of ranking the important variables based on the value of normalized importance while the logistic regression model generally does not offer any standardized regression coefficients for comparison purposes. Finally, the ANN and SVM models do not require the verification of any statistical assumptions such as normality and independence of residuals, as in the case of the logistic regression model.
The logistic regression model may have a tendency to over-fit the data, meaning that when an individual model has too many parameters, it may lead to a false classification performance. The potential problem of over-fitting needs to be carefully examined given that the logistic regression model performs more accurately than the ANN and SVM classifier in the full variable models. However, the specificity of the logistic regression model greatly decreases in the reduced variable model with fewer parameters compared to the full variable model. However, lack of the availability of a structured methodology for constructing the ANN and SVM models presents greater challenges. Moreover, the number of hidden layers along with the number of neurons and training tolerance needs to be determined by a trial-and-error process in the ANN model. Given that the ANN and SVM models are nonlinear functions, it is difficult to spell out the algebraic relationship between input (attribute) and output (target) variables. This lack of explanation for the magnitude effect of independent variables is one of the most criticized points in the ANN and SVM models. Furthermore, there is no variable selection algorithm for ANN and SVM to select a subset of significant variables that adheres to the principle of parsimony, which states that the less complicated model is given preference. However, researchers may sequentially remove the variables with normalized importance being less than 0.05 or 0.10, which is quite similar to the variable removal criterion for the backward elimination procedure in logistic and linear regression models. Removing variables from the model equation may affect classification accuracy; therefore, caution must be taken.
In constructing the ANN and SVM models, it is a good practice to use other approaches such as the logistic regression model as an additional tool for cross-validation to ensure model validity. The trade-off between the explanatory capability and the principle of parsimony in a model has to be considered, where explanatory capability is associated with the broad applicability in explaining phenomena, and parsimony usually assures the simplicity of the model. However, there is no universal approach for selecting one model over the other. For model construction, each one must be evaluated on a case-by-case basis. Furthermore, all ANN, SVM, and logistic regression models are shown to complement each other. For example, the major differences among all models are apparent. The ANN or SVM modeling approaches are data-driven for function approximation, and the logistic regression analysis is considered as model-driven for variable explanation. The ANN and SVM modeling approaches ascertain a nonlinear relationship based on the historical data for training rather than large samples for statistical inferences, which are used in the logistic regression model.
The ANN and SVM models need to be reconstructed for upcoming years when more questionnaire data are available to demonstrate their predictive validity. The promise of greater classification accuracy for the ANN and SVM models may be further confirmed on practical grounds by establishing the models with some holdout samples. Also, the curriculum assessment should be a continuing process that is performed regularly to ensure that the program content and delivery mechanism keep up with the current development of medical education. Future study and other alternatives for model development and model validity lie in the comparison of the ANN and SVM models with another nonlinear modeling approaches such as the Gene Expression Programming (GEP). GEP is a sophisticated evolutionary algorithm used to select and reproduce the candidate solutions from a population of computer programs or problem solutions based on fitness (Ferreira, 2006). GEP is able to help researchers save time
Page 17 IR Applications, Number 29, Curriculum Assessment Using Artificial Neural Network

and resources if curriculum assessment can take advantage of a powerful modeling tool tailored to curriculum change in an easy manner. It can effortlessly generate the most suitable model for high accuracy, variable explanation, and powerful generalization by means of the software package called GeneXproTools (Gepsoft, Ltd., 2009). By incorporating the best features of the GEP technique, both ANN and SVM can advance future development of an optimum curriculum assessment model.
Editor’s Note:
When IR Applications was initiated several years ago, it was established to provide several opportunities. Primarily, it provided an opportunity to share some of the more specialized, focused techniques and methodologies that show value for the tasks that some institutional researchers have. This also gives our more technical colleagues the opportunity to share in a professional journal, and it gives the rest of us an opportunity to be aware of what is frequently rather technical and cutting-edge methodology. In addition, IR Applications often include a basic strategy or methodology that can be generalized to many of the other challenges we face, often helping identify issues and opportunities with our traditional tools and techniques. This issue of IR Applications is an excellent example of both of those purposes.
First, the technical issue. Chen demonstrates the use of data mining on the analysis of a student survey about satisfaction with the curricula. As he points out, the view of the student is a lens we value as we look at alternative ways to assess our instruction. The two methods of data mining are among the more sophisticated methods of data analysis. As a result, he needs a way to explain the results in a way that can be shared with institutional decision-makers and professional colleagues. He does this by demonstrating a variety of aspects of his methodology. One aspect is the seven-step methodology and the ranking of the importance of the independent measures. He does this with tables showing the rank order of the variables. Another
display of results is the inclusion of hits in Table 3 and Table 5. What other ways to show results might be useful? Would it help to use the means of the scores of those in the two different categories of the dependent variable? Would Box and Whiskers for the independent variables on the two categories of the independent variable help? The answer to these and other alternatives would seem to vary based on the preferences at different institutions.
There are at least three aspects that can generalize to our other methodologies. First, in showing the three results for the data mining: training, testing, and predicting, we are reminded of the value of cross-validation and the issue of shrunken multiple correlations. The question here is, Do you compare the Logistical Regression with the training results or the testing results or with the entire sample? Is it taking advantage of sampling errors as do the training samples or is it the application of a model as in the other two cases? Should we develop a strategy for “training” and “testing” our logistical regression?
Second, it is also particularly valuable to note his use of multiple criteria of Sensitivity, Specificity, Combined Accuracy, Precision, and the F-Value in describing a two-by-two table of false-true vs. positive-negative. This extends the traditional single value of hits-misses and raises the ability to focus on the relative cost-value of different types of misclassifications.
Third, in terms of program assessment, this article helps us think through several conceptual issues. Chen is doing his program assessment on the group who went through the new curriculum. How might he compare the perceptions of this group with those who went through the previous curriculum? Obviously, he cannot turn back the hands of time. Could he do an alumni survey of those who went through the program before it was changed and compare results with those from the new curricula 3–5 five years out? What information might be valuable in comparing responses of those who went through the different curriculum?
As with all good research, we have had some questions answered and, perhaps even more importantly, we have had more questions raised.
Page 18 IR Applications, Number 29, Curriculum Assessment Using Artificial Neural Network

Given a training dataset represented by {Xi,Yi}, i=1, 2, …, N, an input vector X is a group of attributes of sample; and a dichotomous output vector Y is a class of sample either +1 (Class I) or -1 (Class II). The data pattern is linearly separable if an orthogonal w vector and a scalar b (bias or constant) can be estimated so that both equations (2) and (3) are satisfied. T represents the transpose of the vector w which is another vector wT, where the rows of as the columns of wT and the columns of w as the rows of wT. A mapping function φ(.) is a set of nonlinear functions, which maps input vector X into a high-dimensional feature space φ(X) = {φ(X1), φ(X2), ..., φ(Xn)} such that the essential information in the original attribute is still being conveyed (Cristianini & Shawe-Taylor, 2000; Wu et al., 2008).
(1) f(x) = wTφ(x) + b
(2) wTφ(x) + b ≥ +1 if yi = +l
(3) wTφ(x) + b ≤ -1 if yi = -1,
Both equations (2) and (3) are combined into the equation (4)
(4) yi f(x) = yi [wTφ(x) + b] ≥1
The inequality of the equation (4) can be used to construct a hyperplane, wTφ(x) + b = 0, which separates the data points so that all the points within the same class lie on the same side of the hyperplane. The margin of separation in the Euclidean distance is 2/ΣWi
2 between the two dotted lines in Figure 3. Finding the optimal separating plane is equivalent to maximizing the separating margin or minimizing ½ (ΣWi
2) under the constraint of the equation (4). After training process the SVM can be used to classify unknown examples (Xs) by the discriminating function (Cristianini & Shawe-Taylor, 2000; Wu et al., 2008) as the equation (5).
(5) f(x) = sign (wTφ(x) + b)
Appendix I: SVM Classifier
In practice, no hyperplane exists to separate all data points perfectly. Hence, the concept of margin maximization is still applicable to select a hyperplane that best separates as much of the data points as possible. In other words, this concept can be extended to the case when data patterns are not linearly separable, that is. when the equation (4) has no solution. A slack variable, ζi (error), is used to relax the constraints to allow for the minimal misclassification error such that (4) can be written as the equation (6):
(6) yi[wTφ(x) + b] -1+ ζi > 0, i = 1, 2, …, N
The mathematical theory of SVM can be used to solve the following optimization problem in order to find the optimal separating plane or to minimize the following loss function (Cristianini & Shawe-Taylor, 2000; Vapnik, 1995) as the equation (7): N
(7) Minimize L(w, b, ζ) = ½ wTw + CΣζi
i=1subject to
yi(wTφ(x) + b > 1 - ζi and ζi > 0
Hyperplane
Margin
Margin
Support Vector
Support Vector
Margin of Separation 2/ΣWi2
wTφ(x)+b=0
wTφ(x)+b=-1
wTφ(x)+b=1
Figure 3. Optimal separating plane of SVM in feature space.
Page 19 IR Applications, Number 29, Curriculum Assessment Using Artificial Neural Network

The first part of the equation (7) minimizes ½ (ΣWi
2) or maximizes the margin of separation 2/ΣWi
2 for the dataset in the feature space while the second part minimizes the misclassification error CΣζi. The positive value C (cost of error), determined by the grid search during the training stage, is an upper-limit on the Lagrangian optimization variable ai. This optimization variable is used to determine the trade-off between margin maximization and tolerance of training error (Cristianini & Shawe-Taylor, 2000; Joachims, 1998). Hence, this problem can be transformed into the equivalent Lagrange dual problem (Cristianini & Shawe-Taylor, 2000; Schoelkopf & Smola, 2002; Vapnik, 1995), which is also a quadratic optimization problem written as:
N N(8) Maximize Q(a) = Σ ai – ½ Σ ai aj yiyj k(xi, xj)
i=1 i,j=1subject to
N Σ aiyi =0 and 0 ≤ ai ≤ C, i=1,…,N i=1
The ultimate goal of SVM is to choose one particular set of parameters that map inputs onto the expected outputs close to the observed outputs. The kernel function k(u, v) = k(xi, xj) = φ(Xi)Tφ(Xj) performs nonlinear mapping into the feature space, which is the value being equivalent to the inner product of two vectors xi and xj based on the Mercer Theorem (Cristianini & Shawe-Taylor, 2000; Vapnik, 1995). By choosing the positive a* Lagrange multiplier from 0 < a* < C and performing calculation, the decision function given by the equation (5) has the explicit form as the equation (9) which can be derived from the equation (8) (Schoelkopf & Smola, 2002; Zeng, et al., 2008).
N(9) f(u, v) = sign [Σ aiyi k(u, v)+ b],
i=1
Page 20 IR Applications, Number 29, Curriculum Assessment Using Artificial Neural Network

ReferencesAbraham, A., & Nath, B. (2001). ALEC: An adaptive
learning framework for optimizing artificial neural networks. In V. N. Alexandrov, J. J. Dongarra, B. A. Juliano, R. S. Renner, & C. J. K. Tan (Eds.), Computational Science, Vol. 2074: ICCS 2001 International Conference San Francisco, CA, USA, May 28–30, 2001 Proceedings, Part II. Berlin, Germany: Springer. doi: 10.1007/3-540-45718-6_19
Acikkar, M., & Akay, M. F. (2009). Support vector machines for predicting the admission decision of a candidate to the School of Physical Education and Sports at Cukurova University. Expert Systems with Applications, 36, 7228–7233.
Anderson, O. S. (2009). Changing the USMLE: Challenges and opportunities for physiology and other medical school basic science departments. The Physiologist, 52(2), 39–44.
Bernhard, S. (2001). Survival-time classification of breast cancer patients. Technical Report 01-03. Taipei, Taiwan: National Taiwan University of Science and Technology.
Boser, B., Guyon, I., & Vapnik, V. (1992). A training algorithm for optimal margin classifiers. In Proceedings of the Fifth Annual ACM Workshop on Computational Learning Theory (pp. 144–152). New York: ACM Press.
Burges, C. J. C. (1998). A tutorial on support vector machines for pattern recognition. Data Mining and Knowledge Discovery, 2(2), 121–167.
Cao, L., & Tay, F. (2001). Financial forecasting using support vector machines. Neural Computing & Applications, 10, 184–192.
Chen, W. H., & Shih, J. Y. (2006). Comparison of support vector machines and back propagation neural networks in forecasting the six major Asian stock markets. International Journal of Electronic Finance, 1(1), 49–67.
Cortes, C., & Vapnik V. (1995). Support-vector network. Machine Learning, 20, 273–297.
Cover, T. M. (1965). Geometrical and statistical properties of system of linear inequalities with applications in the pattern recognition. IEEE Transaction on Electronic Computers, 14, 326–334.
Cristianini, N., & Shawe-Taylor, J. (2000). An introduction to support vector machine and other kernel-based learning methods. Cambridge, England: Cambridge University Press.
Dawson, C., & Wilby, R. (1998). An artificial neural network approach to rainfall-runoff modeling/Une approche de la modélisation pluie-deblt par ies réseaux neuronaux artificiels. Hydrological Sciences Journal/Journal-des Sciences Hydrologiques, 43(1), 47–66.
Dreiseitl, S., & Ohno-Machado, L. (2002). Logistic regression and artificial neural network classification models: A methodology review. Journal of Biomedical Informatics, 35, 352–359.
Epstein, R. M. (2007). Assessment in medical education. The New England Journal of Medicine, 356(4), 387–396.
Epstein, R. M., & Hundert, E. M. (2002). Defining and assessing professional competence. The Journal of the American Medical Association, 287, 226–235.
Fausett, L. (1994). Fundamentals of neural networks (pp. 22–26). Englewood Cliffs, NJ: Prentice-Hall, Inc.
Ferreira, C. (2006). Automatically defined functions in Gene Expression Programming. Studies In Computational Intelligence, 13, 21–56.
Fort, J. (2004, August 4). The report of Meharry Medical College student evaluation of medical curriculum. Nashville, TN: Meharry Medical College, School of Medicine Student Curriculum Evaluation.
Freeman, J., & Skapura, D. (1991). Neural networks algorithms, applications, and programming techniques. Menlo Park, CA: Addison-Wesley Publishing Company.
Gepsoft, Ltd. (2009). GeneXproTools, 4.0, modeling made easy. Retrieved November 21, 2010, from http://www.gepsoft.com/
Haykin, S. (1999). Neural networks: A comprehensive foundation. Upper Saddle River, NJ: Prentice Hall.
Hinton, G. E. (1992). How neural networks learn from experience. Scientific American, 267, 144–151.
Hodges, B., & McIlroy, J. H. (2003). Analytic global OSCE ratings are sensitive to level of training. Medical Education, 37, 1012–1016.
Page 21 IR Applications, Number 29, Curriculum Assessment Using Artificial Neural Network

Holtman, M. C., Swanson, D. B., Ripley, D. R., & Case, S. M. (2001). Using basic science subject tests to identify students at risk for failing step 1. Academic Medicine, 76(Suppl.10), 548–551.
Hosemer, D. W., & Lemeshow, S. (1989). Applied logistic regression. New York: John Wiley & Sons, Inc.
Hua, S., & Sun, Z. (2001). A novel method of protein secondary structure prediction with high segment overlap measure: Support vector machine approach. Journal of Molecular Biology, 308, 397–407.
Huang, C. J., Chu, S. S., & Guan, C. T. (2007). Implementation and performance evaluation of parameter improvement mechanisms for intelligent e-learning systems. Computers and Education, 49, 597–614.
Joachims, T. (1998). Text categorization with support vector machines: Learning with many relevant features. Proceedings of the ECML-98, 10th European Conference on Machine Learning: No. 1398, Chemnitz, Germany (pp. 137–142). Heidelberg, Germany: Springer.
Leung, W. C. (2002). Competency based medical training: Review. British Medical Journal, 325, 693–696.
Lewis, D., & Gale, W. (1994, July). A sequential algorithm for training text classifiers. Proceedings of the 17th Annual International ACM SIGIR Conference on Research and Development in Information Retrieval (pp. 3–12), Dublin, Ireland.
Luo, Z., Wu, X., Guo, S., & Ye, B. (2008, June). Diagnosis of breast cancer tumor based on manifold learning and support vector machine. IEEE International Conference on Information and Automation (pp. 703–707), Zhangjiajie, China.
Meharry Medical College. (2004). Meharry Medical College policy manual, Academic Affairs Policy IV. 1.5.2 (pp. 1–3). Nashville, TN: Author.
Menard, S. (1995). Applied logistic regression analysis. Thousand Oaks, CA: Sage Publications.
Min, J. H., & Lee, Y. C. (2005). Bankruptcy prediction using support vector machine with optimal choice of kernel function parameters. Expert Systems with Applications, 28(4), 603–614.
Mitia, S., & Hayastu, Y. (2006). Bioinformatics with soft computing. IEEE Transactions on System, Man, and Cybernetics—Part C: Applications and Reviews, 36(5), 616–635.
Naik, B., & Rogothaman, S. (2004). Predicting MBA success in college students. College Student Journal, 38(1), 143–149.
Norusis, M. J. (1985). SPSS-X advanced statistics guide. New York: McGraw-Hill.
Palomba, C. A., & Banta, T. W. (1999). Assessment essentials: Planning, implementing, and improving assessment in higher education. San Francisco: Jossey-Bass Inc.
Pilon, S., & Tandberg, D. (1997). Neural network and linear regression models in residency selection. American Journal of Emergency Medicine, 15, 361–364.
Puri, P., & Kohli, M. (2007). Forecasting student admissions in colleges with neural networks. International Journal of Computer Science and Network Security, 7(11), 298–303.
Reich, S. L., Gomez, D. R., & Dawidowski, L. E. (1999). Artificial neural network for the identification of unknown air pollution sources. Atmospheric Environment, 33, 3045–3052.
Ronco, A. L. (1999). Use of artificial neural networks in modeling associations of discriminant factors: Towards an intelligent selective breast cancer screening. Artificial Intelligence in Medicine, 16, 299–309.
Rüping, S. (2000). MySVM-Manual.Dortmund, Germany: University of Dortmund,
Sargent, D. J. (2001). Comparison of artificial neural networks with other statistical approaches: Results from medical data sets. Cancer, 91(Suppl. 8), 1636–1642.
Sawyer, R. (1996). Decision theory models for validating course placement tests. Journal of Educational Measurement, 33(3), 271–290
Schoelkopf, B., Burges, C. J. C., & Smola, A. J. (1999). Advances in kernel methods—Support vector learning. Cambridge, MA: MIT Press.
Schoelkopf, B., & Smola, A. J. (2002). Learning with kernels: Support vector machines, regularization, optimization, and beyond. Cambridge, MA: MIT Press.
Page 22 IR Applications, Number 29, Curriculum Assessment Using Artificial Neural Network

Schuwirth, L. W., van der Vleuten, C. P., Donkers, H. H. (1996). A closer look at cueing effects in multiple-choice questions. Medical Education, 30, 44–49.
Schuwirth, L. W., Verheggen M. M., van der Vleuten, C. P., Boshuizen, H. P., & Dinant, G. J. (2001). Do short cases elicit different thinking processes than factual knowledge questions do? Medical Education, 35, 348–356.
Sherrod, P. H. (2007). DTREG predictive modeling and forecasting. Retrieved November 21, 2010, from http://www.dtreg.com
Shin, K. S., Lee, T. S., & Kim, H. J. (2005). An application of support vector machines in bankruptcy prediction models. Expert Systems with Applications, 28(1), 127–135.
Sordo, M. (2002). Introduction to neural networks in healthcare. Open Clinical: Knowledge Management for Medical Care, Harvard University. Available from www.openclinical.org/docs/int/neuralnetworks011.pdf
SPSS, Inc. (2008). SPSS Neural Networks 16.0 manuals. Chicago, IL: Author.
Sunn, G. (1998). Support vector machines for classification and regression (Tech. Report). Southampton, England: University of Southampton, Image Speech and Intelligent System Group.
Takeuchi, K., & Collier, N. (2005). Bio-medical entity extraction using support vector machines. Artificial Intelligence in Medicine, 33, 125–137.
Vapnik, V. (1995). The nature of statistical learning theory. New York: Springer-Verlag.
Vapnik, V. (1999). The nature of statistical learning theory (2nd ed.). New York: Springer-Verlag.
Wan, V, & Campbell, W. M. (2008, June). Support vector machines for speaker verification and identification. IEEE International Workshop on Neural Networks for Signal Processing, Sydney, Australia.
Wolf, P., Hill, A., & Evers, F. (2006). Handbook for curriculum assessment. Ontario, Canada: University of Guelph.
Wu, T. K., Huang, S. C., & Meng, Y. R. (2008). Evaluation of ANN and SVM classifiers as predictors to the diagnosis of students with learning disabilities. Expert Systems with Applications, 34, 1846–1856.
Zeng, D., Xu, J., Gu, J., Liu, L., & Xu, G. (2008, August 2–3). Short term traffic flow prediction based on online learning SVR. IEEE Computer Society, 616–620.
Zutada, J. M. (1992). Introduction to artificial neural systems (pp. 163–250). St. Paul, MN: West Publishing Company.
Page 23 IR Applications, Number 29, Curriculum Assessment Using Artificial Neural Network

IR Applications is an AIR refereed publication that publishes articles focused on the application of advanced and specialized methodologies. The articles address applying qualitative and quantitative techniques to the processes used to support higher education management.
IR Applications Number 29 Page 24
Authors can submit contributions from various sources such as a Forum presentation or an individual article. The articles should be 10-15 double-spaced pages, and include an abstract and references. Reviewers will rate the quality of an article as well as indicate the appropriateness for the alternatives. For articles accepted for IR Applications, the author and reviewers may be asked for comments and considerations on the application of the methodologies the articles discuss.
Articles accepted for IR Applications will be published on the AIR Web site and will be available for download by AIR members as a PDF document. Because of the characteristics of Web-publishing, articles will be published upon availability providing members timely access to the material.
Please send manuscripts and/or inquiries regarding IR Applications to Dr. Gerald McLaughlin.
© 2010, Association for Institutional Research
EDITOR:
Dr. Gerald W. McLaughlinAssociate Vice President
for Enrollment Management
and Marketing
DePaul University
1 East Jackson, Suite 1501
Chicago, IL 60604-2216
Phone: 312-362-8403
Fax: 312-362-5918
MANAGING EDITOR:
Dr. Randy L. SwingExecutive Director
Association for Institutional Research
1435 E. Piedmont Drive
Suite 211
Tallahassee, FL 32308
Phone: 850-385-4155
Fax: 850-385-5180
AIR PROFESSIONAL FILE EDITORIAL BOARDDr. Trudy H. BersSenior Director of
Research, Curriculum and PlanningOakton Community College
Des Plaines, IL
Dr. Stephen L. ChambersDirector of Institutional Research
and Assessment Coconino Community College
Flagstaff, AZ
Dr. Anne Marie DelaneyDirector of
Institutional ResearchBabson CollegeBabson Park, MA
Mr. Jacob P. GrossAssociate Director for Research
Indiana University/Project on Academic Success1900 E 10th Ste 630
Bloomington, IN
Dr. Ronald L. Huesman Jr.Assistant Director,
Office of Institutional ResearchUniversity of Minnesota
Minneapolis, MN
Dr. David Jamieson-DrakeDirector of
Institutional ResearchDuke University
Durham, NC
Dr. Julie P. Noble,Principal Research Associate
ACT, Inc.Iowa City, Iowa
Dr. Gita W. PitterAssociate VP, Institutional Effectiveness
Florida A&M UniversityTallahassee, FL 32307
Dr. James T. PoseyDirector of Institutional Research & Planning
University of Washington Tacoma, WA 98402
Dr. Harlan M. SchweerDirector, Office of Institutional Research
College of DuPageGlen Ellyn, IL
Dr. Jeffrey A. SeybertDirector of
Institutional ResearchJohnson County Community College
Overland Park, KS
Dr. Bruce SzelestAssociate Director ofInstitutional Research
SUNY-AlbanyAlbany, NY
Mr. Daniel Jones-WhiteAnalyst
University of MinnesotaMinneapolis, MN


![Experience Dissatisfaction[1]](https://img.pdfslide.net/doc/110x75/577ce6361a28abf1039261dd/experience-dissatisfaction1.jpg)