Embed Size (px)
Citation preview

Financial Highlights 2
Corporate Overview 3
Performance Highlights 4
Financials 9
Segment wise Profitability 12
Revenue Analysis 14
Constant Currency Reporting 15
Client Metrics 16
Operational Metrics - Software Services
Employee Metrics 18
Facility Details 20
Cash and Cash Equivalents, Investments & Borrowings 20
17
Financial in INR as per convenience translation 21
Follow us at: /hcltechnologies /hcltech /hcltechtube
stResults for Quarter(Q2) ended 31 Dec, 2012
Revenues at US$ 1,154 mn; Up 13.0% YoY & 3.6% QoQ Net Income at US$ 177 mn; Up 59.1% YoY & 9.7% QoQ
Inv
es
or
Re
l ea
se
tN
oid
a,
NC
R,
Ind
ia,
Ja
nu
ar
y 1
7th
, 2
01
2
Revenue at 6,274 crores; Up 19.6% YoY & 3.0% QoQ Net Income at 965 crores; Up 68.5% YoY & 9.0% QoQ
Seco
nd Q
uart
er
Resu
lts
FY 2
013
HCL Technologies Second Quarter Fiscal 2013 Results
stResults for Calendar Year(CY) ended 31 Dec, 2012
Revenues at US$ 4,396 mn; Up 12.7% YoY Net Income at US$ 616 mn; Up 41.2% YoY
Revenue at 23,499 crores; Up 28.2% YoY Net Income at 3,306 crores; Up 61.4% YoY
TCV of deals won aggregate US$ 1 Billion
Anant Gupta elevated to the position of President and CEO. Vineet Nayar continues as Vice Chairman.
2
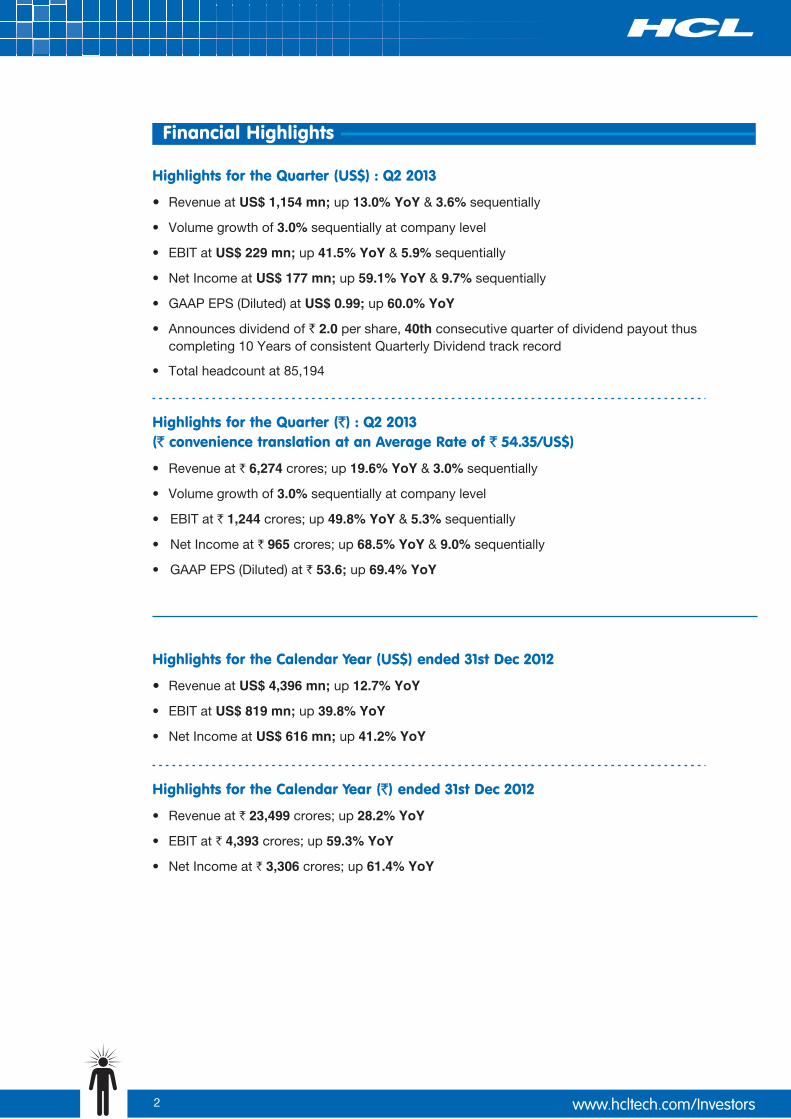
Highlights for the Quarter (US$) : Q2 2013
?Revenue at US$ 1,154 mn; up 13.0% YoY & 3.6% sequentially
• Volume growth of 3.0% sequentially at company level
• EBIT at US$ 229 mn; up 41.5% YoY & 5.9% sequentially
• Net Income at US$ 177 mn; up 59.1% YoY & 9.7% sequentially
• GAAP EPS (Diluted) at US$ 0.99; up 60.0% YoY
• Announces dividend of ` 2.0 per share, 40th consecutive quarter of dividend payout thus completing 10 Years of consistent Quarterly Dividend track record
• Total headcount at 85,194
`
` `
Highlights for the Quarter ( ) : Q2 2013
( convenience translation at an Average Rate of 54.35/US$)
`
` `
• Revenue at ` 6,274 crores; up 19.6% YoY & 3.0% sequentially
• Volume growth of 3.0% sequentially at company level
• EBIT at ` 1,244 crores; up 49.8% YoY & 5.3% sequentially
• Net Income at ` 965 crores; up 68.5% YoY & 9.0% sequentially
• GAAP EPS (Diluted) at ` 53.6; up 69.4% YoY
Highlights for the Calendar Year (US$) ended 31st Dec 2012
?Revenue at US$ 4,396 mn; up 12.7% YoY
• EBIT at US$ 819 mn; up 39.8% YoY
• Net Income at US$ 616 mn; up 41.2% YoY
`Highlights for the Calendar Year ( ) ended 31st Dec 2012`
• Revenue at ` 23,499 crores; up 28.2% YoY
• EBIT at ` 4,393 crores; up 59.3% YoY
• Net Income at ` 3,306 crores; up 61.4% YoY

The growth momentum of HCL Technologies continues with an exceptional Calendar Year and Quarter performance.
"Calendar 2012 has been an exceptional year for HCL. While the entire Industry saw a very difficult year, HCL fired on all cylinders. Our revenues grew 13%, profits grew 41% and operating margin expanded by 360 bps.
I am also very pleased to announce the elevation of Anant Gupta as the President and CEO of HCL Technologies. Vineet Nayar will continue as the Vice Chairman and Joint Managing Director of the company till July 2013 and as Vice Chairman thereafter.”, said Shiv Nadar, Chairman and Chief Strategy Officer, HCL Technologies.
“On the back of this exceptional Calendar Year performance, our quarterly results demonstrate increasing momentum. In the OND quarter we grew 3.6% QoQ, our highest over the last 5 quarters and 13% year on year. Our EBIT Margin improved 400 bps over the year to reach 19.8%. Our net margin has improved for five straight quarters to reach 15.4%, and net income grew 59% YoY and 9.7% sequentially. All in all, this has been a quarter of great impetus which has placed HCL in a position of advantage for leveraging the changing market dynamics.”, said Vineet Nayar, Vice Chairman, HCL Technologies.
“Our growth this quarter was driven by Infrastructure and Financial Services, both growing in excess of 10% sequentially. Six large transformational deals have once again given us a billion dollar booking quarter. On the back of this industry-leading performance HCL is now ready to redefine the market with its Alternative Outsourcing (AO) model. The AO approach consists of business-outcome aligned IT services delivered through alternate delivery models like XaaS.”, said Anant Gupta, President & , HCL Technologies.
“HCL has continued to demonstrate industry leading growth with superior returns to its shareholders. The annualized return on equity this quarter has been at 35%. The cash generation backed by higher profitability and efficient working capital management continued to be robust. During the 6 months ended 31st December, 2012, the operating cash flow to net income has been 95% while the free cash flow to EBITDA has been more than 50%. This quarter HCL completes 10 straight years of quarterly dividend pay-out.”, said Anil Chanana, Chief Financial Officer, HCL Technologies.
CEO
3

4
Overall Company : Performance Trends
3,091
3,901
4,396
CY 10 CY 11 CY 12
in
Mn
USD
Consolidated Revenues (CY)
26%
13%3 Year CAGR : 21%
Cash Conversion (CY)
311285
437 448
672
Net Income (CY) Operating Cash Flow (CY)
616OCF/NI > 100%
in
Mn
USD
EBIT (CY)
in
Mn
USD
441
586
819
33%
40%
3 Year CAGR : 25%
CY 10 CY 11 CY 12
311
436
616
Net Income (CY)
41%
40%
3 Year CAGR : 37%
in
Mn
USD
CY 10 CY 11 CY 12 CY 10 CY 11 CY 12
5 Yr Avg. at ~48%
48%
41% 25%
74%
53%
FY08 FY09 FY10 FY11 FY12
in%
Dividend as % of FCF - Past 5 years
Dividend as % of FCF
20%
25%
31%
CY 10 CY 11 CY 12
ROE (CY)
ROE
in %

5
• Revenues grow by 3.1%
• Europe and Americas grow 4.2% and 3.4% respectively
• Growth witnessed across key Service Offerings led by Infrastructure Services at 10.0%, Custom Application Services at 1.7% and BPO Services at 0.7%
• Broad based growth across Verticals led by Financial Services at 10.1%, Energy-Utilities-Public Services at 4.7% and Media Publishing & Entertainment at 4.2%
QoQ Revenue Growth in Constant Currency
YoY Revenue Growth (on CY basis)
• Europe and Americas grow 17.3% and 14.5% respectively
• Growth posted by Infrastructure Services at 22.2%, Engineering and R&D Services at 12.3%, Enterprise Application Services 9.7% and Custom Application Services at 8.9%
• Growth led by Healthcare at 53.9%, Retail & CPG at 18.1%, Media Publishing & Entertainment at 15.1% and Manufacturing at 10.9% respectively
Reported Currency US $ Growth
Particulars Segments
CY 12 overCY 11 QoQ YoY
Service Offering
Custom Application 8.9% 2.5% 5.2%
BPO Services 4.0% 1.7% 9.7%
Engineering and R&D Services 12.3% 0.4% 5.2%
Enterprise Application Services 9.7% -0.9% 5.5%
Infrastructure Services 22.2% 10.9% 37.2%
Consolidated For the Company 12.7% 3.6% 13.0%
Geography
Americas 14.5% 3.4% 9.4%
Europe 17.3% 6.0% 20.1%
ROW -0.6% 0.3% 14.3%
Verticals
Media Publishing & Entertainment (MPE) 15.1% 4.6% 23.7%
Retail & CPG 18.1% 1.2% 16.2%
Healthcare 53.9% 3.1% 56.7%
Manufacturing 10.9% 2.3% 4.1%
Energy-Utilities-Public Services 5.4% 5.1% 23.3%
Telecom -2.2% -2.0% 0.7%
Financial Services 7.5% 11.3% 15.1%
OND’12

6
HCL has won 12 multi-year, multi-million dollar deals with Fortune500/Global 2000 corporations this quarter, six of which are large integrated engagements. A majority of these engagements are from Americas and Europe.
Transformational and Blue Chip Customer Acquisition
This quarter saw many significant engagements signed across the world reiterating a continued relevance of HCL’s integrated suite of services.
• HCL has entered into a multi-year, multi-regional end-to-end IT Infrastructure management outsourcing services agreement with a leading Fortune 500 mobile and communication services provider.
• HCL has signed a large IT infrastructure services engagement with a US based market research and business information services company.
• HCL has signed a multi-year application services engagement with a Fortune 500 provider of diagnostic testing services to provide application development, testing & support services.
• HCL has won a multi-year contract from a Fortune 500 Consumer packaging company for supporting its Oracle Deployment rollout among various plant locations in US.
• HCL has been selected by a US based financial services company for a strategic SAP deployment initiative that will improve efficiencies and enhance analytical capability, reduce system life-cycle costs through minimal customization among other efforts.
• HCL has entered into a strategic product engineering and R&D engagement with one of the largest Automotive Infotainment supplier in Japan to support its Asia Pacific customer base. HCL is building next generation navigation prototypes for leading automotive majors through this engagement and is on course to build a multi-year ODC partnership to support all infotainment initiatives in the region.
• HCL has been selected by a leading US based beverage company for a large transformation program for their legacy applications migration.
• HCL has been chosen by a leading US based Healthcare products and services provider to customize its Electronic Health Record product, enhance flagship Practice Management product and provide maintenance support to two of its legacy products through end-of-life.
• HCL has been chosen by a leading provider of unit-linked life insurances in Europe for providing testing services for its entire applications suite as well as setting up of a dedicated Test Factory.
• HCL has been chosen by a US based Fortune 500 provider of transportation, logistics and supply chain management solutions for Application Management and Support Services.
• HCL has signed a deal with one of the largest US headquartered healthcare companies for Service cloud implementation. The deal involves extensive data migration, system upgrades and multiple languages support.
Key Engagements

7
• Technology Business Research Inc. (TBR), a leading independent technology market research and consulting firm, has released a report titled ‘Commitment to relationships and employee investment make HCL the exception to the rule’. The Report highlights HCL’s people-centric strategy as its competitive differentiator. It cites HCL’s “unrelenting focus on investing in its people”, strong “management bench strength” and innovative systems that allow employees to generate value for customers, as its core differentiators in the market. The Report notes that this focus has resulted in building strong client relationships which have enabled a robust growth momentum for HCL.
• Leading Analyst group ‘Frost & Sullivan’ has released a ‘Best Practice Guidebook’ profiling HCL’s Employees First, Customers Second (EFCS) philosophy as a successful case-study of business model transformation. The report titled ‘Business Model Transformation: empowering employees to focus on the customer’ chronicles in detail the execution successes of HCL’s growth story led by EFCS and how other companies can apply the same model to transform their business.
• ‘Employees First, Customers Second – turning conventional management wisdom upside down’ (HBP. June 2010), the book authored by Vineet Nayar, Vice Chairman, HCL Technologies bagged two prestigious management book prizes in France – ‘The Olivier Lecerf Award’ and ‘The Foundation Manpower - HEC prize’. ‘The Olivier Lecerf Award’ named after the former CEO and Chairman of Lafarge recognizes CEOs who have contributed to innovative management through books they have written themselves. ‘The Foundation Manpower- HEC Prize’ recognizes authors who have contributed to innovative management practices.
• HCL has won the ‘2012 Optimas Award for Global Outlook’ in recognition of its ‘Working Across Borders’, program aimed at incubating an inclusive work-culture.
• HCL’s Customer Advisory Council has been honored with the “Forrester Groundswell Award” in the ‘Business-to-Business Embracing’ category at the Forrester eBusiness Forum held in , Chicago in October 2012.HCL Customer Advisory Council (CAC) is a global collaborative platform where HCL’s major C-level customers and thought leaders convene bi-annually.
• HCL organized the ‘O2 - League of the extraordinary’ event to recognize its ‘Outstanding’ employees across the world. The O2 platform has been designed to recognize and applaud the company’s top performers and their extraordinary contributions.
• HCL’s Consumer Services, Manufacturing, Public Services and Health Care is the world's first organizational unit which is successfully appraised for CMMI Level 5 (Development & Services + SSD) V 1.3 covering all Custom Application Service lines. The assessment was done by KPMG in October-November 2012.
• HCL organized its Industry Analyst & Advisor Day 2012 ‘Insight HCL’, in Boston and London where its achievements over the last two years and the company’s broad strategy going forward were highlighted. The event was attended by 25 customers, over 166 industry analysts and 35 HCL leaders.
• HCL has signed a global partnership agreement with SAP to offer a mobility-related offering called ‘Managed Mobility.’ This includes Road Mapping, Mobile Application Development, Mobile Application Management, Mobile Application Testing and Mobility Outsourcing. The agreement enables HCL to resell and host SAP Mobility Platform (Sybase Unwire Platform, Afaria and Syclo) licenses.
• HCL has developed ‘FinEdge Wealth’, a wealth management solution on MS Dynamics CRM. The FinEdge Wealth CRM solution will enable wealth management companies to track and manage customer interactions and adapt programs to changing customer market segments.
Thought Leadership

8
• HCL has received the ‘2012 Service Excellence award’ from Brocade, a leader in Data Center Networking Solutions, in recognition of its significant contribution and commitment to providing multi-domain services to Brocade.
• HCL has been crowned CEVA’s ‘Global Supplier of the Year’ in recognition of the support it has provided in the “delivery of three of CEVA’s five strategic priorities in the last 12 months for true commitment to working in partnership”.
Best in-class customer satisfaction
• HCL unveiled its second Corporate Sustainability Report under the Global Reporting Initiative (GRI) 3.1 framework. The Sustainability Report showcases the manner in which HCL has continued to leverage its core competencies, people, values and ‘Employees First, Customers Second’ culture to reinforce its commitment to the ecosystem including environment and the diverse communities.
• HCL participated in the Carbon Disclosure Project (CDP) India for the second consecutive year in 2012 and received a rating of 66/100, which is above the industry average. HCL scored higher than average in the categories of Risk Mitigation, Emission Reporting and Management and Stakeholder Engagement and Verification. CDP is an independent not-for-profit organization working to drive greenhouse gas emissions reduction and sustainable water use by business and cities.
• HCL unleashed a women empowerment initiative ‘Badhtey Kadam’ for women from HCL Youth Centers with the objective of uplifting their lives by providing education and fostering economic independence.
• HCL launched ‘Ability Connect’, an affinity network that would focus on creating an inclusive workplace for specially-abled persons. This initiative is a step towards creating awareness among employees on inclusion at workplace. The quarter also witnessed the launch of ‘Pukaar’ for integrating persons with hearing impairments into the mainstream. HCL additionally focused recruitment drives for absorbing persons with special abilities into the workforce.
Diversity and Sustainability
• HCL has been named as a ‘Market Leader’ in the report titled “Achieving Market Leadership in Engineering and R&D Services” published in Oct 2012 by Frost & Sullivan. HCL emerged as the strongest India-centric Engineering Services Outsourcing Provider in this report that was attributed to its noteworthy market performance.
• HCL has been awarded the ‘2012 Leadership Awards for the Embedded/VLSI Industry’, for ‘Outstanding Contribution to VLSI/ Embedded Design Industry – Corporate’ by leading media group SiliconIndia.
• HCL has been mentioned in the list of TOP 5 Service Providers for the UK Industry Specific Insurance BPO market by Full Time Employees (FTE) Scale in Everest’s Report “Insurance Business Process Outsourcing (BPO) Market, 2011-2012 Annual Report”.
• HCL has been mentioned in the list of Top 15 ITO & BPO Service Providers based on Year To Date (YTD) 2012 Annualized Contract Value (ACV) in ISG’s report “The TPI Index Global Sourcing Market Data and Insights Third Quarter 2012.”
Market leadership

9
Financials
Consolidated financial results for the Quarter ended 31st December, 2012 drawn under US GAAP
Consolidated Income Statement
Amount in US $ million
*After adjusting for non cash employee stock options charge
Note: - The above results do not take into account non cash employee stock options charge computed under ASC 718, as per details given here:-
Quarter Ended
Particulars (in US $ mn)
Options Charge 4.2 4.1 4.1
Tax benefit 0.3 0.3 0.3
Option Charge (net-of tax benefit) 3.9 3.8 3.7
31-Dec-11 30-Sep-12 31-Dec-12
Income Statement Quarter ended Growth
31-Dec-11 30-Sep-12 31-Dec-12 YoY QoQ
Revenues 1,021.9 1,113.8 1,154.3 13.0% 3.6%
Direct Costs 684.6 721.5 740.8
Gross Profits 337.3 392.3 413.5 22.6% 5.4%
SG & A 148.2 145.2 152.9
EBITDA 189.0 247.0 260.6 37.9% 5.5%
Depreciation 24.9 28.8 29.5
Amortisation 2.3 2.2 2.2
EBIT 161.8 216.1 229.0 41.5% 5.9%
Foreign Exchange Gains/(loss) (14.8) (11.1) (2.3)
Other Income, net 1.7 6.5 5.1
Provision for Tax 37.2 49.7 54.3
Share of Income / (loss) of minority shareholders - - -
Net Income 111.6 161.8 177.5 59.1% 9.7%
Gross Margin 33.0% 35.2% 35.8%
EBITDA Margin 18.5% 22.2% 22.6%
EBIT Margin 15.8% 19.4% 19.8%
Net Income Margin 10.9% 14.5% 15.4%
Earnings Per Share (EPS)
Annualized in US $
Basic 0.65 0.93 1.02 58.2%
Diluted 0.64 0.92 1.01 57.7%
Earnings Per Share (EPS) - GAAP*
Annualized in US $
Basic 0.62 0.91 1.00 60.5% Diluted 0.62 0.90 0.99 60.0%“Weighted average Number of
Shares used in computing EPS” Basic 690,319,989 693,570,313 694,273,119
Diluted 699,197,467 703,782,987 705,335,855

10
The options will vest in tranches till 2016
Outstanding Options
Options at market price 4,765,480 - 4,765,480
Options at less than market price 1,414,464 12,129,360 13,543,824
(in equivalent no of shares) 31-Dec-11 30-Sep-12 31-Dec-12
Amount in US$ million
Note: Change in Current Assets and Other Assets includes (1) Increase commensurate with size of business; (2) Reclassification of leasehold land from capital lease to operating lease and reclassification of advance paid for leasehold land, and accordingly change in Head from “Fixed Assets” to “Current Assets and Other Assets”, as per details provided in Q3 results; (3) Increase in deferred tax asset mainly due to timing differences
Change in Current Liabilities and Other Liabilities includes (1) Increase commensurate with size of business; (2) Unrealized loss on foreign exchange hedges; (3) Increase in Taxes payable
Particulars As on
Assets
Cash and Cash Equivalents 108.6 188.4
Accounts Receivables, net 731.4 698.4
Unbilled Receivables 299.5 284.3
Deposits with Banks 274.9 279.5
Deposits with HDFC Ltd. 18.9 18.2
Investment Securities, available for sale 101.1 116.8
Other Current Assets 315.4 320.3
Total current assets 1,849.8 1,905.9
Property and Equipments, net 481.3 466.4
Intangible Assets, net 904.3 896.2
Investment Securities, held to maturity 17.9 17.2
Investments in Equity Investee 7.7 8.1
Other Assets 319.6 339.5
Total assets 3,580.6 3,633.3
Liabilities & Stockholders' Equity
Current Liabilities 830.3 861.3
Borrowings
Other Liabilities
Total Liabilities 1,362.7 1,387.2
Total Stockholders Equity
Total Liabilities and Stockholders Equity 3,580.6 3,633.3
30-Sep-12 31-Dec-12
Fixed
310.6 290.2
221.8 235.8
2,217.8 2,246.1

11
Amount in US $ million
Particulars For For Quarter Ended
CASH FLOWS FROM OPERATING ACTIVITIES
Net Income
Adjustments to Reconcile Net Income to Net Cash provided by Operating Activities
Depreciation and Amortization
Others
Changes in Assets and Liabilities, net
Accounts Receivable
Other Assets
Current Liabilities (8.3) 42.2
Net Cash provided by operating Activities
CASH FLOWS FROM INVESTING ACTIVITIES
Purchase of Property and Equipment (net) (63.2) (22.1)
(Purchase) / Sale of Investments
Deposits with Banks
Payments for Business Acquisitions, net of cash acquired (1.9) (0.0)
Net Cash used in Investing Activities
CASH FLOWS FROM FINANCING ACTIVITIES
Proceeds from Issuance of Employees Stock Options
Dividend
Loans
Others
Net Cash provided by (used in) Financing Activities
CASH AND CASH EQUIVALENTS
Beginning of the Period
End of the Period
Period Ended Dec'12 Dec’12
339.3 177.5
62.6 31.7
4.3 1.3
(18.4) 31.6
(58.8) (33.4)
320.6 250.8
(17.6) (19.8)
(26.7) (15.4)
(109.5) (57.4)
2.8 1.1
Proceeds from Issuance/(Redemption) of Debentures (60.7) 0.0
(89.0) (89.0)
1.6 (16.2)
0.3 0.3
(144.9) (103.7)
Effect of Exchange Rate on Cash and Cash Equivalents 2.2 (9.9)
Net Increase/ (Decrease) in Cash and Cash Equivalents 68.5 79.8
119.9 108.6
188.4 188.4

12
Amount in US $ million
Income Statement Quarter ended Growth
31-Dec-11 30-Sep-12 31-Dec-12 YoY QoQ
Revenues 975.4 1,063.7 1,103.3 13.1% 3.7%
Direct Costs 648.0 686.3 706.3
Gross Profits 327.4 377.4 397.0 21.3% 5.2%
SG & A 137.4 134.9 142.3
EBITDA 190.0 242.4 254.8 34.1% 5.1%
Depreciation 22.3 25.3 26.6
Amortisation 2.3 2.1 2.1
EBIT 165.4 215.0 226.0 36.7% 5.1%
Gross Margin 33.6% 35.5% 36.0%
EBITDA Margin 19.5% 22.8% 23.1%
EBIT Margin 17.0% 20.2% 20.5%
Income Statement Quarter ended Growth
31-Dec-11 30-Sep-12 31-Dec-12 YoY QoQ
Revenues 46.4 50.1 51.0 9.7% 1.7%
Direct Costs 36.6 35.2 34.5
Gross Profits 9.8 14.9 16.5 67.5% 10.5%
SG & A 10.8 10.3 10.6
EBITDA (1.0) 4.6 5.9
Depreciation 2.5 3.5 2.8
Amortisation - 0.1 0.1
EBIT (3.5) 1.1 2.9
Gross Margin 21.2% 29.8% 32.4%
EBITDA Margin -2.1% 9.2% 11.5%
EBIT Margin -7.6% 2.1% 5.7%
Amount in US $ million

13
Amount in US $ million
Amount in US $ million
Income Statement Quarter ended Growth
31-Dec-11 30-Sep-12 31-Dec-12 YoY QoQ
Revenues 736.4 767.9 775.3 5.3% 1.0%
Direct Costs 477.7 481.3 478.0
Gross Profits 258.7 286.6 297.3 14.9% 3.7%
SG & A 114.6 106.4 113.0
EBITDA 144.1 180.2 184.3 27.9% 2.3%
Depreciation 14.6 16.1 16.5
Amortisation 2.3 2.1 2.1
EBIT 127.2 162.0 165.7 30.2% 2.3%
Gross Margin 35.1% 37.3% 38.3%
EBITDA Margin 19.6% 23.5% 23.8%
EBIT Margin 17.3% 21.1% 21.4%
Income Statement Quarter ended Growth
31-Dec-11 30-Sep-12 31-Dec-12 YoY QoQ
Revenues 239.1 295.8 328.0 37.2% 10.9%
Direct Costs 170.4 205.0 228.3
Gross Profits 68.7 90.7 99.7 45.1% 9.9%
SG & A 22.8 28.5 29.3
EBITDA 45.9 62.2 70.4 53.4% 13.2%
Depreciation 7.8 9.2 10.1
EBIT 38.1 53.0 60.3 58.2% 13.8%
Gross Margin 28.7% 30.7% 30.4%
EBITDA Margin 19.2% 21.0% 21.5%
EBIT Margin 16.0% 17.9% 18.4%

14
Geographic Mix (Quarter ended)
Americas 58.7% 57.0% 56.9% 56.8%
Europe 26.8% 27.9% 28.5% 28.0%
ROW 14.4% 15.1% 14.6% 15.2%
31-Dec-11 30-Sep-12 31-Dec-12 CY Mix
Service Offering Mix (Quarter ended)
Enterprise Application Services 20.3% 19.9% 19.0% 20.1%
Engineering and R&D Services 18.9% 18.1% 17.6% 18.2%
Custom Application Services 32.8% 31.0% 30.6% 31.2%
Infrastructure Services 23.4% 26.6% 28.4% 26.0%
BPO Services 4.5% 4.5% 4.4% 4.5%
31-Dec-11 30-Sep-12 31-Dec-12 CY Mix
Revenue by Contract Type for
Time & Material (T&M) 53.9% 48.8% 48.6%
Fixed Price Projects 46.1% 51.2% 51.4%
IT Services
(Quarter ended)
31-Dec-11 30-Sep-12 31-Dec-12
Rupee / US Dollar Rate
Quarter Ended 53.10 52.87 54.99
Average for the Quarter 51.33 54.69 54.35
31-Dec-11 30-Sep-12 31-Dec-12
Revenue by Vertical (Quarter ended)
Financial Services 25.3% 24.1% 25.8%
Telecom 8.0% 7.5% 7.1%
Media, Publishing & Entertainment (MPE) 6.4% 7.0% 7.0%
Energy-Utilities-Public Sector 6.4% 6.9% 7.0%
Others 6.9% 5.7% 4.8%
31-Dec-11 30-Sep-12 31-Dec-12
Manufacturing 29.5% 27.6% 27.2%
Healthcare 8.6% 12.0% 11.9%
Retail & CPG 8.8% 9.2% 9.0%

15
Reported OND 11 JFM 12 AMJ 12 JAS 12 OND 12
Revenue ($ Mn) 1,021.9 1,047.9 1,079.6 1,113.8 1,154.3
Growth QoQ 2.0% 2.5% 3.0% 3.2% 3.6%
Growth YoY 18.3% 14.6% 12.1% 11.1% 13.0%
Constant Currency (QoQ)
Revenue ($ Mn) 1,038.9 1,041.7 1,095.6 1,111.0 1,148.0
Growth QoQ 3.7% 1.9% 4.5% 2.9% 3.1%
Constant Currency (YoY)
Revenue ($ Mn) 1,025.3 1,055.7 1,120.6 1,140.4 1,154.7
Growth YoY 18.7% 15.4% 16.4% 13.8% 13.0%
OND 11 JFM 12 AMJ 12 JAS 12 OND 12
OND 11 JFM 12 AMJ 12 JAS 12 OND 12
Average Rates for Quarter
GBP 1.57 1.59 1.58 1.59 1.61
EURO 1.34 1.33 1.27 1.26 1.31
INR 0.02 0.02 0.02 0.02 0.02
SGD 0.78 0.80 0.79 0.81 0.82
AUD 1.03 1.06 1.01 1.04 1.04
OND 11 JFM 12 AMJ 12 JAS 12 OND 12
Particulars Segment US$ QoQ Growth at CC
Consolidated For the Company 3.1%
Geography Americas 3.4%
Europe 4.2%
ROW 0.0%
Service Offering Custom Application Services 1.7%
Engineering and R&D Services 0.5%
Enterprise Application Services -1.3%
Software Services 0.5%
Infrastructure Services 10.0%
IT Services 3.2%
BPO 0.7%
Verticals Financial Services 10.1%
Energy-Utilities-Public Sector 4.7%
Media Publishing & Entertainment (MPE) 4.2%
Healthcare 2.6%
Manufacturing 2.0%
Retail & CPG 0.7%
Telecom -2.2%
Clients (LTM) Top 5 (LTM) -0.3%
Top 10 (LTM) 1.4%
Top 20 (LTM) 2.1%

16
Client Contribution to Revenue QoQ growth
Top 5 Clients 15.8% 16.2% 15.7% 0.1%
Top 10 Clients 24.2% 24.5% 24.2% 1.7%
Top 20 Clients 33.9% 33.6% 33.3% 2.2%
(LTM) 31-Dec-11 30-Sep-12 31-Dec-12
Number of Million Dollar Clients QoQ YoYChange
100 Million dollar + 3 5 5 - 2
50 Million dollar + 9 10 10 - 1
40 Million dollar + 12 14 15 1 3
30 Million dollar + 23 29 29 - 6
20 Million dollar + 42 49 50 1 8
10 Million dollar + 84 98 98 - 14
5 Million dollar + 144 173 178 5 34
1 Million dollar + 362 401 418 17 56
(LTM) 31-Dec-11 30-Sep-12 31-Dec-12Change
Client Data (LTM)
Number of Clients
Active Client Relationship 516 536 544
New Client Relationship 57 38 39
31-Dec-11 30-Sep-12 31-Dec-12
“LTM” - Last Twelve Months
Client Business -
Repeat Business - Consolidated 94.4% 94.6% 93.8%
Days Sales Outstanding - 55 59 54excluding unbilled receivables
(LTM) 31-Dec-11 30-Sep-12 31-Dec-12

17
Software Services (Quarter Ended)
Efforts
Offshore 72.5% 74.2% 74.2%
Onsite 27.5% 25.8% 25.8%
Revenue
Offshore 42.1% 44.3% 44.9%
Onsite 57.9% 55.7% 55.1%
Utilization
Offshore - Including trainees 69.6% 74.2% 75.6%
Offshore - Excluding trainees 76.1% 77.4% 77.6%
Onsite 95.9% 95.3% 97.3%
31-Dec-11 30-Sep-12 31-Dec-12
Blended Utilization (Excl. Trainees) 80.7% 81.4% 81.9%
Software Services Efforts (Man Months)
Efforts Billed - Offshore 83,831 92,104 92,518
Efforts Billed – Onsite 31,782 31,966 32,095
Total Billed Efforts
Not Billed 27,691 28,434 27,616
Trainee 10,268 5,078 3,145
Not Billed (including trainees) 37,959 33,512 30,761
31-Dec-11 30-Sep-12 31-Dec-12
115,613 124,070 124,613

18
* Excludes involuntary attrition
Manpower Details
Total Employee Count 83,076 85,335 85,194
IT Services (Software Services [A1] + 72,055 75,621 75,226 Infrastructure Services [A2])
Technical
Support 6,789 7,265 7,261
Gross Addition 4,931 4,479 3,291
Net Addition 1,734 946 (395)
Gross Lateral Employee Addition 3,144 3,572 2,866
Attrition (LTM)* - IT Services (Software Services + Infrastructure Services) 15.7% 13.6% 13.6%
BPO Services - Total 11,021 9,714 9,968
Technical 10,106 8,798 8,992
Support 915 916 976
Gross Addition 2,873 1,893 1,845
Net Addition 822 70 254
Gross Lateral Employee Addition 2,873 1,893 1,845
Offshore Attrition – Quarterly 6.1% 7.6% 8.7%
Offshore Attrition - Quarterly(excluding attrition of joinees less than 6 months) 5.6% 7.3% 8.3%
31-Dec-11 30-Sep-12 31-Dec-12
65,266 68,356 67,965

19
Software Services - Total 54,624 55,266 53,943
Technical 49,223 49,453 48,098
Support 5,401 5,813 5,845
Gross Addition 3,635 2,394 1,378
Net Addition 1,353 (181) (1,323)
Gross Lateral Employee Addition 1,854 1,578 1,339
Attrition (LTM) 15.3% 13.4% 13.6%
31-Dec-11 30-Sep-12 31-Dec-12
Infrastructure Services - Total 17,431 20,355 21,283
Technical 16,043 18,903 19,867
Support 1,388 1,452 1,416
Gross Addition 1,296 2,085 1,913
Net Addition 381 1,127 928
Gross Lateral Employee Addition 1,290 1,994 1,527
Attrition (LTM) 17.0% 14.3% 13.8%
31-Dec-11 30-Sep-12 31-Dec-12

20
* Note: For details please refer: http://www.hcltech.com/Q2_13_Details_Cash-Borrowings
Amount in US $ million
Cash and Cash Equivalents* 188.4
Fixed Deposits with Banks 279.5
Deposits with HDFC Ltd. 18.2
Investment Securities, held to maturity 17.2
Investment Securities, available for sale (Debt Mutual Funds) 116.8
Grand Total 620.1
31-Dec-12
31-Dec-12
Borrowings 290.2
As on 31st Dec 2012 Completed Work in Progress Land Available for expansion -
in acresBuilt Up area (Sq. ft.) No. of seats
Built Up area (Sq. ft.) No. of seatsDelivery Locations
National Capital Region 2,799,923 29,430 697,890 5,016 12
Chennai 3,787,641 33,679 1,350,000 12,000 -
Bangalore 1,464,724 13,658 819,001 5,736 -
Mumbai 12,785 153 - - -
Kolkatta 95,467 1,039 - - -
Hyderabad 333,963 2,769 - - -
Pune 70,576 878 - - -
Global (Outside India) 576,107 6,102 48,448 354 -
Total 9,141,186 87,708 2,915,339 23,106 12

21
The financials in INR are based on a convenience translation using the average rate for the quarter: US$1 = 54.35 for the quarter ended on 31 Dec 2012; US $1 = ̀ 54.69 for the quarter ended on 30 Sep 2012; US$ 1 = ̀ 51.33 for the quarter ended 31 Dec 2011.
Financial results for the Quarter ended 31st Dec 2012 drawn under US GAAP
`
*After adjusting for non cash employee stock options charge
Note: - The above result does not take into account the non cash employee stock options charge computed under FAS 123R, as per details given here:-
Income Statement Quarter ended Growth
31-Dec-11 30-Sep-12 31-Dec-12 YoY QoQ
Revenues 5,245.2 6,091.0 6,273.8 19.6% 3.0%
Direct Costs 3,514.1 3,945.7 4,026.2
Gross Profits 1,731.1 2,145.3 2,247.6 29.8% 4.8%
SG & A 760.9 794.3 831.0
EBITDA 970.2 1,351.1 1,416.6 46.0% 4.9%
Depreciation 127.8 157.4 160.1
Amortisation 11.7 11.8 12.1
EBIT 830.7 1,181.9 1,244.4 49.8% 5.3%
Foreign Exchange Gains/(loss) (75.8) (60.9) (12.5)
Other Income, net 8.8 35.6 27.9
Provision for Tax 191.1 271.8 295.1
Share of income /
(loss) of minority shareholders 0.0 0.0 0.1
Net Income 572.7 884.8 964.7 68.5% 9.0%
Gross Margin 33.0% 35.2% 35.8%
EBITDA Margin 18.5% 22.2% 22.6%
EBIT Margin 15.8% 19.4% 19.8%
Net Income Margin 10.9% 14.5% 15.4%
Earnings Per Share (EPS)
Annualized in US $
Basic 33.2 51.0 55.6 67.5%
Diluted 32.8 50.3 54.7 67.0%
*Earnings Per Share (EPS) - GAAP Annualized in US $
Basic 32.0 49.8 54.4 69.9%
31.6 49.1 53.6 69.4% Diluted
“Weighted average Number of Shares used in computing EPS”
Basic 690,319,989 693,570,313 694,273,119
Diluted 699,197,467 703,782,987 705,335,855
Quarter Ended
Options Charge 21.5 22.2 22.1
Tax benefit 1.5 1.7 1.8
Option Charge (net-of tax benefit) 19.9 20.6 20.2
Particulars (in Crores)` 31-Dec-11 30-Sep-12 31-Dec-12

22
Outstanding Options
Options at market price 7,568,404 5,187,252 4,765,480
Options at less than market price 14,704,176 13,889,504 13,543,824
(in equivalent no of shares) 31-Dec-11 30-Sep-12 31-Dec-12
The options will vest in tranches till 2016
Note: Change in Current Assets and Other Assets includes (1) Increase commensurate with size of business; (2) Reclassification of leasehold land from capital lease to operating lease and reclassification of advance paid for leasehold land, and accordingly change in Head from “Fixed Assets” to “Current Assets and Other Assets”, as per details provided in Q3 results; (3) Increase in deferred tax asset mainly due to timing differences
Change in Current Liabilities and Other Liabilities includes (1) Increase commensurate with size of business; (2) Unrealized loss on foreign exchange hedges; (3) Increase in Taxes payable
Particulars As on
Assets
574.0 1,036.0
3,866.4 3,840.3
1,583.1 1,563.0
1,453.5 1,537.0
100.0 100.0
534.3 642.3
1,667.5 1,761.1
Total current assets 9,778.8 10,479.7
2,544.4 2,564.3
4,780.3 4,927.7
94.6 94.5
40.9 44.7
Other Assets 1,689.6 1,866.8
Total assets 18,928.6 19,977.8
Liabilities & Stockholders' Equity
4,389.5 4,735.6
Borrowings 1,642.0 1,595.7
Other Liabilities 1,172.6 1,296.4
Total Liabilities 7,204.1 7,627.7
Total Stockholders Equity 11,724.5 12,350.1
Total Liabilities and StockholdersEquity 18,928.6 19,977.8
Sep-12 Dec-12
Cash and Cash Equivalents
Accounts Receivables, net
Unbilled Receivables
Fixed Deposits with Banks
Deposits with HDFC Ltd.
Investment Securities, available for sale
Other Current Assets
Property and Equipments, net
Intangible Assets, net
Investment Securities, held to maturity
Investments in Equity Investee
Current Liabilities
The financials in INR are based on a convenience translation using the closing rate for the quarter: US$1 = 54.99 for the quarter ended on 31 Dec 2012; US $1 = ̀ 52.87 for the quarter ended on 30 Sep 2012.
Financial results for the Quarter ended 31st Dec 2012 drawn under US GAAP
`

23
Income Statement Quarter ended Growth
31-Dec-11 30-Sep-12 31-Dec-12 YoY QoQ
Revenues 5,006.9 5,817.1 5,996.9 19.8% 3.1%
Direct Costs 3,326.3 3,753.4 3,838.9
Gross Profits 1,680.6 2,063.7 2,158.0 28.4% 4.6%
SG & A 705.3 738.0 773.3
EBITDA 975.3 1,325.7 1,384.7 42.0% 4.5%
Depreciation 114.7 138.2 144.6
Amortisation 11.7 11.5 11.6
EBIT 848.9 1,176.0 1,228.5 44.7% 4.5%
Gross Margin 33.6% 35.5% 36.0%
EBITDA Margin 19.5% 22.8% 23.1%
EBIT Margin 17.0% 20.2% 20.5%
Income Statement Quarter ended Growth
31-Dec-11 30-Sep-12 31-Dec-12 YoY QoQ
Revenues 238.3 274.0 276.9 16.2% 1.1%
Direct Costs 187.8 192.4 187.3
Gross Profits 50.6 81.6 89.6 77.3% 9.9%
SG & A 55.6 56.3 57.8
EBITDA (5.1) 25.3 31.9
Depreciation 13.1 19.1 15.5
Amortisation - 0.4 0.5
EBIT (18.2) 5.9 15.9
Gross Margin 21.2% 29.8% 32.4%
EBITDA Margin -2.1% 9.2% 11.5%
EBIT Margin -7.6% 2.1% 5.7%
Income Statement Quarter ended Growth
31-Dec-11 30-Sep-12 31-Dec-12 YoY QoQ
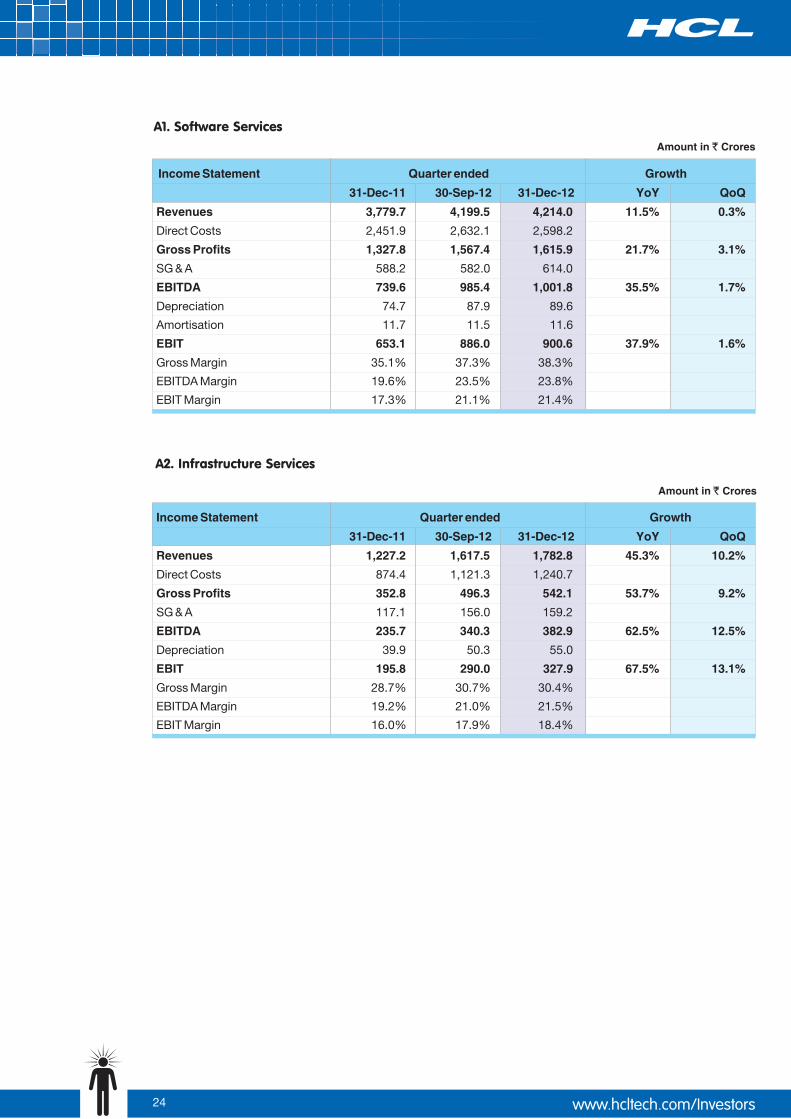
Revenues 3,779.7 4,199.5 4,214.0 11.5% 0.3%
Direct Costs 2,451.9 2,632.1 2,598.2
Gross Profits 1,327.8 1,567.4 1,615.9 21.7% 3.1%
SG & A 588.2 582.0 614.0
EBITDA 739.6 985.4 1,001.8 35.5% 1.7%
Depreciation 74.7 87.9 89.6
Amortisation 11.7 11.5 11.6
EBIT 653.1 886.0 900.6 37.9% 1.6%
Gross Margin 35.1% 37.3% 38.3%
EBITDA Margin 19.6% 23.5% 23.8%
EBIT Margin 17.3% 21.1% 21.4%
Income Statement Quarter ended Growth
31-Dec-11 30-Sep-12 31-Dec-12 YoY QoQ
Revenues 1,227.2 1,617.5 1,782.8 45.3% 10.2%
Direct Costs 874.4 1,121.3 1,240.7
Gross Profits 352.8 496.3 542.1 53.7% 9.2%
SG & A 117.1 156.0 159.2
EBITDA 235.7 340.3 382.9 62.5% 12.5%
Depreciation 39.9 50.3 55.0
EBIT 195.8 290.0 327.9 67.5% 13.1%
Gross Margin 28.7% 30.7% 30.4%
EBITDA Margin 19.2% 21.0% 21.5%
EBIT Margin 16.0% 17.9% 18.4%
24

25
Certain statements in this release are forward-looking statements, which involve a number of risks, uncertainties, assumptions and other factors that could cause actual results to differ materially from those in such forward-looking statements. All statements, other than statements of historical fact are statements that could be deemed forward looking statements, including but not limited to the statements containing the words 'planned', 'expects', 'believes', 'strategy', 'opportunity', 'anticipates', 'hopes' or other similar words. The risks and uncertainties relating to these statements include, but are not limited to, risks and uncertainties regarding impact of pending regulatory proceedings, fluctuations in earnings, our ability to manage growth, intense competition in IT services, Business Process Outsourcing and consulting services including those factors which may affect our cost advantage, wage increases in India, customer acceptances of our services, products and fee structures, our ability to attract and retain highly skilled professionals, our ability to integrate acquired assets in a cost effective and timely manner, time and cost overruns on fixed-price, fixed-time frame contracts, client concentration, restrictions on immigration, our ability to manage our international operations, reduced demand for technology in our key focus areas, disruptions in telecommunication networks, our ability to successfully complete and integrate potential acquisitions, the success of our brand development efforts, liability for damages on our service contracts, the success of the companies / entities in which we have made strategic investments, withdrawal of governmental fiscal incentives, political instability, legal restrictions on raising capital or acquiring companies outside India, and unauthorized use of our intellectual property, other risks, uncertainties and general economic conditions affecting our industry. There can be no assurance that the forward looking statements made herein will prove to be accurate, and issuance of such forward looking statements should not be regarded as a representation by the Company, or any other person, that the objective and plans of the Company will be achieved. All forward looking statements made herein are based on information presently available to the management of the Company and the Company does not undertake to update any forward-looking statement that may be made from time to time by or on behalf of the Company.
HCL Technologies is a leading global IT services company, working with clients in the areas that impact and redefine the core of their businesses. Since its inception into the global landscape after its IPO in 1999, HCL focuses on ‘transformational outsourcing’, underlined by innovation and value creation, and offers integrated portfolio of services including software-led IT solutions, remote infrastructure management, engineering and R&D services and BPO. HCL leverages its extensive global offshore infrastructure and network of offices in 31 countries to provide holistic, multi-service delivery in key industry verticals including Financial Services, Manufacturing, Consumer Services, Public Services and Healthcare. HCL takes pride in its philosophy of ‘Employees First, Customers Second’ which empowers our transformers to create a real value for the customers. HCL Technologies, along with its subsidiaries, had consolidated revenues of US$ 4.4 billion (` 23,499 crores), as on (on LTM basis). For more information, please visit www.hcltech.com
85,194st31 Dec 2012
HCL is a $6.2 billion leading global technology and IT enterprise comprising two companies listed in India - HCL Technologies and HCL Infosystems. Founded in 1976, HCL is one of India's original IT garage start-ups. A pioneer of modern computing, HCL is a global transformational enterprise today. Its range of offerings includes product engineering, custom & package applications, BPO, IT infrastructure services, IT hardware, systems integration, and distribution of information and communications technology (ICT) products across a wide range of focused industry verticals. The HCL team consists of over 90,000 professionals of diverse nationalities, who operate from 31 countries including over 500 points of presence in India. For more information, please visit www.hcl.com

INVESTOR RELATIONS
Sanjay Mendiratta
+91- 9312065108
Aniruddh Gaur
+91- 9560158666
MEDIA RELATIONS
Ajay Davessar
+91 - 9650122336
Deepika Bansal
+91-9811292247
HCL Technologies Ltd.,A 10-11, Sector-III, Noida - 201301
www.hcltech.com


![요약재무제표휴온스] IR BOOK_2020 2Q... · 2020. 9. 25. · 20년2분기연결기준매출1,036억원(YoY 17.6%), 영업이익132억원(YoY 57.3%), 순이익106억원(YoY](https://img.pdfslide.net/doc/110x75/60bfc29efa74e272a77e4410/eoeoe-oe-ir-book2020-2q-2020-9-25-20e2eeeeeoe1036yoy.jpg)