Embed Size (px)
Citation preview
10/17/2017
1
Text Technologies for Data Science
INFR11145
17-Oct-2017
IR Evaluation (2)
Instructor:
Walid Magdy
2
Walid Magdy, TTDS 2017/2018
Lecture Objectives
• Learn about how to evaluate IR
• How to create a test collection?
• Topic vs. query
• Relevance judgements
• Pooling
• Implement:
• Pooling (class-collective-work)
10/17/2017
2
3
Walid Magdy, TTDS 2017/2018
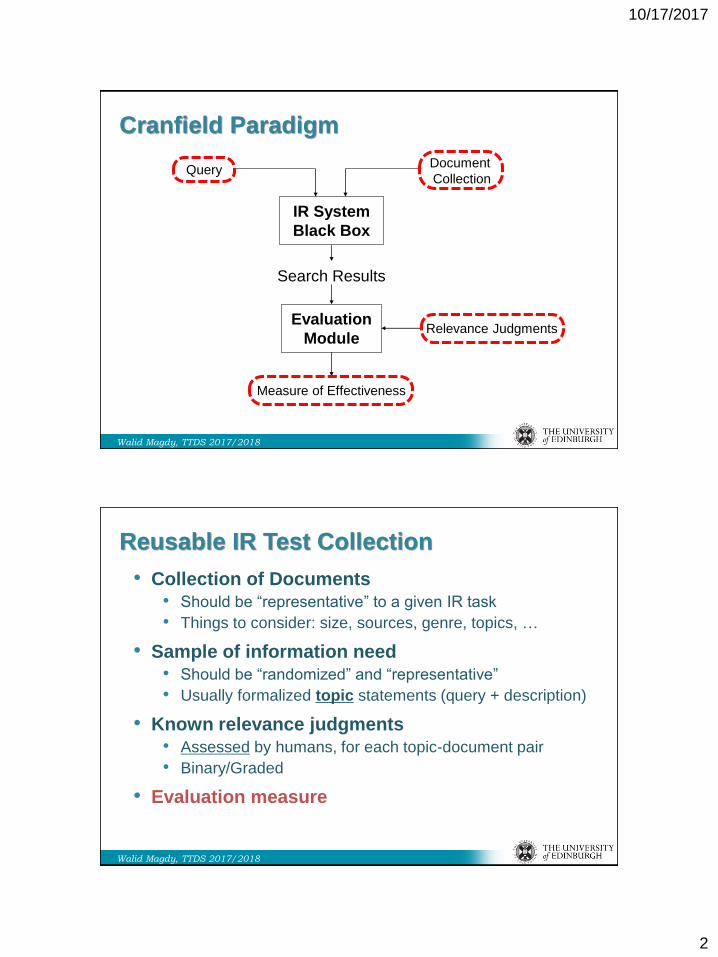
Cranfield Paradigm
Document
Collection
IR System
Black Box
Query
Search Results
Evaluation
Module
Measure of Effectiveness
Relevance Judgments
4
Walid Magdy, TTDS 2017/2018
Reusable IR Test Collection
• Collection of Documents• Should be “representative” to a given IR task
• Things to consider: size, sources, genre, topics, …
• Sample of information need• Should be “randomized” and “representative”
• Usually formalized topic statements (query + description)
• Known relevance judgments• Assessed by humans, for each topic-document pair
• Binary/Graded
• Evaluation measure
10/17/2017
3
5
Walid Magdy, TTDS 2017/2018
Where Do Test Collections Come From?
• For web search, companies apply their own studies
to assess the performance of their search engine.
• Web-search performance is monitored by:• Traffic
• User clicks and session logs
• Labelling results for selected users’ queries
• For other search tasks:• Someone goes out and builds them (expensive)
• As the byproduct of large scale evaluations
• IR Evaluation Campaigns are created for this reason
6
Walid Magdy, TTDS 2017/2018
IR Evaluation Campaigns
• IR test collections are provided for scientific
communities to develop best IR methods
• Collections and queries are provided, relevance
judgements are built during the campaign
• TREC = Text REtrieval Conferences• Main IR eval campaign. Sponsored by NIST (US gov)
• Series of annual evaluations, started in 1992
• Organized into “tracks”
• Other evaluation campaigns• CLEF: European version (since 2000)
• NTCIR: Asian version (since 1999)
• FIRE: Indian version (since 2008)
10/17/2017
4
7
Walid Magdy, TTDS 2017/2018
TREC Task
• It is a task for search a set of documents of given
genre and domain.
• TREC (or other IR eval campaigns) are formed of a
set of tracks, each track has a set of search tasks.
• Example
• TREC Medical track
• TREC Legal track CLEF-IP track NTCIR patent
mining track
• TREC Microblog track
• Different CLIR tracks in all campaigns
8
Walid Magdy, TTDS 2017/2018
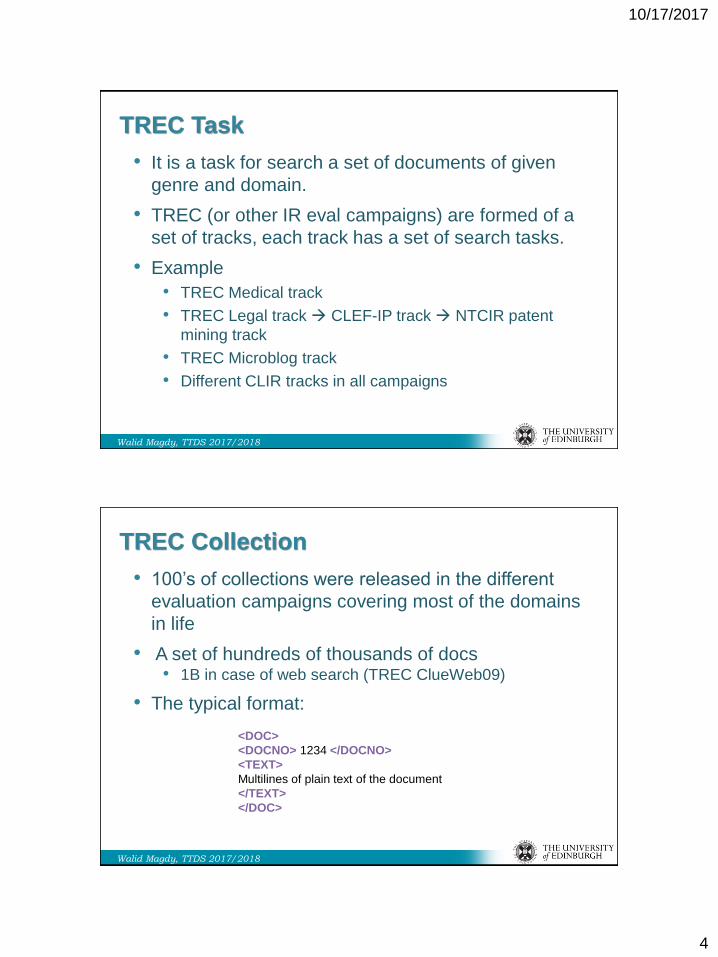
TREC Collection
• 100’s of collections were released in the different
evaluation campaigns covering most of the domains
in life
• A set of hundreds of thousands of docs• 1B in case of web search (TREC ClueWeb09)
• The typical format:
<DOC>
<DOCNO> 1234 </DOCNO>
<TEXT>
Multilines of plain text of the document
</TEXT>
</DOC>
10/17/2017
5
9
Walid Magdy, TTDS 2017/2018
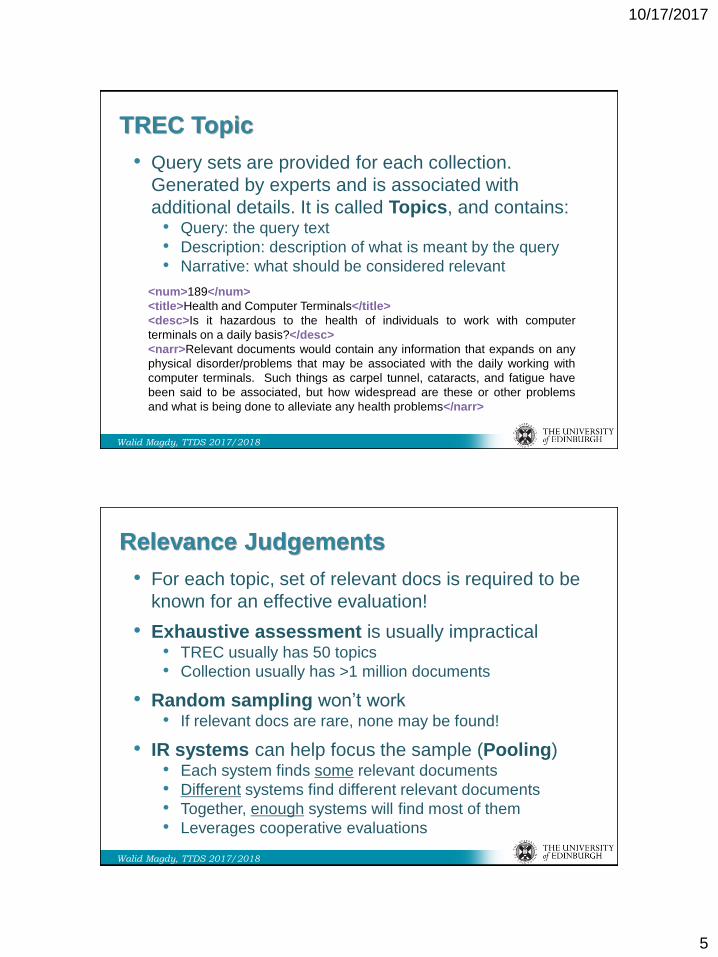
TREC Topic
• Query sets are provided for each collection.
Generated by experts and is associated with
additional details. It is called Topics, and contains:• Query: the query text
• Description: description of what is meant by the query
• Narrative: what should be considered relevant
<num>189</num>
<title>Health and Computer Terminals</title>
<desc>Is it hazardous to the health of individuals to work with computer
terminals on a daily basis?</desc>
<narr>Relevant documents would contain any information that expands on any
physical disorder/problems that may be associated with the daily working with
computer terminals. Such things as carpel tunnel, cataracts, and fatigue have
been said to be associated, but how widespread are these or other problems
and what is being done to alleviate any health problems</narr>
10
Walid Magdy, TTDS 2017/2018
Relevance Judgements
• For each topic, set of relevant docs is required to be
known for an effective evaluation!
• Exhaustive assessment is usually impractical• TREC usually has 50 topics
• Collection usually has >1 million documents
• Random sampling won’t work• If relevant docs are rare, none may be found!
• IR systems can help focus the sample (Pooling)• Each system finds some relevant documents
• Different systems find different relevant documents
• Together, enough systems will find most of them
• Leverages cooperative evaluations
10/17/2017
6
11
Walid Magdy, TTDS 2017/2018
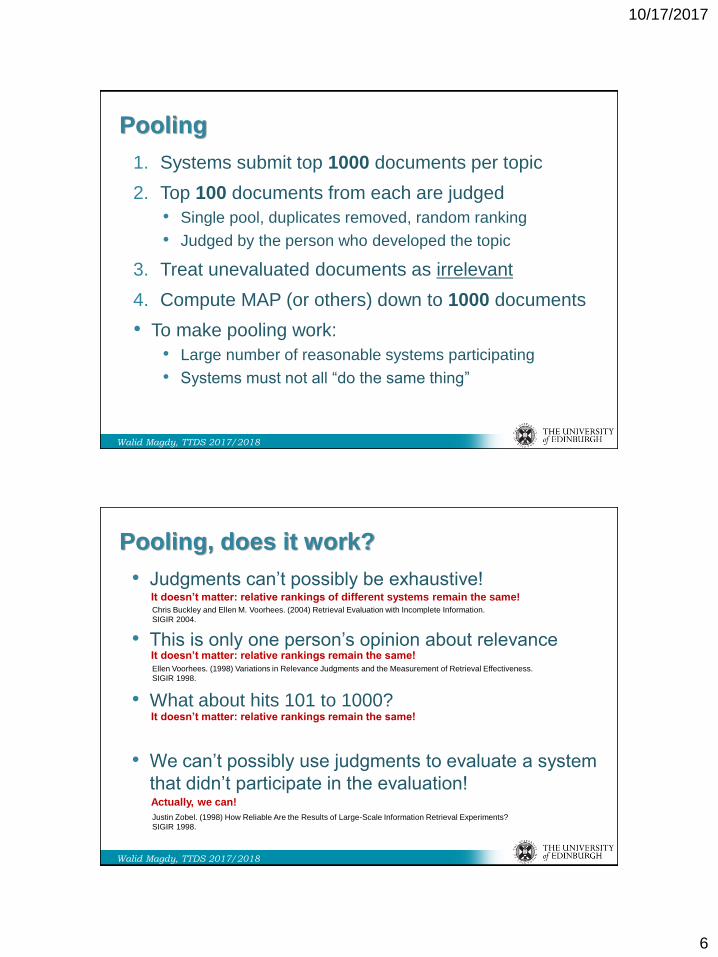
Pooling
1. Systems submit top 1000 documents per topic
2. Top 100 documents from each are judged
• Single pool, duplicates removed, random ranking
• Judged by the person who developed the topic
3. Treat unevaluated documents as irrelevant
4. Compute MAP (or others) down to 1000 documents
• To make pooling work:
• Large number of reasonable systems participating
• Systems must not all “do the same thing”
12
Walid Magdy, TTDS 2017/2018
Pooling, does it work?
• Judgments can’t possibly be exhaustive!
• This is only one person’s opinion about relevance
• What about hits 101 to 1000?
• We can’t possibly use judgments to evaluate a system
that didn’t participate in the evaluation!
It doesn’t matter: relative rankings of different systems remain the same!
It doesn’t matter: relative rankings remain the same!
It doesn’t matter: relative rankings remain the same!
Actually, we can!
Chris Buckley and Ellen M. Voorhees. (2004) Retrieval Evaluation with Incomplete Information.
SIGIR 2004.
Ellen Voorhees. (1998) Variations in Relevance Judgments and the Measurement of Retrieval Effectiveness.
SIGIR 1998.
Justin Zobel. (1998) How Reliable Are the Results of Large-Scale Information Retrieval Experiments?
SIGIR 1998.
10/17/2017
7
13
Walid Magdy, TTDS 2017/2018
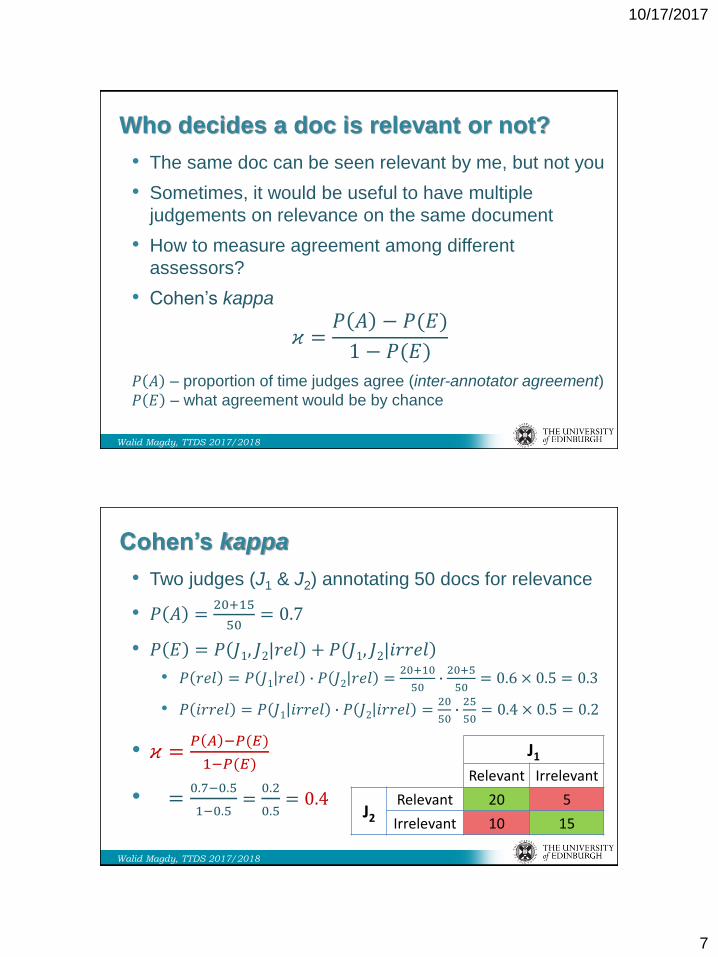
Who decides a doc is relevant or not?
• The same doc can be seen relevant by me, but not you
• Sometimes, it would be useful to have multiple
judgements on relevance on the same document
• How to measure agreement among different
assessors?
• Cohen’s kappa
𝜘 =𝑃 𝐴 − 𝑃(𝐸)
1 − 𝑃(𝐸)
𝑃 𝐴 – proportion of time judges agree (inter-annotator agreement)
𝑃 𝐸 – what agreement would be by chance
14
Walid Magdy, TTDS 2017/2018
• Two judges (J1 & J2) annotating 50 docs for relevance
• 𝑃 𝐴 =20+15
50= 0.7
• 𝑃 𝐸 = 𝑃 𝐽1, 𝐽2|𝑟𝑒𝑙 + 𝑃 𝐽1, 𝐽2|𝑖𝑟𝑟𝑒𝑙 = 0.3 + 0.2 = 0.5
• 𝑃 𝑟𝑒𝑙 = 𝑃 𝐽1 𝑟𝑒𝑙 ∙ 𝑃 𝐽2 𝑟𝑒𝑙 =20+10
50∙20+5
50= 0.6 × 0.5 = 0.3
• 𝑃 𝑖𝑟𝑟𝑒𝑙 = 𝑃 𝐽1 𝑖𝑟𝑟𝑒𝑙 ∙ 𝑃 𝐽2 𝑖𝑟𝑟𝑒𝑙 =20
50∙25
50= 0.4 × 0.5 = 0.2
• 𝜘 =𝑃 𝐴 −𝑃(𝐸)
1−𝑃(𝐸)
• =0.7−0.5
1−0.5=
0.2
0.5= 0.4
J1Relevant Irrelevant
J2Relevant 20 5
Irrelevant 10 15
Cohen’s kappa
10/17/2017
8
15
Walid Magdy, TTDS 2017/2018
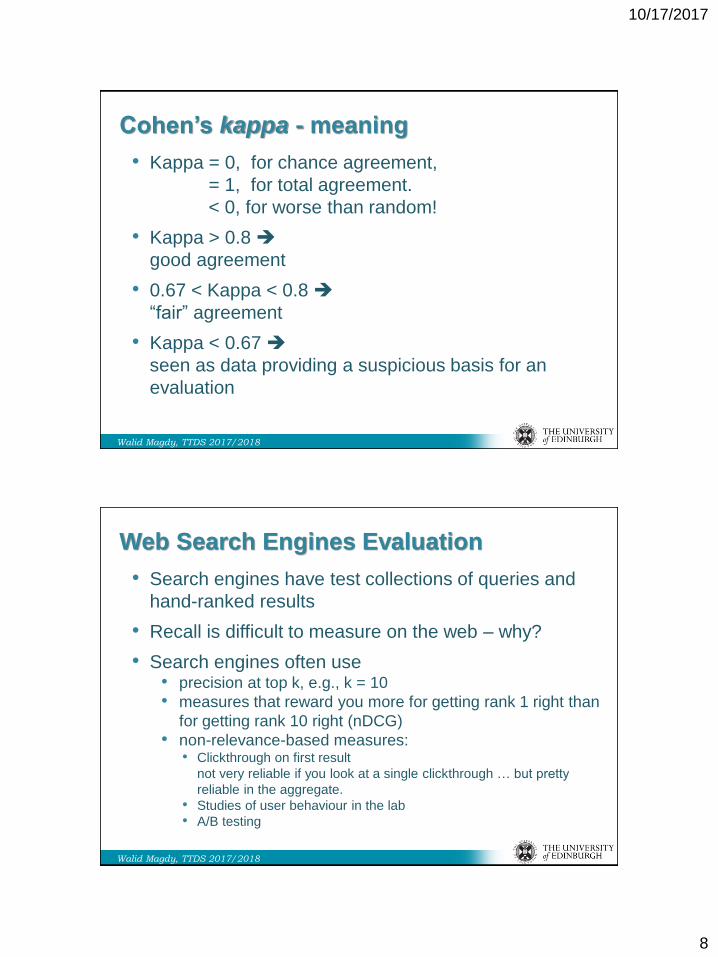
Cohen’s kappa - meaning
• Kappa = 0, for chance agreement,
= 1, for total agreement.
< 0, for worse than random!
• Kappa > 0.8
good agreement
• 0.67 < Kappa < 0.8
“fair” agreement
• Kappa < 0.67
seen as data providing a suspicious basis for an
evaluation
16
Walid Magdy, TTDS 2017/2018
Web Search Engines Evaluation
• Search engines have test collections of queries and
hand-ranked results
• Recall is difficult to measure on the web – why?
• Search engines often use• precision at top k, e.g., k = 10
• measures that reward you more for getting rank 1 right than
for getting rank 10 right (nDCG)
• non-relevance-based measures:• Clickthrough on first result
not very reliable if you look at a single clickthrough … but pretty
reliable in the aggregate.
• Studies of user behaviour in the lab
• A/B testing
10/17/2017
9
17
Walid Magdy, TTDS 2017/2018
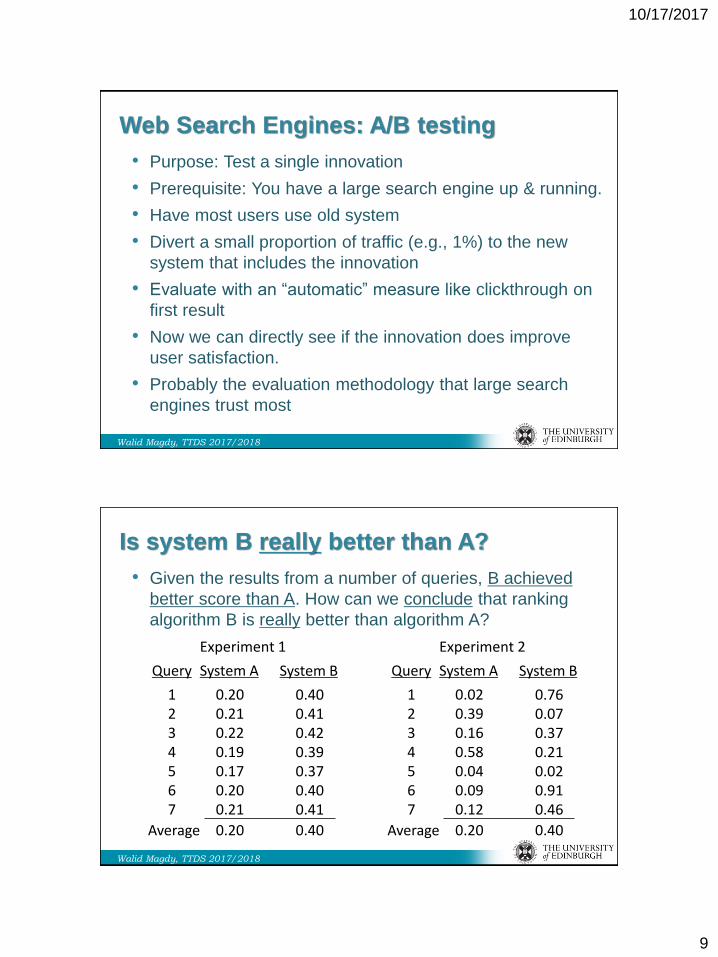
Web Search Engines: A/B testing
• Purpose: Test a single innovation
• Prerequisite: You have a large search engine up & running.
• Have most users use old system
• Divert a small proportion of traffic (e.g., 1%) to the new
system that includes the innovation
• Evaluate with an “automatic” measure like clickthrough on
first result
• Now we can directly see if the innovation does improve
user satisfaction.
• Probably the evaluation methodology that large search
engines trust most
18
Walid Magdy, TTDS 2017/2018
Is system B really better than A?
• Given the results from a number of queries, B achieved
better score than A. How can we conclude that ranking
algorithm B is really better than algorithm A?
System A
0.200.210.220.190.170.200.21
System B
0.400.410.420.390.370.400.41
Experiment 1
Query
1234567
Average 0.20 0.40
System A
0.020.390.160.580.040.090.12
System B
0.760.070.370.210.020.910.46
Experiment 2
Query
1234567
Average 0.20 0.40
10/17/2017
10
19
Walid Magdy, TTDS 2017/2018
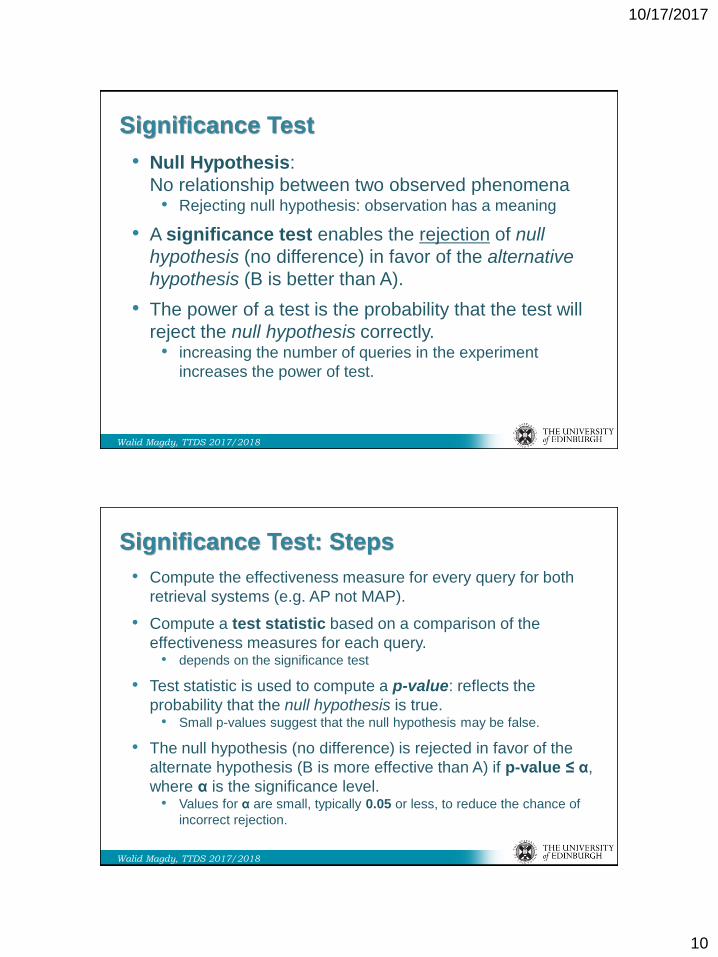
Significance Test
• Null Hypothesis:
No relationship between two observed phenomena• Rejecting null hypothesis: observation has a meaning
• A significance test enables the rejection of null
hypothesis (no difference) in favor of the alternative
hypothesis (B is better than A).
• The power of a test is the probability that the test will
reject the null hypothesis correctly.• increasing the number of queries in the experiment
increases the power of test.
20
Walid Magdy, TTDS 2017/2018
Significance Test: Steps
• Compute the effectiveness measure for every query for both
retrieval systems (e.g. AP not MAP).
• Compute a test statistic based on a comparison of the
effectiveness measures for each query. • depends on the significance test
• Test statistic is used to compute a p-value: reflects the
probability that the null hypothesis is true. • Small p-values suggest that the null hypothesis may be false.
• The null hypothesis (no difference) is rejected in favor of the
alternate hypothesis (B is more effective than A) if p-value ≤ α,
where α is the significance level. • Values for α are small, typically 0.05 or less, to reduce the chance of
incorrect rejection.
10/17/2017
11
21
Walid Magdy, TTDS 2017/2018
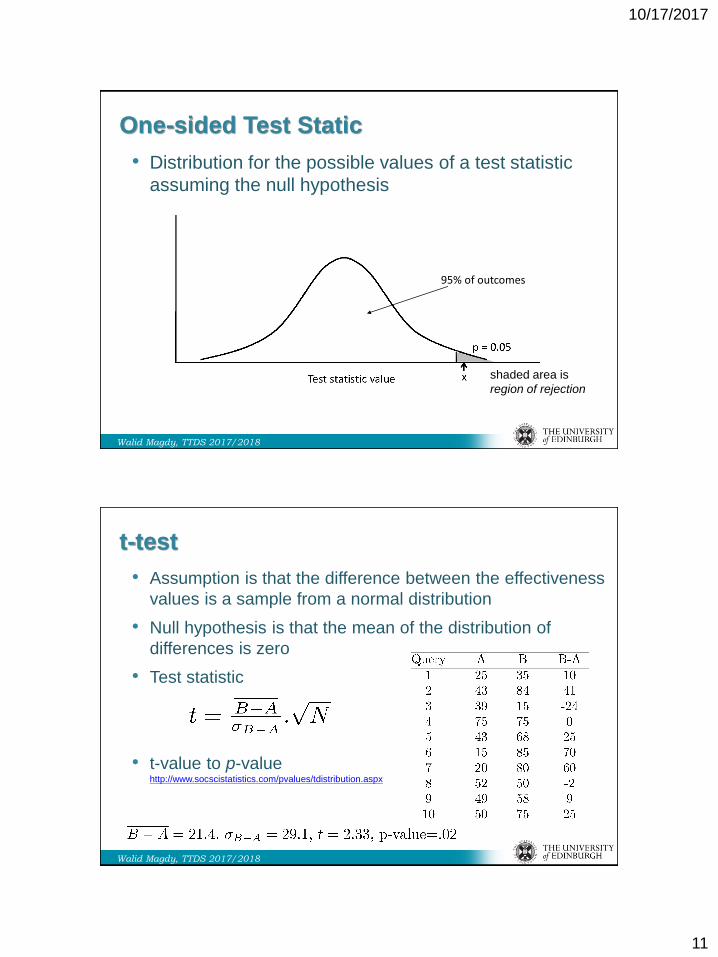
One-sided Test Static
• Distribution for the possible values of a test statistic
assuming the null hypothesis
95% of outcomes
shaded area is
region of rejection
22
Walid Magdy, TTDS 2017/2018
t-test
• Assumption is that the difference between the effectiveness
values is a sample from a normal distribution
• Null hypothesis is that the mean of the distribution of
differences is zero
• Test statistic
• t-value to p-valuehttp://www.socscistatistics.com/pvalues/tdistribution.aspx
10/17/2017
12
23
Walid Magdy, TTDS 2017/2018
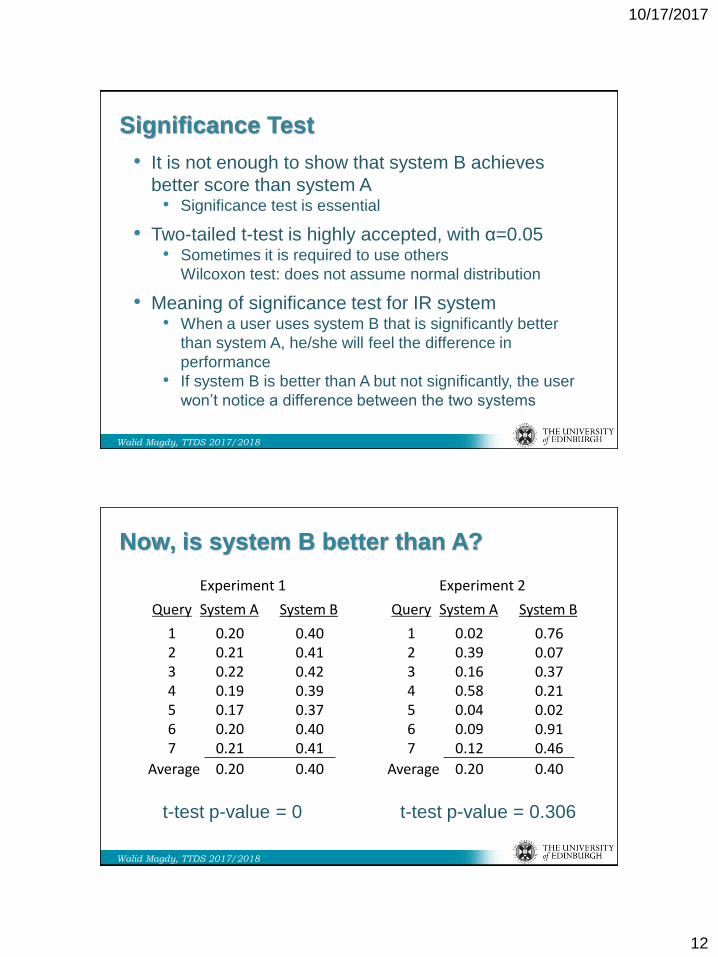
Significance Test
• It is not enough to show that system B achieves
better score than system A• Significance test is essential
• Two-tailed t-test is highly accepted, with α=0.05• Sometimes it is required to use others
Wilcoxon test: does not assume normal distribution
• Meaning of significance test for IR system• When a user uses system B that is significantly better
than system A, he/she will feel the difference in
performance
• If system B is better than A but not significantly, the user
won’t notice a difference between the two systems
24
Walid Magdy, TTDS 2017/2018
Now, is system B better than A?
t-test p-value = 0 t-test p-value = 0.306
System A
0.200.210.220.190.170.200.21
System B
0.400.410.420.390.370.400.41
Experiment 1
Query
1234567
Average 0.20 0.40
System A
0.020.390.160.580.040.090.12
System B
0.760.070.370.210.020.910.46
Experiment 2
Query
1234567
Average 0.20 0.40
10/17/2017
13
25
Walid Magdy, TTDS 2017/2018
Summary
• IR test-collection for automatic evaluation• Collection of documents
• Set of topics• Topic = query + details on what is meant and what is relevant
• Recommended minimum number of 25 topics
• Relevance judgements• Pooling is the most common approach for creating judgements
• Large number of diverse systems are required
• Evaluation measure• Select the proper measure according to the IR task
• Significance test is essential to confirm that improvement has real
meaning
• Web-search uses different evaluation methods that
relies on user experience and clickthrough data
26
Walid Magdy, TTDS 2017/2018
Resources
• Text book 1: Intro to IR, Chapter 8
• Text book 2: IR in Practice, Chapter 8
• Pooling:Chris Buckley and Ellen M. Voorhees. (2004) Retrieval Evaluation with
Incomplete Information. SIGIR 2004