Embed Size (px)
Citation preview
8/13/2019 IR Temperature
http://slidepdf.com/reader/full/ir-temperature 1/6
In a single second, Earth absorbs 1.22 × 10¹⁷ joules of en-ergy from the Sun. Distributed uniformly over the mass of the
planet, the absorbed energy would raise Earth’s temperatureto nearly 800 000 K after a billion years, if Earth had no way ofgetting rid of it. For a planet sitting in the near-vacuum of outerspace, the only way to lose energy at a significant rate isthrough emission of electromagnetic radiation, which occursprimarily in the subrange of the IR spectrum with wavelengthsof 5–50 µm for planets with temperatures between about 50 Kand 1000 K. For purposes of this article, that subrange is calledthe thermal IR. The key role of the energy balance betweenshort-wave solar absorption and long-wave IR emission wasfirst recognized in 1827 by Joseph Fourier,1,2 about a quartercentury after IR radiation was discovered by William Herschel.As Fourier also recognized, the rate at which electromagneticradiation escapes to space is strongly affected by the interven-
ing atmosphere. With those insights, Fourier set in motion aprogram in planetary climate that would take more than a cen-tury to bring to fruition.
Radiative transfer is the theory that enables the above to be made precise. It is a remarkably productive theory that builds on two centuries of work by many of the leading lights
of physics. Apart from its role in the energy balance of planetsand stars, it lies at the heart of all forms of remote sensingand astronomy used to observe planets, stars, and the uni-verse as a whole. It is woven through a vast range of devicesthat are part of modern life, from microwave ovens to heat-seeking missiles. This article focuses on thermal IR radiativetransfer in planetary atmospheres and its consequences forplanetary temperature. Those aspects of the theory are of par-ticular current interest, because they are central to the calcu-lations predicting that global climate disruption arises fromanthropogenic emission of carbon dioxide and other radia-tively active gases.
An atmosphere is a mixed gas of matter and photons.Radiative transfer deals with the nonequilibrium thermo-dynamics of a radiation field interacting with matter and thetransport of energy by the photon component of the atmos-phere. Except in the tenuous outer reaches of atmospheres,the matter can generally be divided into parcels containingenough molecules for thermodynamics to apply but smallenough to be regarded as isothermal and hence in localthermodynamic equilibrium (LTE).
The local radiation field need not be in thermodynamicequilibrium with matter at the local temperature. Nonethe-
less, the equations predict that the radiation field comes intothermodynamic equilibrium in the limiting case in which it
interacts very strongly with the matter. For such blackbodyradiation, the distribution of energy flux over frequency isgiven by a universal expression known as the Planck functionB( ν ,T ), where ν is the frequency and T is the temperature.
Integrating the Planck function over all directions andfrequencies yields the Stefan–Boltzmann law for the flux Fexiting from the surface of a blackbody, F = σT 4 , whereσ = 2π5kB
4/(15c2h3) ≈ 5.67 × 10⁻⁸ W m−2 K−4. Here, kB is the Boltz-mann thermodynamic constant, c is the speed of light, and his Planck’s constant. The fourth-power increase of flux withtemperature is the main feedback allowing planets or stars tocome into equilibrium with their energy source. Since such
bodies are not actually isothermal, there is a question as towhich T to use in computing the flux escaping to space. Radiative transfer is the tool that provides the answer.
The appearance of h and c in the Stefan–Boltzmann con-stant means that relativity and quantization—the two non-classical aspects of the universe—are manifest macroscopi-cally in things as basic as the temperatures of planets andstars. It is intriguing to note that one can construct a universethat is classical with regard to quantization but nonethelessis well behaved with regard to the thermodynamics of radi-ation only if one also makes the universe classical with regardto relativity. That is, σ remains fixed if we let h → 0 but alsolet c tend to infinity as h−3/2.
A few fundamentalsAt planetary energy densities, photons do not significantlyinteract with each other; their distribution evolves onlythrough interaction with matter. The momentum of atmos-pheric photons is too small to allow any significant portionof their energy to go directly into translational kinetic energyof the molecules that absorb them. Instead, it goes into chang-ing the internal quantum states of the molecules. A photonwith frequency ν has energy hν , so for a photon to be ab-sorbed or emitted, the molecule involved must have a tran-sition between energy levels differing by that amount.
Coupled vibrational and rotational states are the keyplayers in IR absorption. An IR photon absorbed by a mole-cule knocks the molecule into a higher-energy quantum state.Those states have very long lifetimes, characterized by thespectroscopically measurable Einstein A coefficient. For ex-ample, for the CO
2
transitions that are most significant in the
© 2011 American Institute of Physics, S-0031-9228-1101-010-6 January 2011 Physics Today 33
Infrared radiationand planetary
temperatureRaymond T. Pierrehumbert
Infrared radiative transfer theory, one of the most productive physical theories of the past century,has unlocked myriad secrets of the universe including that of planetary temperature and theconnection between global warming and greenhouse gases.
Raymond T. Pierrehumbert is the Louis Block Professor in Geophysical Sciences at the University of Chicago.
feature
8/13/2019 IR Temperature
http://slidepdf.com/reader/full/ir-temperature 2/6
thermal IR, the lifetimes tend to range from a few milli-seconds to a few tenths of a second. In contrast, the typicaltime between collisions for, say, a nitrogen-dominated atmos-phere at a pressure of 104 Pa and temperature of 250 K is wellunder 10−7 s. Therefore, the energy of the photon will almostalways be assimilated by collisions into the general energypool of the matter and establish a new Maxwell–Boltzmanndistribution at a slightly higher temperature. That is how radiation heats matter in the LTE limit.
According to the equipartition principle, molecular col-lisions maintain an equilibrium distribution of molecules inhigher vibrational and rotational states. Many molecules oc-cupy those higher-energy states, so even though the lifetimeof the excited states is long, over a moderately small stretchof time a large number of molecules will decay by emittingphotons. If that radiation escapes without being reabsorbed,the higher-energy states are depopulated and the system isthrown out of thermodynamic equilibrium. Molecular colli-sions repopulate the states and establish a new thermo-dynamic equilibrium at a slightly cooler temperature. Thatis how thermal emission of radiation cools matter in theLTE limit.
Now consider a column of atmosphere sliced into thinhorizontal slabs, each of which has matter in LTE. Thermal
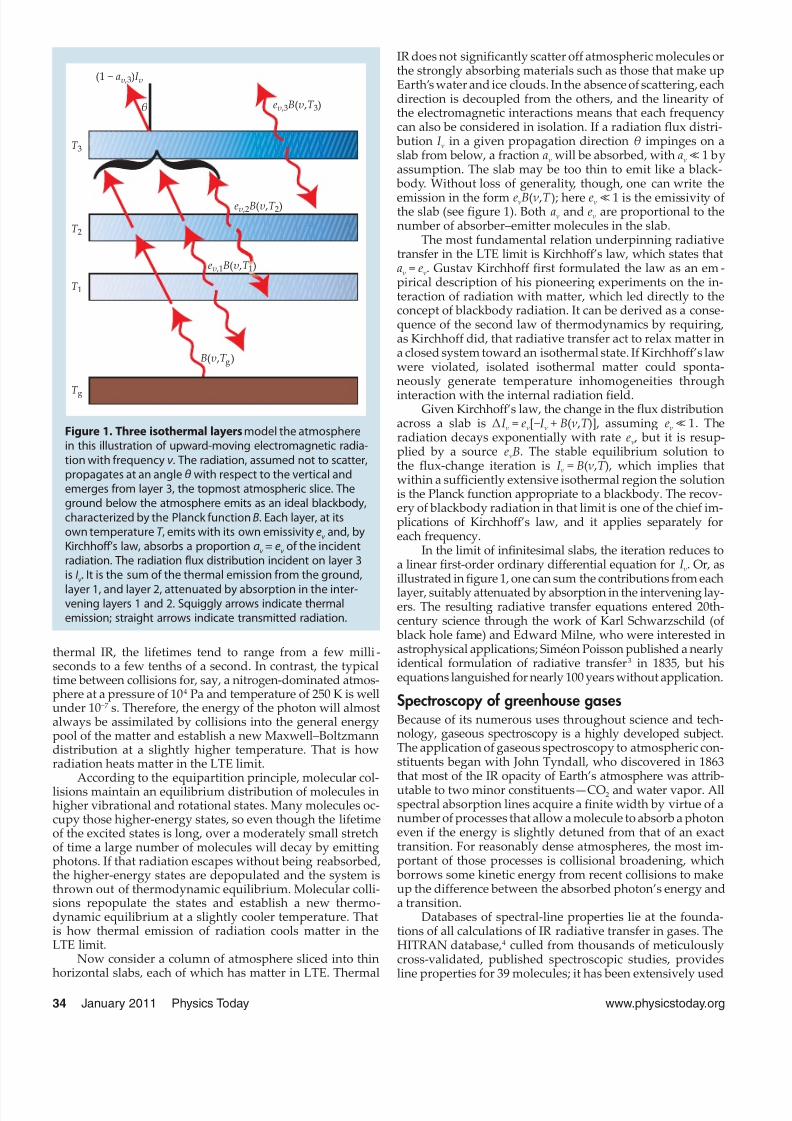
IR does not significantly scatter off atmospheric molecules orthe strongly absorbing materials such as those that make upEarth’s water and ice clouds. In the absence of scattering, eachdirection is decoupled from the others, and the linearity ofthe electromagnetic interactions means that each frequencycan also be considered in isolation. If a radiation flux distri-
bution I ν in a given propagation direction θ impinges on aslab from below, a fraction a ν will be absorbed, with a ν ≪ 1 byassumption. The slab may be too thin to emit like a black-
body. Without loss of generality, though, one can write the
emission in the form e νB( ν ,T ); here e ν ≪ 1 is the emissivity ofthe slab (see figure 1). Both a ν and e ν are proportional to thenumber of absorber–emitter molecules in the slab.
The most fundamental relation underpinning radiativetransfer in the LTE limit is Kirchhoff’s law, which states thata ν = e ν. Gustav Kirchhoff first formulated the law as an em-pirical description of his pioneering experiments on the in-teraction of radiation with matter, which led directly to theconcept of blackbody radiation. It can be derived as a conse-quence of the second law of thermodynamics by requiring,as Kirchhoff did, that radiative transfer act to relax matter ina closed system toward an isothermal state. If Kirchhoff’s lawwere violated, isolated isothermal matter could sponta-neously generate temperature inhomogeneities through
interaction with the internal radiation field.Given Kirchhoff’s law, the change in the flux distribution
across a slab is ∆I ν = e ν[−I ν + B( ν ,T )], assuming e ν ≪ 1. The radiation decays exponentially with rate e ν , but it is resup-plied by a source e νB. The stable equilibrium solution tothe flux-change iteration is I ν = B( ν ,T ), which implies thatwithin a sufficiently extensive isothermal region the solutionis the Planck function appropriate to a blackbody. The recov-ery of blackbody radiation in that limit is one of the chief im-plications of Kirchhoff’s law, and it applies separately foreach frequency.
In the limit of infinitesimal slabs, the iteration reduces toa linear first-order ordinary differential equation for I ν. Or, asillustrated in figure 1, one can sum the contributions from each
layer, suitably attenuated by absorption in the intervening lay-ers. The resulting radiative transfer equations entered 20th-century science through the work of Karl Schwarzschild (of
black hole fame) and Edward Milne, who were interested inastrophysical applications; Siméon Poisson published a nearlyidentical formulation of radiative transfer3 in 1835, but hisequations languished for nearly 100 years without application.
Spectroscopy of greenhouse gasesBecause of its numerous uses throughout science and tech-nology, gaseous spectroscopy is a highly developed subject.The application of gaseous spectroscopy to atmospheric con-stituents began with John Tyndall, who discovered in 1863that most of the IR opacity of Earth’s atmosphere was attrib-utable to two minor constituents—CO2 and water vapor. Allspectral absorption lines acquire a finite width by virtue of anumber of processes that allow a molecule to absorb a photoneven if the energy is slightly detuned from that of an exacttransition. For reasonably dense atmospheres, the most im-portant of those processes is collisional broadening, which
borrows some kinetic energy from recent collisions to makeup the difference between the absorbed photon’s energy anda transition.
Databases of spectral-line properties lie at the founda-tions of all calculations of IR radiative transfer in gases. TheHITRAN database,4 culled from thousands of meticulouslycross-validated, published spectroscopic studies, providesline properties for 39 molecules; it has been extensively used
T 3
T 2
T 1
T g
θ
(1 − )a I υ υ ,3
B T ( , )υ g
e B T ( , )υ 3υ ,3
e B T ( , )υ 2υ ,2
e B T ( , )υ 1υ ,1
Figure 1. Three isothermal layers model the atmospherein this illustration of upward-moving electromagnetic radia-tion with frequency ν . The radiation, assumed not to scatter,propagates at an angle θ with respect to the vertical andemerges from layer 3, the topmost atmospheric slice. Theground below the atmosphere emits as an ideal blackbody,characterized by the Planck function B. Each layer, at itsown temperature T , emits with its own emissivity eν and, byKirchhoff’s law, absorbs a proportion aν = eν of the incidentradiation. The radiation flux distribution incident on layer 3is I ν . It is the sum of the thermal emission from the ground,
layer 1, and layer 2, attenuated by absorption in the inter-vening layers 1 and 2. Squiggly arrows indicate thermalemission; straight arrows indicate transmitted radiation.
34 January 2011 Physics Today www.physicstoday.org
8/13/2019 IR Temperature
http://slidepdf.com/reader/full/ir-temperature 3/6
for applications across engineering and atmospheric sciences.The database is freely available at http://www.cfa.harvard.edu/hitran. A simple, flexible Python-language interface toHITRAN is included in the online software supplement toreference 5, available at http://geosci.uchicago.edu/~rtp1/PrinciplesPlanetaryClimate.
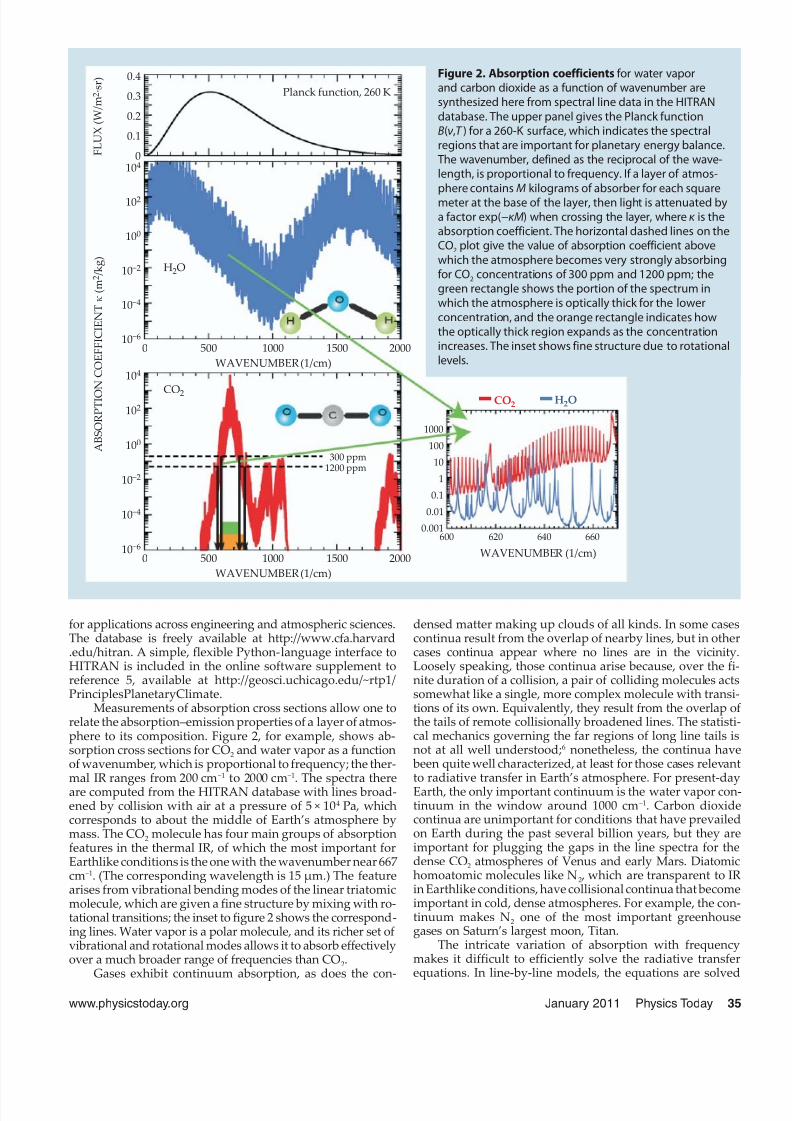
Measurements of absorption cross sections allow one torelate the absorption–emission properties of a layer of atmos-phere to its composition. Figure 2, for example, shows ab-sorption cross sections for CO2 and water vapor as a functionof wavenumber, which is proportional to frequency; the ther-mal IR ranges from 200 cm−1 to 2000 cm−1. The spectra thereare computed from the HITRAN database with lines broad-ened by collision with air at a pressure of 5 × 10⁴ Pa, whichcorresponds to about the middle of Earth’s atmosphere bymass. The CO2 molecule has four main groups of absorptionfeatures in the thermal IR, of which the most important forEarthlike conditions is the one with the wavenumber near 667cm−1. (The corresponding wavelength is 15 µm.) The featurearises from vibrational bending modes of the linear triatomicmolecule, which are given a fine structure by mixing with ro-tational transitions; the inset to figure 2 shows the correspond-ing lines. Water vapor is a polar molecule, and its richer set ofvibrational and rotational modes allows it to absorb effectivelyover a much broader range of frequencies than CO2.
Gases exhibit continuum absorption, as does the con-
densed matter making up clouds of all kinds. In some casescontinua result from the overlap of nearby lines, but in othercases continua appear where no lines are in the vicinity.Loosely speaking, those continua arise because, over the fi-nite duration of a collision, a pair of colliding molecules actssomewhat like a single, more complex molecule with transi-tions of its own. Equivalently, they result from the overlap ofthe tails of remote collisionally broadened lines. The statisti-cal mechanics governing the far regions of long line tails isnot at all well understood;6 nonetheless, the continua have
been quite well characterized, at least for those cases relevantto radiative transfer in Earth’s atmosphere. For present-dayEarth, the only important continuum is the water vapor con-tinuum in the window around 1000 cm−1. Carbon dioxidecontinua are unimportant for conditions that have prevailedon Earth during the past several billion years, but they areimportant for plugging the gaps in the line spectra for thedense CO2 atmospheres of Venus and early Mars. Diatomichomoatomic molecules like N2 , which are transparent to IRin Earthlike conditions, have collisional continua that becomeimportant in cold, dense atmospheres. For example, the con-tinuum makes N2 one of the most important greenhousegases on Saturn’s largest moon, Titan.
The intricate variation of absorption with frequencymakes it difficult to efficiently solve the radiative transferequations. In line-by-line models, the equations are solved
www.physicstoday.org January 2011 Physics Today 35
Planck function, 260 K
10
10
10
10
10
10
4
2
0
−2
−4
−6
10
10
10
10
10
10
4
2
0
−2
−4
−6
H O2
H O2CO2
CO2
0
0
500
500
1000
1000
1500
1500
2000
2000
WAVENUMBER (1/cm)
WAVENUMBER (1/cm)
WAVENUMBER (1/cm)
300 ppm1200 ppm
1000
100
10
1
0.1
0.01
0.001600 620 640 660
A B S O R P T I O
N C O E F F I C I E N T
( m
/ k g )
κ
2
0.4
0.3
0.2
0.1
0 F L U X
( W / m
r )
2 · s
Figure 2. Absorption coefficients for water vaporand carbon dioxide as a function of wavenumber are synthesized here from spectral line data in the HITRANdatabase. The upper panel gives the Planck functionB(ν ,T ) for a 260-K surface, which indicates the spectral regions that are important for planetary energy balance.The wavenumber, defined as the reciprocal of the wave-length, is proportional to frequency. If a layer of atmos-phere contains M kilograms of absorber for each squaremeter at the base of the layer, then light is attenuated bya factor exp(−κM) when crossing the layer, where κ is theabsorption coefficient. The horizontal dashed lines on theCO2 plot give the value of absorption coefficient abovewhich the atmosphere becomes very strongly absorbingfor CO2 concentrations of 300 ppm and 1200 ppm; thegreen rectangle shows the portion of the spectrum inwhich the atmosphere is optically thick for the lower concentration, and the orange rectangle indicates howthe optically thick region expands as the concentrationincreases. The inset shows fine structure due to rotationallevels.
8/13/2019 IR Temperature
http://slidepdf.com/reader/full/ir-temperature 4/6
separately on a grid of millions of frequencies and the resultsare summed to obtain net fluxes. Climate models, however,require greater computational efficiency; one needs to com-pute the frequency-averaged radiation flux at each of severalthousand model time steps for each of several thousand grid
boxes covering a planet’s atmosphere. Modelers use variousapproximations to represent the aggregate effects of spectrallines averaged over bands about 50 cm−1 wide. Such approx-imations are validated against line-by-line codes that have, inturn, been validated against laboratory and atmospheric ob-servations. When averaged over a broad band, radiative fluxdecays algebraically rather than exponentially with distancetraversed, because the progressive depletion of flux atstrongly absorbed frequencies leaves behind flux at frequen-cies that are more weakly absorbed.5
Confirmation by observed spectraThe Sun radiates approximately like a blackbody having atemperature of 6000 K, even though the temperature of thesolar interior is many millions of degrees. That’s because thevisible-wavelength and IR photons that predominate in solarradiation can escape from only the cooler outer layers of theSun. Similarly, the 2.7-K cosmic microwave background ra-diation gives the temperature of the radiating layer of thevery early universe, redshifted down from its original, muchhigher temperature.
The radiating layer of a planet is the IR equivalent of theSun’s photosphere. When a planet is viewed from above, the
emission seen at a given frequency originates in the deepestlayer that is optically thin enough for significant numbers ofphotons to escape. The effective emission temperature forthat frequency is a suitably weighted average temperature ofthat layer. If the atmospheric temperature varies with height,variations of the absorption coefficients of atmosphericconstituents with frequency show up in planetary emissionspectra as variations of emission temperature; the moretransparent the atmosphere is, the deeper one can probe.
For atmospheres heated partly from below—either as aconsequence of solar absorption at the ground as in the caseof Earth, Mars, and Venus, or due to internal absorption andescaping interior heat as with Jupiter and Saturn—the lowerlayers of the atmosphere are stirred by convection and otherfluid motions, and the constant lifting and adiabatic coolingestablish a region whose temperature decline with height ap-proximates that of an adiabat. That region is the troposphere.At higher altitudes, heat transfer is dominated by radiativetransfer instead of fluid motions; the corresponding region isthe stratosphere. Stratospheric temperature is constant orgently decaying with height for pure IR radiative equilib-rium, but in situ absorption of solar radiation can make thestratospheric temperature increase with height. Ozone facil-itates such absorption on Earth, and organic hazes have asimilar effect on Titan. Typical temperature profiles for Earth,daytime Mars, and Venus are shown in the right-hand col-umn of figure 3.
The top panel of figure 3 compares global-mean, annual-
36 January 2011 Physics Today www.physicstoday.org
H 02 H 02CO2 O3
0.12
0.10
0.08
0.06
0.04
0.02
0200
200
200
400
400
400
600
600
600
800
800
800
1000
1000
1000
1200
1200
1200
1400
1400
1400
1600
1600
1600
1800
1800
1800
2000
2000
2000
WAVENUMBER (1/cm)
WAVENUMBER (1/cm)
WAVENUMBER (1/cm)
2 8 5
K
2 8 5 K
2 6 0 K 2 4 0 K 2 2 0 K
AIRSModel
0.10
0.08
0.06
0.04
0.02
0
0.10
0.08
0.06
0.04
0.02
0
TESPlanck 260 KPlanck 210 K
VeneraPlanck 260 KPlanck 210 K
190
150
200
190
400
230
600 800
230TEMPERATURE (K)
TEMPERATURE (K)
TEMPERATURE (K)
270
10
100
1000
10
100
0.001
0.01
0.1
1
10
100
P R E S S U R E
( 1 0 0
P a )
P R E S S U R E
( P a )
P R E S S U R E
( 1 0 P a )
5
Tropopause
Troposphere
Stratosphere
Earth
Mars
Venus
a
b
c
F L U X
( W / m
r )
2 · s
F L U X
( W / m
r )
2 · s
F L U X
( W / m
r ) 2 · s
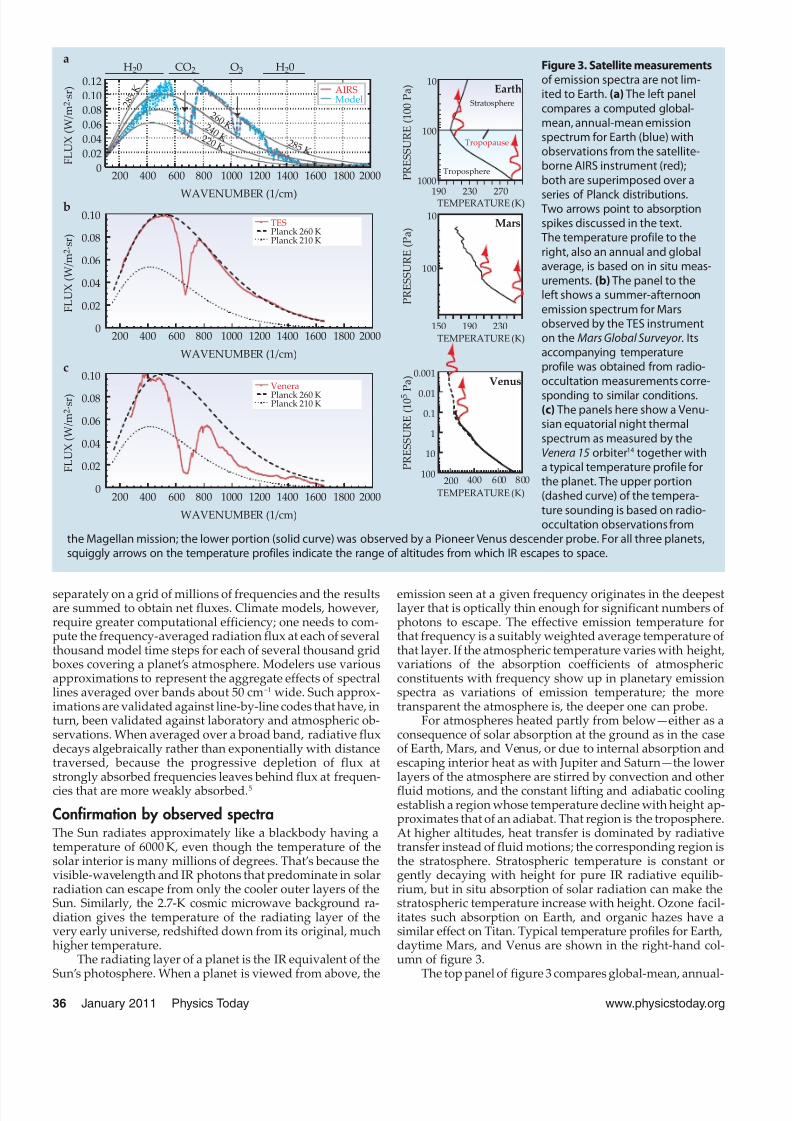
Figure 3. Satellite measurementsof emission spectra are not lim-ited to Earth. (a) The left panelcompares a computed global-mean, annual-mean emissionspectrum for Earth (blue) withobservations from the satellite-borne AIRS instrument (red);both are superimposed over a
series of Planck distributions.Two arrows point to absorptionspikes discussed in the text.The temperature profile to theright, also an annual and globalaverage, is based on in situ meas-urements. (b) The panel to theleft shows a summer-afternoonemission spectrum for Mars observed by the TES instrumenton the Mars Global Surveyor . Itsaccompanying temperature profile was obtained from radio- occultation measurements corre-
sponding to similar conditions.(c) The panels here show a Venu-sian equatorial night thermalspectrum as measured by theVenera 15 orbiter14 together witha typical temperature profile forthe planet. The upper portion(dashed curve) of the tempera-ture sounding is based on radio-occultation observations from
the Magellan mission; the lower portion (solid curve) was observed by a Pioneer Venus descender probe. For all three planets,squiggly arrows on the temperature profiles indicate the range of altitudes from which IR escapes to space.
8/13/2019 IR Temperature
http://slidepdf.com/reader/full/ir-temperature 5/6
mean, clear-sky spectra of Earth observed by the Atmos-pheric Infrared Sounder (AIRS) satellite instrument withspectra calculated after the radiative transfer equations wereapplied to output of a climate model driven by observed sur-face temperatures.7 The agreement between the two is nearlyperfect, which confirms the validity of the radiative transfertheory, the spectroscopy used to implement it, and thephysics of the climate model. The AIRS instrument coversonly wavenumbers above 650 cm−1 , but the theory and spec-troscopic data sources used for radiative transfer at lower
wavenumbers do not differ in any significant way from thoseused in the wavenumber range probed by AIRS. Numerousobservations—notably, downward-looking radiation meas-urements from high-altitude aircraft—have confirmed thevalidity of radiative transfer models in the low-wavenumberwater-vapor region.8
In the window region from roughly 800 to 1300 cm−1 ,Earth radiates to space at very nearly the mean temperatureof the ground, except for a dip due to ozone near 1050 cm−1.At higher wavenumbers, one can see the reduction of radiat-ing temperature due to water-vapor opacity. The main CO2
absorption group leads to a pronounced reduction of radiat-ing temperature in a broad region centered on 667 cm−1. Theemission spike at the center of the feature arises because CO2
absorbs so strongly that the radiating level is in the upperstratosphere, which is considerably warmer than thetropopause; the ozone feature exhibits a similar spike. Thespectrum thus reveals the presence of CO2 , water vapor,ozone, and other gases not discussed here. We can infer thatthe planet has a stratosphere in which temperature increaseswith height, indicating the presence of an upper-level solarabsorber. We can determine that temperatures of the atmos-phere and ground range at least from 220 K to 285 K. But ab-sent additional information, we cannot tell that the high endof that range actually comes from the ground.
Climate scientists routinely use spectral inferences suchas those discussed above to monitor the state of Earth’s at-mosphere from space. Every time you see an IR weather satel-
lite image, you are seeing radiative transfer in action. Earth’sliquid or frozen water clouds act essentially as blackbodies.They emit at the cloud-top temperature, which is cold if theclouds are deep. On an IR satellite image, clouds appear asregions of weak emission, though by convention IR weathersatellite images are usually presented with an inverted grayscale that makes clouds look white, as one expects fromeveryday experience. Weather forecasting centers worldwideuse such images many times every day, as they show cloudpatterns even on Earth’s night side and, unlike visible-lightimages, allow forecasters to determine the height of cloudtops. Observations in selected IR and microwave bands areroutinely used to retrieve temperature profiles and patternsof atmospheric constituents such as water vapor and CO2.
Figure 3 also shows emission spectra for Mars andVenus. The Martian spectrum, obtained on a summer after-noon, mainly takes the form of blackbody emission from a260-K surface, but as with Earth’s spectrum, it has a regioncentered on the main CO2 absorption band where the radiat-ing temperature is much colder. As far as one can tell fromits IR spectra, nighttime Venus looks about as cold as daytimeMars. However, based on microwave emissions (to which theatmosphere is largely transparent), Venera landers, and Pio-neer descenders, we now know that Venus has an extremelyhot surface, a nearly pure CO2 atmosphere, and a surfacepressure of nearly 100 Earth atmospheres. Because of thethick atmosphere, essentially all the IR escaping from Venusoriginates in the top region of the atmosphere, where the
pressure is less than 2.5 × 10⁴ Pa. The highest-temperature radiating surface in that layer is primarily attributable to CO2
continuum absorption, which fills in the transparent regionsof the line spectrum shown in figure 2. Sulfuric-acid cloudsand trace amounts of water vapor also contribute to pluggingthe gaps.
Energy balance and surface temperatureThe same considerations used in the interpretation of spectraalso determine the IR cooling rate of a planet and hence itssurface temperature. An atmospheric greenhouse gas enablesa planet to radiate at a temperature lower than the ground’s,if there is cold air aloft. It therefore causes the surface tem-perature in balance with a given amount of absorbed solarradiation to be higher than would be the case if the atmos-phere were transparent to IR. Adding more greenhouse gas
to the atmosphere makes higher, more tenuous, formerlytransparent portions of the atmosphere opaque to IR and thusincreases the difference between the ground temperature andthe radiating temperature. The result, once the system comesinto equilibrium, is surface warming. The effect is particu-larly spectacular for Venus, whose ground temperature is730 K. If the planet were a blackbody in equilibrium with thesolar radiation received by the planet, the ground tempera-ture would be a mere 231 K.
The greenhouse effect of CO2 on Earth and Mars is visu-ally manifest as the ditch carved out of the Planck spectrumnear 667 cm−1. That dip represents energy that would haveescaped to space were it not for the opacity of CO2. On Venus,the CO
2
greenhouse effect extends well beyond the ditch,
www.physicstoday.org January 2011 Physics Today 37
The path to the present understanding of the effect of carbondioxide on climate was not without its missteps. Notably, in1900 Knut Ångström (son of Anders Ångström, whose namegraces a unit of length widely used among spectroscopists)argued in opposition to his fellow Swedish scientist SvanteArrhenius that increasing CO2 could not affect Earth’s climate.Ångström claimed that IR absorption by CO2 was saturated inthe sense that, for those wavelengths CO2 could absorb at all,
the CO2 already present in Earth’s atmosphere was absorbingessentially all of the IR. With regard to Earthlike atmospheres,Ångström was doubly wrong. First, modern spectroscopyshows that CO2 is nowhere near being saturated. Ångström’slaboratory experiments were simply too inaccurate to show theadditional absorption in the wings of the 667-cm−1 CO2 featurethat follows upon increasing CO2. But even if CO2 were saturatedin Ångström’s sense—as indeed it is on Venus—his argumentwould nonetheless be fallacious. The Venusian atmosphere as awhole may be saturated with regard to IR absorption, but theradiation only escapes from the thin upper portions of theatmosphere that are not saturated. Hot as Venus is, it wouldbecome still hotter if one added CO2 to its atmosphere.
A related saturation fallacy, also popularized by Ångström, isthat CO2 could have no influence on radiation balance becausewater vapor already absorbs all the IR that CO2 would absorb.Earth’s very moist, near-surface tropical atmosphere is nearlysaturated in that sense, but the flaw in Ångström’s argument isthat radiation in the portion of the spectrum affected by CO2
escapes to space from the cold, dry upper portions of theatmosphere, not from the warm, moist lower portions. Also, asdisplayed in the inset to figure 2, the individual water-vaporand CO2 spectral lines interleave but do not totally overlap. Thatstructure limits the competition between CO2 and water vapor.
Saturation fallacies
8/13/2019 IR Temperature
http://slidepdf.com/reader/full/ir-temperature 6/6
owing to the opacity of the continuum associated with somuch CO2. In the Earth spectrum, one can also see a broadregion in which water vapor has reduced the radiating tem-perature to a value well below the surface temperature.
For Earth and Mars, the width of the CO2 ditch corre-sponds approximately to the width of the spectral regionover which the atmosphere is nearly opaque to IR. Increasingatmospheric CO2 increases the width of the ditch and henceincreases the CO2 greenhouse effect. But the increase occursin the wings of the absorption feature rather than at the center
(see figure 2). That limitation is the origin of the logarithmicrelation between CO2 concentration and the resulting pertur-
bation in Earth’s energy budget. It has been a feature of everyclimate model since that of Svante Arrhenius in 1896. Persquare meter of surface, Mars has nearly 70 times as muchCO2 in its atmosphere as Earth, but the low Martian atmos-pheric pressure results in narrower spectral lines. That weak-ens absorption so much that the Martian CO2 ditch has awidth somewhat less than Earth’s.
The planetary warming resulting from the greenhouseeffect is consistent with the second law of thermodynamics
because a planet is not a closed system. It exchanges heat witha high-temperature bath by absorbing radiation from thephotosphere of its star and with a cold bath by emitting IR
into the essentially zero-temperature reservoir of space. Ittherefore reaches equilibrium at a temperature intermediate
between the two. The greenhouse effect shifts the planet’ssurface temperature toward the photospheric temperature byreducing the rate at which the planet loses energy at a givensurface temperature. The way that works is really no differentfrom the way adding fiberglass insulation or low-emissivitywindows to your home increases its temperature without re-quiring more energy input from the furnace. The tempera-ture of your house is intermediate between the temperatureof the flame in your furnace and the temperature of the out-doors, and adding insulation shifts it toward the former
by reducing the rate at which the house loses energy to theoutdoors. As Fourier already understood, when it comes to
relating temperature to the principles of energy balance, itmatters little whether the heat-loss mechanism is purely ra-diative, as in the case of a planet, or a mix of radiation andturbulent convection, as in the case of a house—or a green-house. Carbon dioxide is just planetary insulation.
For present Earth conditions, CO2 accounts for about athird of the clear-sky greenhouse effect in the tropics and fora somewhat greater portion in the drier, colder extratropics(see reference 9, figure 12.1); the remainder is mostly due towater vapor. The contribution of CO2 to the greenhouse ef-fect, considerable though it is, understates the central role ofthe gas as a controller of climate. The atmosphere, if CO2 wereremoved from it, would cool enough that much of the watervapor would rain out. That precipitation, in turn, wouldcause further cooling and ultimately spiral Earth into a glob-ally glaciated snowball state.10 It is only the presence of CO2
that keeps Earth’s atmosphere warm enough to contain muchwater vapor. Conversely, increasing CO2 would warm the atmosphere and ultimately result in greater water-vapor content—a now well-understood situation known as water-vapor feedback.9,11
Though the first calculation of the warming of Earth dueto CO2 increase was carried out by Arrhenius in 1896, accu-rate CO2 and water-vapor spectroscopy and a fully correctformulation of planetary energy balance did not come to-gether until the work of Syukuro Manabe and RichardWetherald in 1967.2,12 With that development, the theory was
brought to its modern state of understanding. It has with-
stood all subsequent challenges and without question repre-sents one of the great triumphs of 20th-century physics.
Planets far and nearThe foundations of radiative transfer were laid by some ofthe greatest physicists of the 19th and 20th centuries—Fourier, Tyndall, Arrhenius, Kirchhoff, Ludwig Boltzmann,Max Planck, Albert Einstein, Schwarzschild, Arthur Edding-ton, Milne, and Subrahmanyan Chandrasekhar—plus manymore whose names are not well known, even among physi-
cists, but probably deserve to be. The subject has had a cen-tury of triumphs (and, as the box on page 37 describes, somewrong turns)13 and is about to go into high gear because ofthe dawning era of extrasolar planet discovery. What kind ofatmospheres would render a planet in the potentially habit-able zone of its star actually habitable,13 and how would as-tronomers detect it? If they see a high-albedo object with CO2
in its atmosphere, how will they determine if it is a snowballor a large Venus-like rocky planet?
Whatever the future holds for newly discovered planets,interest remains intense in maintaining the habitability of theplanet likely to be our only home for some time to come. Thecontributions of fundamental physics to achieving that aimare clear. The CO2 greenhouse effect is directly visible in satel-
lite observations of the bite taken out of the IR spectrum near667 cm−1 , a feature whose details agree precisely with resultsof calculations based on first-principles radiative transfer cal-culations. Laboratory spectroscopy demonstrates that thewidth of the bite will increase as CO2 increases, and warminginevitably follows as a consequence of well-established energy-balance principles. The precise magnitude of the re-sulting warming depends on the fairly well-known amountof amplification by water-vapor feedbacks and on the less-known amount of cloud feedback. There are indeed uncer-tainties in the magnitude and impact of anthropogenic globalwarming, but the basic radiative physics of the anthro-pogenic greenhouse effect is unassailable.
I am grateful to Yi Huang for providing me with AIRS spectra, to DavidCrisp for providing Venera digital data and for many illuminating dis-cussions on the subject of radiative transfer over the years, and to
Joachim Pelkowski for pointing out Poisson’s work on radiative transfer.
References1. R. T. Pierrehumbert, Nature 432 , 677 (2004).2. D. A. Archer, R. T. Pierrehumbert, eds., The Warming Papers:
The Scientific Foundation for the Climate Change Forecast , Wiley-Blackwell, Hoboken, NJ (in press).
3. S. D. Poisson, Théorie mathématique de la chaleur , Bachelier, Paris(1835).
4. L. S. Rothman et al., J. Quant. Spectrosc. Radiat. Transfer 110 , 533(2009).
5. R. T. Pierrehumbert, Principles of Planetary Climate , CambridgeU. Press, New York (2010).
6. I. Halevy, R. T. Pierrehumbert, D. P. Schrag, J. Geophys. Res. 114 ,D18112 (2009), doi:10.1029/2009JD011915.
7. Y. Huang et al., Geophys. Res. Lett. 34 , L24707 (2007),doi:10.1029/2007GL031409.
8. See, for example, D. Marsden, F. P. J. Valero, J. Atmos. Sci. 61 , 745(2004).
9. R. T. Pierrehumbert, H. Brogniez, R. Roca, in The Global Circula-tion of the Atmosphere , T. Schneider, A. Sobel, eds., Princeton U.Press, Princeton, NJ (2007), p. 143.
10. A. Voigt, J. Marotzke, Clim. Dyn. 35 , 887 (2010).11. A. E. Dessler, S. C. Sherwood, Science 323 , 1020 (2009).12. S. Weart, The Discovery of Global Warming , Harvard U. Press,
Cambridge, MA (2008), and online material at http://www.aip.org/history/climate/index.htm.
13. R. T. Pierrehumbert, Ap. J. Lett. (in press).14. V. I. Moroz et al., Appl. Opt. 25 , 1710 (1986). ■
38 January 2011 Physics Today www.physicstoday.org


![Manual UETF-IR-HT en 2015 05 06 - uwe electronic€¦ · UETF-IR-CHT-2014E 8 3MH1 3MH2 3MH3 G5L G5H P7 Lower limit temperature range [°C] 150 200 250 100 250 0 Upper limit temperature](https://img.pdfslide.net/doc/110x75/60ad1f266186393ade341db2/manual-uetf-ir-ht-en-2015-05-06-uwe-electronic-uetf-ir-cht-2014e-8-3mh1-3mh2-3mh3.jpg)