Embed Size (px)
Citation preview
Forward-Looking Statements
This presentation contains “forward-looking statements” within the meaning of the Private Securities Litigation Reform Act of 1995. Statements other than those of current or historical fact, and all statements accompanied by terms such as “will,” “believe,” “project,” “expect,” “estimate,” “assume,” “intend,” “anticipate,” “target,” “plan,” and similar terms, are intended to be forward-looking statements. Forward-looking statements are made subject to the safe harbor provisions of the federal securities laws pursuant to Section 27A of the Securities Act of 1933 and Section 21E of the Securities Exchange Act of 1934.From time to time, we also include written or oral forward-looking statements in other publicly disclosed materials. Such statements may relate to our intent, belief, forecasts of, or current expectations about our strategic direction, prospects, future results, or future events; they do not relate strictly to historical or current facts. Management believes that these forward-looking statements are reasonable as and when made. However, caution should be taken not to place undue reliance on any forward-looking statements because such statements speak only as of the date when made and the future, by its very nature, cannot be predicted with certainty.Forward-looking statements are subject to certain risks and uncertainties that could cause actual results to differ materially from our historical experience and our present expectations or anticipated results. These risks and uncertainties, include, but are not limited to: continued uncertainties related to the impact of the COVID-19 pandemic on our business and operations, financial performance and liquidity, our customers and suppliers, and on the global economy; changes in general economic conditions, in the U.S. or internationally; significant competition on a local, regional, national and international basis; changes in our relationships with our significant customers; changes in the regulatory environment in the U.S. or internationally; increased or more complex physical or data security requirements; legal, regulatory or market responses to global climate change; results of negotiations and ratifications of labor contracts; strikes, work stoppages or slowdowns by our employees; the effects of changing prices of energy, including gasoline, diesel and jet fuel, and interruptions in supplies of these commodities; changes in exchange rates or interest rates; uncertainty from the expected discontinuance of LIBOR and transition to any other interest rate benchmark; our ability to maintain our brand image; our ability to attract and retain qualified employees; breaches in data security; disruptions to the Internet or our technology infrastructure; interruptions in or impacts on our business from natural or man-made events or disasters including terrorist attacks, epidemics or pandemics; our ability to accurately forecast our future capital investment needs; exposure to changing economic, political and social developments in international and emerging markets; changes in business strategy, government regulations, or economic or market conditions that may result in impairment of our assets; increases in our expenses or funding obligations relating to employee health, retiree health and/or pension benefits; potential additional U.S. or international tax liabilities; potential claims or litigation related to labor and employment, personal injury, property damage, business practices, environmental liability and other matters; our ability to realize the anticipated benefits from acquisitions, dispositions, joint ventures or strategic alliances; our ability to realize the anticipated benefits from our transformation initiatives; cyclical and seasonal fluctuations in our operating results; our ability to manage insurance and claims expenses; and other risks discussed in our filings with the Securities and Exchange Commission from time to time, including our Annual Report on Form 10-K for the year ended December 31, 2020 and subsequently filed reports. You should consider the limitations on, and risks associated with, forward-looking statements and not unduly rely on the accuracy of predictions contained in such forward-looking statements. We do not undertake any obligation to update forward-looking statements to reflect events, circumstances, changes in expectations, or the occurrence of unanticipated events after the date of those statements.
Better, Not BiggerStrategic Framework
Carol B. ToméChief Executive Officer

Values
Dividend
Strong balance sheet and credit rating
Brand relevance
Employee ownership
Five Principles
…everything else is under review
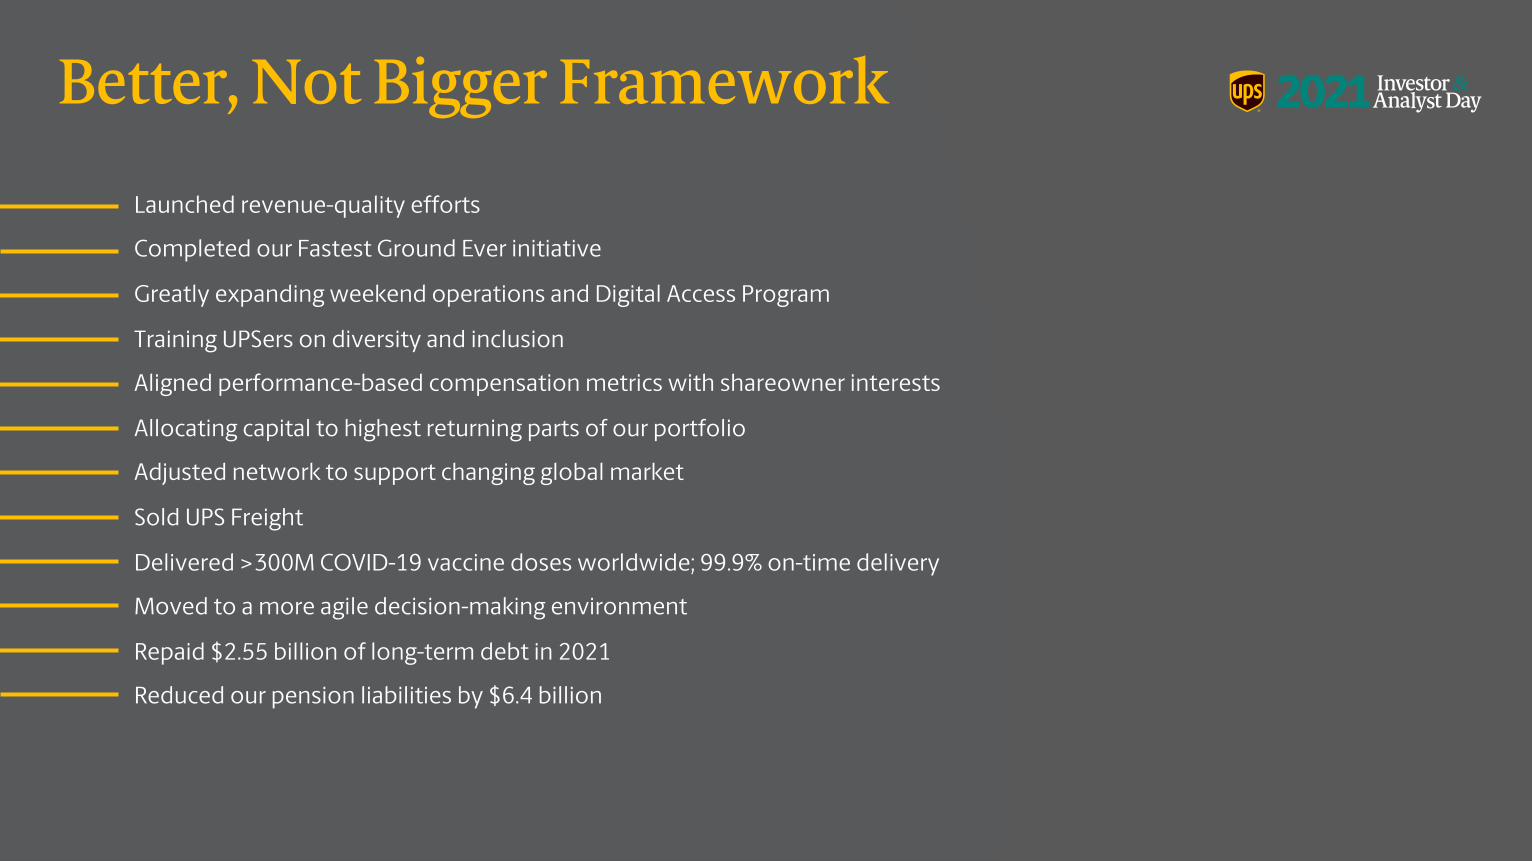
Launched revenue-quality efforts
Completed our Fastest Ground Ever initiative
Greatly expanding weekend operations and Digital Access Program
Training UPSers on diversity and inclusion
Aligned performance-based compensation metrics with shareowner interests
Allocating capital to highest returning parts of our portfolio
Adjusted network to support changing global market
Sold UPS Freight
Delivered >300M COVID-19 vaccine doses worldwide; 99.9% on-time delivery
Moved to a more agile decision-making environment
Repaid $2.55 billion of long-term debt in 2021
Reduced our pension liabilities by $6.4 billion
Better, Not Bigger Framework

Better, Not Bigger FrameworkGoing From Good to Great
What is UPS passionate about?Our purpose: Moving our world forward by delivering what matters.
What are we the best in the world at?Our global smart logistics network is the most extensive ground and air network in the industry.
What are the drivers of the UPS economic engine?Productivity and efficiency driven by effective capital allocation.

6
Total Global Market
$328 $452
$596
2017 2020 2023E
Global Small Package Market (USD, Billions)
+10%
+13%YoY
Source: UPS estimates, Transport Intelligence, Effigy Consulting and competitor filings. Includes: DHL eCommerce, DHL Parcel Germany, China Domestic, and <1lb. Excludes: cross-border mail packages.
CAGR
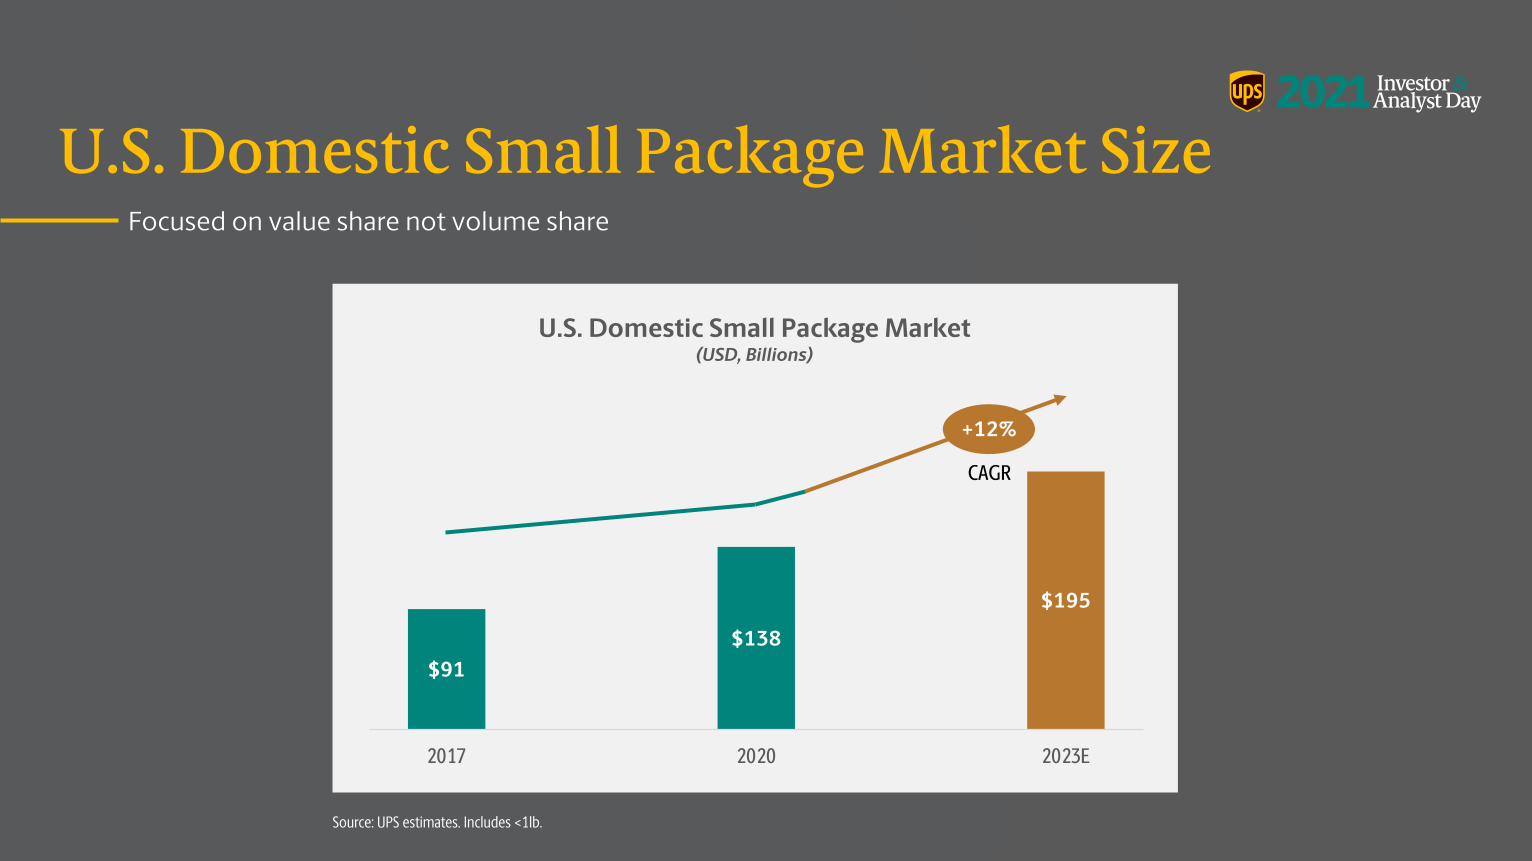
$91 $138
$195
2017 2020 2023E
U.S. Domestic Small Package Market (USD, Billions)
7
Focused on value share not volume share
+12%
U.S. Domestic Small Package Market Size
Source: UPS estimates. Includes <1lb.
CAGR
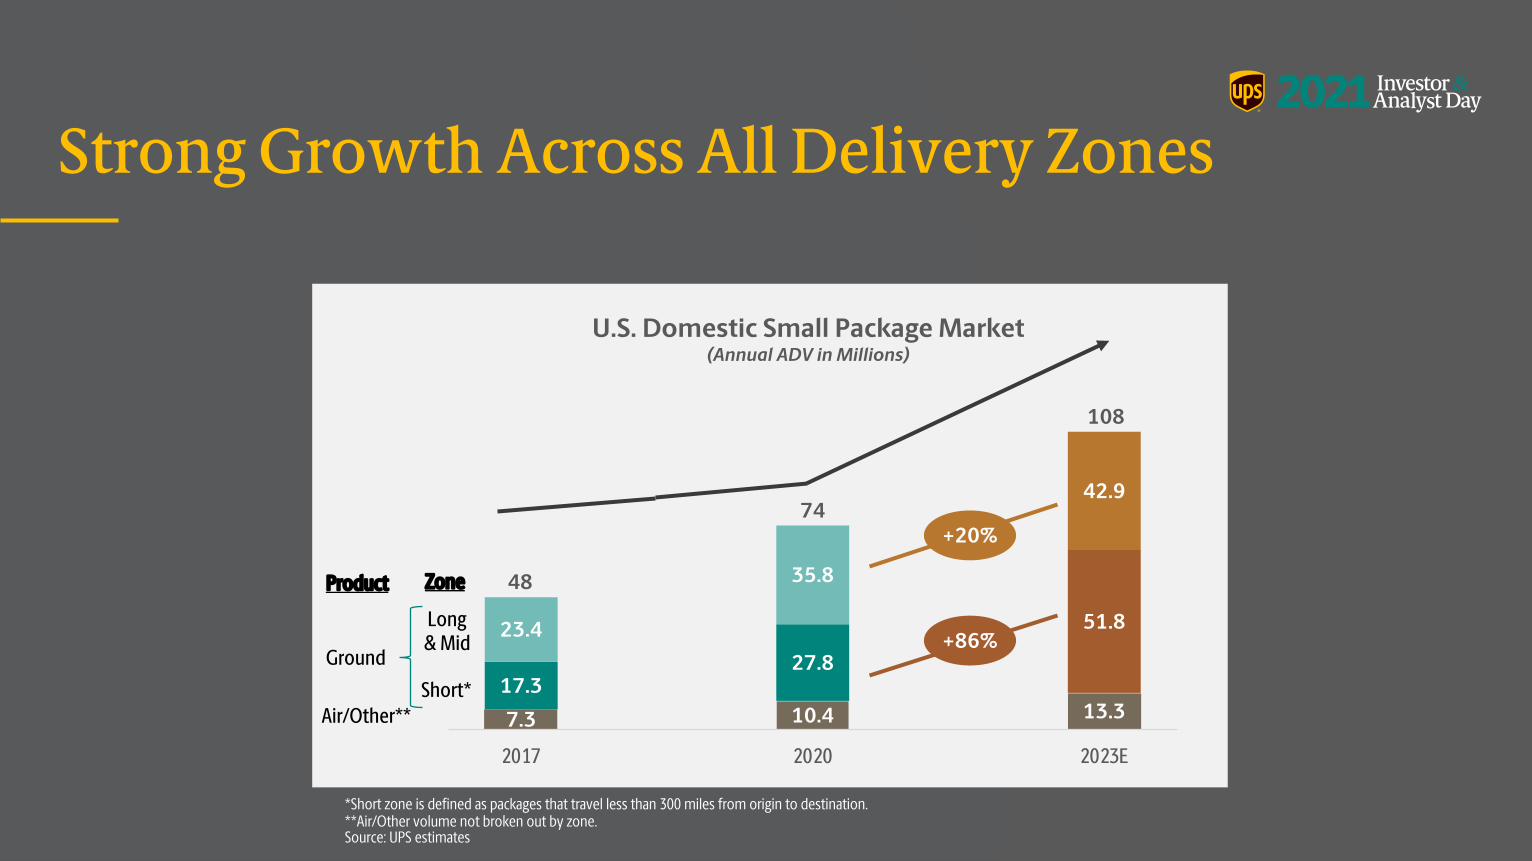
Strong Growth Across All Delivery Zones
7.3 10.4 13.317.3
27.8
51.823.4
35.8
42.9
2017 2020 2023E
U.S. Domestic Small Package Market(Annual ADV in Millions)
Short*
Long & Mid
+20%
+86%
Zone
*Short zone is defined as packages that travel less than 300 miles from origin to destination.**Air/Other volume not broken out by zone.Source: UPS estimates
108
48
74
Air/Other**
Ground
Product
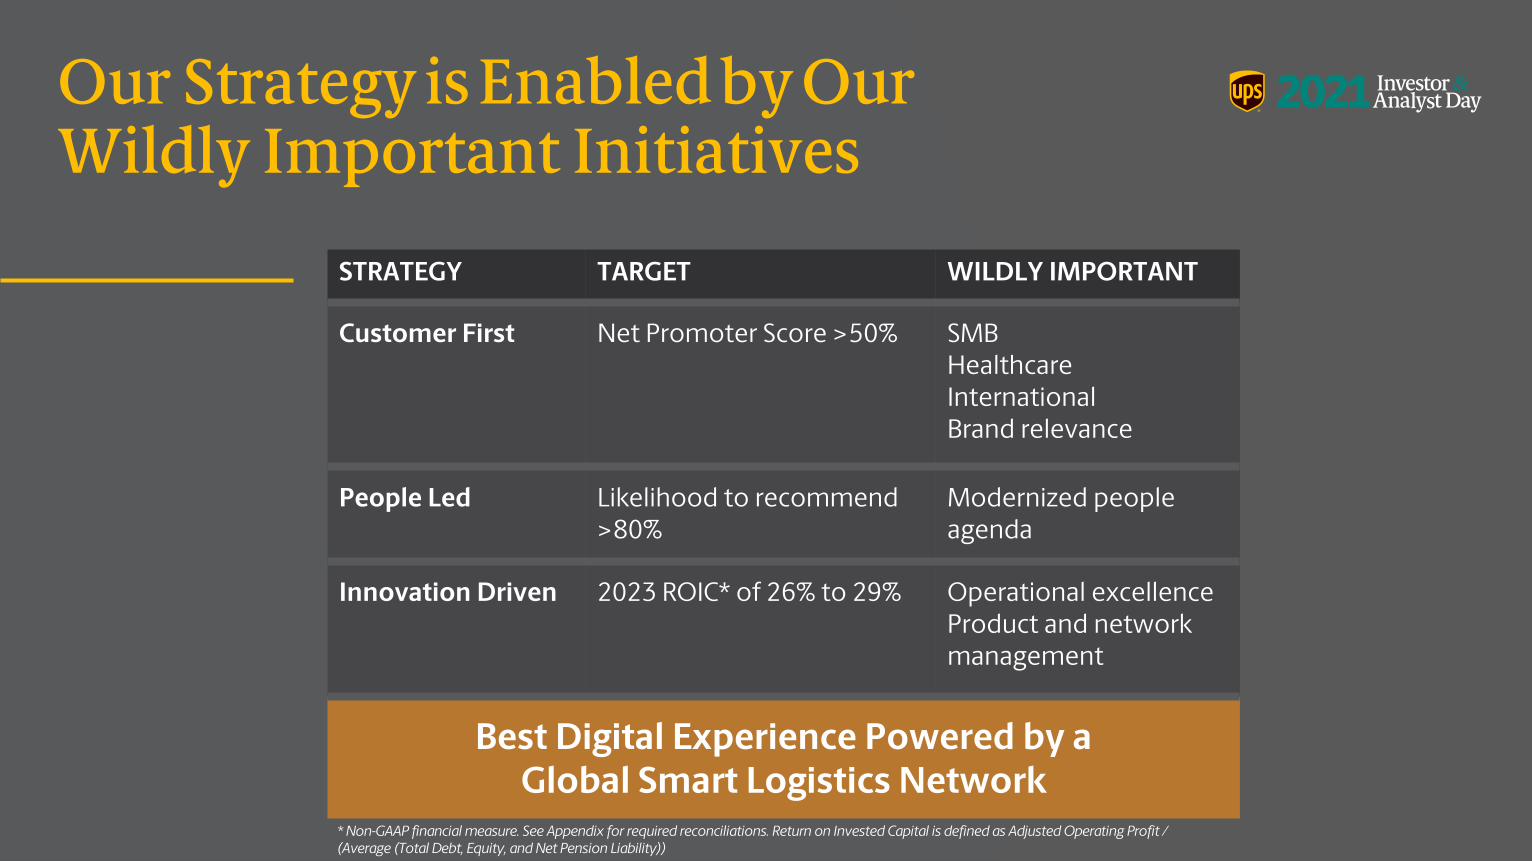
Our Strategy is Enabled by Our Wildly Important Initiatives
STRATEGY TARGET WILDLY IMPORTANT
Customer First Net Promoter Score >50% SMBHealthcareInternationalBrand relevance
People Led Likelihood to recommend >80%
Modernized people agenda
Innovation Driven 2023 ROIC* of 26% to 29% Operational excellenceProduct and network management
Best Digital Experience Powered by a Global Smart Logistics Network
* Non-GAAP financial measure. See Appendix for required reconciliations. Return on Invested Capital is defined as Adjusted Operating Profit / (Average (Total Debt, Equity, and Net Pension Liability))

http://www.investors.ups.com/ESG
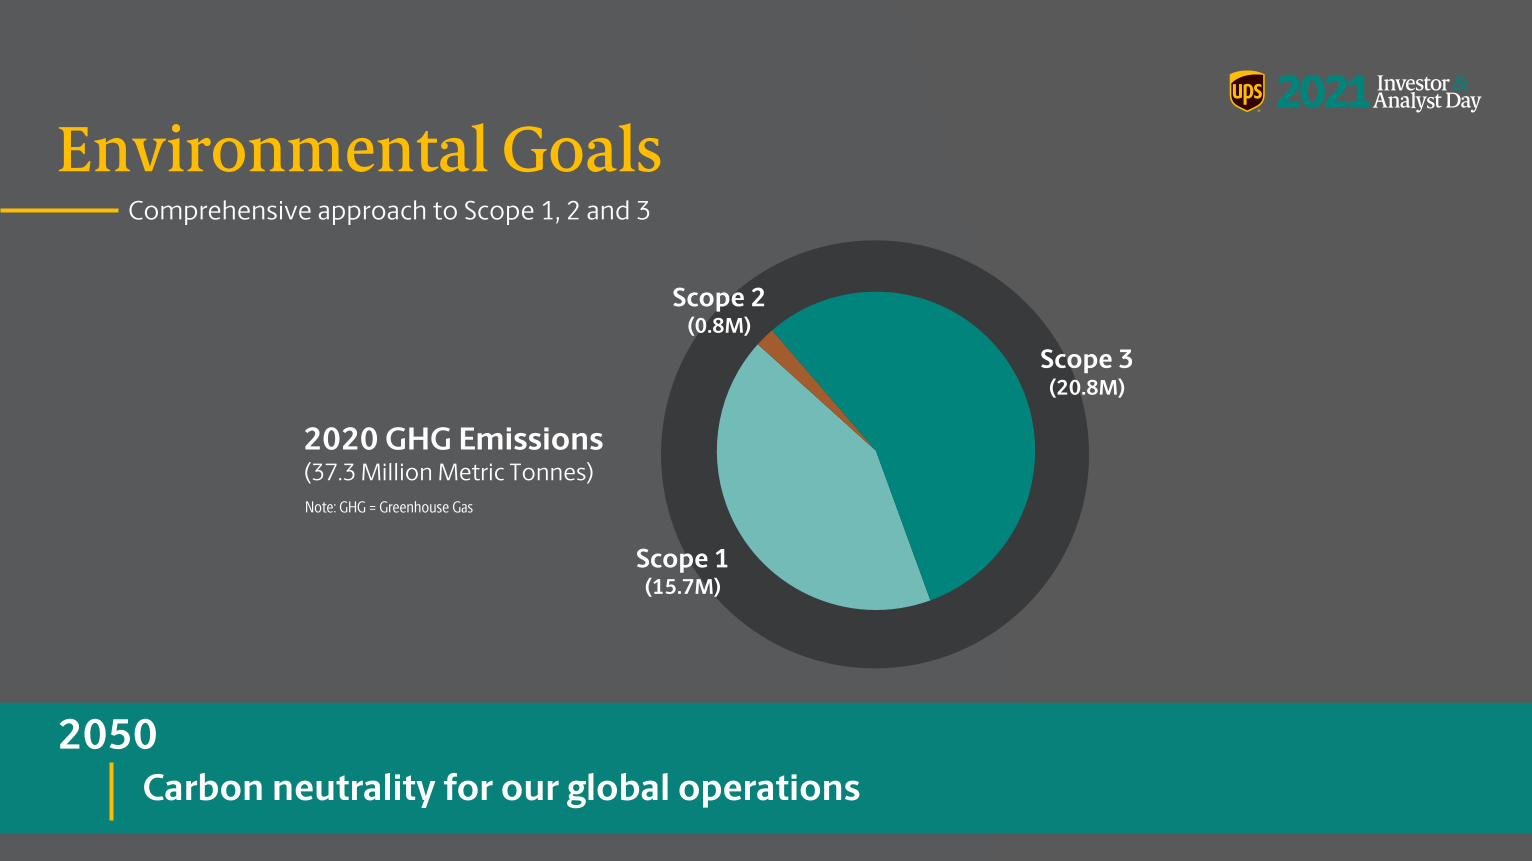
Scope 1(15.7M)
Scope 2(0.8M)
Scope 3(20.8M)
2020 GHG Emissions (37.3 Million Metric Tonnes)
Environmental Goals
2050Carbon neutrality for our global operations
Comprehensive approach to Scope 1, 2 and 3
Note: GHG = Greenhouse Gas

202525% renewable electricity for facilities 40% alternative fuel for our ground vehicles
100% renewable electricity for facilities30% sustainable aviation fuel
50% reduction in CO2 per package delivered for global small package (2020 base year)2035
2050Carbon neutrality for our global operations
Environmental GoalsRoadmap
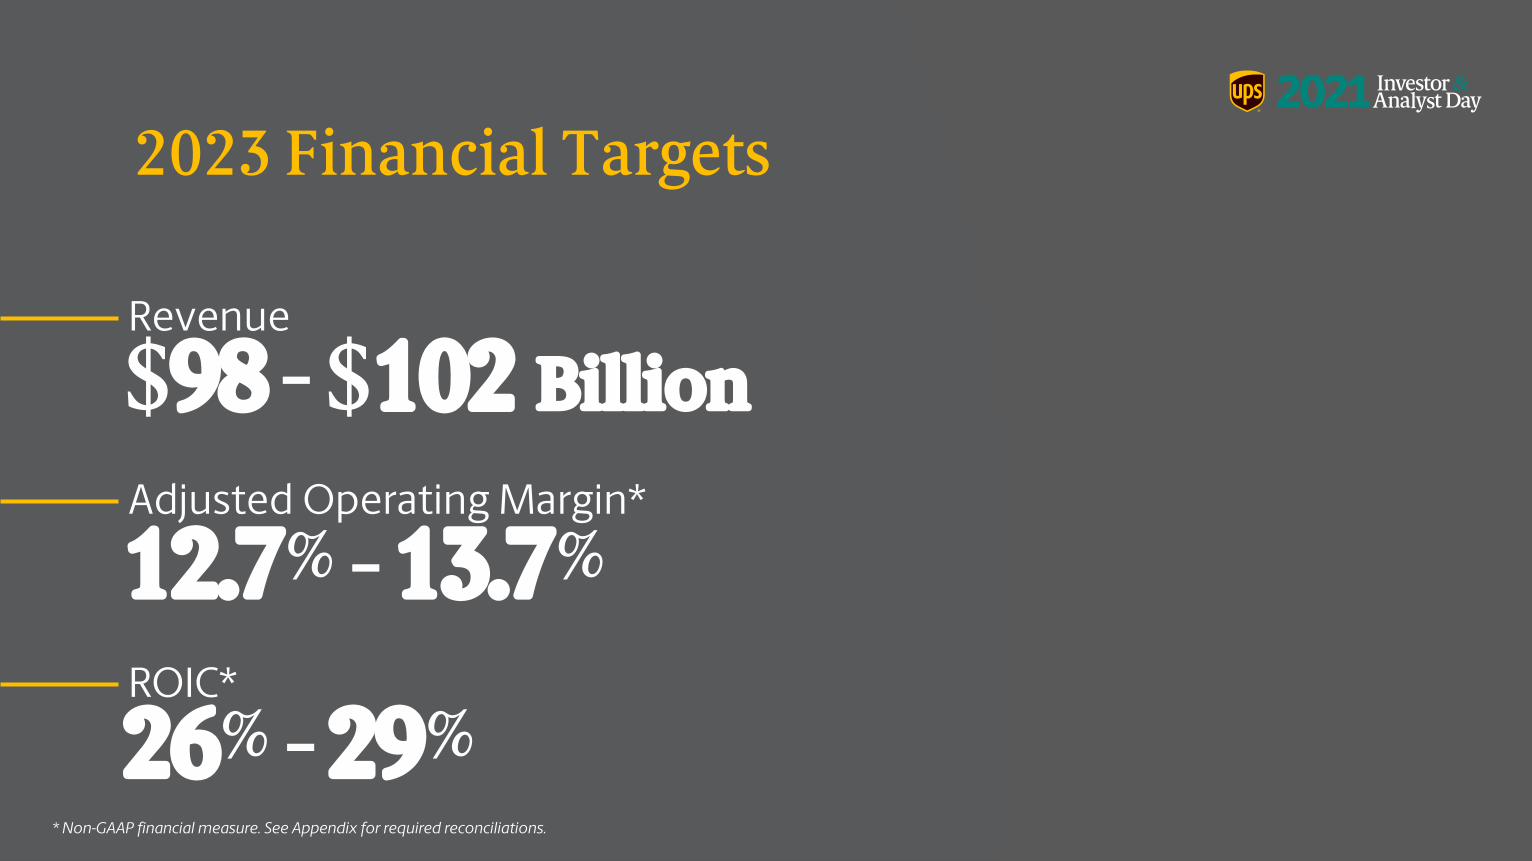
2023 Financial Targets
$98 - $102 BillionRevenue
12.7% - 13.7%Adjusted Operating Margin*
ROIC*
* Non-GAAP financial measure. See Appendix for required reconciliations.
26% - 29%
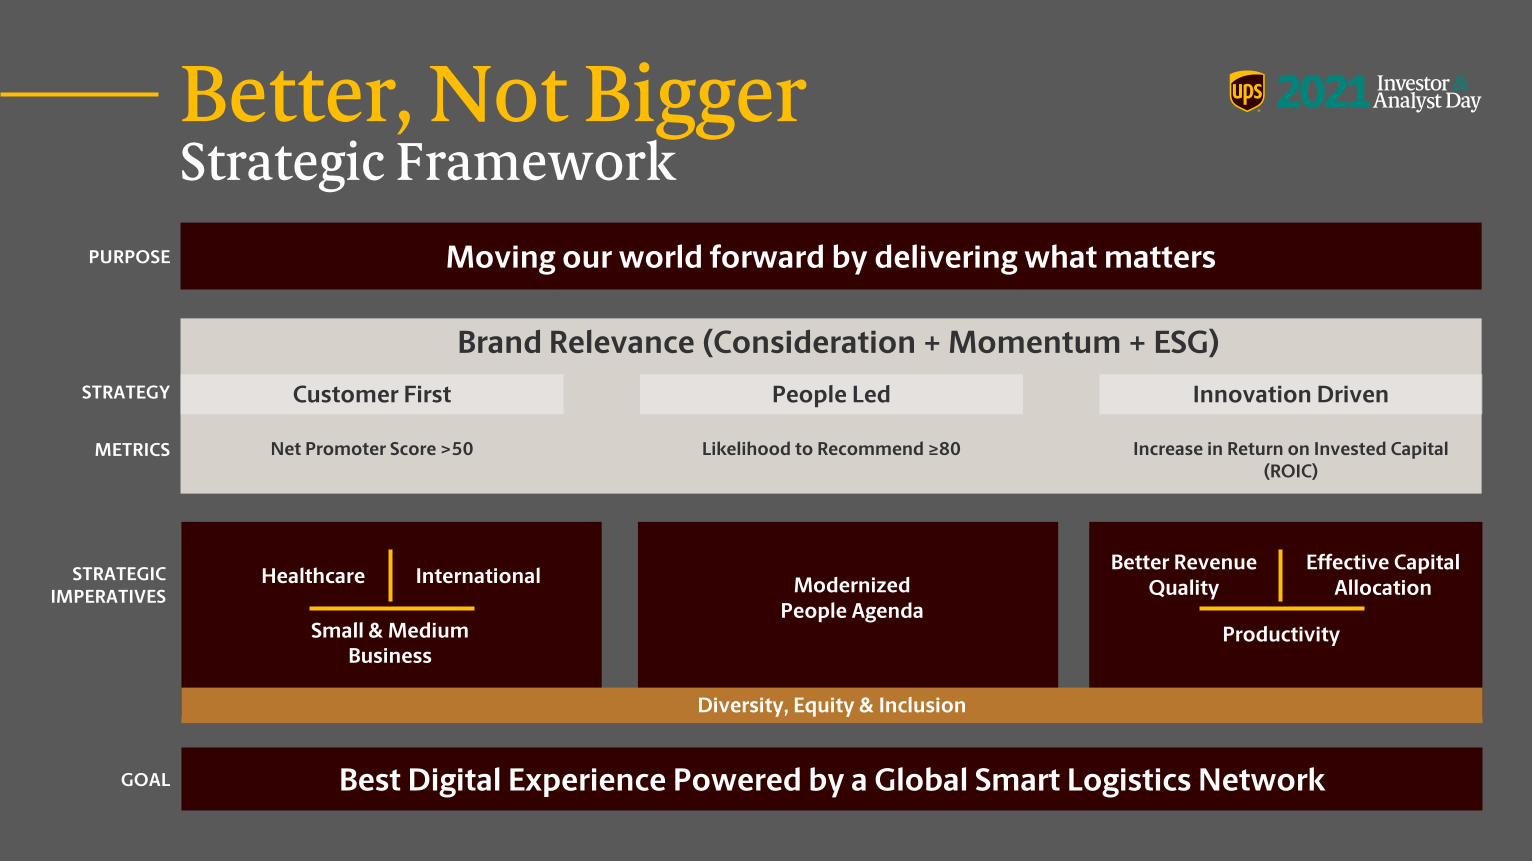
Better, Not Bigger Strategic Framework
Net Promoter Score >50
Innovation DrivenPeople LedCustomer FirstSTRATEGY
METRICS Increase in Return on Invested Capital (ROIC)
Likelihood to Recommend ≥80
STRATEGIC IMPERATIVES
Best Digital Experience Powered by a Global Smart Logistics Network
PURPOSE Moving our world forward by delivering what matters
Brand Relevance (Consideration + Momentum + ESG)
GOAL
Small & Medium Business
Healthcare International
Diversity, Equity & Inclusion
Modernized People Agenda
Better Revenue Quality
Productivity
Effective Capital Allocation
Non-GAAP ReconciliationsNon-GAAP Financial Measures; ReconciliationsFrom time to time we supplement the reporting of our financial information determined under generally accepted accounting principles ("GAAP") with certain non-GAAP financial measures. These include: "adjusted" compensation and benefits; operating expenses; earnings before interest, taxes, depreciation and amortization (“EBITDA”); operating profit; operating margin; other income and (expense); income before income taxes; income tax expense; effective tax rate; net income; and earnings per share.We present revenue and revenue per piece on a constant currency basis. Additionally, we disclose free cash flow, return on invested capital (“ROIC”) and the ratio of adjusted total debt to adjusted EBITDA. We believe that these non-GAAP measures provide meaningful information to assist users of our financial statements in more fully understanding our financial results and cash flows and assessing our ongoing performance, because they exclude items that may not be indicative of, or are unrelated to, our underlying operations and may provide a useful baseline for analyzing trends in our underlying businesses. These non-GAAP measures are used internally by management for business unit operating performance analysis, business unit resource allocation and in connection with incentive compensation award determinations.Non-GAAP financial measures should be considered in addition to, and not as an alternative for, our reported results prepared inaccordance with GAAP. Our adjusted financial information does not represent a comprehensive basis of accounting. Therefore, our adjusted financial information may not be comparable to similarly titled information reported by other companies.Restructuring and Other ChargesAdjusted EBITDA, operating profit, operating margin, income before income taxes, net income and earnings per share may exclude the impact of charges related to any restructuring programs, including transformation costs and asset impairments. Costs Related to Legal Contingencies and ExpensesAdjusted EBITDA, operating profit, operating margin, pre-tax income, net income and earnings per share may exclude the impact of costs related to certain of our legal contingencies and expenses that are associated with non-routine legal matters. We believe this adjusted information provides a useful comparison of year-to-year financial performance without considering the impact of these non-routine contingencies and expenses. We evaluate our performance on this adjusted basis.Changes in Foreign Currency Exchange Rates and Hedging ActivitiesCurrency-neutral revenue, revenue per piece and operating profit exclude the period over period impact of foreign currency exchange rate changes and any foreign currency hedging activities. These measures are calculated by dividing current period reported U.S. dollar revenue, revenue per piece and operating profit by the current period average exchange rates to derive current period local currency revenue, revenue per piece and operating profit. The derived amounts are then multiplied by theaverage foreign exchange rates used to translate the comparable results for each month in the prior year period (including the impact of any foreign currency hedging activities). The difference between the current period reported U.S. dollar revenue, revenue per piece and operating profit and the derived current period U.S. dollar revenue, revenue per piece and operating profit is the period over period impact of foreign currency exchange rate and hedging activities.Mark-To-Market Pension and Postretirement AdjustmentsWe recognize changes in the fair value of plan assets and net actuarial gains and losses in excess of a 10% corridor for our pension and postretirement defined benefit plans immediately as part of other pension income (expense). We supplement our presentation of certain financial data with non-GAAP measures that exclude the impact of gains and losses recognized in excess of the 10% corridor and the related income tax effects. We believe excluding these mark-to-market impacts provides important supplemental information by removing the volatility associated with short-term changes in market interest rates, equity values, and similar factors.The deferred income tax effects of mark-to-market pension and postretirement adjustments are calculated by multiplying the statutory tax rates applicable in each tax jurisdiction, including the U.S. federal jurisdiction and various U.S. state and non-U.S. jurisdictions, by the adjustments.
Free Cash FlowWe calculate free cash flow as cash flows from operating activities less capital expenditures, proceeds from disposals of property, plant and equipment, and plus or minus the net changes in finance receivables and other investing activities. We believe free cash flow is an important indicator of how much cash is generated by our ongoing business operations and we use this as a measure of incremental cash available to invest in our business, meet our debt obligations and return cash to shareowners.
Return on Invested CapitalROIC is calculated as the trailing twelve months (“TTM”) of adjusted operating income divided by the average of total debt, non-current pension and postretirement benefit obligations and shareowners’ equity, at the current period end and the corresponding period end of the prior year. Because ROIC is not a measure defined by GAAP, we calculate it, in part, using non-GAAP financial measures that we believe are most indicative of our ongoing business performance. We consider ROIC to be a useful measure for evaluating the effectiveness and efficiency of our long-term capital investments.
Adjusted Total Debt / Adjusted EBITDAAdjusted total debt is defined as our long-term debt and finance leases, including current maturities, plus non-current pension and postretirement benefit obligations. Adjusted EBITDA is defined as earnings before interest, taxes, depreciation and amortization adjusted for restructuring and other costs and investment income and other. We believe the ratio of adjusted total debt to adjusted EBITDA is an important indicator of our financial strength, and is a ratio used by third parties when evaluating the level of our indebtedness.
Forward-Looking Non-GAAP MetricsFrom time to time when presenting forward-looking non-GAAP metrics, we are unable to provide quantitative reconciliations to the most closely correlated GAAP measure due to the uncertainty in the timing, amount or nature of any adjustments, which could be material in any period.
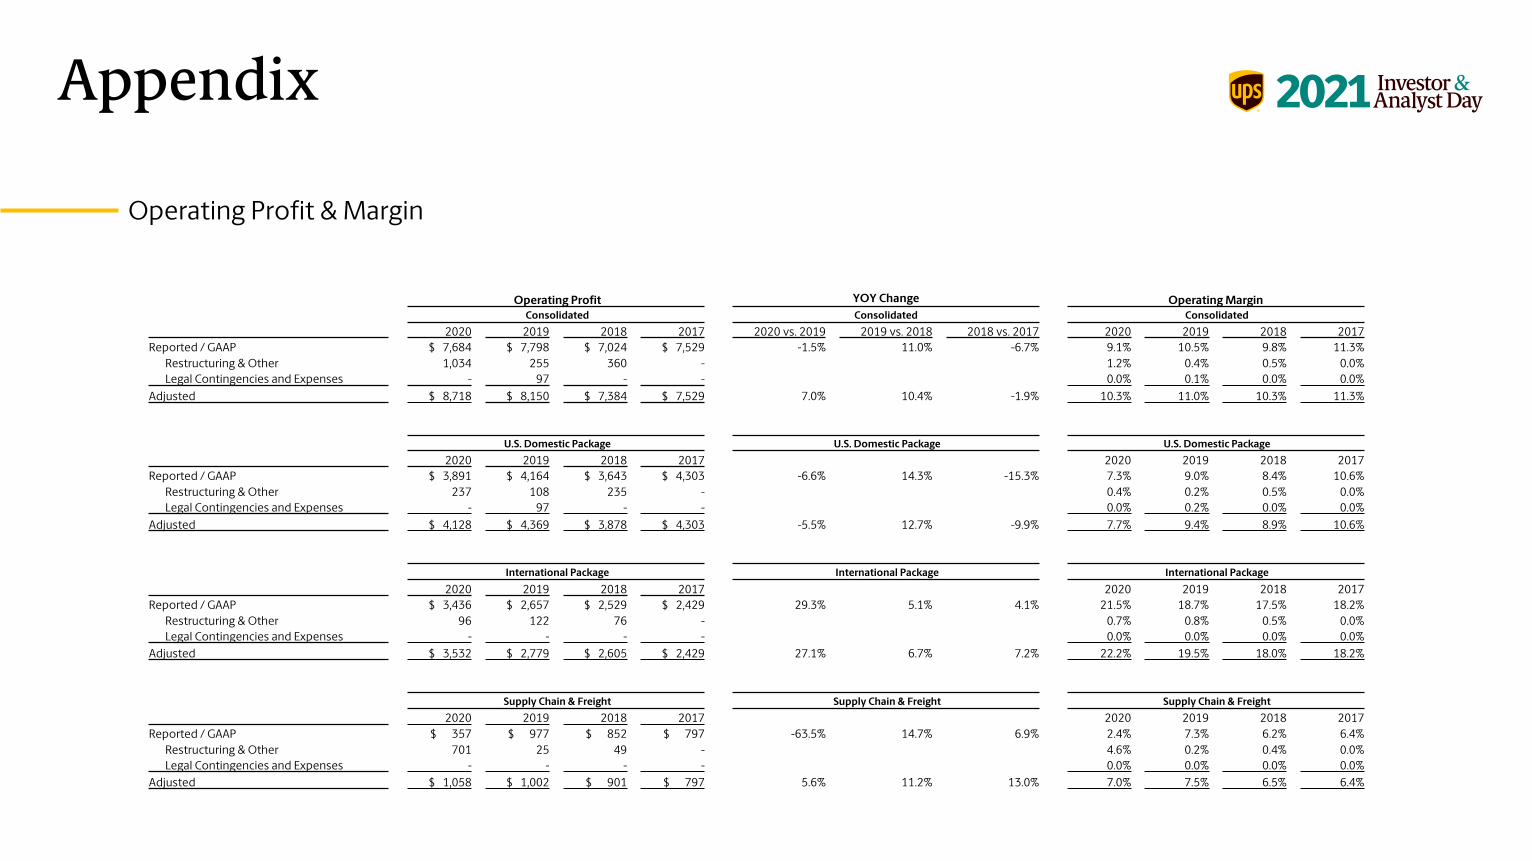
Operating Profit YOY Change Operating MarginConsolidated Consolidated Consolidated
2020 2019 2018 2017 2020 vs. 2019 2019 vs. 2018 2018 vs. 2017 2020 2019 2018 2017Reported / GAAP $ 7,684 $ 7,798 $ 7,024 $ 7,529 -1.5% 11.0% -6.7% 9.1% 10.5% 9.8% 11.3%
Restructuring & Other 1,034 255 360 - 1.2% 0.4% 0.5% 0.0%Legal Contingencies and Expenses - 97 - - 0.0% 0.1% 0.0% 0.0%
Adjusted $ 8,718 $ 8,150 $ 7,384 $ 7,529 7.0% 10.4% -1.9% 10.3% 11.0% 10.3% 11.3%
U.S. Domestic Package U.S. Domestic Package U.S. Domestic Package 2020 2019 2018 2017 2020 2019 2018 2017
Reported / GAAP $ 3,891 $ 4,164 $ 3,643 $ 4,303 -6.6% 14.3% -15.3% 7.3% 9.0% 8.4% 10.6%Restructuring & Other 237 108 235 - 0.4% 0.2% 0.5% 0.0%Legal Contingencies and Expenses - 97 - - 0.0% 0.2% 0.0% 0.0%
Adjusted $ 4,128 $ 4,369 $ 3,878 $ 4,303 -5.5% 12.7% -9.9% 7.7% 9.4% 8.9% 10.6%
International Package International Package International Package 2020 2019 2018 2017 2020 2019 2018 2017
Reported / GAAP $ 3,436 $ 2,657 $ 2,529 $ 2,429 29.3% 5.1% 4.1% 21.5% 18.7% 17.5% 18.2%Restructuring & Other 96 122 76 - 0.7% 0.8% 0.5% 0.0%Legal Contingencies and Expenses - - - - 0.0% 0.0% 0.0% 0.0%
Adjusted $ 3,532 $ 2,779 $ 2,605 $ 2,429 27.1% 6.7% 7.2% 22.2% 19.5% 18.0% 18.2%
Supply Chain & Freight Supply Chain & Freight Supply Chain & Freight 2020 2019 2018 2017 2020 2019 2018 2017
Reported / GAAP $ 357 $ 977 $ 852 $ 797 -63.5% 14.7% 6.9% 2.4% 7.3% 6.2% 6.4%Restructuring & Other 701 25 49 - 4.6% 0.2% 0.4% 0.0%Legal Contingencies and Expenses - - - - 0.0% 0.0% 0.0% 0.0%
Adjusted $ 1,058 $ 1,002 $ 901 $ 797 5.6% 11.2% 13.0% 7.0% 7.5% 6.5% 6.4%
Appendix
Operating Profit & Margin
Appendix
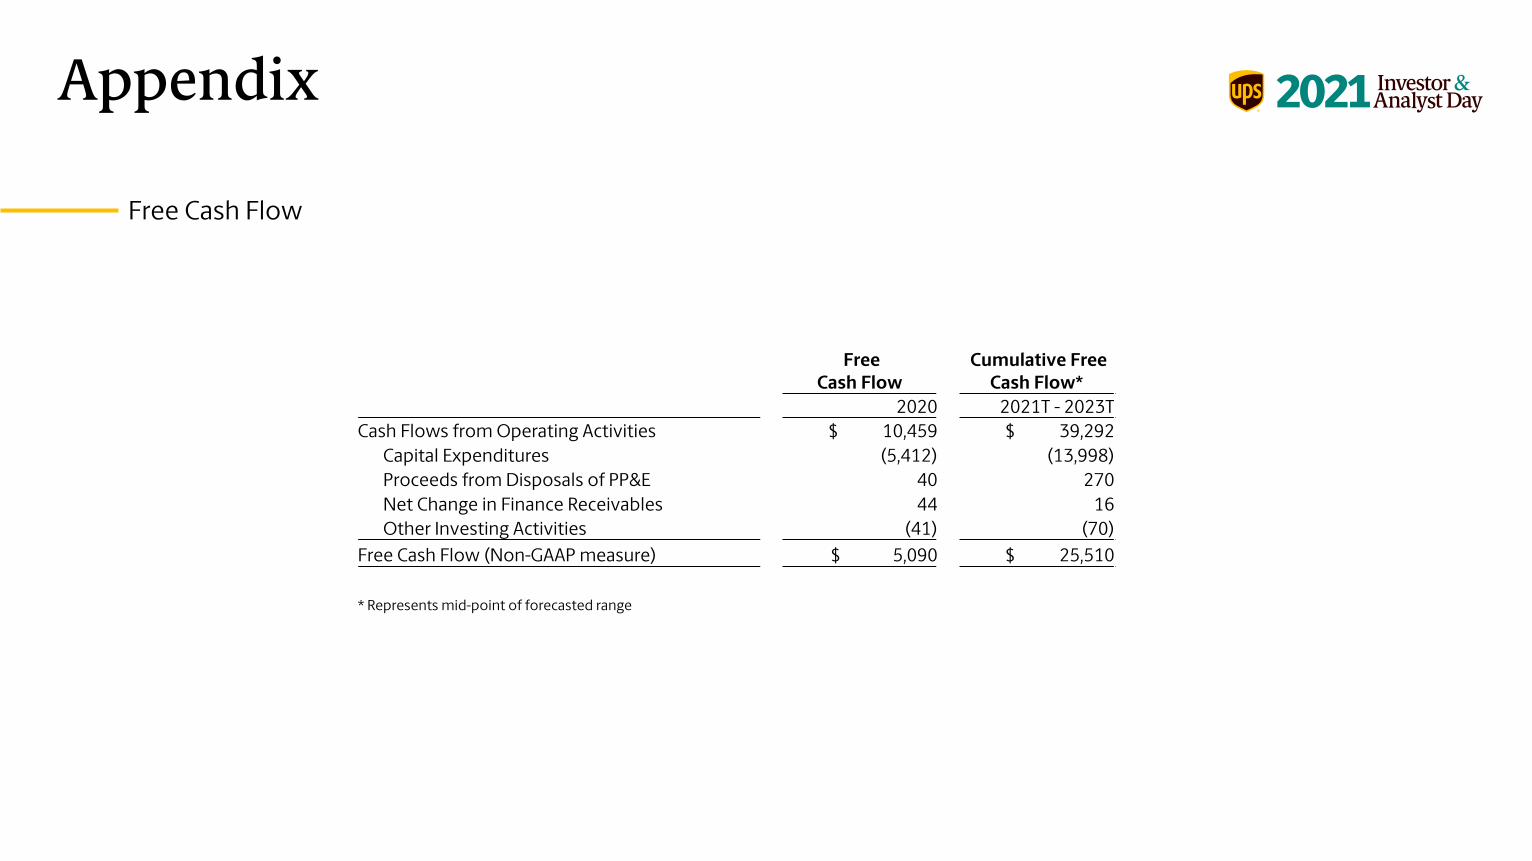
Free Cash Flow
Free Cash Flow
Cumulative Free Cash Flow*
2020 2021T - 2023TCash Flows from Operating Activities $ 10,459 $ 39,292
Capital Expenditures (5,412) (13,998)Proceeds from Disposals of PP&E 40 270 Net Change in Finance Receivables 44 16 Other Investing Activities (41) (70)
Free Cash Flow (Non-GAAP measure) $ 5,090 $ 25,510
* Represents mid-point of forecasted range
Appendix
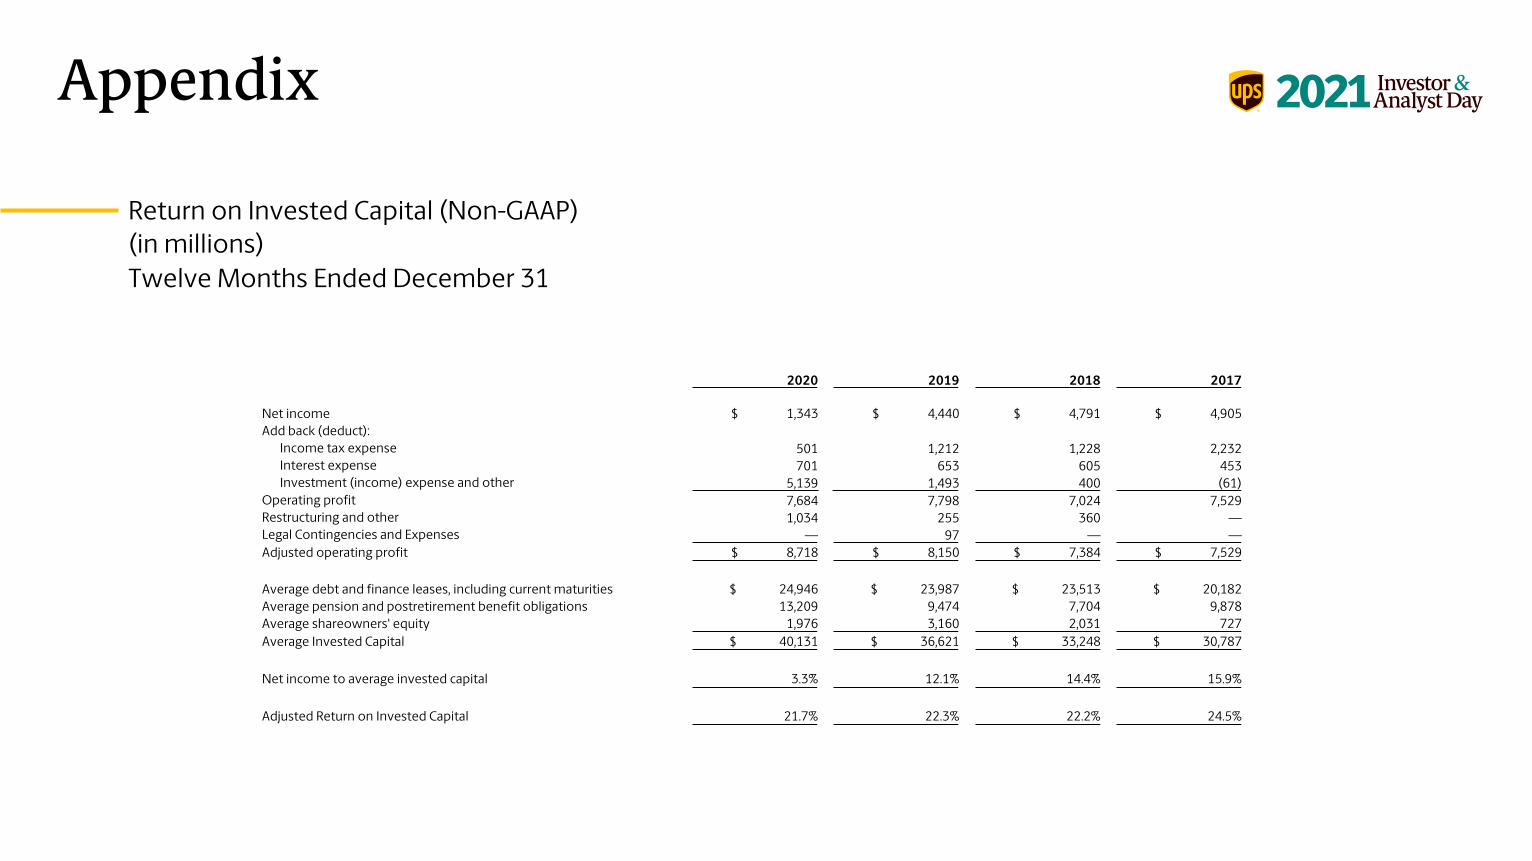
Return on Invested Capital (Non-GAAP)(in millions)Twelve Months Ended December 31
2020 2019 2018 2017
Net income $ 1,343 $ 4,440 $ 4,791 $ 4,905 Add back (deduct):
Income tax expense 501 1,212 1,228 2,232 Interest expense 701 653 605 453 Investment (income) expense and other 5,139 1,493 400 (61)
Operating profit 7,684 7,798 7,024 7,529 Restructuring and other 1,034 255 360 —Legal Contingencies and Expenses — 97 — —Adjusted operating profit $ 8,718 $ 8,150 $ 7,384 $ 7,529
Average debt and finance leases, including current maturities $ 24,946 $ 23,987 $ 23,513 $ 20,182 Average pension and postretirement benefit obligations 13,209 9,474 7,704 9,878 Average shareowners' equity 1,976 3,160 2,031 727 Average Invested Capital $ 40,131 $ 36,621 $ 33,248 $ 30,787
Net income to average invested capital 3.3% 12.1% 14.4% 15.9%
Adjusted Return on Invested Capital 21.7% 22.3% 22.2% 24.5%