Embed Size (px)
Citation preview
IRAN UNDER SANCTIONS
IRAN UNDERSANCTIONS
Impact of Sanctions on Household Welfare and Employment
DJAVAD SALEHI-ISFAHANI
p. 2 IRAN UNDER SANCTIONS
The SAIS Initiative for Research on Contemporary IranJohns Hopkins University Washington, DCCopyright 2020All rights reserved
ABOUT IRAN UNDER SANCTIONSIran’s economy has been under sanctions in one form or another since the 1979 revolution. Yet little systematic knowledge exists on the short- and medium-term impacts of sanctions on the growth patterns of the Iranian economy, the general welfare of its people in the cities and rural areas, societal dynamics, civic space, and the country’s environment. The focus has often been on a few metrics that flare up with tightening of sanctions: currency depreciation, inflation, and recession, which are then followed by increases in unemployment and poverty. But the more comprehensive picture is lost in political cacophony around the policy’s merits. This is the gap that SAIS is filling with its Iran Under Sanctions project, which is a 360-degree in-depth view on the implications of sanctions on Iran. This first-of-its-kind research provides for an instructive case study on the use of sanctions as a tool of statecraft. For any questions or feedback on the project, please reach out to Ali Vaez at [email protected].
ABOUT THE AUTHORDjavad Salehi-Isfahani received his PhD in Economics from Harvard University and taught at the University of Pennsylvania (1977–1984) before joining the faculty at Virginia Tech, where he is currently Professor of Economics. He is a Non-resident Senior Fellow at the Global Economy and Development, the Brookings Institution, and a Research Fellow at the Economic Research Forum (ERF) in Cairo.
He has held visiting positions at the University of Oxford (1991–1992), the Brookings Institution (2007–2008), and Harvard Kennedy School (2009–2010, and 2013, and 2016-2017). He has served on the Board of Trustees of the ERF, the Middle East Economic Association, the Interna-tional Iranian Economic Association, and as Associate Editor of the Middle East Development Journal. His research has been in energy economics, demographic economics, and the eco-nomics of the Middle East. He has coauthored two books, Models of the Oil Market and After the Spring: Economic Transitions in the Arab World, and edited two books, Labor and Human Capital in the Middle East and The Production and Diffusion of Public Choice. His articles have appeared in the Economic Journal, the Journal of Development Economics, Health Economics, Economic Development and Cultural Change, the Journal of Economic Inequality, the Inter-national Journal of Middle East Studies, the Middle East Development Journal, and Iranian Studies, among others.
ACKNOWLEDGMENTThe author wishes to thank Ali Vaez for initiating and managing the project, and for comments Tarek Ghani, Hossein Samiei, two anonymous referees and participants in the webinar on Iran’s Economy Under Sanctions, SAIS, 17 October 2020.
IRAN UNDER SANCTIONSp. 3
Executive Summary
EXECUTIVE SUMMARY
Harsh sanctions against Iran aim to put pressure on the country’s leaders by mak-ing life difficult for its citizens. So far, sanctions have succeeded in creating an economic crisis and hurting the welfare of ordinary Iranians. This paper exam-ines the impact of sanctions since 2010 on household consumption and employment. It finds that while household incomes and consumption have taken a serious beat-ing, employment has been more resilient.
The effect of sanctions on the economy has been twofold, to limit the government’s revenues from oil exports and to cut the country’s trade with the outside world. Reduced export earnings cause devalua-tion, which fuel inflation and hurt house-hold budgets. Lower government revenues cause economic contraction, which hurts both consumption and employment. Tak-ing advantage of survey data on house-hold consumption, this study shows how a rising trend of per capita expenditures turned negative after 2010, and acceler-ated downward after the U.S. withdrawal from the nuclear deal in 2018 and the start of the Trump “maximum pressure” cam-paign.
Employment took a different trajectory as devaluation increased the profitability of
Iran’s non-oil tradable sectors and en-couraged import substitution. In partic-ular, employment in manufacturing con-tinued to grow, and only stopped with the arrival of the Covid pandemic in 2020. However, because the modest increase in employment was the result of lower real wages, rising employment could not slow down the decline in living standards. The increase in employment was modest be-cause sanctions limited the ability of Ira-nian exporters to take advantage of the lower cost of labor to increase their sales abroad. The impact of the economic crisis was not distributed equally, with rural households taking the brunt of the crisis. Since 2010, poverty rates have doubled in rural areas, and increased by 60 per cent in urban ar-eas. The Islamic Republic’s previous good record of halving the poverty rate in the previous decade, from over 20 percent in 2000 to less than 10 percent in 2010, fell victim to the government’s shrinking revenue base and the speed with which Trump’s sanctions and the pandemic hit the economy.
Unlike in 2011, when a newly introduced cash transfer program shielded the poor from the negative consequences of the
IRAN UNDER SANCTIONSp. 4
Executive Summary
tightening of sanctions under President Obama, in the last two years the Islamic Republic’s extensive welfare agencies and its much-weakened cash transfer pro-gram have proved ineffective in prevent-ing a large drop in consumption across the spectrum and thus preventing poverty from increasing. Since 2011, about 8 million individuals have descended from the mid-dle class into the lower middle-class stra-ta, while the ranks of the poor has swelled by more than 4 million. The problem was compounded by the arrival of the Covid pandemic in 2020. In addition to lacking resources to assist those who lost their jobs, the government has not been able to easily reach the majority of Iranian work-ers who hold informal jobs.
IRAN UNDER SANCTIONSp. 5
Inflation Targeting in the Time of Sanctions and Pandemic?
INTRODUCTION
I. HOUSEHOLD WELFAREA. AVERAGE LIVING STANDARDSB. POVERTYC. THE MIDDLE CLASSD. FOOD CONSUMPTION AND LIVING STANDARDSE. THE COVID-19 EFFECTF. SOCIAL ASSISTANCEG. INCOME DISTRIBUTIONH. HEALTH INSURANCEI. DESCENT INTO POVERTY, 2018-2019J. PROBIT ANALYSIS OF FALLING INTO POVERTY
II. EMPLOYMENTA. TRENDS IN EMPLOYMENTB. TRENDS IN REAL WAGESC. THE STRUCTURE OF EMPLOYMENTD. EMPLOYMENT VULNERABILITY AND INFORMALITY
1. PUBLIC VS. PRIVATE2. INFORMALITY
III. CONCLUSION
APPENDICESA. POVERTY RATESB. SPATIALLY ADJUSTED REAL EXPENDITURESC. REAL WAGES
DESCRIPTION OF THE SURVEYSA. HOUSEHOLD EXPENDITURE AND INCOME SURVEYB. LABOR FORCE
TABLE OF CONTENTS06
0909131517191922242626
3030323337
3737
40
42424348
505050
IRAN UNDER SANCTIONSp. 6
Inflation Targeting in the Time of Sanctions and Pandemic?
INTRODUCTION
Sanctions imposed on the trade and fi-nance of a country aim to influence the behavior of that country’s government, but almost always do this indirectly, through pressure that mainly affects the country’s ordinary citizens. Sanctions produce a negative macroeconomic shock that re-duces the economic welfare of some or all sectors of the population. Their proponents believe that popular discontent resulting from loss of welfare puts pressure on the government of the sanctioned country to change its policies in the desired direction. Sanctions thus raise two types of ques-tions. First, how large is their impact on average welfare, and who bears most of that impact: the officials who are formally the target of the sanctions, their support base in society or innocent by-standers? The answer determines how likely sanc-tions are to succeed. Secondly, sanctions raise serious normative concerns, in par-ticular of collective punishment, which has been banned by the Geneva Conventions (Weisbrot and Sachs 2019).1 Measuring the impact of sanctions on the living standards of various social groups is accordingly of interest to those who impose sanctions and those who are concerned with the suffering of innocent people caught in the crossfire of international conflicts.
Iran has been under the harshest sanctions in modern history for several decades. These intensified after May 2018, when President Donald Trump withdrew the U.S. from the Iran nuclear deal ( JCPOA) and began its “maximum pressure” campaign. Iran’s GDP, which stagnated during the first phase of sanctions under President Obama, has since been shrinking. Most re-cently, the Covid pandemic has added to the damage done by sanctions. This paper examines sanctions’ impact on household welfare, as measured by household con-sumption and employment survey data. Its estimates show a much greater impact on average consumption than previous-ly suggested by simulations.2 In addition, survey data make it possible to estimate the degree of setback in different parts of the distribution of consumption.
The analysis that follows describes how the outcomes of interest, consumption, poverty and employment have changed after the imposition of sanctions. It falls short of a causal analysis in which the link between specific sanctions and outcomes are established and other factors that can influence the outcomes are held con-stant. In this sense, the study follows oth-ers on the impact of economic crises on household welfare that do not identify the
IRAN UNDER SANCTIONSp. 7
Introduction
mechanisms involved.3 As with econom-ic crises caused by other large negative macroeconomic shocks, however, there is little doubt that sanctions, by cutting its oil exports and hindering its external trade, have dealt a serious blow to Iran’s econ-omy and the living standards of ordinary Iranians. In the short span between 2016 when sanctions were eased and 2018 when they were reimposed, the economy switched from GDP growth of 13 per cent to minus 6 per cent. It is, therefore, plau-sible to speak of impact without implying precise causal identification, when chang-es in consumption or employment closely follow the economic crisis induced by the imposition of sanctions.
The study discusses changes in consump-tion and employment in separate but closely interconnected sections. For most people, vulnerability in consumption is a direct result of insecure access to employ-ment. Income from work supports more than half of consumption expenditures, more so for the poor. Significantly, sanc-tions may have helped on the employment side, as they appear to have boosted jobs in import-competing sectors. However, because they have cut earnings, as shown in Section III, the overall impact on living standards has been negative.
The study relies heavily for the bulk of its consumption and employment analysis on micro data from two surveys collected by the Statistical Center of Iran. Household
income and expenditure data are reli-ably reported in the Household Expendi-ture and Income Survey (HEIS), collected annually for nearly five decades; its micro level data are available since 1984.
Employment analysis depends heavily on the Labor Force Survey (LFS), collected seasonally and available in micro data since 2005. Reliance on micro-level data is important because trust in Iran’s pub-lished economic statistics is low, especial-ly in the West, where the debate on the impact of sanctions is highly contentious, and pundits cite widely divergent statistics to make their points. For example, com-parisons of living standards before and after the revolution can be very different.4 The proportion of people below the pov-erty line also ranges widely, from 70 per cent to less than ten per cent. In such a contentious atmosphere, statistics derived from micro data from household surveys are essential for arriving at a reliable pic-ture of the economic situation.
The paper also briefly discusses how the Iranian government has responded to the shock by increasing social assistance and letting the currency depreciate as a way of stimulating employment.5
The main conclusion from the analysis of consumption is that, at least in terms of timing, there is evidence that sanctions have reduced the living standards of the average Iranian and increased pover-
IRAN UNDER SANCTIONSp. 8
Introduction
ty. Despite attempts by the government to reach the poor with cash and in-kind transfers, poverty has grown in the last two years, especially in rural areas. During 2011-2012, cash transfers moderated the impact of the Obama sanctions, and pov-erty rates actually declined. But in 2018, under Trump sanctions, cash transfers were not of much help because their real value had declined due to high inflation, allowing poverty rates to increase.
In contrast, the conclusion from the anal-ysis of employment is that sanctions may have actually promoted employment. This is because, in response to the loss of oil exports, the government allowed the cur-rency to depreciate rapidly, which stimu-lated local production of import-compet-ing goods. Employment in general does not fluctuate much in Iran because of la-bor market rigidities. Depreciation likewise lowered the average wage in the country relative to Iran’s trading partners, there-by increasing the competitiveness of local production.
An attempt is also made to cover pandem-ic-related changes in consumption, pover-ty and employment, but consumption data cover only one month of the panedemic. Covid hit Iran much harder than its neigh-bors, however, and published reports indi-cate severe loss of income and jobs. Micro data for the last month of the Iranian year 1398 (19 February-20 March 2020) show a much larger impact of the pandemic rela-tive to the shock dealt by sanctions.
IRAN UNDER SANCTIONSp. 9
Inflation Targeting in the Time of Sanctions and Pandemic?
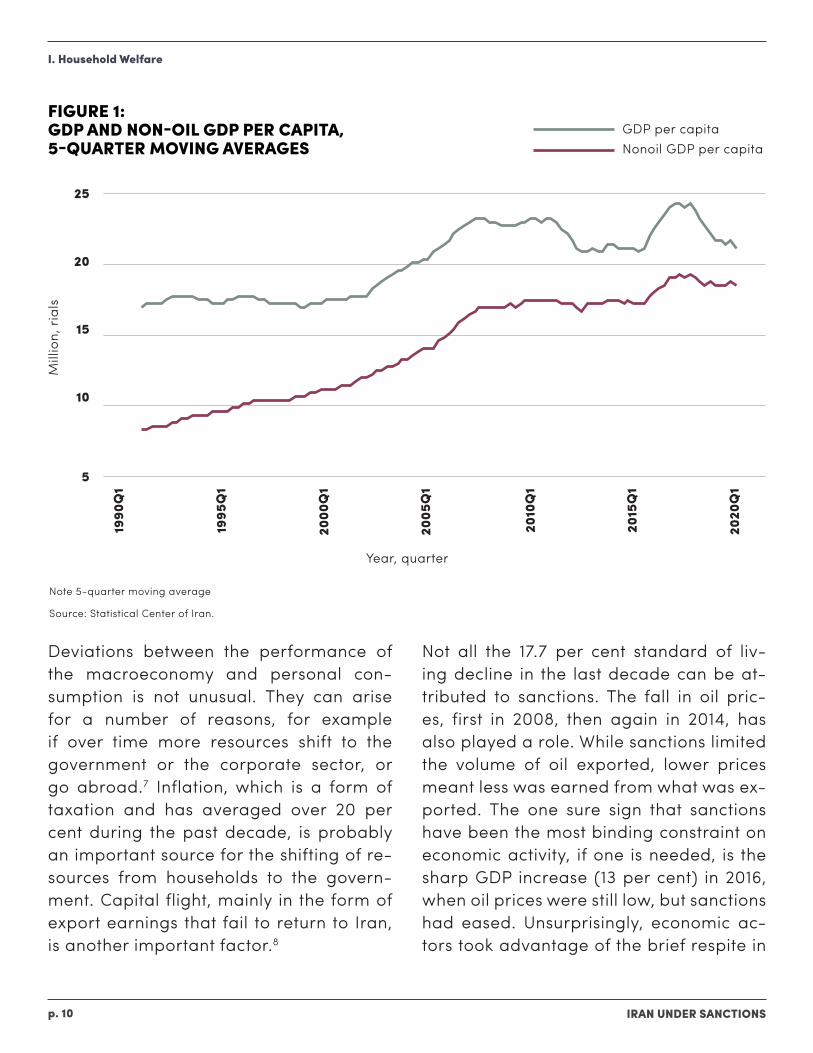
As a large negative shock to the economy, U.S. sanctions have naturally affected the living standards of ordinary Iranians. This is reflected in the most accessible mea-sure of living standards, GDP per capita, as well as in survey-based measures of household consumption. Figures 1 and 2 below show that the rise and fall of GDP per capita and per capita expenditures are closely related. Therefore, the lessons from the national accounts and survey data are similar: a long period of rising living standards came to an end around 2010, when sanctions tightened during the first Obama administration, and the eas-ing of sanction following the 2015 nucle-ar deal led to robust growth in 2016-2017, which eneded quickly once Trump sanc-tions began in 2018.
A noteworthy feature of Iran’s economy revealed by the national accounts is the difference between the trends in GDP and non-oil GDP, which follow the same path as the per capita values depicted in Figure 1. Non-oil GDP, which measures economic activity by 98 per cent of the Iranian work-force and is therefore more closely relat-ed to employment and productivity, con-tinued to grow when GDP began to falter
I. HOUSEHOLD WELFARE
after 2008. The fact that other sectors were able to increase their share of GDP following the loss of oil exports is a less appreciated feature of the economy that has played an important role in its ability to withstand sanctions.6 However, this re-silience at the macro level did not prevent a sharp decline in living standards, ob-served in survey data and shown below, because the increase in employment was in large part made possible by a decline in real wages.
A. AVERAGE LIVING STANDARDS
The national accounts data in Figure 1 show non-oil GDP per capita rising, albe-it very slowly, even as oil income shrank after 2010. Data on personal consumption obtained from expenditure surveys reveal a more dire picture in which the aver-age standard of living fell by 17.7 per cent during 2010-2019. As a result, per capi-ta consumption in 2019 had returned to its level in 2002. The economic crisis had not only deprived Iranians from increas-ing their living standards since 2010; it had erased nearly a decade of previous progress.
IRAN UNDER SANCTIONSp. 10
I. Household Welfare
FIGURE 1: GDP AND NON-OIL GDP PER CAPITA, 5-QUARTER MOVING AVERAGES
Deviations between the performance of the macroeconomy and personal con-sumption is not unusual. They can arise for a number of reasons, for example if over time more resources shift to the government or the corporate sector, or go abroad.7 Inflation, which is a form of taxation and has averaged over 20 per cent during the past decade, is probably an important source for the shifting of re-sources from households to the govern-ment. Capital flight, mainly in the form of export earnings that fail to return to Iran, is another important factor.8
Not all the 17.7 per cent standard of liv-ing decline in the last decade can be at-tributed to sanctions. The fall in oil pric-es, first in 2008, then again in 2014, has also played a role. While sanctions limited the volume of oil exported, lower prices meant less was earned from what was ex-ported. The one sure sign that sanctions have been the most binding constraint on economic activity, if one is needed, is the sharp GDP increase (13 per cent) in 2016, when oil prices were still low, but sanctions had eased. Unsurprisingly, economic ac-tors took advantage of the brief respite in
Source: Statistical Center of Iran.
Note 5-quarter moving average
1990
Q1
1995
Q1
2000
Q1
2005
Q1
2010
Q1
2015
Q1
2020
Q1
5
10
15
20
25
Mill
ion,
ria
ls
Year, quarter
GDP per capitaNonoil GDP per capita
IRAN UNDER SANCTIONSp. 11
sanctions and unused production capacity to expand output.
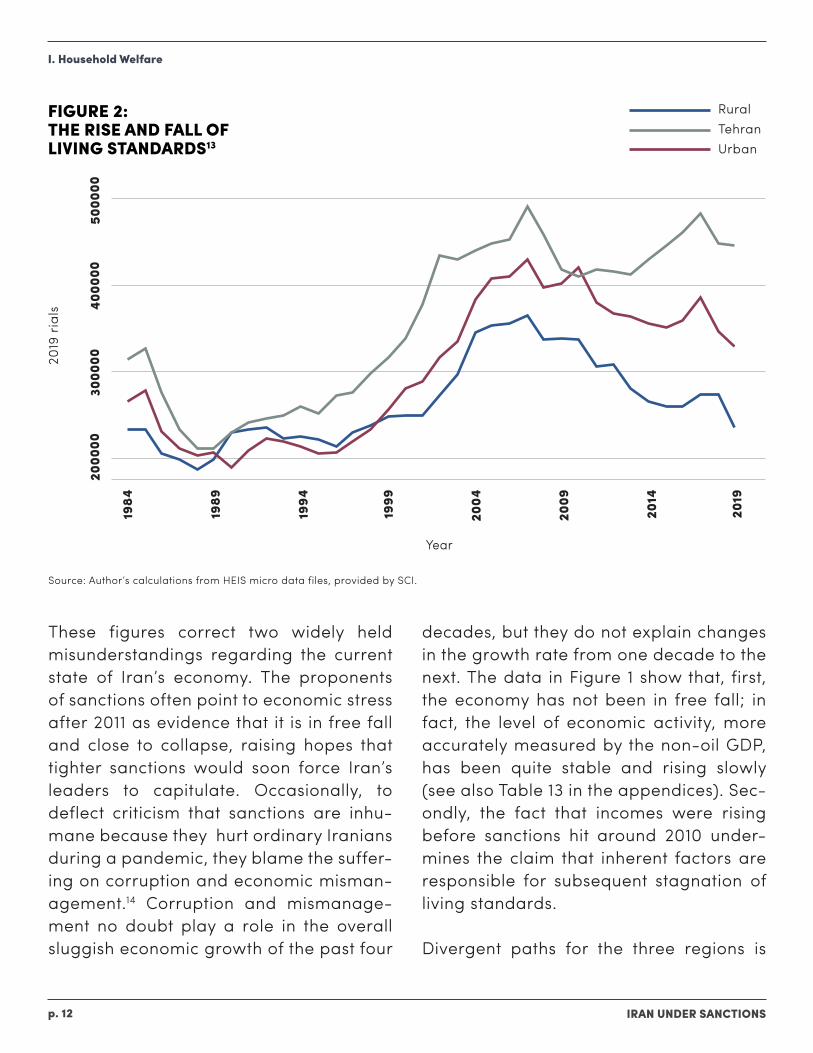
Survey data tell an even more alarm-ing story when we disaggregate average consumption by region. Figure 2 depicts average per capita expenditures for Teh-ran, other urban areas and rural areas deflated by the consumer price index for rural and urban areas, as well as a cost of living index derived from the poverty lines for the rural and urban areas of all prov-inces.9 According to this measure, while all regions benefited from growth before 2010, mainly thanks to rising oil revenues, the contraction was not equally shared. All were hit hard initially with the tempo-rary oil price collapse in 2008, which was quickly followed by sanctions.10 Whereas in Tehran average consumption stayed flat after 2008, in the rest of the county it de-clined significantly (by 30 per cent in rural areas and 11.6 per cent in other urban ar-eas). Surprisingly, Tehran residents on av-erage did better (by 9.1 per cent) in 2019 than in 2010.
The differential impact of economic con-traction on average consumption in Teh-ran and the rest of the country could have a number of reasons. Tehran’s economy is more diversified, enabling residents to adjust more effectively to sanctions and recession. Also, the share of state and white collar jobs, which were better pro-tected during the crisis, is higher. Rural and smaller urban areas have fared least well. They are more distant -- geograph-ically and politically -- from the centers
of power and the public purse, so bene-fit less from government social protection policies. This distance increased with the ascent of the neoliberal administration of President Hassan Rouahni, which replaced the populist government of Mahmoud Ah-madinejad in 2013.
The more pronounced decline in rural consumption is probably due to additional factors. The agrarian economy has been under stress from environmental factors, such as a decade-long drought and falling water tables.11 Higher inflation in rural ar-eas is another potential factor, but expen-ditures have been deflated using separate Consumer Price Indices (CPI’s) for rural and urban areas. Since 2011, when the di-vergence in poverty rates between rural and urban areas emerged, prices have risen by a factor of 3.3 in urban areas and 3.4 in rural areas. Another potential factor is selective migration. Average consump-tion can decline faster in rural areas if the more affluent households leave for the cit-ies. But little evidence exists to support this conjecture. According to the Labor Force Survey, which asks if a worker has recently changed place of residence, on average 0.3 per cent of the rural population moved to cities per year during 2018-2019. This was lower than the 0.5 per cent migra-tion per year averaged during 2010-2012, when rural incomes were boosted by uni-form cash transfers, and poverty actually fell. Furthermore, the more educated (and therefore the more prosperous) have not especially engaged in migration in recent years.12
I. Household Welfare
IRAN UNDER SANCTIONSp. 12
FIGURE 2: THE RISE AND FALL OF LIVING STANDARDS13
These figures correct two widely held misunderstandings regarding the current state of Iran’s economy. The proponents of sanctions often point to economic stress after 2011 as evidence that it is in free fall and close to collapse, raising hopes that tighter sanctions would soon force Iran’s leaders to capitulate. Occasionally, to deflect criticism that sanctions are inhu-mane because they hurt ordinary Iranians during a pandemic, they blame the suffer-ing on corruption and economic misman-agement.14 Corruption and mismanage-ment no doubt play a role in the overall sluggish economic growth of the past four
decades, but they do not explain changes in the growth rate from one decade to the next. The data in Figure 1 show that, first, the economy has not been in free fall; in fact, the level of economic activity, more accurately measured by the non-oil GDP, has been quite stable and rising slowly (see also Table 13 in the appendices). Sec-ondly, the fact that incomes were rising before sanctions hit around 2010 under-mines the claim that inherent factors are responsible for subsequent stagnation of living standards.
Divergent paths for the three regions is
I. Household Welfare
Source: Author’s calculations from HEIS micro data files, provided by SCI.
1984
1989
1994
1999
2004
2009
2014
2019
2000
0030
0000
4000
0050
0000
2019
ria
ls
Year
RuralTehranUrban
IRAN UNDER SANCTIONSp. 13
another lesson derived from this Figure. After the end of the destructive war with Iraq, in 1989, spatially adjusted consump-tion levels were about the same in all three regions. However, by 2007, when average consumption peaked, consumption in Teh-ran was one-third higher than rural and 15 per cent higher than other urban areas. This divergence may be in part due to the changing composition of the Iranian pop-ulation by residence. Each year roughly 0.5 per cent of the rural population be-comes urban, some by moving to urban areas while others by having their village reclassified as urban. In Iran, villages with more than 5000 population can petition the state for reclassification. Although se-lection by income or education does not appear to be strong in migration to ur-ban areas, reclassification is. More pros-perous villages are more likely to expand and become urban. As a result, selection may be responsible for the faster decline in consumption in rural areas over the last decade, though not for a single year, such as 2019.
B. POVERTY
In most developing countries, the poor are more vulnerable to negative external shocks, because they lack the savings to ride out a temporary shortfall in income. They also lack the political power to direct government resources toward their needs. Iran is known as a populist state with strong revolutionary rhetoric in favor of the poor.
Whether it has been better able to shield its poorest citizens from the economic cri-sis induced by sanctions can be answered with fair precision, because Iran regularly collects income and expenditure surveys and, more importantly, releases their re-sults in unit record for use by researchers. These micro data provide a detailed view of the distribution of household welfare since 1984 and during sanctions. While the exact causal link between sanctions and the poverty status of individuals is difficult to establish, the timing of changes in pov-erty are highly suggestive of such a link.
Poverty is usually measured by first locat-ing a nutritionally or socially determined threshold of income or expenditures be-low which people are considered poor. Iran does not publish official poverty lines, as its social protection system is not based on income data, so this paper uses a set of lines based on a methodology proposed and implemented for rural and urban ar-eas at the province level.15 Expenditures per capita are expressed in 2019 prices and adjusted for cost of living differences. A $5.50 poverty line (in Purchasing Pow-er Parity dollars) that the World Bank has proposed for upper middle income coun-tries is used to estimate the percentage of individuals below this threshold.16 The choice of a particular line obviously mat-ters for the estimated poverty level but not for its trend, our main concern. Some may consider $5.50 too low, but a higher lev-el does not alter the observed pattern of change. Figure 3 shows poverty rates for
I. Household Welfare
IRAN UNDER SANCTIONSp. 14
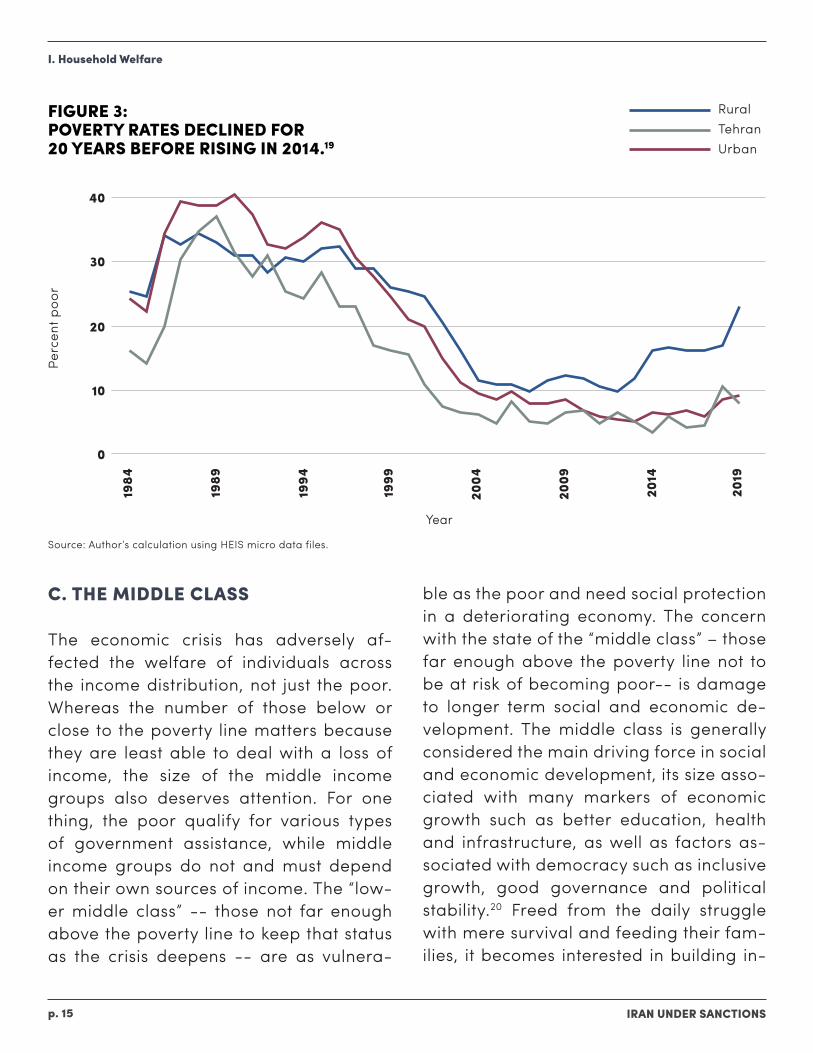
the past three decades (1984-2019) for ur-ban Tehran, other urban and rural areas. Table 12 in the appendices presents the data used to generate the graph. Because adjustment is made for the higher liv-ing cost in Tehran and other urban areas, poverty rates are not necessarily higher in rural areas, where nominal incomes are lower. In fact, until 2000, urban poverty rates were higher than rural. Over time, as the urban population’s proportion has risen, poverty has become more prevalent in cities. In 2019, of ten million individuals identified as poor in these calculations, 4.8 million lived in rural areas, 4.4 million in urban areas and less than 1 million in Teh-ran.
In all three regions, poverty rates follow the rise and fall of the average living stan-dards observed in Figure 2. As expected, poverty is higher and more volatile in rural than urban areas or Tehran. All areas ex-perienced declines in poverty rates during 2000-2007, when oil revenues were high and rising. Poverty stayed relatively sta-ble and low until 2012, when Iran’s curren-cy collapsed under the weight of Obama sanctions, after which they have been ris-ing. The impact of the 2010 cash transfer program the Ahmadinejad government initiated is evident in falling poverty rates during 2011-2012, despite the tighten-ing of sanctions and a stagnating econ-omy.17 After 2012, all poverty rates began to increase, rural poverty the fastest. The deepening economic crisis following the Trump administration’s “maximum pres-
sure” campaign is evident in the sharp-ly rising poverty rates across the country, from 8.1 per cent in 2017 to 12.1 per cent in 2019. The increase of four percentage points means that 3.2 million Iranians fell into poverty in two years.18 In 40 years, poverty rates have risen twice before: in the mid-1980s as a result of the destruc-tion due to the war with Iraq; and in the mid-1990s, when post-war restructuring caused a recession. The most obvious rea-son for the sharper increase in rural pov-erty after 2012 is the economic crisis pre-cipitated by the tightening of sanctions.
As with the consumption decline discussed above, other factors such as drought and government policy may have contributed to the deepening rural poverty. Though sanctions in 2011-2012 were not as severe, since they did not reduce Iran’s oil income as much as in the last two years, the in-troduction of a large cash transfer pro-gram did much to limit rural poverty. The Rouhani government could have done the same despite the tighter budgetary situ-ation; reducing subsidies on energy (and even taxing it) is generally a progressive type of revenue generation. It chose not to replace the subsidies with cash transfers early on since it was ideologically opposed to cash handouts. When it hiked gasoline prices in 2018, it did not offer compensat-ing transfers until violent street protests forced its hand.
I. Household Welfare
IRAN UNDER SANCTIONSp. 15
FIGURE 3: POVERTY RATES DECLINED FOR 20 YEARS BEFORE RISING IN 2014.19
C. THE MIDDLE CLASS
The economic crisis has adversely af-fected the welfare of individuals across the income distribution, not just the poor. Whereas the number of those below or close to the poverty line matters because they are least able to deal with a loss of income, the size of the middle income groups also deserves attention. For one thing, the poor qualify for various types of government assistance, while middle income groups do not and must depend on their own sources of income. The “low-er middle class” -- those not far enough above the poverty line to keep that status as the crisis deepens -- are as vulnera-
ble as the poor and need social protection in a deteriorating economy. The concern with the state of the “middle class” – those far enough above the poverty line not to be at risk of becoming poor-- is damage to longer term social and economic de-velopment. The middle class is generally considered the main driving force in social and economic development, its size asso-ciated with many markers of economic growth such as better education, health and infrastructure, as well as factors as-sociated with democracy such as inclusive growth, good governance and political stability.20 Freed from the daily struggle with mere survival and feeding their fam-ilies, it becomes interested in building in-
I. Household Welfare
RuralTehranUrban
1984
1989
1994
1999
2004
2009
2014
2019
0
10
20
30
40
Perc
ent p
oor
Year
Source: Author’s calculation using HEIS micro data files.
IRAN UNDER SANCTIONSp. 16
stitutions that promote good governance and economic growth rather than support zero-sum policies of redistribution, and believes in greater engagement with the global economy as a means to achieve these goals.21
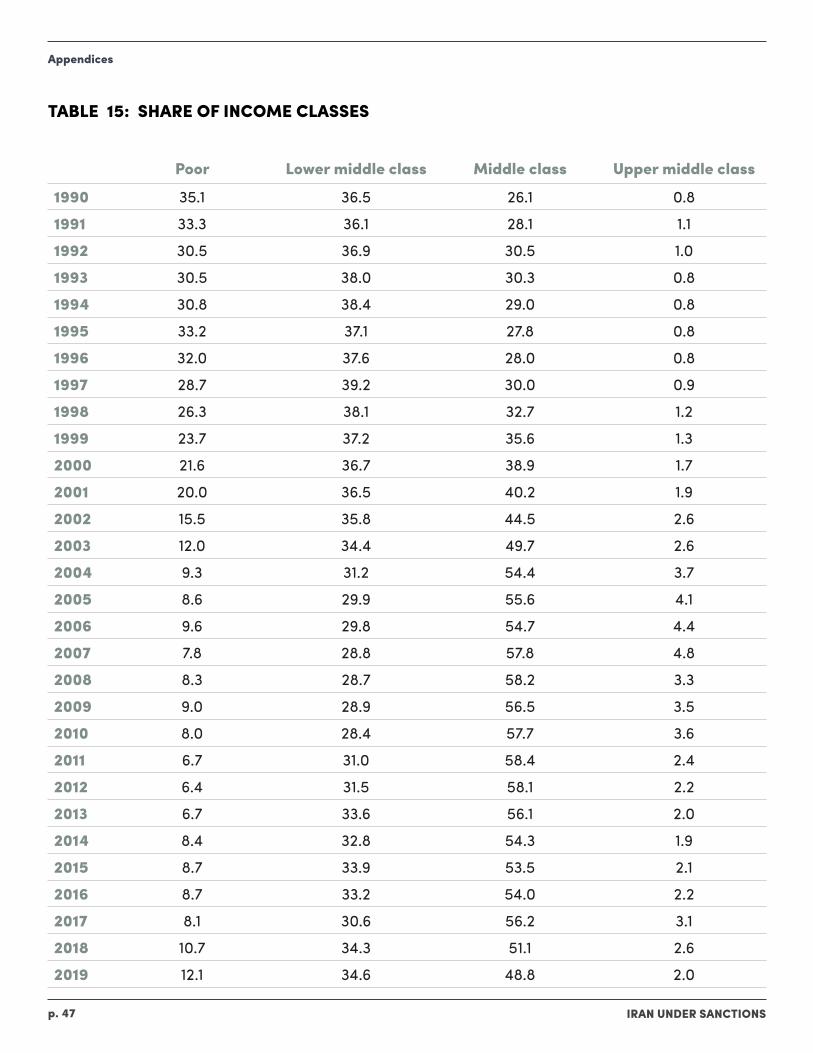
Measuring the size of the middle class, as in the case of the poor, involves defining income or expenditure thresholds. This paper adopts the thresholds commonly used in development economics that de-fine the middle class as those earning (or spending) above twice the poverty line ($11 per person per day in PPP dollars for Iran).22 Other income groups are defined similarly: those between the poverty line and the middle class are labeled the lower middle class; those above $55 (ten times the poverty line) as upper middle class. Since Iran’s truly rich do not appear in the HEIS sample, this highest income group is labeled upper middle class. Per capita ex-penditures are again adjusted by cost of living differences across rural and urban areas in all provinces.
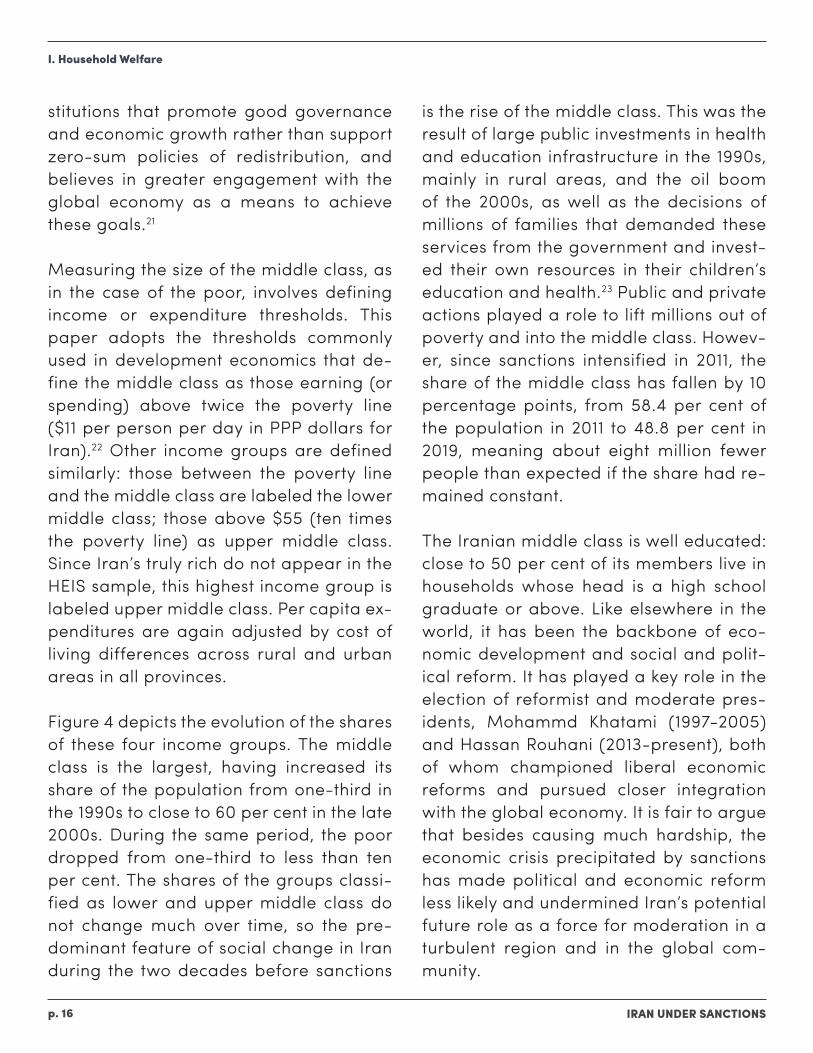
Figure 4 depicts the evolution of the shares of these four income groups. The middle class is the largest, having increased its share of the population from one-third in the 1990s to close to 60 per cent in the late 2000s. During the same period, the poor dropped from one-third to less than ten per cent. The shares of the groups classi-fied as lower and upper middle class do not change much over time, so the pre-dominant feature of social change in Iran during the two decades before sanctions
is the rise of the middle class. This was the result of large public investments in health and education infrastructure in the 1990s, mainly in rural areas, and the oil boom of the 2000s, as well as the decisions of millions of families that demanded these services from the government and invest-ed their own resources in their children’s education and health.23 Public and private actions played a role to lift millions out of poverty and into the middle class. Howev-er, since sanctions intensified in 2011, the share of the middle class has fallen by 10 percentage points, from 58.4 per cent of the population in 2011 to 48.8 per cent in 2019, meaning about eight million fewer people than expected if the share had re-mained constant.
The Iranian middle class is well educated: close to 50 per cent of its members live in households whose head is a high school graduate or above. Like elsewhere in the world, it has been the backbone of eco-nomic development and social and polit-ical reform. It has played a key role in the election of reformist and moderate pres-idents, Mohammd Khatami (1997-2005) and Hassan Rouhani (2013-present), both of whom championed liberal economic reforms and pursued closer integration with the global economy. It is fair to argue that besides causing much hardship, the economic crisis precipitated by sanctions has made political and economic reform less likely and undermined Iran’s potential future role as a force for moderation in a turbulent region and in the global com-munity.
I. Household Welfare
IRAN UNDER SANCTIONSp. 17
FIGURE 4: THE EVOLUTION OF INCOME CLASSES, 2000-2019
D. FOOD CONSUMPTION AND LIVING STANDARDS
Large negative macro shocks raise con-cerns about hunger or decline in the poor-est households’ food and nutritional in-take. Income declines raise the share of food in total consumption until there is no more room for substitution from non-food to food expenditures. As a result, food’s share in total expenditures is a good pre-dictor of poverty status.24
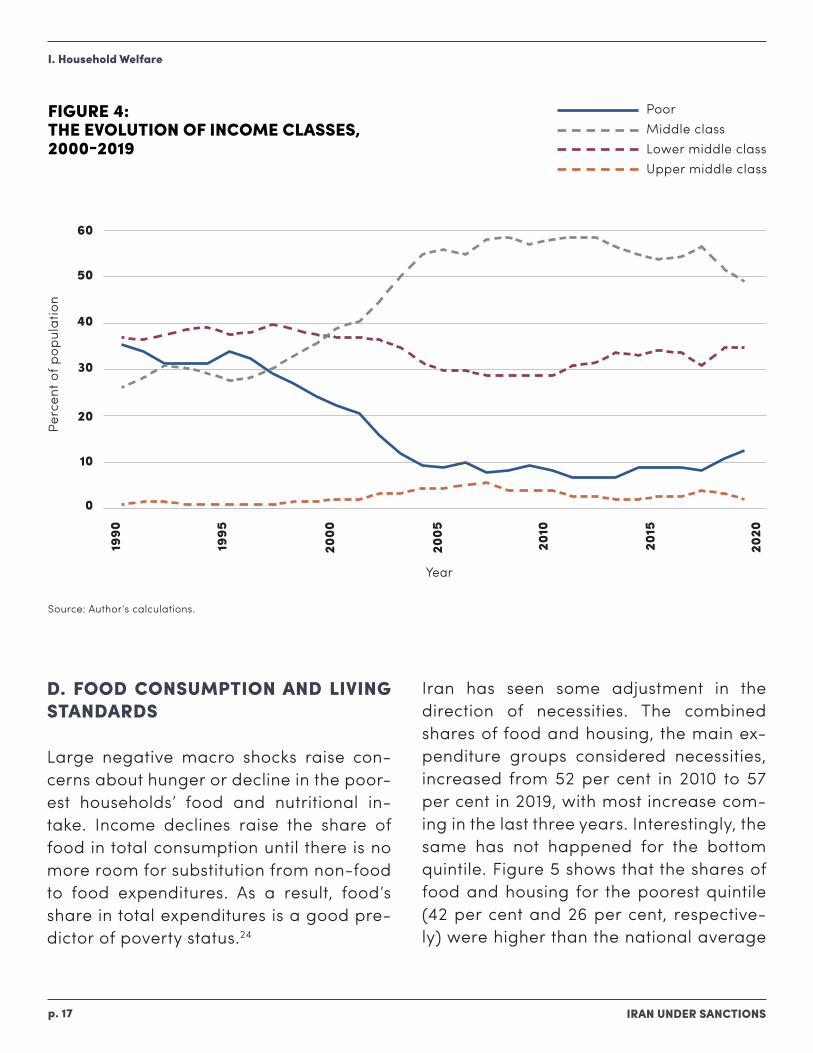
Iran has seen some adjustment in the direction of necessities. The combined shares of food and housing, the main ex-penditure groups considered necessities, increased from 52 per cent in 2010 to 57 per cent in 2019, with most increase com-ing in the last three years. Interestingly, the same has not happened for the bottom quintile. Figure 5 shows that the shares of food and housing for the poorest quintile (42 per cent and 26 per cent, respective-ly) were higher than the national average
I. Household Welfare
PoorMiddle classLower middle classUpper middle class
1990
1995
2000
2005
2010
2015
2020
10
0
20
30
40
50
60
Perc
ent o
f pop
ulat
ion
Year
Source: Author’s calculations.
IRAN UNDER SANCTIONSp. 18
but remained steady. The share of food expenditures alone, which according to the criterion suggested by Pritchett is cor-related with per capita incomes, was lower than for the entire country in 1988 (45 per cent), arguably Iran’s worst economic year and when the war with Iraq ended. For the country as a whole, the share of food was 30 per cent in 2019, which suggests that as bad as conditions are today, food is tak-ing a much smaller bite out of the average family’s budget than three decades ago.
FIGURE 5: SHARE OF FOOD, HOUSING, AND OTHER EXPENDITURES FOR THE LOWEST QUINTILE
I. Household Welfare
FoodHousingOther
Source: Author’s calculations from HEIS data files.
0
20
40
60
80
100
Perc
ent
2010 2011 2012 2013 2014 2015 2016 2017 2018 2019
42 42 41 40 41 4244 4445 46
27 2727 2629 2627 28
25 26
29 29 29 3031 31 31 3132 32
Depite rapid increase in the price of food items, the share of food exepnditures has remained below one-third.
IRAN UNDER SANCTIONSp. 19
E. THE COVID-19 EFFECT
The arrival of the pandemic in February 2020 has hugely exacerbated Iran’s eco-nomic woes. Unlike sanctions, which affect-ed oil revenues first and the wider economy secondly, Covid affected a broad range of industries. Social distancing cut demand for many businesses, closing them down, and shut borders to neighboring countries where most exports headed as business-es sought to evade sanctions on trade and international transfers of money.
Data on Covid’s impact is hard to come by, but the HEIS collected close to a month of expenditures under the pandemic at the end of the Iranian year. Covid’s arriv-al was first announced on 19 February in Qom, from where it spread to other prov-inces. The government resisted imposing quarantine rules, while Nowruz travel took the virus to holiday resorts in Gilan.25 The spread is reflected in the 2019 HEIS, which covers the month of Esfand (19 Febru-ary-20 March 2020). The decline in real per capita expenditures for this month be-tween 2018 and 2019 was much steeper than for the year as a whole (37.6 per cent in rural areas and 31.7 per cent in urban areas compared to 12.5 per cent and 11.4 per cent). Gilan and Qom provinces were much harder hit in March, because the pandemic arrived there from Wuhan, Chi-na first.26 In Gilan, real expenditure in the year’s last month (deflated by that month’s CPI) fell by 27.3 per cent in urban and 39.9
per cent in rural areas, compared to av-erage declines of 12.3 and 9.4 per cent for the year. In the mostly urban province of Qom, urban real expenditures fell by 45.5 per cent while rural expenditure declined by only 2.8 per cent.
F. SOCIAL ASSISTANCE
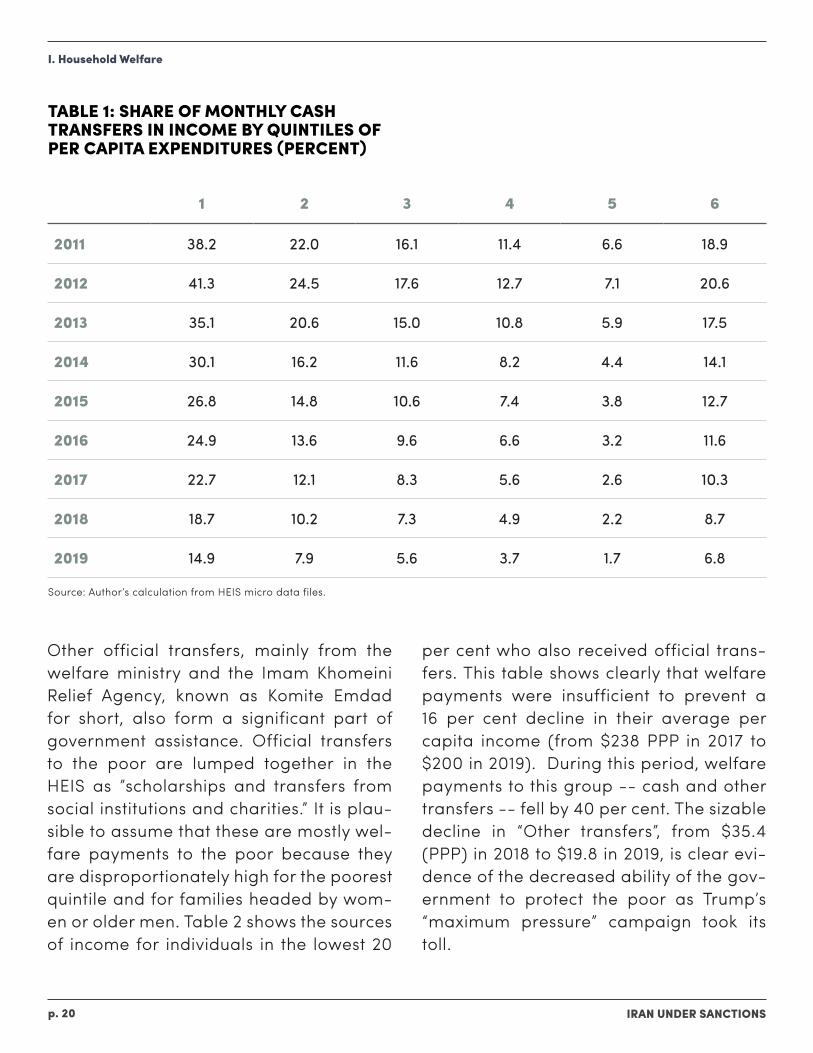
As noted earlier, poverty dropped during the first wave of U.S. sanctions, in 2011-2012, so what explains its increase during the second phase? There is little doubt that during the first wave the introduction of cash transfers under President Mahmoud Ahmadinejad was responsible for the de-cline in poverty.27 That program, known as Targeted Subsidy Reform, aimed to re-place hefty energy subsidies with direct cash payments deposited monthly in ded-icated household accounts. They amount-ed to about 22 per cent of median income in 2011, the first year of these payments, but in 2019 to only 5 per cent.28 The poor ben-efited substantially more from the month-ly transfers, but even for them the bene-fits declined quickly as high inflation cut their real value. Table 1 presents the share of cash transfers for the five quintiles of income over time and shows that for the lowest these transfers amounted to over 40 per cent of income in the early years but gradually declined to 15 per cent.
I. Household Welfare
IRAN UNDER SANCTIONSp. 20
TABLE 1: SHARE OF MONTHLY CASH TRANSFERS IN INCOME BY QUINTILES OF PER CAPITA EXPENDITURES (PERCENT)
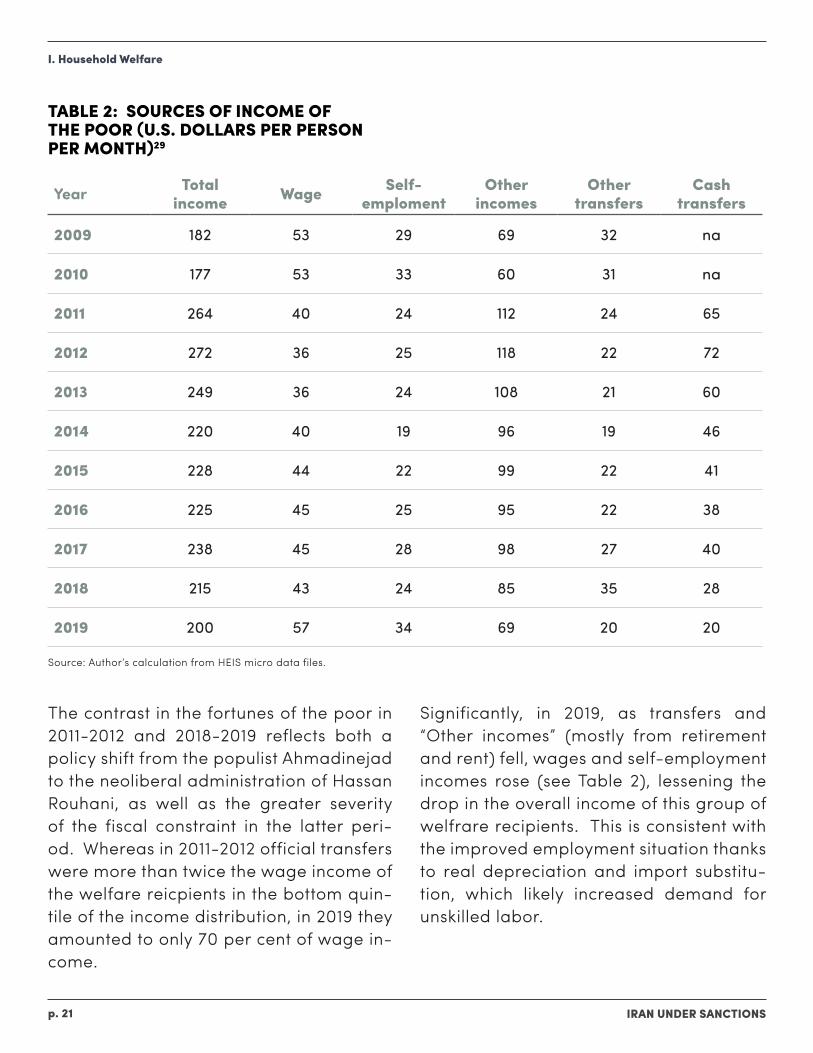
Other official transfers, mainly from the welfare ministry and the Imam Khomeini Relief Agency, known as Komite Emdad for short, also form a significant part of government assistance. Official transfers to the poor are lumped together in the HEIS as ”scholarships and transfers from social institutions and charities.” It is plau-sible to assume that these are mostly wel-fare payments to the poor because they are disproportionately high for the poorest quintile and for families headed by wom-en or older men. Table 2 shows the sources of income for individuals in the lowest 20
per cent who also received official trans-fers. This table shows clearly that welfare payments were insufficient to prevent a 16 per cent decline in their average per capita income (from $238 PPP in 2017 to $200 in 2019). During this period, welfare payments to this group -- cash and other transfers -- fell by 40 per cent. The sizable decline in “Other transfers”, from $35.4 (PPP) in 2018 to $19.8 in 2019, is clear evi-dence of the decreased ability of the gov-ernment to protect the poor as Trump’s “maximum pressure” campaign took its toll.
I. Household Welfare
1 2 3 4 5 6
2011 38.2 22.0 16.1 11.4 6.6 18.9
2012 41.3 24.5 17.6 12.7 7.1 20.6
2013 35.1 20.6 15.0 10.8 5.9 17.5
2014 30.1 16.2 11.6 8.2 4.4 14.1
2015 26.8 14.8 10.6 7.4 3.8 12.7
2016 24.9 13.6 9.6 6.6 3.2 11.6
2017 22.7 12.1 8.3 5.6 2.6 10.3
2018 18.7 10.2 7.3 4.9 2.2 8.7
2019 14.9 7.9 5.6 3.7 1.7 6.8
Source: Author’s calculation from HEIS micro data files.
IRAN UNDER SANCTIONSp. 21
TABLE 2: SOURCES OF INCOME OF THE POOR (U.S. DOLLARS PER PERSON PER MONTH)29
The contrast in the fortunes of the poor in 2011-2012 and 2018-2019 reflects both a policy shift from the populist Ahmadinejad to the neoliberal administration of Hassan Rouhani, as well as the greater severity of the fiscal constraint in the latter peri-od. Whereas in 2011-2012 official transfers were more than twice the wage income of the welfare reicpients in the bottom quin-tile of the income distribution, in 2019 they amounted to only 70 per cent of wage in-come.
Significantly, in 2019, as transfers and “Other incomes” (mostly from retirement and rent) fell, wages and self-employment incomes rose (see Table 2), lessening the drop in the overall income of this group of welfrare recipients. This is consistent with the improved employment situation thanks to real depreciation and import substitu-tion, which likely increased demand for unskilled labor.
I. Household Welfare
Year Total income Wage Self-
emplomentOther
incomesOther
transfersCash
transfers
2009 182 53 29 69 32 na
2010 177 53 33 60 31 na
2011 264 40 24 112 24 65
2012 272 36 25 118 22 72
2013 249 36 24 108 21 60
2014 220 40 19 96 19 46
2015 228 44 22 99 22 41
2016 225 45 25 95 22 38
2017 238 45 28 98 27 40
2018 215 43 24 85 35 28
2019 200 57 34 69 20 20
Source: Author’s calculation from HEIS micro data files.
IRAN UNDER SANCTIONSp. 22
G. INCOME DISTRIBUTION
Sanctions’ impact on income inequali-ty is not as straightforward as on pover-ty. Iran has been generally successful in poverty but not inequality reduction. This is not surprising, because the distribution of human capital and therefore labor in-comes is unequal.30 Furthermore, Iranians receive income that originate from the oil rent, some through transfers and subsi-dies, some through access to government contracts and subsidized credit. The dis-tribution mechanisms are complex, but, at least for the latter two channels, the po-litically connected have an advantage. This was true before the revolution and remains so today.31 Inequality in political access produces inequality in income from the oil rent.
Measurement of inequality is less contro-versial than that of poverty, because no arbitrary choice is made akin to picking a poverty line. However, it is less accu-rate, because survey data are much less reliable for top than for low incomes. This is the well-known issue that afflicts most household surveys.32 In 2019, the highest monthly income HEIS recorded was 68 million tomans (less than $8,000 using the free market exchange rate; about $30,000 using the PPP rate). Many rich Iranians own enough real estate to earn more in rental incomes alone. Lack of informa-tion on under-counting makes inequality discussion highly unreliable, but standard
measures uniformly applied to different countries and over time can be very infor-mative across time and space.
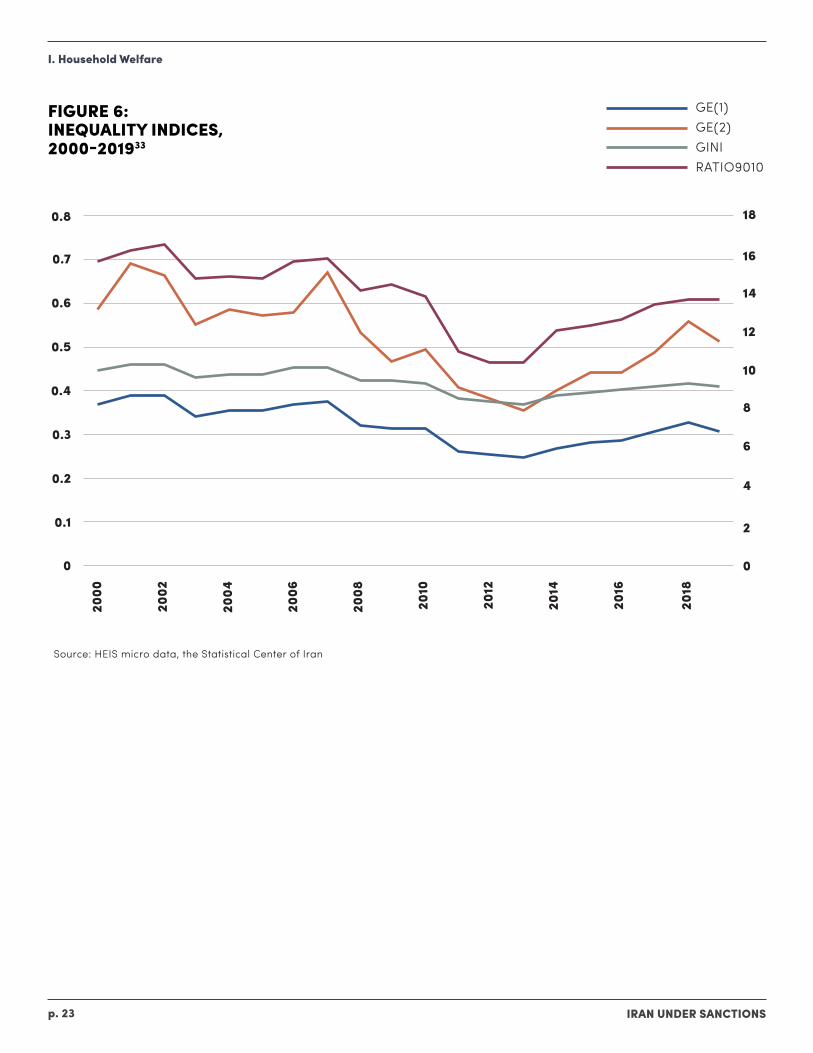
Figure 6 shows the path of four measures of income inequality: the standard Gini in-dex; the ratio of incomes in the top to bot-tom decile; and two Entropy measures, the Theil Index, which behaves close to the Gini, and GE(2), which is more sensitive to changes in top incomes. All show relative-ly high inequality for most years, with Gini in excess of 0.40. They also show rising in-equality since sanctions tightened, though a direct link cannot be established.
I. Household Welfare
IRAN UNDER SANCTIONSp. 23
FIGURE 6: INEQUALITY INDICES, 2000-201933
I. Household Welfare
GE(1)GE(2)GINIRATIO9010
2000
2002
2006
2008
2010
2012
2014
2016
2018
2004
0 0
0.1 2
4
6
8
10
12
14
16
18
0.2
0.3
0.4
0.5
0.6
0.7
0.8
Source: HEIS micro data, the Statistical Center of Iran
IRAN UNDER SANCTIONSp. 24
H. HEALTH INSURANCE
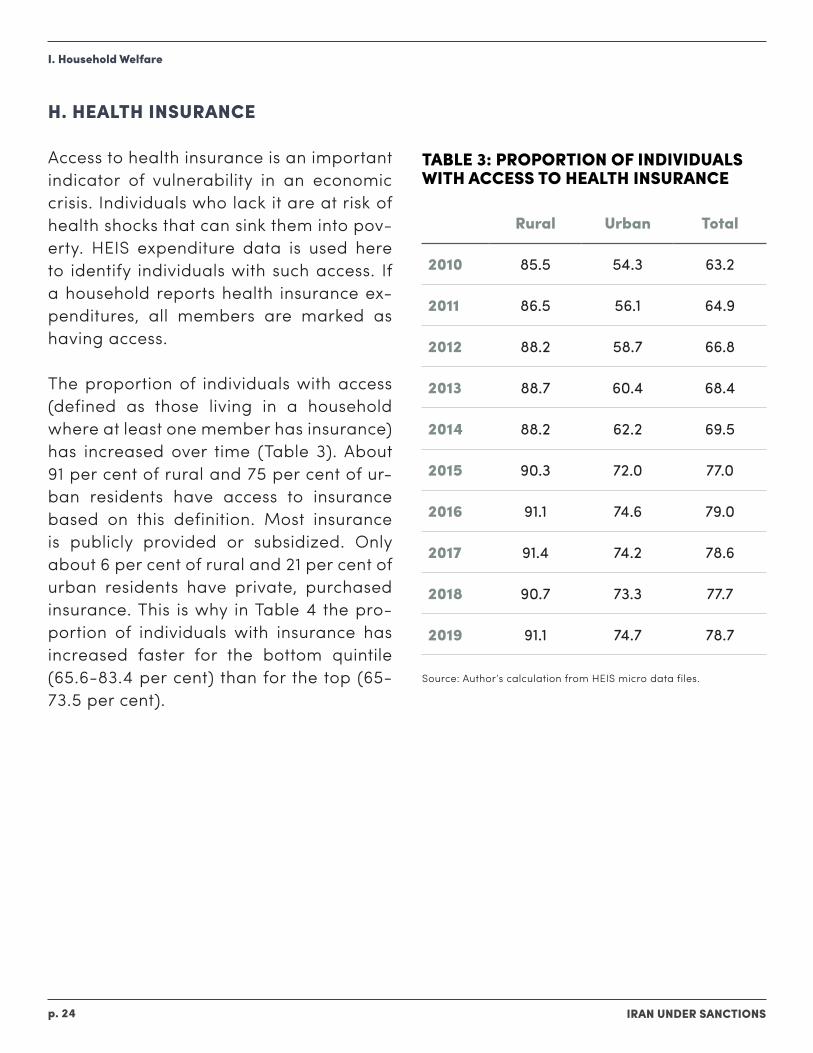
Access to health insurance is an important indicator of vulnerability in an economic crisis. Individuals who lack it are at risk of health shocks that can sink them into pov-erty. HEIS expenditure data is used here to identify individuals with such access. If a household reports health insurance ex-penditures, all members are marked as having access.
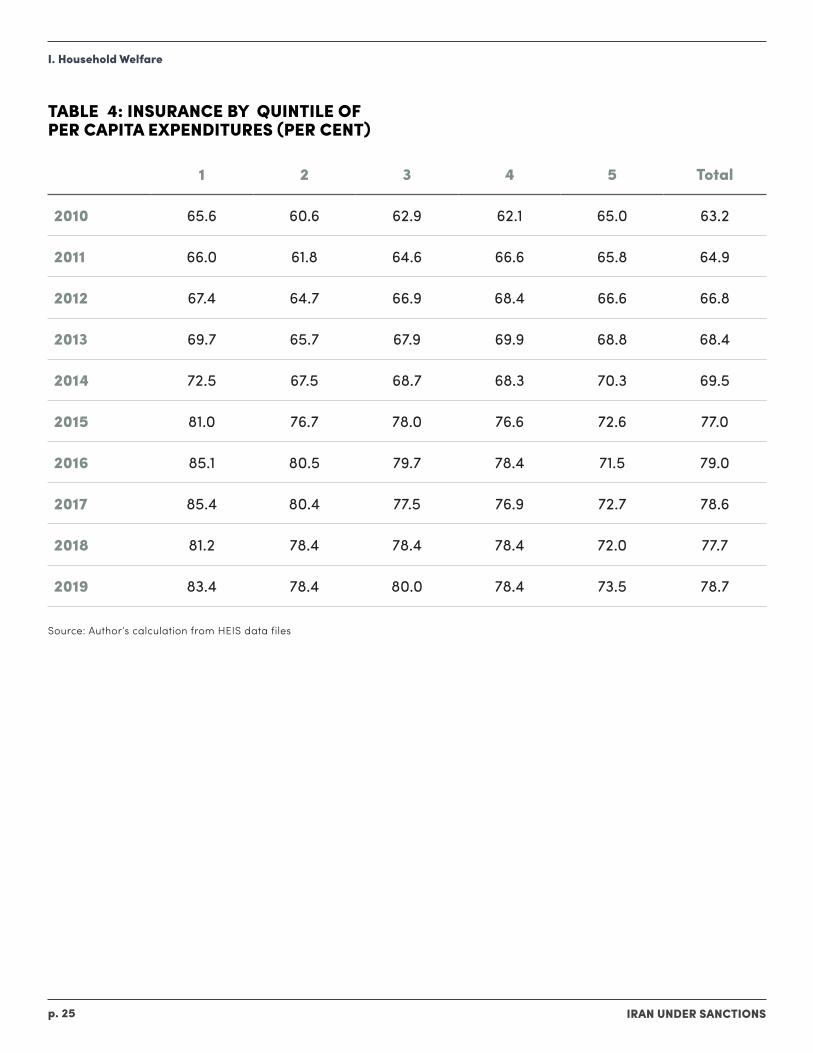
The proportion of individuals with access (defined as those living in a household where at least one member has insurance) has increased over time (Table 3). About 91 per cent of rural and 75 per cent of ur-ban residents have access to insurance based on this definition. Most insurance is publicly provided or subsidized. Only about 6 per cent of rural and 21 per cent of urban residents have private, purchased insurance. This is why in Table 4 the pro-portion of individuals with insurance has increased faster for the bottom quintile (65.6-83.4 per cent) than for the top (65-73.5 per cent).
TABLE 3: PROPORTION OF INDIVIDUALS WITH ACCESS TO HEALTH INSURANCE
I. Household Welfare
Rural Urban Total
2010 85.5 54.3 63.2
2011 86.5 56.1 64.9
2012 88.2 58.7 66.8
2013 88.7 60.4 68.4
2014 88.2 62.2 69.5
2015 90.3 72.0 77.0
2016 91.1 74.6 79.0
2017 91.4 74.2 78.6
2018 90.7 73.3 77.7
2019 91.1 74.7 78.7
Source: Author’s calculation from HEIS micro data files.
IRAN UNDER SANCTIONSp. 25
TABLE 4: INSURANCE BY QUINTILE OF PER CAPITA EXPENDITURES (PER CENT)
I. Household Welfare
Source: Author’s calculation from HEIS data files
1 2 3 4 5 Total
2010 65.6 60.6 62.9 62.1 65.0 63.2
2011 66.0 61.8 64.6 66.6 65.8 64.9
2012 67.4 64.7 66.9 68.4 66.6 66.8
2013 69.7 65.7 67.9 69.9 68.8 68.4
2014 72.5 67.5 68.7 68.3 70.3 69.5
2015 81.0 76.7 78.0 76.6 72.6 77.0
2016 85.1 80.5 79.7 78.4 71.5 79.0
2017 85.4 80.4 77.5 76.9 72.7 78.6
2018 81.2 78.4 78.4 78.4 72.0 77.7
2019 83.4 78.4 80.0 78.4 73.5 78.7
IRAN UNDER SANCTIONSp. 26
I. DESCENT INTO POVERTY, 2018-2019
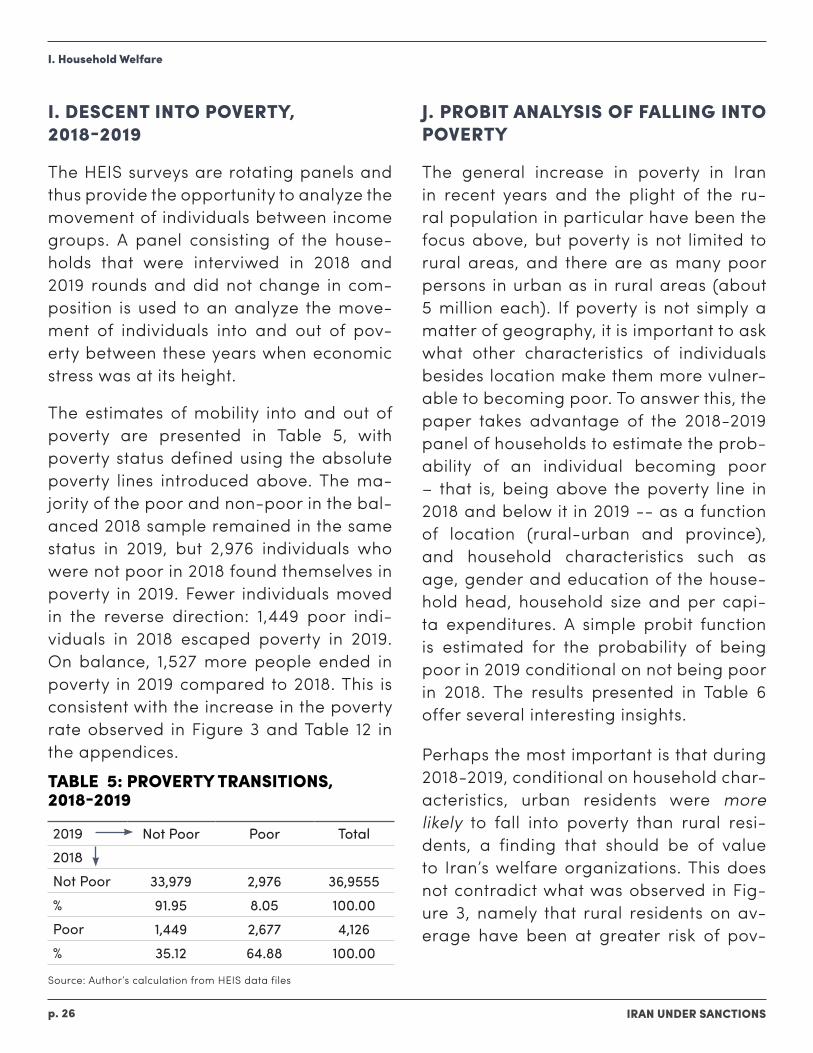
The HEIS surveys are rotating panels and thus provide the opportunity to analyze the movement of individuals between income groups. A panel consisting of the house-holds that were interviwed in 2018 and 2019 rounds and did not change in com-position is used to an analyze the move-ment of individuals into and out of pov-erty between these years when economic stress was at its height.
The estimates of mobility into and out of poverty are presented in Table 5, with poverty status defined using the absolute poverty lines introduced above. The ma-jority of the poor and non-poor in the bal-anced 2018 sample remained in the same status in 2019, but 2,976 individuals who were not poor in 2018 found themselves in poverty in 2019. Fewer individuals moved in the reverse direction: 1,449 poor indi-viduals in 2018 escaped poverty in 2019. On balance, 1,527 more people ended in poverty in 2019 compared to 2018. This is consistent with the increase in the poverty rate observed in Figure 3 and Table 12 in the appendices.
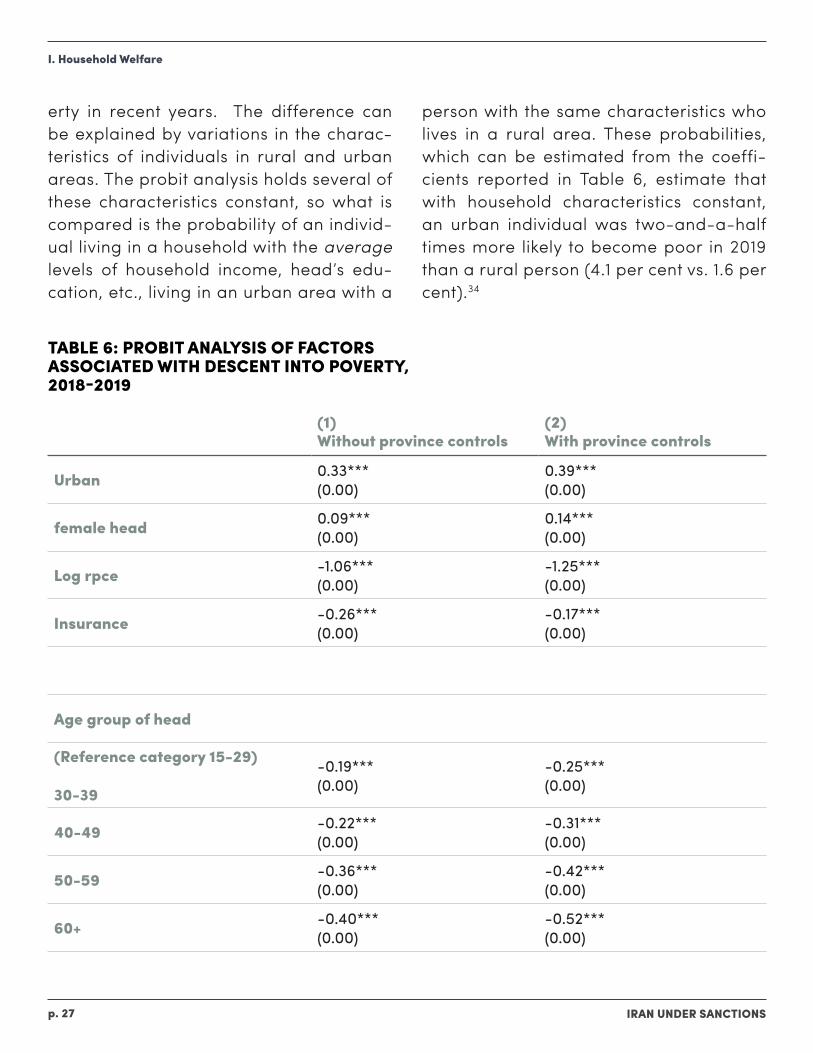
J. PROBIT ANALYSIS OF FALLING INTO POVERTY
The general increase in poverty in Iran in recent years and the plight of the ru-ral population in particular have been the focus above, but poverty is not limited to rural areas, and there are as many poor persons in urban as in rural areas (about 5 million each). If poverty is not simply a matter of geography, it is important to ask what other characteristics of individuals besides location make them more vulner-able to becoming poor. To answer this, the paper takes advantage of the 2018-2019 panel of households to estimate the prob-ability of an individual becoming poor – that is, being above the poverty line in 2018 and below it in 2019 -- as a function of location (rural-urban and province), and household characteristics such as age, gender and education of the house-hold head, household size and per capi-ta expenditures. A simple probit function is estimated for the probability of being poor in 2019 conditional on not being poor in 2018. The results presented in Table 6 offer several interesting insights.
Perhaps the most important is that during 2018-2019, conditional on household char-acteristics, urban residents were more likely to fall into poverty than rural resi-dents, a finding that should be of value to Iran’s welfare organizations. This does not contradict what was observed in Fig-ure 3, namely that rural residents on av-erage have been at greater risk of pov-
TABLE 5: PROVERTY TRANSITIONS, 2018-2019
I. Household Welfare
Source: Author’s calculation from HEIS data files
2019 Not Poor Poor Total
2018Not Poor 33,979 2,976 36,9555
% 91.95 8.05 100.00
Poor 1,449 2,677 4,126
% 35.12 64.88 100.00
IRAN UNDER SANCTIONSp. 27
erty in recent years. The difference can be explained by variations in the charac-teristics of individuals in rural and urban areas. The probit analysis holds several of these characteristics constant, so what is compared is the probability of an individ-ual living in a household with the average levels of household income, head’s edu-cation, etc., living in an urban area with a
person with the same characteristics who lives in a rural area. These probabilities, which can be estimated from the coeffi-cients reported in Table 6, estimate that with household characteristics constant, an urban individual was two-and-a-half times more likely to become poor in 2019 than a rural person (4.1 per cent vs. 1.6 per cent).34
TABLE 6: PROBIT ANALYSIS OF FACTORS ASSOCIATED WITH DESCENT INTO POVERTY, 2018-2019
I. Household Welfare
(1)Without province controls
(2)With province controls
Urban 0.33***(0.00)
0.39***(0.00)
female head 0.09***(0.00)
0.14***(0.00)
Log rpce -1.06***(0.00)
-1.25***(0.00)
Insurance -0.26***(0.00)
-0.17***(0.00)
Age group of head
(Reference category 15-29) 30-39
-0.19***(0.00)
-0.25***(0.00)
40-49 -0.22***(0.00)
-0.31***(0.00)
50-59 -0.36***(0.00)
-0.42***(0.00)
60+ -0.40***(0.00)
-0.52***(0.00)
IRAN UNDER SANCTIONSp. 28
I. Household Welfare
Education of head
(Reference category illiterate)Primary
-0.28***(0.00)
-0.34***(0.00)
Lower sec. -0.60***(0.00)
-0.73***(0.00)
Upper sec. -0.46***(0.00)
-0.50***(0.00)
University -0.88***(0.00)
-0.90***(0.00)
Household size
(Reference category 1-2)3
0.26*** (0.00)
0.27*** (0.00)
4 0.63*** (0.00)
0.70***(0.00)
7+ 0.89***(0.00)
1.05***(0.00)
Pseudo R2 0.185 0.243
Observations 35,184 35,184
Standard errors in parentheses.* p < 0.10, ** p < 0.05, *** p < 0.01
IRAN UNDER SANCTIONSp. 29
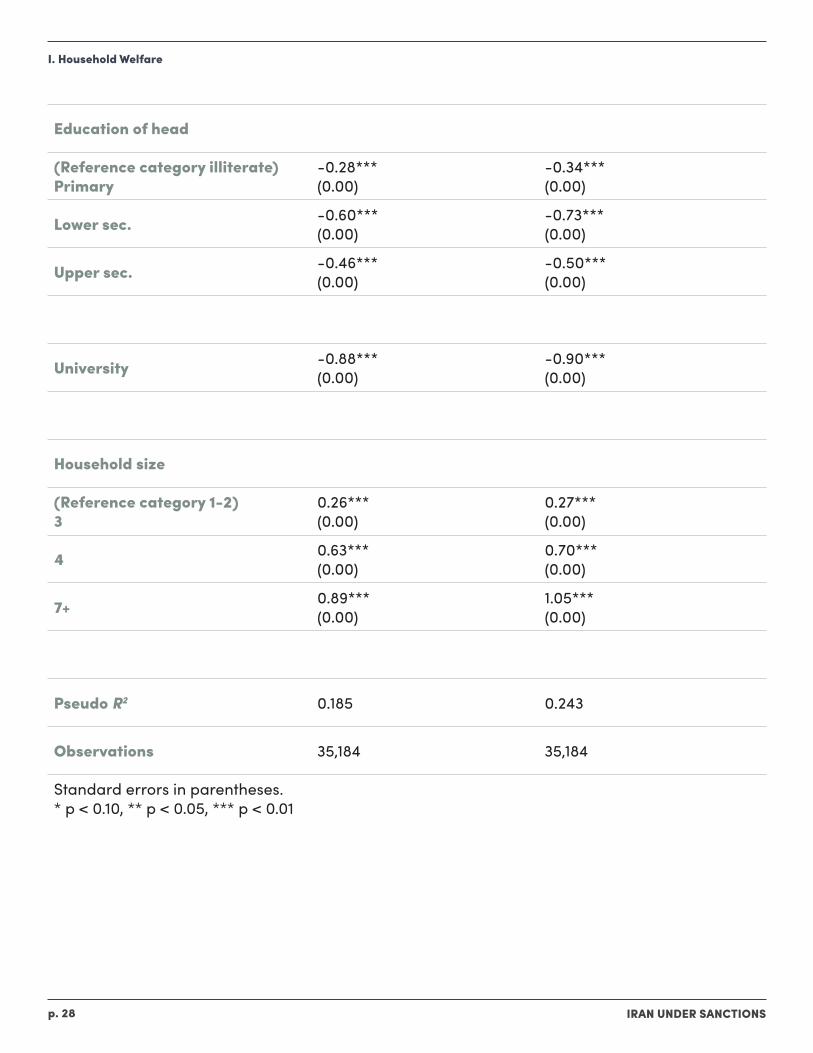
Living in a family headed by a woman in-creases the risk of falling into poverty by 37 per cent (in 2019, about 8 per cent of indi-viduals lived in such households). Predict-ably, health insurance reduces that risk by 35 per cent. Also predictably, education is an important determinant. Those living in households whose heads have more than a high school diploma face a risk of less than 0.1 per cent, compared to 7.2 per cent for those in families whose head is illiter-ate (about 15 per cent of individuals lived in such households). Those living in larger households are at greater risk of becom-ing poor, but risk decreases with the age of the household head. Living in households headed by older individuals decreases the likelihood of becoming poor. The oldest group (60+) has the lowest likelihood (2.3 per cent) compared to the youngest (15-29) age group (12 per cent).
The coefficients of province dummies in-dicate that the effects of location on the likelihood of falling into poverty extend beyond the rural/urban division.35 For ex-ample, all else equal, a resident of Tehran, the most advantaged province, is three times more likely to fall into poverty than a similar person in Sistan, the least advan-taged province. This could be because, un-like in Tehran, in Sistan the characteristics that make a person poor are the same as those that determine descent into poverty. This means that the non-poor in Sistan are at a lower risk of becoming poor than the non-poor in Tehran. The lesson is that, de-
spite the much lower poverty rate in more affluent areas such as Tehran, their resi-dents are at a greater risk of falling into poverty. Simply put, location of residence is not a good predictor of vulnerability to the economic crisis.
I. Household Welfare
IRAN UNDER SANCTIONSp. 30
Inflation Targeting in the Time of Sanctions and Pandemic?
Despite the significance of cash transfers, for most Iranians employment is still the main source of income. In 2019, the share of earnings from wage and salary work and self-employment accounted for 53.3 per cent of rural and 47 per cent of urban household incomes. The main sources of unearned income are retirement pay, cash transfers of various kinds and rent. Income from wage employment is more import-ant than self-employment, accounting for 63 per cent of all earnings. This suggests that any decrease in employment or wag-es would have a strong negative effect on average household incomes. Thus, to bet-ter understand how the negative shock of sanctions is transmitted to household bud-gets, it is important to understand what has happened to employment. The review of trends below suggests employment has been relatively stable compared to in-comes and consumption.
A. TRENDS IN EMPLOYMENT
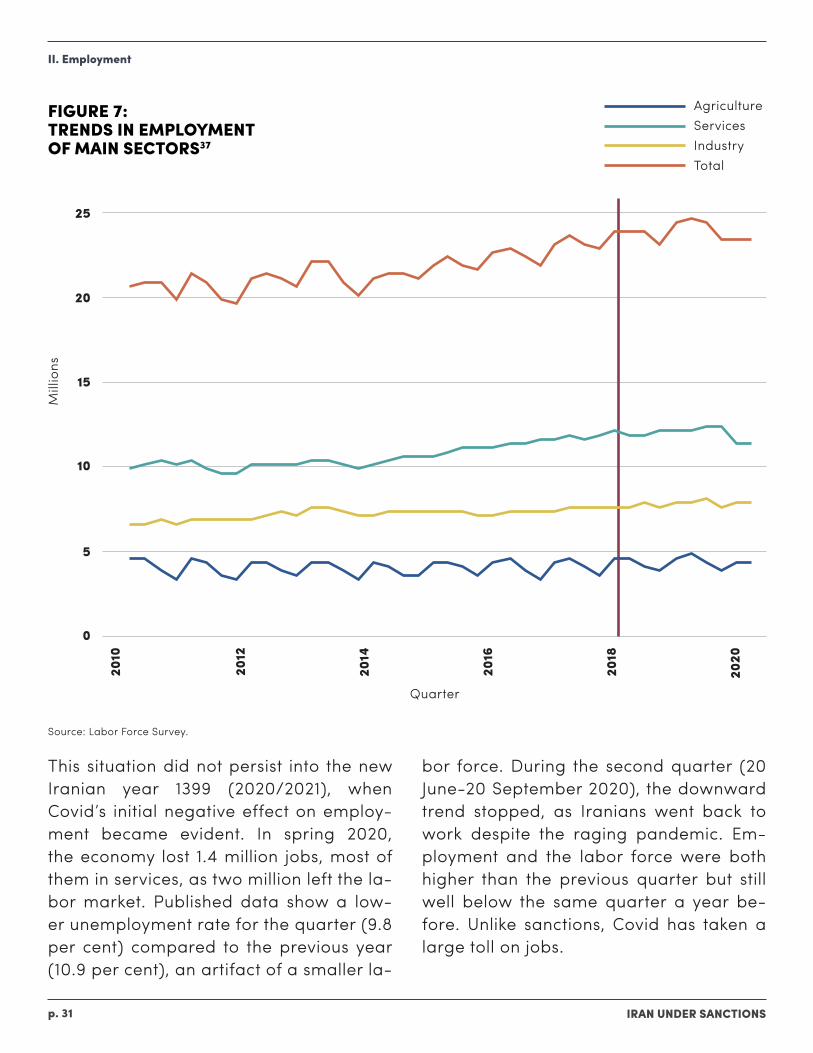
During 2010-2019, as sanctions intensified, GDP and average household incomes stagnated, but employment continued to grow, albeit very slowly. It was high-er in all sectors in 2018 than in 2011, when sanctions first tightened. Figure 7 depicts
II. EMPLOYMENT
quarterly data published by Iran’s Statis-tical Center that show the total number employed grew from about 20 million in 2011 to 27 million in 2019, a 2.1 per cent an-nual increase.36 This exceeded the 1.1 per cent growth rate of the prime age (20-54) population during 2011-2016. Much of the increase was in services, which grew by 2.7 per cent, followed by industry and ag-riculture, both 1.5 per cent. The increase in the number employed in industry, the sec-tor most exposed to trade sanctions, es-pecially after 2018, indicates the positive effect of real depreciation of the national currency on local production. But the em-ployment increase did not overturn the decline in wages in real terms, which is why poverty has risen despite higher em-ployment.
Employment increased in response to sanctions, but the pandemic hit it hard.
IRAN UNDER SANCTIONSp. 31
II. Employment
FIGURE 7: TRENDS IN EMPLOYMENT OF MAIN SECTORS37
This situation did not persist into the new Iranian year 1399 (2020/2021), when Covid’s initial negative effect on employ-ment became evident. In spring 2020, the economy lost 1.4 million jobs, most of them in services, as two million left the la-bor market. Published data show a low-er unemployment rate for the quarter (9.8 per cent) compared to the previous year (10.9 per cent), an artifact of a smaller la-
bor force. During the second quarter (20 June-20 September 2020), the downward trend stopped, as Iranians went back to work despite the raging pandemic. Em-ployment and the labor force were both higher than the previous quarter but still well below the same quarter a year be-fore. Unlike sanctions, Covid has taken a large toll on jobs.
AgricultureServicesIndustryTotal
2010
2012
2014
2016
2018
2020
25
20
15
10
5
0
Mill
ions
Quarter
Source: Labor Force Survey.
IRAN UNDER SANCTIONSp. 32
B. TRENDS IN REAL WAGES
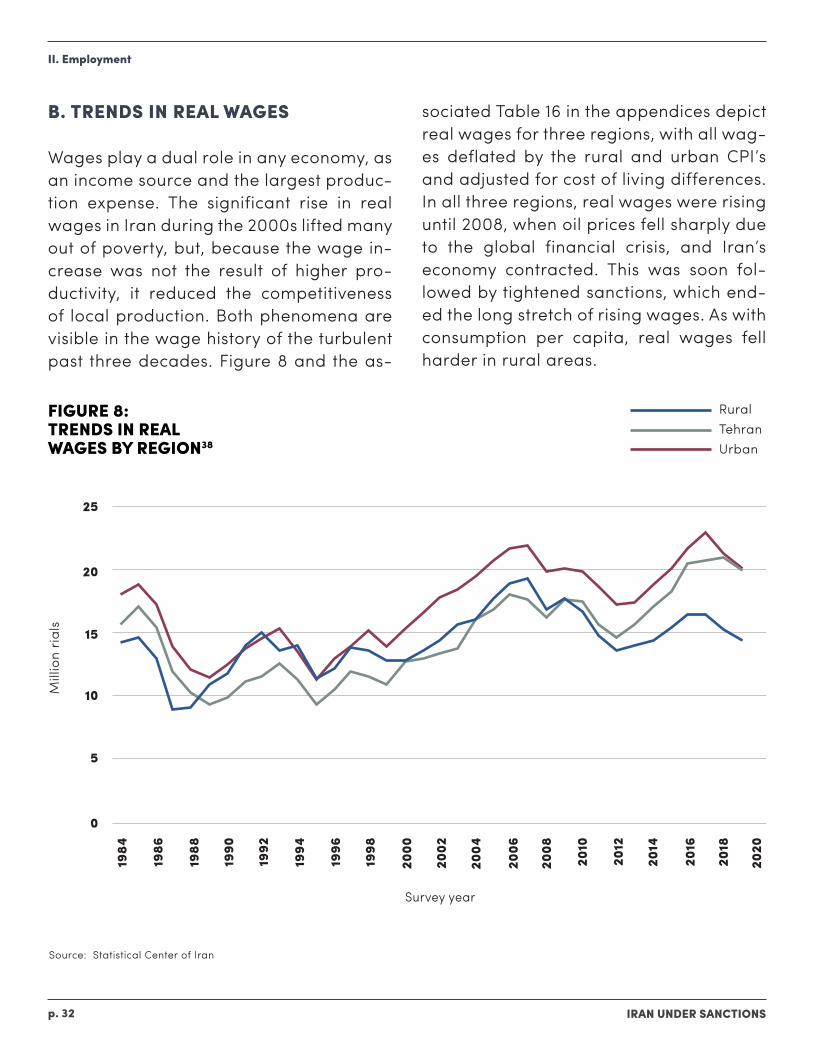
Wages play a dual role in any economy, as an income source and the largest produc-tion expense. The significant rise in real wages in Iran during the 2000s lifted many out of poverty, but, because the wage in-crease was not the result of higher pro-ductivity, it reduced the competitiveness of local production. Both phenomena are visible in the wage history of the turbulent past three decades. Figure 8 and the as-
sociated Table 16 in the appendices depict real wages for three regions, with all wag-es deflated by the rural and urban CPI’s and adjusted for cost of living differences. In all three regions, real wages were rising until 2008, when oil prices fell sharply due to the global financial crisis, and Iran’s economy contracted. This was soon fol-lowed by tightened sanctions, which end-ed the long stretch of rising wages. As with consumption per capita, real wages fell harder in rural areas.
FIGURE 8: TRENDS IN REAL WAGES BY REGION38
II. Employment
RuralTehranUrban
1984
1986
1988
1990
1992
1994
1996
1998
2000
2002
2004
2006
2008
2010
2012
2014
2016
2018
2020
0
5
10
15
20
25
Mill
ion
rials
Survey year
Source: Statistical Center of Iran
IRAN UNDER SANCTIONSp. 33
Wages also rose in terms of U.S. dollars, indicating goods and services produced in Iran were becoming less competitive. This was a direct result of the oil boom, which raised wages and other types of incomes without necessarily increasing worker productivity. Between 2000 and 2010, the average nominal wage rose more than four times faster than the unofficial ex-change rate, making Iranian goods more expensive relative to foreign goods. When Trump’s “maximum pressure” caused col-lapse of the rial in 2018, wages measured in dollars fell precipitously. In 2019, in dol-lar terms, the average wage was less than half its 2017 value. More than any other factor, this decline in the dollar value of wages was responsible for the modest in-crease in employment noted above.
A final question for wages is whether the government used its power to set the min-imum wage to protect real wages of the least advantaged workers. There are two limitations to the minimum wage as a tool to affect the incomes of the poor. First, min-imum wage laws are very hard to enforce. In 2019, 48 per cent of workers reported monthly wages below the minimum. Sec-ondly, raising the minimum wage can re-duce demand for labor. Despite these caveats, every year the government, with wide media coverage and following ne-gotiations with the parliament, announces the minimum wage for the year using the previous year’s inflation as a guide.
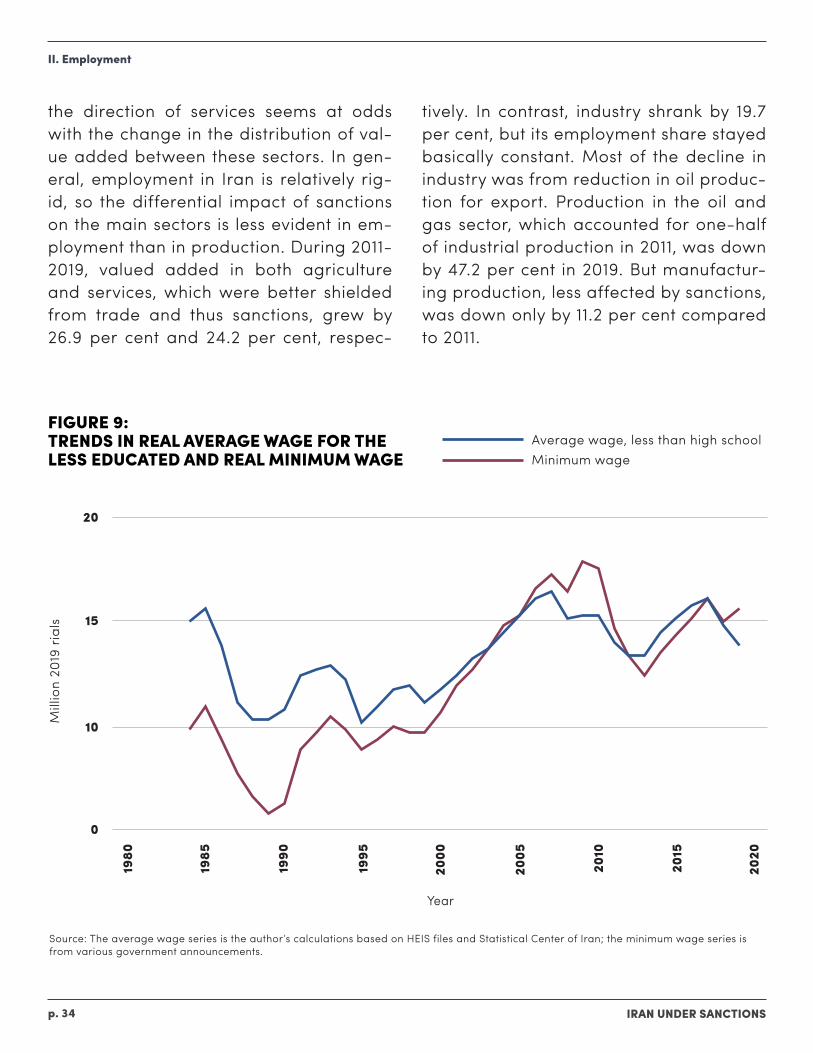
Figure 9 shows how the real value of the minimum wage has compared with the average wage of workers with less than a high school education, the group that the law is presumably aiming to help. The wage depicted here is the base value of the minimum wage, to which about 15-20 per cent is added for family and housing allowances. The movement of the two se-ries is broadly similar. Until the mid 2000s, the real minimum wage was below the real wage for those with less than a high school education. Gradually, especially af-ter 2000, as education increased and less educated workers were increasingly as-signed to less productive tasks, the growth of the real wage for less educated work-ers slowed, while the minimum wage con-tinued to grow. The oil boom enabled the government to raise the minimum wage much faster than before, so that by 2005 the minimum wage had exceeded the av-erage wage for low educated workers.
C. THE STRUCTURE OF EMPLOYMENT
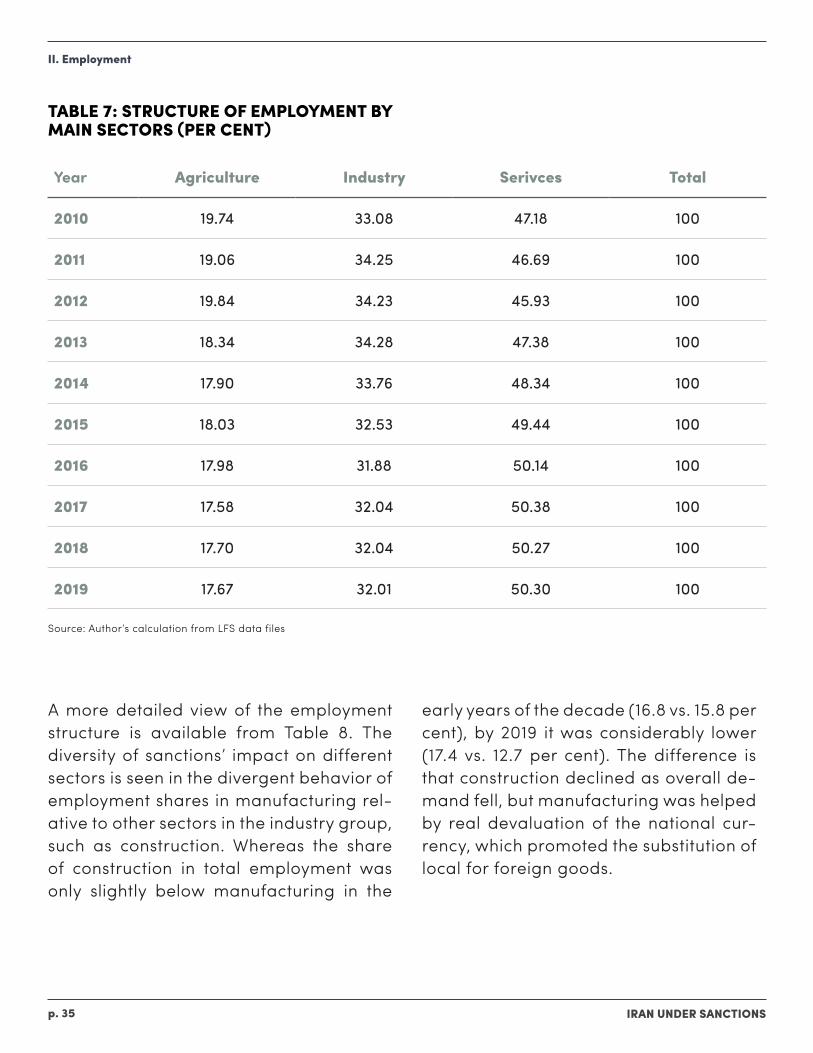
As in most upper-middle income countries, about half of Iran’s 26 million labor force is employed in the service sector, with indus-try and agriculture taking the other half. In 2019, agriculture’s share was 17.7 per cent, industry (including mining, construction and utilities besides manufacturing) 32 per cent, and services 50.3 per cent (Table 7). The slight shift in employment shares over the decade away from agriculture and in
II. Employment
IRAN UNDER SANCTIONSp. 34
the direction of services seems at odds with the change in the distribution of val-ue added between these sectors. In gen-eral, employment in Iran is relatively rig-id, so the differential impact of sanctions on the main sectors is less evident in em-ployment than in production. During 2011-2019, valued added in both agriculture and services, which were better shielded from trade and thus sanctions, grew by 26.9 per cent and 24.2 per cent, respec-
tively. In contrast, industry shrank by 19.7 per cent, but its employment share stayed basically constant. Most of the decline in industry was from reduction in oil produc-tion for export. Production in the oil and gas sector, which accounted for one-half of industrial production in 2011, was down by 47.2 per cent in 2019. But manufactur-ing production, less affected by sanctions, was down only by 11.2 per cent compared to 2011.
FIGURE 9: TRENDS IN REAL AVERAGE WAGE FOR THE LESS EDUCATED AND REAL MINIMUM WAGE
II. Employment
Average wage, less than high schoolMinimum wage
1980
1985
1990
1995
2000
2005
2010
2015
2020
0
10
15
20
Mill
ion
2019
ria
ls
Year
Source: The average wage series is the author’s calculations based on HEIS files and Statistical Center of Iran; the minimum wage series is from various government announcements.
IRAN UNDER SANCTIONSp. 35
TABLE 7: STRUCTURE OF EMPLOYMENT BY MAIN SECTORS (PER CENT)
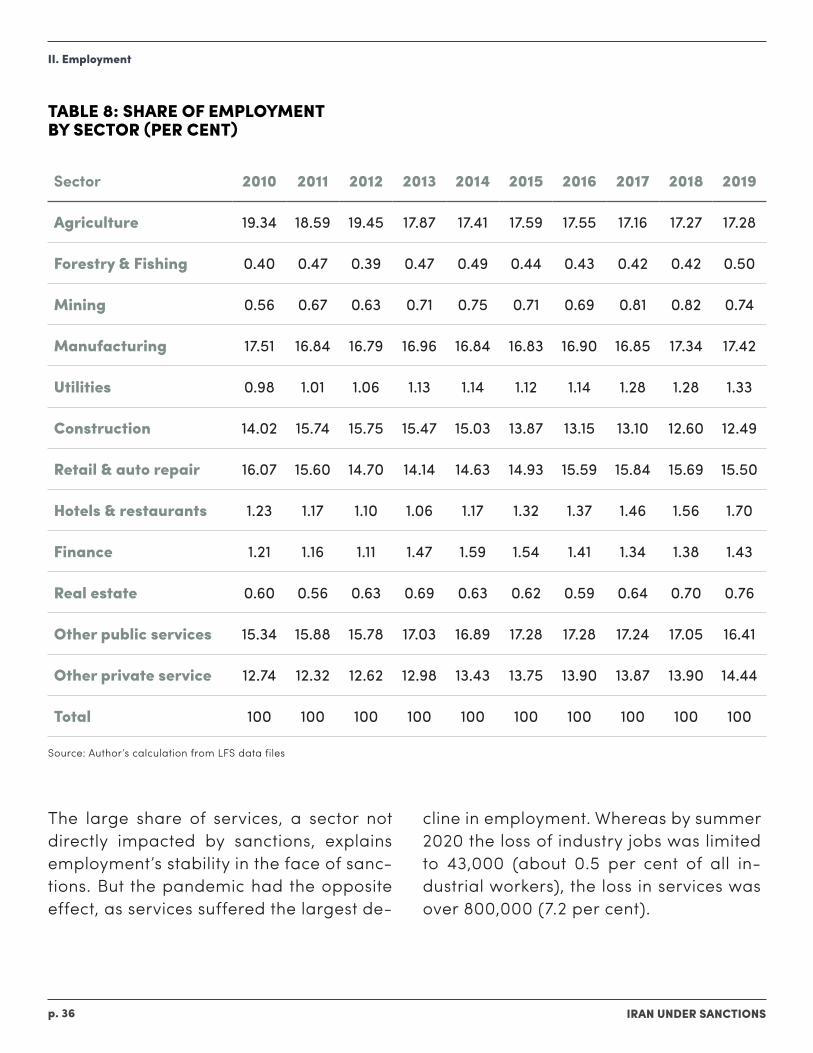
A more detailed view of the employment structure is available from Table 8. The diversity of sanctions’ impact on different sectors is seen in the divergent behavior of employment shares in manufacturing rel-ative to other sectors in the industry group, such as construction. Whereas the share of construction in total employment was only slightly below manufacturing in the
early years of the decade (16.8 vs. 15.8 per cent), by 2019 it was considerably lower (17.4 vs. 12.7 per cent). The difference is that construction declined as overall de-mand fell, but manufacturing was helped by real devaluation of the national cur-rency, which promoted the substitution of local for foreign goods.
II. Employment
Year Agriculture Industry Serivces Total
2010 19.74 33.08 47.18 100
2011 19.06 34.25 46.69 100
2012 19.84 34.23 45.93 100
2013 18.34 34.28 47.38 100
2014 17.90 33.76 48.34 100
2015 18.03 32.53 49.44 100
2016 17.98 31.88 50.14 100
2017 17.58 32.04 50.38 100
2018 17.70 32.04 50.27 100
2019 17.67 32.01 50.30 100
Source: Author’s calculation from LFS data files
IRAN UNDER SANCTIONSp. 36
TABLE 8: SHARE OF EMPLOYMENT BY SECTOR (PER CENT)
The large share of services, a sector not directly impacted by sanctions, explains employment’s stability in the face of sanc-tions. But the pandemic had the opposite effect, as services suffered the largest de-
cline in employment. Whereas by summer 2020 the loss of industry jobs was limited to 43,000 (about 0.5 per cent of all in-dustrial workers), the loss in services was over 800,000 (7.2 per cent).
II. Employment
Source: Author’s calculation from LFS data files
Sector 2010 2011 2012 2013 2014 2015 2016 2017 2018 2019
Agriculture 19.34 18.59 19.45 17.87 17.41 17.59 17.55 17.16 17.27 17.28
Forestry & Fishing 0.40 0.47 0.39 0.47 0.49 0.44 0.43 0.42 0.42 0.50
Mining 0.56 0.67 0.63 0.71 0.75 0.71 0.69 0.81 0.82 0.74
Manufacturing 17.51 16.84 16.79 16.96 16.84 16.83 16.90 16.85 17.34 17.42
Utilities 0.98 1.01 1.06 1.13 1.14 1.12 1.14 1.28 1.28 1.33
Construction 14.02 15.74 15.75 15.47 15.03 13.87 13.15 13.10 12.60 12.49
Retail & auto repair 16.07 15.60 14.70 14.14 14.63 14.93 15.59 15.84 15.69 15.50
Hotels & restaurants 1.23 1.17 1.10 1.06 1.17 1.32 1.37 1.46 1.56 1.70
Finance 1.21 1.16 1.11 1.47 1.59 1.54 1.41 1.34 1.38 1.43
Real estate 0.60 0.56 0.63 0.69 0.63 0.62 0.59 0.64 0.70 0.76
Other public services 15.34 15.88 15.78 17.03 16.89 17.28 17.28 17.24 17.05 16.41
Other private service 12.74 12.32 12.62 12.98 13.43 13.75 13.90 13.87 13.90 14.44
Total 100 100 100 100 100 100 100 100 100 100
IRAN UNDER SANCTIONSp. 37
D. EMPLOYMENT VULNERABILITY AND INFORMALITY
1. PUBLIC VS. PRIVATEIn 2019, 13.4 per cent of all workers and 21.6 per cent of all wage and salaried workers were in the public sector, down from 22.7 and 43.1 per cent, respectively, in 1997, when public employment peaked. Government workers have stayed rela-tively constant, around 3.5 million. Public sector jobs are traditionally considered more secure than private sector jobs or self-employment. However, their security has changed significantly in the last two decades, as ever more employees are hired on contracts of less than a year so as to avoid tenure. As a result, job security is no longer defined by public employment, but rather by the worker’s education and the degree of formality of employment. In 2019, 27.1 per cent of the employed had a college degree or above, and another 29.5 per cent had high school diplomas. These ratios are lower in the private sec-tor, where 52.9 per cent of workers had less than high school degrees, 29.9 per cent had only that degree, and 17.2 per cent had at least a college degree. A large pro-portion of those with less than high school degrees are likely also informal workers, whose jobs can be considered vulnerable.
2. INFORMALITYInformality in employment presents a seri-ous challenge to social protection in times of economic crisis. In advanced countries, where the vast majority are registered and covered by unemployment insurance, workers are automatically protected from negative economic shocks, at least for a period. Even after unemployment insur-ance disappears, the fact that their previ-ous employment status is recorded makes it easier for the government to reach them with further income assistance. Informal workers, on the other hand, lack unem-ployment insurance and a pension, so are not only at more risk of falling into poverty when a crisis hits, but are also harder to reach with additional help. For these rea-sons, the degree of informality in the la-bor market is an important determinant of the severity with which an economic crisis causes distress in household welfare.
Like most developing countries, Iran has its share of informal employment, but its la-bor force surveys do not offer a ready indi-cator of the extent. The labor force survey does not ask if workers have a contract or are otherwise registered with the author-ities, so a precise measure of informality is not available. But an estimate can be derived from some reported job charac-teristics. Public sector jobs are, of course, formal, as are jobs that offer health insur-ance or pension. The survey distinguish-es private and public employment and asks if a worker receives health insurance through an employer. There is no question
II. Employment
IRAN UNDER SANCTIONSp. 38
about enrollment in a pension or the na-tional social security program.
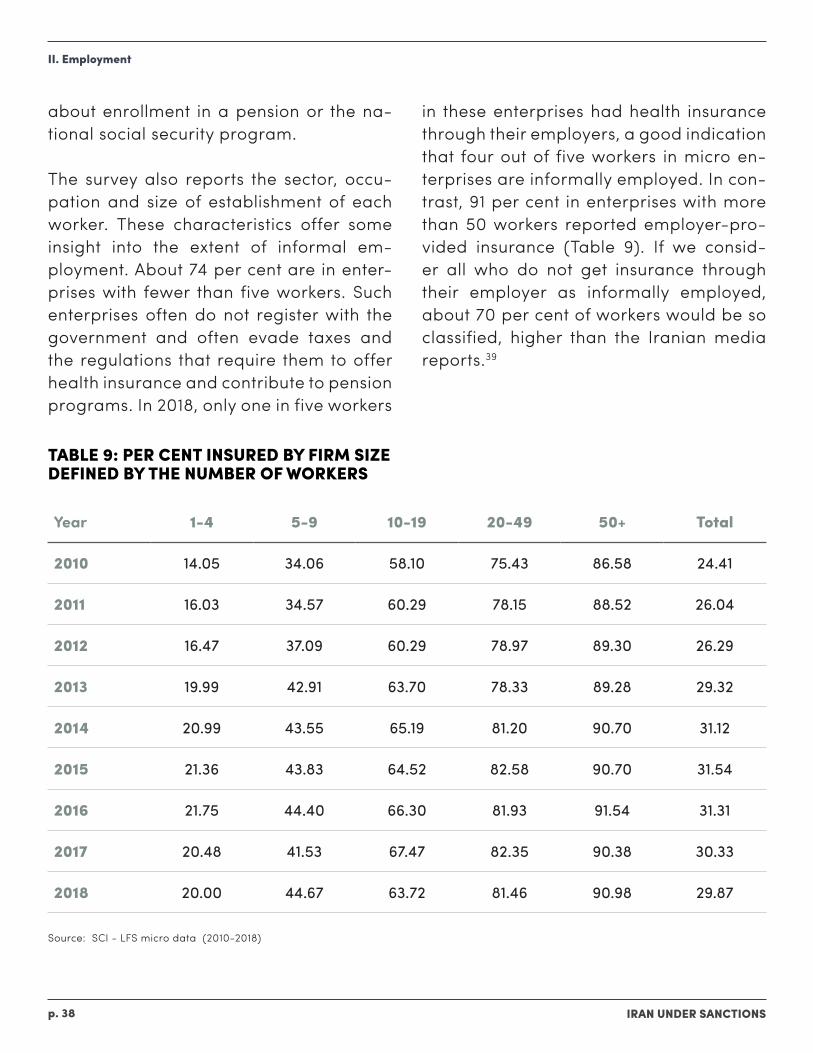
The survey also reports the sector, occu-pation and size of establishment of each worker. These characteristics offer some insight into the extent of informal em-ployment. About 74 per cent are in enter-prises with fewer than five workers. Such enterprises often do not register with the government and often evade taxes and the regulations that require them to offer health insurance and contribute to pension programs. In 2018, only one in five workers
in these enterprises had health insurance through their employers, a good indication that four out of five workers in micro en-terprises are informally employed. In con-trast, 91 per cent in enterprises with more than 50 workers reported employer-pro-vided insurance (Table 9). If we consid-er all who do not get insurance through their employer as informally employed, about 70 per cent of workers would be so classified, higher than the Iranian media reports.39
TABLE 9: PER CENT INSURED BY FIRM SIZE DEFINED BY THE NUMBER OF WORKERS
II. Employment
Year 1-4 5-9 10-19 20-49 50+ Total
2010 14.05 34.06 58.10 75.43 86.58 24.41
2011 16.03 34.57 60.29 78.15 88.52 26.04
2012 16.47 37.09 60.29 78.97 89.30 26.29
2013 19.99 42.91 63.70 78.33 89.28 29.32
2014 20.99 43.55 65.19 81.20 90.70 31.12
2015 21.36 43.83 64.52 82.58 90.70 31.54
2016 21.75 44.40 66.30 81.93 91.54 31.31
2017 20.48 41.53 67.47 82.35 90.38 30.33
2018 20.00 44.67 63.72 81.46 90.98 29.87
Source: SCI - LFS micro data (2010-2018)
IRAN UNDER SANCTIONSp. 39
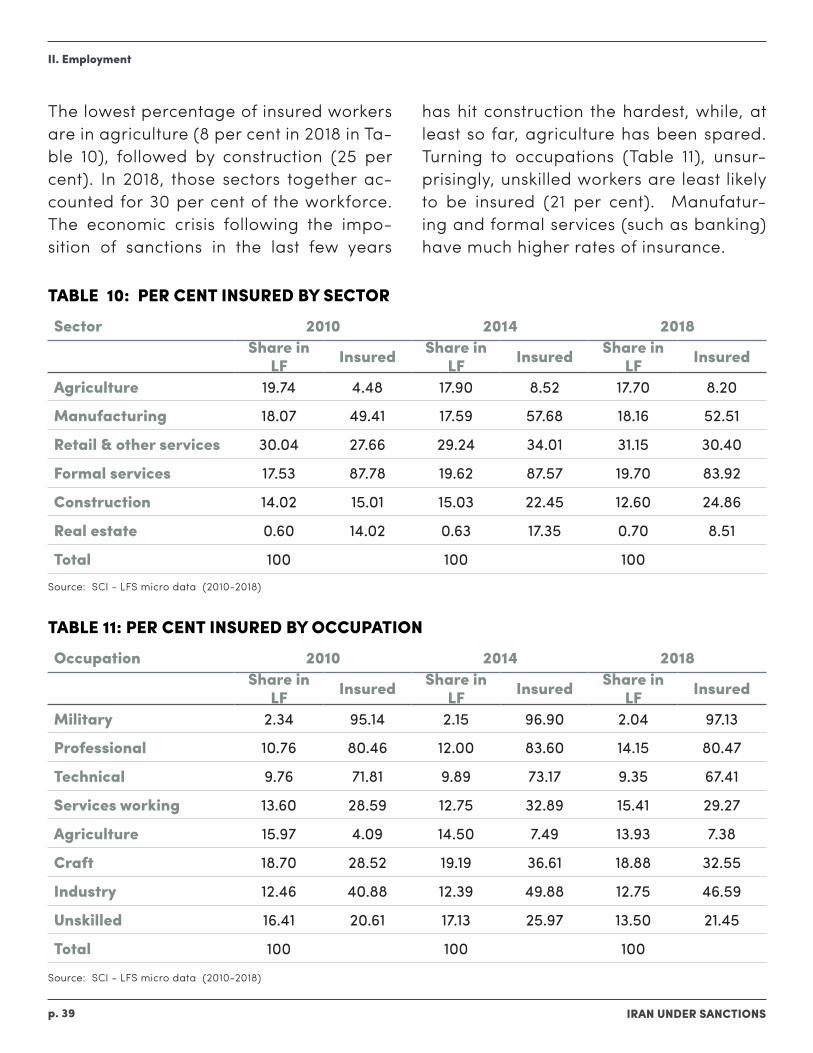
The lowest percentage of insured workers are in agriculture (8 per cent in 2018 in Ta-ble 10), followed by construction (25 per cent). In 2018, those sectors together ac-counted for 30 per cent of the workforce. The economic crisis following the impo-sition of sanctions in the last few years
has hit construction the hardest, while, at least so far, agriculture has been spared. Turning to occupations (Table 11), unsur-prisingly, unskilled workers are least likely to be insured (21 per cent). Manufatur-ing and formal services (such as banking) have much higher rates of insurance.
TABLE 10: PER CENT INSURED BY SECTOR
TABLE 11: PER CENT INSURED BY OCCUPATION
II. Employment
Source: SCI - LFS micro data (2010-2018)
Source: SCI - LFS micro data (2010-2018)
Sector 2010 2014 2018Share in
LF Insured Share in LF Insured Share in
LF Insured
Agriculture 19.74 4.48 17.90 8.52 17.70 8.20
Manufacturing 18.07 49.41 17.59 57.68 18.16 52.51
Retail & other services 30.04 27.66 29.24 34.01 31.15 30.40
Formal services 17.53 87.78 19.62 87.57 19.70 83.92
Construction 14.02 15.01 15.03 22.45 12.60 24.86
Real estate 0.60 14.02 0.63 17.35 0.70 8.51
Total 100 100 100
Occupation 2010 2014 2018Share in
LF Insured Share in LF Insured Share in
LF Insured
Military 2.34 95.14 2.15 96.90 2.04 97.13
Professional 10.76 80.46 12.00 83.60 14.15 80.47
Technical 9.76 71.81 9.89 73.17 9.35 67.41
Services working 13.60 28.59 12.75 32.89 15.41 29.27
Agriculture 15.97 4.09 14.50 7.49 13.93 7.38
Craft 18.70 28.52 19.19 36.61 18.88 32.55
Industry 12.46 40.88 12.39 49.88 12.75 46.59
Unskilled 16.41 20.61 17.13 25.97 13.50 21.45
Total 100 100 100
IRAN UNDER SANCTIONSp. 40
Inflation Targeting in the Time of Sanctions and Pandemic?
There is no question that severe sanc-tions since 2011 have dealt a large blow to Iran’s economy. They have cut oil exports to a trickle and disrupted its internation-al trade. There is also no doubt that other factors, internal and external, have also played a part in the last decade’s sluggish growth. Lower oil prices since 2014 have further reduced revenues, while econom-ic mismanagement and corruption have prevented appropriate policy responses to the external shocks. Given the magni-tude of the external shock due to sanc-tions, no policy could have prevented an economic crisis or fully shielded ordinary Iranians from a loss of living standards. One contribution of this paper is to mea-sure the extent of the decline for different regions and on different income groups. How much of the decline is due to sanc-tions or which policies could have better limited the damage are questions that it cannot answer.
With respect to living standards, the main findings are: First, average per capita con-sumption has fallen significantly since U.S. sanctions tightened in 2011. In 2019, it was down by 17.7 per cent from 2010 and back at the level reached in 2002. Secondly, the per capita consumption loss was not equally shared. Rural areas were worst hit,
III. CONCLUSION
followed by urban areas excluding Tehran. Compared to 2010, average consumption was down by 30 per cent in rural areas and 22.6 per cent in other urban areas, but up by 9 per cent in Tehran.
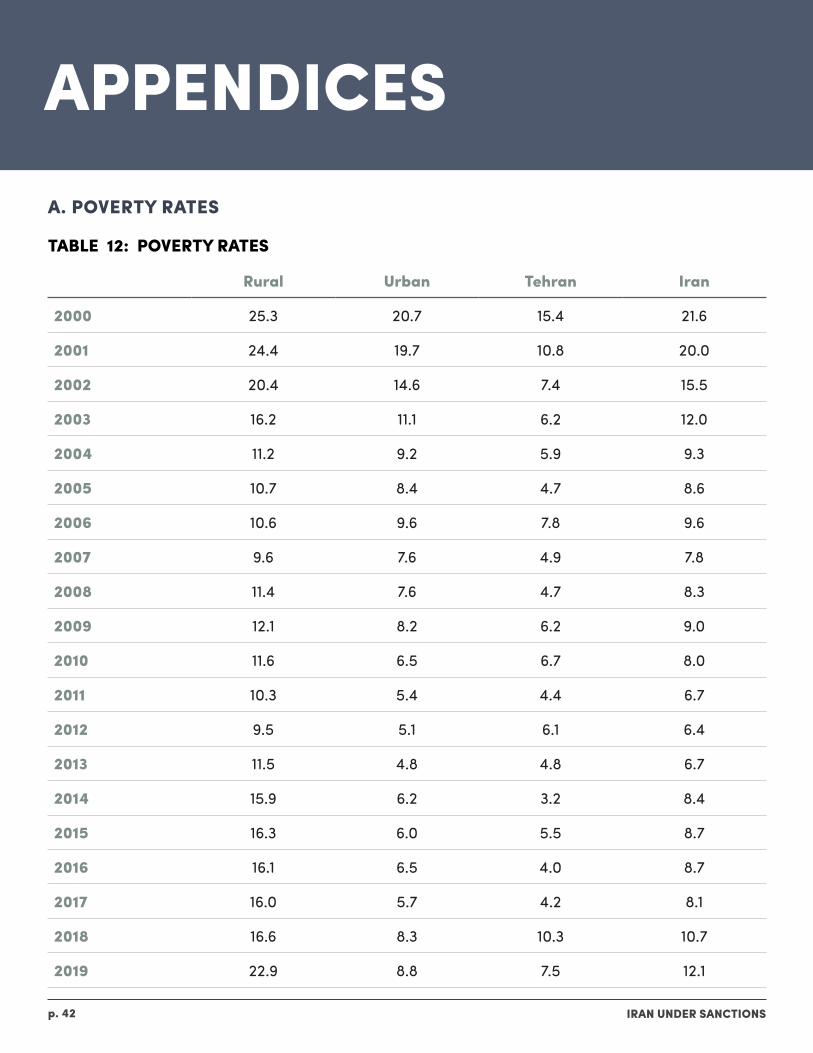
Thirdly, poverty rates increased across the three regions. Nationally, they nearly dou-bled, from the lowest point of 6.4 per cent in 2012 to 12.1 in 2019. That is, four million more people had consumption levels be-low the internationally set poverty line of $5.50 PPP in 2019 than in 2012. As expect-ed, poverty rates were the highest in rural areas (22.9 per cent), followed by other urban areas (8.8 per cent) and Tehran (7.5 per cent). Significantly, a government cash transfers policy implemented by ex-Pres-ident Mahmoud Ahmadinejad prevent-ed poverty rates from rising after the first wave of sanctions, in 2011-2012, and even lowered them. During the second phase, 2018-2019, the Rouhani administration was much less generous with cash transfers, in part because of ideological opposition and in part because it lacked the neces-sary resources.
Fourthly, taking advantage of panel data collected in 2018 and 2019, probit esti-mates reveal household characteristics that are most correlated with falling into
IRAN UNDER SANCTIONSp. 41
III. Conclusion
poverty in 2019. The analysis shows some common patterns found elsewhere in the developing world, namely that belong-ing to households headed by a woman, a less-educated person and larger in size put a person at greater risk of becoming poor. But, surprisingly, urban residents were more likely to fall into poverty than a rural person with the same charaacter-sitics, though the poverty rate is higher on average in rural than in urban areas.
Finally, the impact of the economic crisis has been less severe on employment than on consumption. This is in part because employment in Iran is fairly rigid and does not respond quickly to contractions in out-put. It is also because the government al-lowed prices to rise and the currency to depreciate rapidly, making local produc-tion more competitive in certain manufac-turing sectors. While this policy made em-ployment relatively resilient to the shock of sanctions, it was not able to protect real incomes from falling, since the depreci-ation that stabilized employment caused real wages to decline.
IRAN UNDER SANCTIONSp. 42
Inflation Targeting in the Time of Sanctions and Pandemic?
APPENDICESA. POVERTY RATES
TABLE 12: POVERTY RATES
Rural Urban Tehran Iran
2000 25.3 20.7 15.4 21.6
2001 24.4 19.7 10.8 20.0
2002 20.4 14.6 7.4 15.5
2003 16.2 11.1 6.2 12.0
2004 11.2 9.2 5.9 9.3
2005 10.7 8.4 4.7 8.6
2006 10.6 9.6 7.8 9.6
2007 9.6 7.6 4.9 7.8
2008 11.4 7.6 4.7 8.3
2009 12.1 8.2 6.2 9.0
2010 11.6 6.5 6.7 8.0
2011 10.3 5.4 4.4 6.7
2012 9.5 5.1 6.1 6.4
2013 11.5 4.8 4.8 6.7
2014 15.9 6.2 3.2 8.4
2015 16.3 6.0 5.5 8.7
2016 16.1 6.5 4.0 8.7
2017 16.0 5.7 4.2 8.1
2018 16.6 8.3 10.3 10.7
2019 22.9 8.8 7.5 12.1
IRAN UNDER SANCTIONSp. 43
Appendices
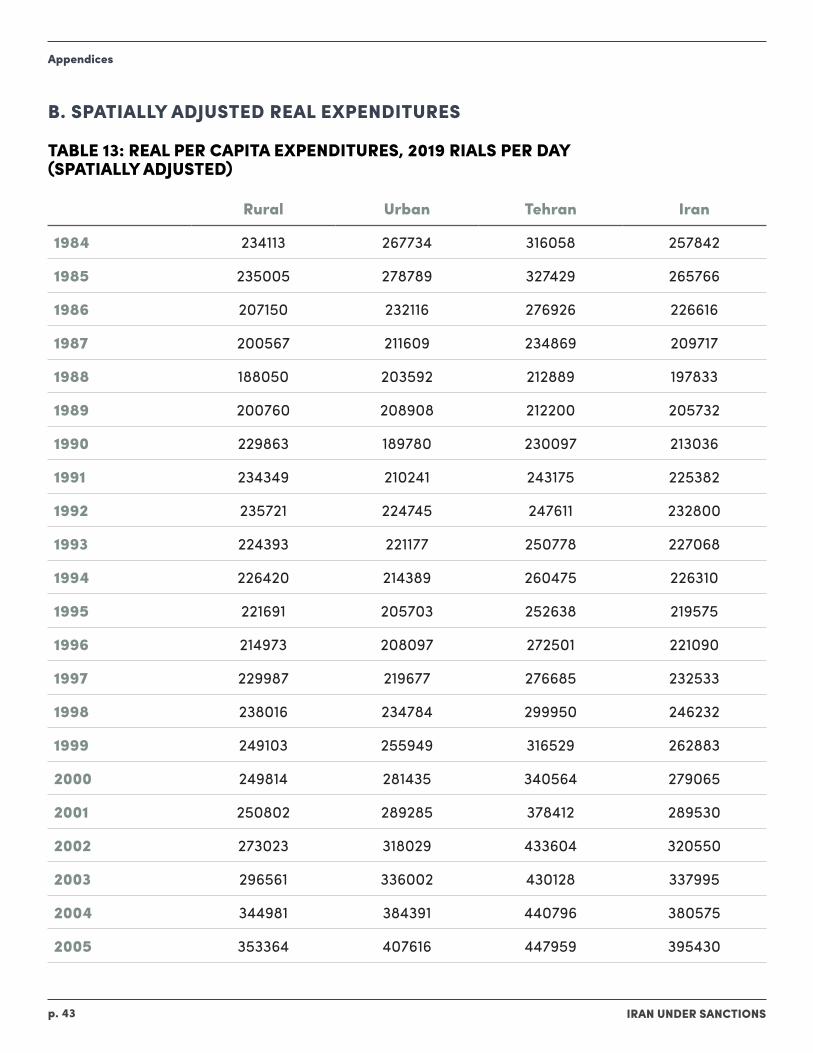
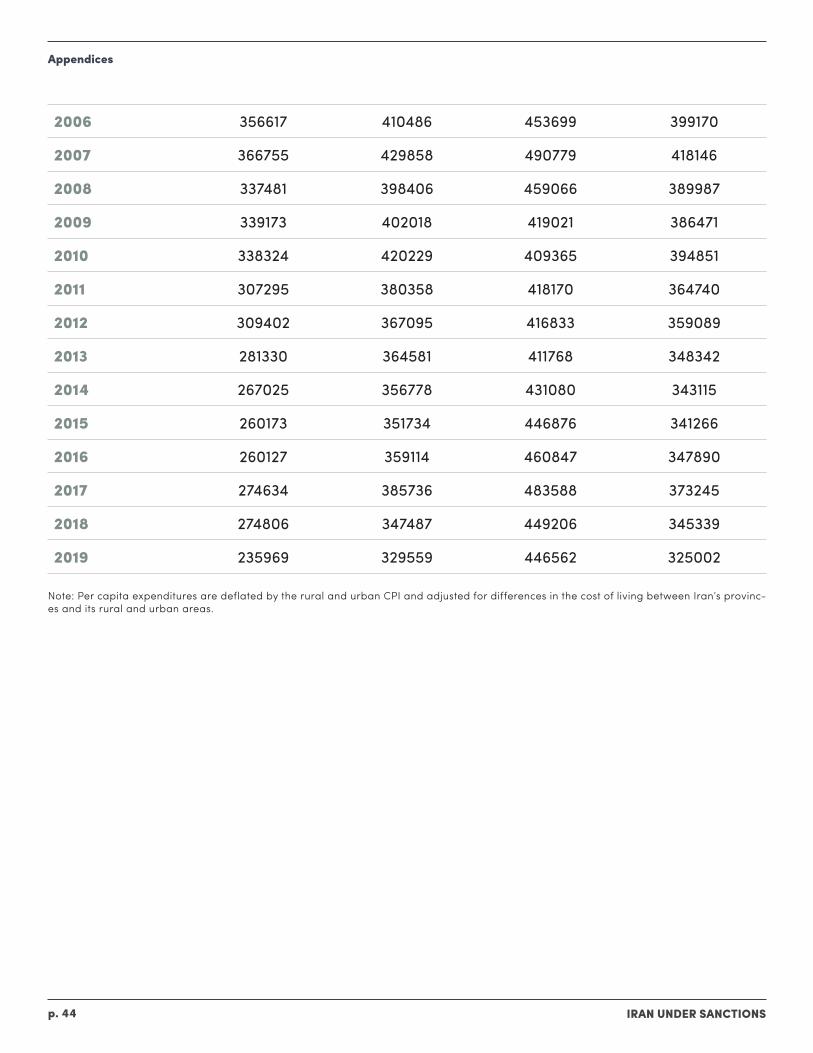
B. SPATIALLY ADJUSTED REAL EXPENDITURES
TABLE 13: REAL PER CAPITA EXPENDITURES, 2019 RIALS PER DAY (SPATIALLY ADJUSTED)
Rural Urban Tehran Iran
1984 234113 267734 316058 257842
1985 235005 278789 327429 265766
1986 207150 232116 276926 226616
1987 200567 211609 234869 209717
1988 188050 203592 212889 197833
1989 200760 208908 212200 205732
1990 229863 189780 230097 213036
1991 234349 210241 243175 225382
1992 235721 224745 247611 232800
1993 224393 221177 250778 227068
1994 226420 214389 260475 226310
1995 221691 205703 252638 219575
1996 214973 208097 272501 221090
1997 229987 219677 276685 232533
1998 238016 234784 299950 246232
1999 249103 255949 316529 262883
2000 249814 281435 340564 279065
2001 250802 289285 378412 289530
2002 273023 318029 433604 320550
2003 296561 336002 430128 337995
2004 344981 384391 440796 380575
2005 353364 407616 447959 395430
IRAN UNDER SANCTIONSp. 44
2006 356617 410486 453699 399170
2007 366755 429858 490779 418146
2008 337481 398406 459066 389987
2009 339173 402018 419021 386471
2010 338324 420229 409365 394851
2011 307295 380358 418170 364740
2012 309402 367095 416833 359089
2013 281330 364581 411768 348342
2014 267025 356778 431080 343115
2015 260173 351734 446876 341266
2016 260127 359114 460847 347890
2017 274634 385736 483588 373245
2018 274806 347487 449206 345339
2019 235969 329559 446562 325002
Note: Per capita expenditures are deflated by the rural and urban CPI and adjusted for differences in the cost of living between Iran’s provinc-es and its rural and urban areas.
Appendices
IRAN UNDER SANCTIONSp. 45
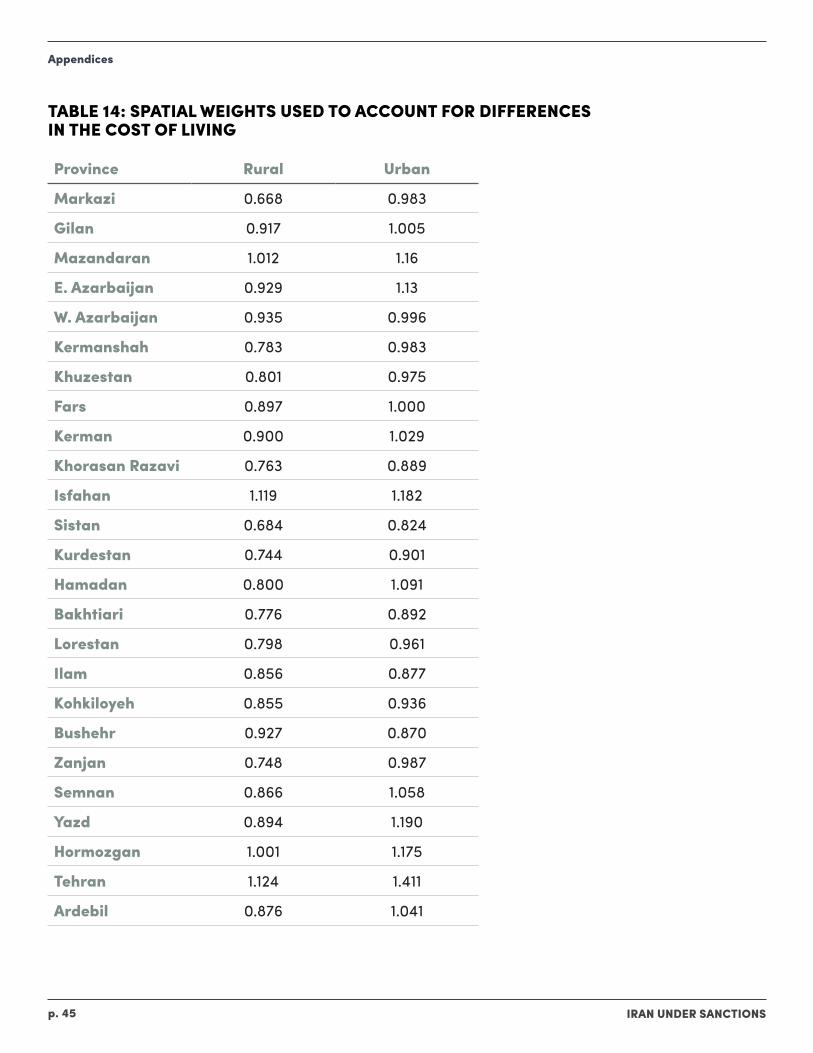
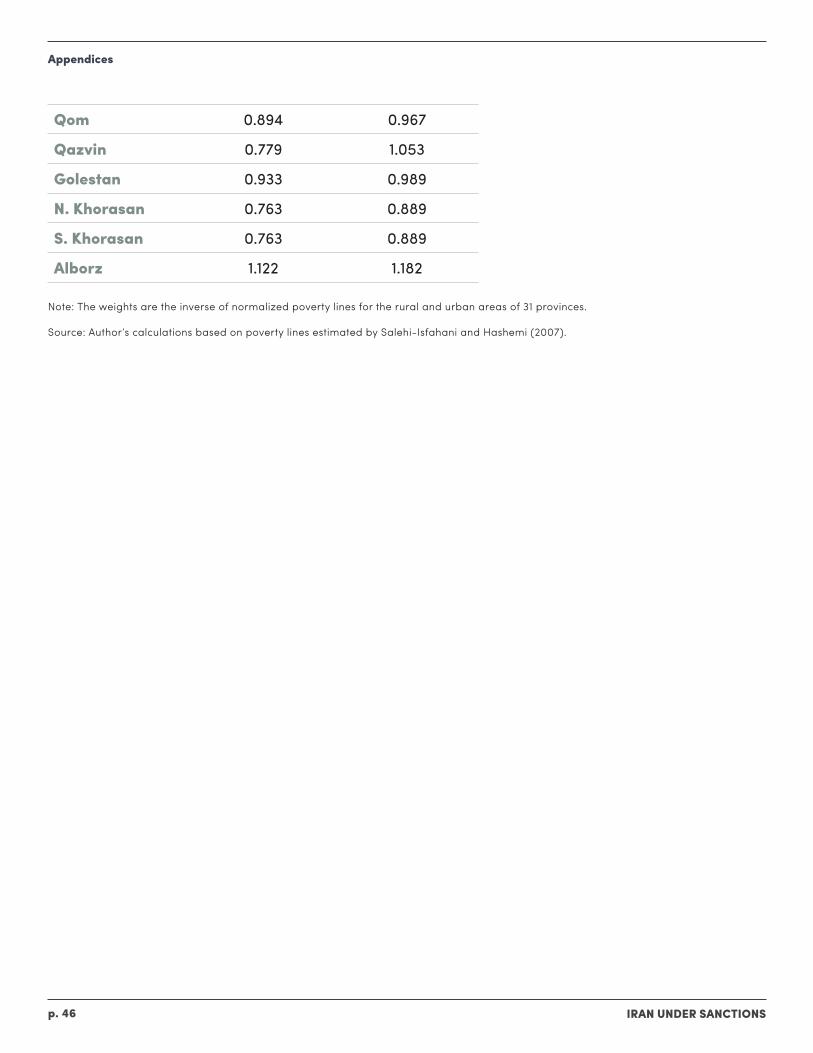
Appendices
TABLE 14: SPATIAL WEIGHTS USED TO ACCOUNT FOR DIFFERENCES IN THE COST OF LIVING
Province Rural Urban
Markazi 0.668 0.983
Gilan 0.917 1.005
Mazandaran 1.012 1.16
E. Azarbaijan 0.929 1.13
W. Azarbaijan 0.935 0.996
Kermanshah 0.783 0.983
Khuzestan 0.801 0.975
Fars 0.897 1.000
Kerman 0.900 1.029
Khorasan Razavi 0.763 0.889
Isfahan 1.119 1.182
Sistan 0.684 0.824
Kurdestan 0.744 0.901
Hamadan 0.800 1.091
Bakhtiari 0.776 0.892
Lorestan 0.798 0.961
Ilam 0.856 0.877
Kohkiloyeh 0.855 0.936
Bushehr 0.927 0.870
Zanjan 0.748 0.987
Semnan 0.866 1.058
Yazd 0.894 1.190
Hormozgan 1.001 1.175
Tehran 1.124 1.411
Ardebil 0.876 1.041
IRAN UNDER SANCTIONSp. 46
Qom 0.894 0.967
Qazvin 0.779 1.053
Golestan 0.933 0.989
N. Khorasan 0.763 0.889
S. Khorasan 0.763 0.889
Alborz 1.122 1.182
Note: The weights are the inverse of normalized poverty lines for the rural and urban areas of 31 provinces.
Source: Author’s calculations based on poverty lines estimated by Salehi-Isfahani and Hashemi (2007).
Appendices
IRAN UNDER SANCTIONSp. 47
Appendices
TABLE 15: SHARE OF INCOME CLASSES
Poor Lower middle class Middle class Upper middle class
1990 35.1 36.5 26.1 0.8
1991 33.3 36.1 28.1 1.1
1992 30.5 36.9 30.5 1.0
1993 30.5 38.0 30.3 0.8
1994 30.8 38.4 29.0 0.8
1995 33.2 37.1 27.8 0.8
1996 32.0 37.6 28.0 0.8
1997 28.7 39.2 30.0 0.9
1998 26.3 38.1 32.7 1.2
1999 23.7 37.2 35.6 1.3
2000 21.6 36.7 38.9 1.7
2001 20.0 36.5 40.2 1.9
2002 15.5 35.8 44.5 2.6
2003 12.0 34.4 49.7 2.6
2004 9.3 31.2 54.4 3.7
2005 8.6 29.9 55.6 4.1
2006 9.6 29.8 54.7 4.4
2007 7.8 28.8 57.8 4.8
2008 8.3 28.7 58.2 3.3
2009 9.0 28.9 56.5 3.5
2010 8.0 28.4 57.7 3.6
2011 6.7 31.0 58.4 2.4
2012 6.4 31.5 58.1 2.2
2013 6.7 33.6 56.1 2.0
2014 8.4 32.8 54.3 1.9
2015 8.7 33.9 53.5 2.1
2016 8.7 33.2 54.0 2.2
2017 8.1 30.6 56.2 3.1
2018 10.7 34.3 51.1 2.6
2019 12.1 34.6 48.8 2.0
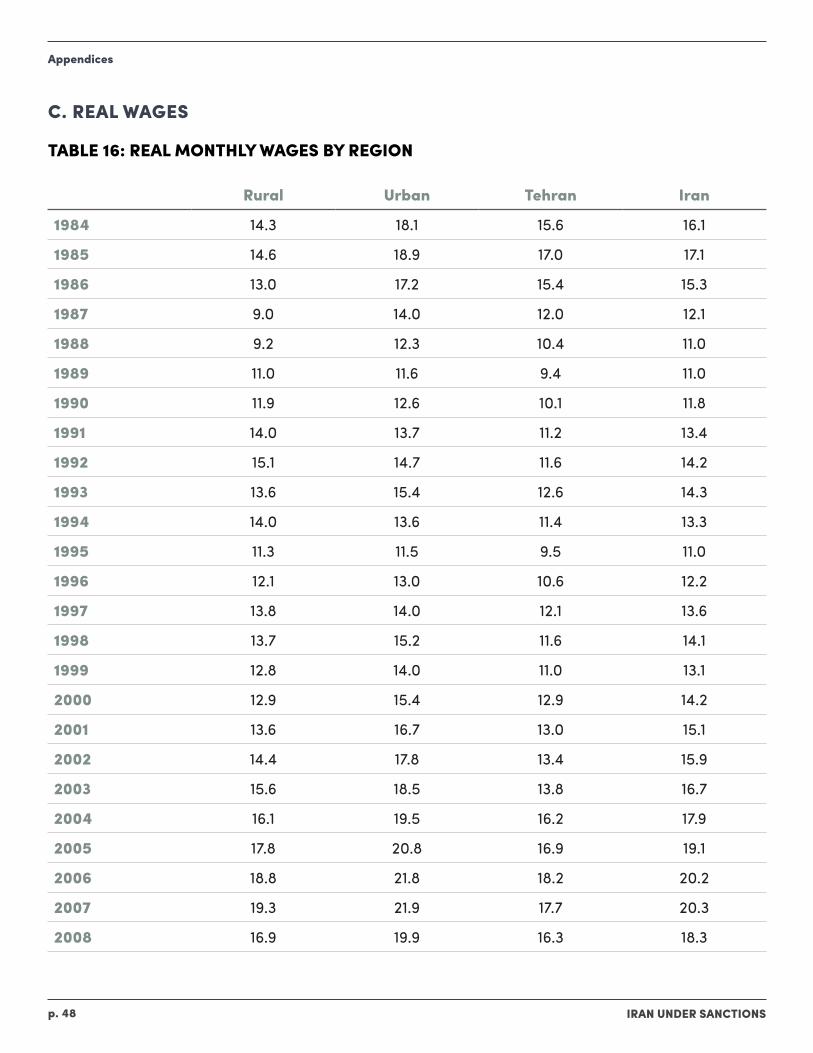
IRAN UNDER SANCTIONSp. 48
Appendices
C. REAL WAGES
TABLE 16: REAL MONTHLY WAGES BY REGION
Rural Urban Tehran Iran
1984 14.3 18.1 15.6 16.1
1985 14.6 18.9 17.0 17.1
1986 13.0 17.2 15.4 15.3
1987 9.0 14.0 12.0 12.1
1988 9.2 12.3 10.4 11.0
1989 11.0 11.6 9.4 11.0
1990 11.9 12.6 10.1 11.8
1991 14.0 13.7 11.2 13.4
1992 15.1 14.7 11.6 14.2
1993 13.6 15.4 12.6 14.3
1994 14.0 13.6 11.4 13.3
1995 11.3 11.5 9.5 11.0
1996 12.1 13.0 10.6 12.2
1997 13.8 14.0 12.1 13.6
1998 13.7 15.2 11.6 14.1
1999 12.8 14.0 11.0 13.1
2000 12.9 15.4 12.9 14.2
2001 13.6 16.7 13.0 15.1
2002 14.4 17.8 13.4 15.9
2003 15.6 18.5 13.8 16.7
2004 16.1 19.5 16.2 17.9
2005 17.8 20.8 16.9 19.1
2006 18.8 21.8 18.2 20.2
2007 19.3 21.9 17.7 20.3
2008 16.9 19.9 16.3 18.3
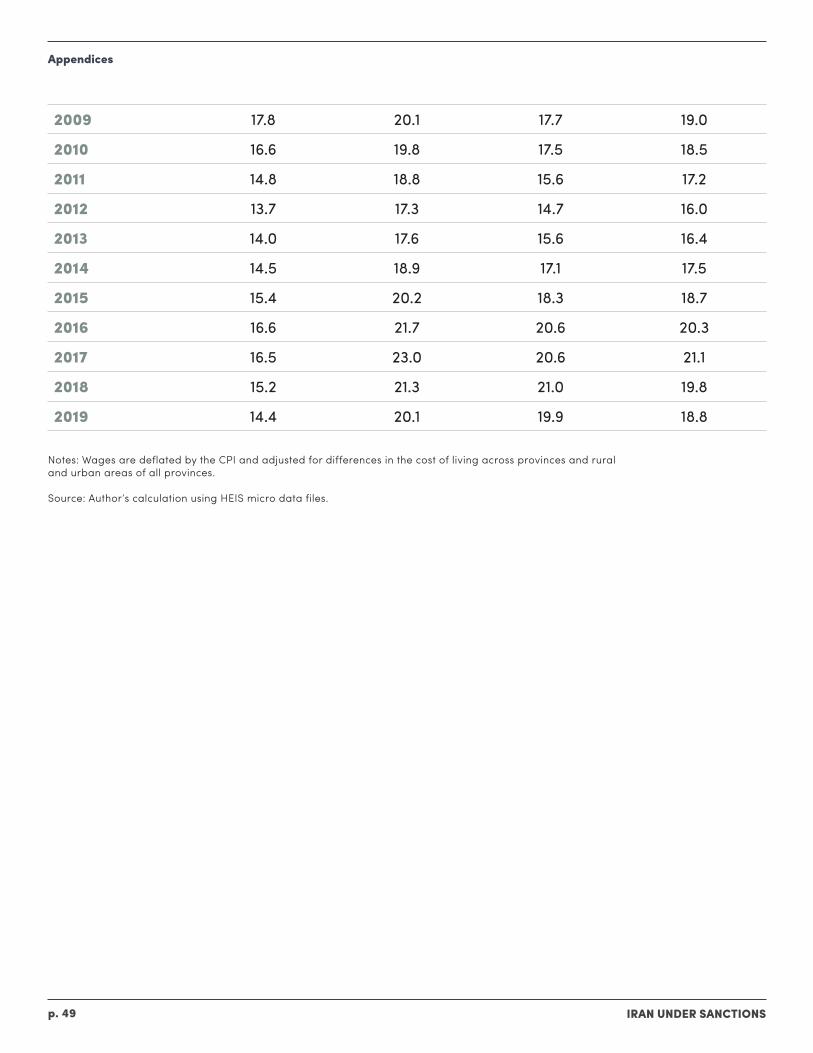
IRAN UNDER SANCTIONSp. 49
2009 17.8 20.1 17.7 19.0
2010 16.6 19.8 17.5 18.5
2011 14.8 18.8 15.6 17.2
2012 13.7 17.3 14.7 16.0
2013 14.0 17.6 15.6 16.4
2014 14.5 18.9 17.1 17.5
2015 15.4 20.2 18.3 18.7
2016 16.6 21.7 20.6 20.3
2017 16.5 23.0 20.6 21.1
2018 15.2 21.3 21.0 19.8
2019 14.4 20.1 19.9 18.8
Appendices
Notes: Wages are deflated by the CPI and adjusted for differences in the cost of living across provinces and rural and urban areas of all provinces.
Source: Author’s calculation using HEIS micro data files.
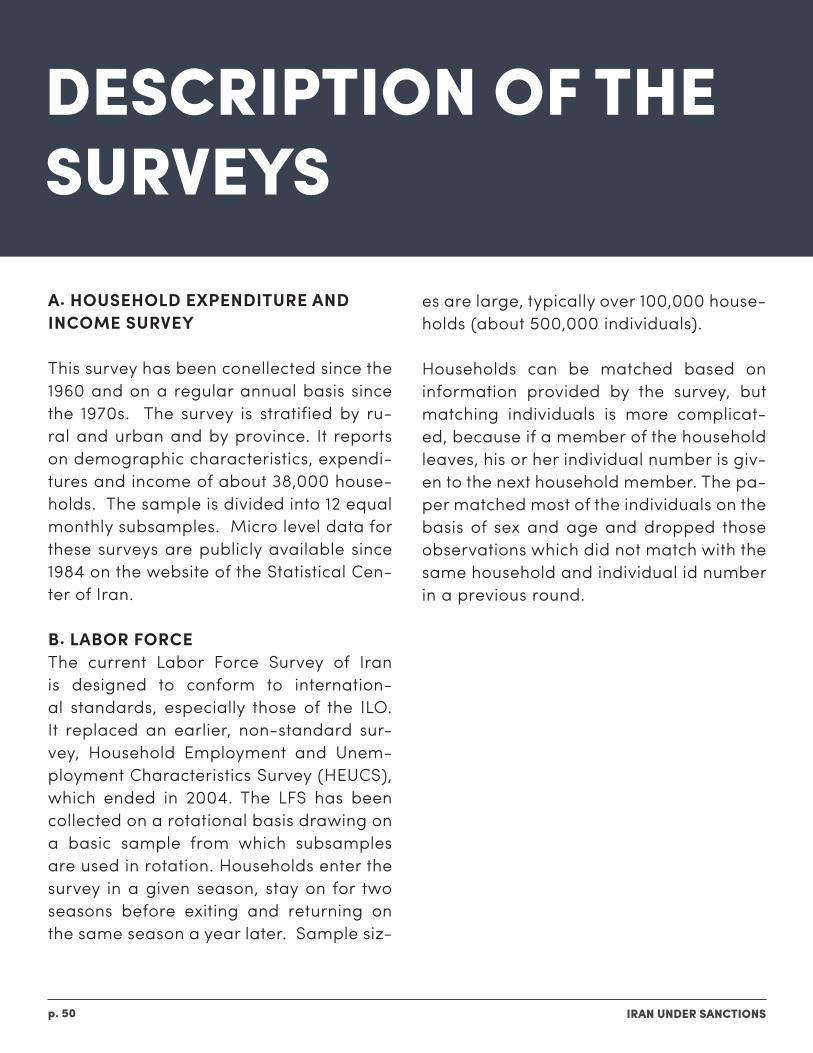
IRAN UNDER SANCTIONSp. 50
Inflation Targeting in the Time of Sanctions and Pandemic?
A. HOUSEHOLD EXPENDITURE AND INCOME SURVEY
This survey has been conellected since the 1960 and on a regular annual basis since the 1970s. The survey is stratified by ru-ral and urban and by province. It reports on demographic characteristics, expendi-tures and income of about 38,000 house-holds. The sample is divided into 12 equal monthly subsamples. Micro level data for these surveys are publicly available since 1984 on the website of the Statistical Cen-ter of Iran.
B. LABOR FORCEThe current Labor Force Survey of Iran is designed to conform to internation-al standards, especially those of the ILO. It replaced an earlier, non-standard sur-vey, Household Employment and Unem-ployment Characteristics Survey (HEUCS), which ended in 2004. The LFS has been collected on a rotational basis drawing on a basic sample from which subsamples are used in rotation. Households enter the survey in a given season, stay on for two seasons before exiting and returning on the same season a year later. Sample siz-
DESCRIPTION OF THE SURVEYS
es are large, typically over 100,000 house-holds (about 500,000 individuals).
Households can be matched based on information provided by the survey, but matching individuals is more complicat-ed, because if a member of the household leaves, his or her individual number is giv-en to the next household member. The pa-per matched most of the individuals on the basis of sex and age and dropped those observations which did not match with the same household and individual id number in a previous round.
IRAN UNDER SANCTIONSp. 51
ENDNOTES1. M. Weisbrot and J. Sachs , “Eco-
nomic sanctions as collective punishment: The case of Vene-zuela, Center for Economic and Policy Research, pp. 1–25 (2019).
2. M.R. Farzanegan, M.M. Khab-bazan and H. Sadeghi, Effects of Oil Sanctions on Iran’s Econ-omy and Household Welfare: New Evidence from A CGE Model, pp. 185–211 (New York, 2016).
3. For a review, see D. Thomas and E. Frankenberg. “House-hold responses to the financial crisis in Indonesia: Longitudinal evidence on poverty, resources, and well-being,” in Globaliza-tion and Poverty, Ann Harriosn (ed.) pp. 517–560 (Chicago, 2007).
4. Nadereh Chamlou “Iran’s Eco-nomic Performance Since the 1979 Revolution,” The Atlantic Council, 2/1/2019, and Sale-hi-Isfahani, “Iran’s Economy 40 Years After the Revolution,” in Maloney, Suzanne, ed. The Ira-nian Revolution at Forty. Brook-ings Institution Press, 2020.
5. For more on this, see the pa-per by Kevan Harris in this se-ries.
6. Salehi-Isfahani, “Rising Employ-ment Casts Doubt on IMF’s Grim Forecast for Iran’s Economy,” Bourse and Bazaar, 10/30/2019.
7. Survey data on household con-sumption under-estimate pri-vate consumption recorded in the national accounts of all countries, but in Iran the un-der-estimation is larger be-cause of enormous government
subsidies, especially for energy (more on energy subsidies in Section II below). Since ener-gy subsidies have grown over time, in tandem with econom-ic growth and energy use, the underestimation has increased, creating a large gap between the trends in GDP per capita and consumption on the one hand and GDP in constant price and Purchasing Power parity dollars on the other.
8. For evidence of the latter see the companion paper in this project by Shahrokh Fardoust.
9. See the appendices for the data used in Figure 2 and the spatial weights that adjust for differ-ence in cost of living as experi-enced by the poor.
10. K. Katzman, “Iran Sanctions,” Technical Report, Congressional Research Service (2020).
11. Shahi, A. (2019). Drought: The Achilles heel of the Islamic Re-public of Iran. Asian Affairs 50 (1), 18–39.
12. Asadi, G. and M. H. Mostafa-vi-Dehzooei (2019). “The effects of precipitation shocks on rural labor markets and migration.” Available at SSRN 3249735.
13. Expenditures are deflated by the CPI for rural and urban ar-eas and spatially adjusted using weights calculated from pover-ty lines for urban and rural ar-eas of each province
14. “No Time to End Sanctions”, Wall Street Journal 3/25/2020. For an earlier statement of the same view, see also J. Amuze-
gar “Iran’s economy and the U.S. sanctions,” The Middle East Journal , 185–199, 1997.
15. The methodology proposed by Ravallion 1992; and imple-mented by Salehi-Isfahani and Hashemi (2007), Working Pa-per, Department of Economics, Virginia Tech.
16. The results obtained are broad-ly consistent with those in Sale-hi-Isfahani (2017), Poverty and income inequality in the Islamic Republic of Iran. Revue interna-tionale des ´etudes du d´evel-oppement (1), 113–136; and a World Bank study which applied a similar method to estimate poverty rates for Iran (Ataman-ov, A., M.-H. Mostafavi, D. Sale-hi-Isfahani, and T. Vishwanath (2016). Con- structing robust poverty trends in the islamic re-public of iran: 2008–14. Tech-nical report, Policy Research Working Paper 7836, The World Bank).
17. Salehi-Isfahani 2014. “The re-form of energy subsidies in Iran: from promise to disap-pointment.” Economic Research Forum, Policy Perspective (13).
18. Table 12 in the appendices.
19. Poverty rates are the percent-age of those with real per capita expenditures below the interna-tional poverty line of $5.50 for upper middle income countries. Real expenditures are deflated by rural and urban CPI’s pro-vided by the SCI and spatially adjusted using weights derived from the poverty lines for the rural and urban areas of each
Endnotes
IRAN UNDER SANCTIONSp. 52
Endnotes
province.
20. Banerjee and Duflo, 2008; Madland, 2011; Easterly, 2001.
21. Homi Kharas, How a Growing Global Middle Class Could Save the World’s Economy. Brookings Institution, July 5, 2016.
22. Banerjee and Duflo, op. cit., recommend twice the poverty line, about $11 PPP in per cap-ita expenditures in Iran’s case; Birdsall (2015) uses $10 PPP as the middle class floor.
23. Salehi-Isfahani, 2016.
24. Pritchett and Spivack 2013. The poor generally spend upwards of 40 per cent of their income on food.
25. Salehi-Isfahani, “The Coronavi-rus Is Iran’s Perfect Storm,” For-eign Affairs, March 18, 2020.
26. Ibid.
27. Atamanov, Mostafavi, Sale-hi-Isfahani and Vishwanath 2016.
28. Salehi-Isfahani 2014.
29. Individuals in the lowest quintile who reported positive amounts under ”scholarships and other official transfers”. 2019 rials con-verted to USD PPP at the rate of 22,075 rials:$1 estimated by the World Bank.
30. Salehi-Isfahani, Belhaj-Hassine, and Assaad 2014; Assaad, Sale-hi-Isfahani, and Hendy.
31. Salehi-Isfahani, 1989.
32. Atkinson, Piketty, and Saez 2011.
33. The Gini and GE indices on the left axis, the 90/10 ratio on the right axis.
34. The table reports the estimated
coefficients of the probit func-tion, which indicate the direc-tion of change but do not mea-sure the probabilities of falling into poverty. The probabilities are calculated using these co-efficients and the ”margins” command in STATA. To estimate these probabilities, the values of all other variables are set to their means or to other values as indicated by the context.
35. To save space, the coefficients for 31 provinces are not report-ed in the table.
36. See Table 19 in the appendices for the data behind this figure.
37. Number employed in each quarter.
38. Wages are deflated by CPI and adjusted for differences in living costs across provinces and rural and urban areas of all provinc-es.
39. Media reports of research done at Iran’s Parliament Research Center put the share of informal employment at 60 per cent.