Embed Size (px)
Citation preview

Iranian Journal of Medical Physics
ijmp.mums.ac.ir
Determination of Optimum Planar Imaging Parameters for Small Structures with Diameters Less Than the Resolution of the Gamma Camera Mpumelelo Nyathi* 1 Department of Medical Physics, Sefako Makgatho Health Science University, SouthAfrica
A R T I C L E I N F O A B S T R A C T
Article type: Original Article
Introduction: The limited spatial resolution of the gamma camera hinders the absolute quantification of planar images of small structures. The imaged structures are affected by partial volume effects (PVEs), which can spread activity and lead to underestimation of the regional distribution. The use of optimum planar parameters reduces the impact of the limited spatial resolution of the gamma camera and the statistical noise inherent to low photon count, thus improving quantification. In this study, we aimed to determine the optimum planar imaging parameters for small structures. Materials and Methods: A thyroid protocol was used to acquire planar images of the spheres A, B, and C (16 mm, 12 mm, and 11 mm in diameter, respectively) whilst filled with a targeted activity concentration of technetium-99m. One sphere was mounted at the centre of the Jaszczak Phantom and the other two adjacent to its walls using capillary stems fitted on the spheres. The phantom was filled with distilled water. The targeted activity concentrations used were 74 kBq/mL, 100 kBq/mL, 150 kBq/mL, and 300 kBq/mL. Images of the same count per pixel were acquired on 64 × 64, 128× 128, 256 × 256, 512 × 512, and 1024 × 1024 pixels using a vertical detector mounted 5 cm above the phantom. All the images were quantified using ImageJ software, version 1.48a, Java 1.70_51 [64-bit]. Results: The optimum planar imaging parameters established were a matrix size of 128 × 128 pixels and technetium-99m solution of activity concentration of 300 kBq/ml. Conclusion: The use of optimal imaging parameters reduces the impact of PVEs, leading to improved quantitative accuracy.
Article history: Received: Jun 25, 2017 Accepted: Aug 31, 2017
Keywords: Medical Imaging Radioisotope Imaging Partial Volume Effects
►Please cite this article as: Mpumelelo N. Determination of Optimum Planar Imaging Parameters for Small Structures with Diameters Less Than the Resolution of the Gamma Camera. Iran J Med Phys 2017; 14: 219-228. 10.22038/ijmp.2017.24559.1246.
Introduction
One of the main objectives of nuclear medicine is to provide clinicians with high quality images that can be used confidently to support both diagnostic and treatment objectives. Such images either can be interpreted visually to assess the physiological functions of various tissues or may be evaluated quantitatively with the objective of measuring the biochemical and physiological processes of the human body. These images are derived from an imaging process that involves introducing a small quantity of radioisotopes into the human body either intravenously or by ingestion or inhalation [1-4]. A gamma camera acquires photons from this decaying radioisotope. These photons are converted into electrical signals. The computer assigns different intensities of radioactivity with varying colours and shades to build images [5-7].
Quantification of nuclear medicine images renders a numerical value [8], which shows either the uptake or distribution of the radionuclide in the targeted organ inside the patient’s body. Quantitative
numerical values extracted from images are then used to infer on diagnostic or therapeutic outcomes [3, 8, 9]. Accurate quantification of activity in voxels, tumours, and organs is important for approval of new imaging agents. Pharmacokinetics studies also rely on the quantification of activity for approval of new radiopharmaceutical drugs [9, 10]. Furthermore, quantification is also crucial when evaluating tumour response to treatments. Reliable numerical values of the absorbed dose are used to decide on whether a treatment should be continued or discontinued for the patient’s benefit [3].
Semi-quantitative analysis has also been largely used in the study of salivary glands dysfunction arising from salivary gland diseases [1], injury after radioiodine treatment, and post-external-beam radiation therapy of head and neck tumours [11-14]. However, the ability to accurately quantify planar images acquired with a gamma camera is hindered by the limited spatial resolution of the gamma camera and image noise inherent to the low photon statistics
*Corresponding Author: Department of Medical Physics, Sefako Makgatho Health Science University, Box 672 Medunsa, 0204. South Africa. Tel 0027 12521 4385, Fax: 0027 12521 4385, E-mail:[email protected].

Mpumelelo Nyathi Optimum Planar Imaging Parameters for Small Structures
Iran J Med Phys, Vol. 14, No. 4, December 2017
220
if imaged structures have diameters that are less than 2-3 times the resolution of the gamma camera.
The spatial resolution is commonly measured by the full-width half-maximum (FWHM) of the point spread function of a point source [15]. However, Karpetas et al. (2014) [16] showed that the FWHM, which can be used to measure the spatial resolution of an imaging system, lacks the possibility for complete characterization since different point spread function (PSF) shapes may show equal FWHM values. The response of a system to incident signal amplitudes passing through the imaging chain can be described by the modulation transfer function (MTF), which expresses the system’s response in the spatial frequency domain. In single-photon emission computed tomography (SPECT), the MTF can be determined by Fourier transforming the corresponding PSF, obtained by reconstructing cross sectional images of a thin line source of a clinically employed radioactive element. Precise and accurate determination of the MTF is important for comparing the effects of different scan and reconstruction parameters. This function can be also used for comparison between different SPECT scanners, especially for evaluating the accuracy of size and density measurements of fine details in images [16, 17].
The limited spatial resolution of the gamma camera gives rise to a phenomenon called partial volume effects (PVEs). The presence of PVEs results in spreading of activity counts outside the image boundary to neighbouring image pixels, hence underestimation of image counts. The impact of PVEs is dependent on the absence or presence of background activity. In this study, we examined the impact of PVEs in the absence of a radioactive background, a phenomenon called spill-out effect [18-20].
Several PVE correction and activity recovery methods have since been proposed and implemented [21-30]. The majority of these studies relied on the use of phantoms. Computer-aided simulations have also been used [23-26, 31-39]. The most successful technique proposed by Elanderson and Hutton [24], called p-PVC, took into account distance-dependent blurring. However, reliance on the structural image (CT and MRI) that is co-registered with SPECT made the method not feasible for smaller nuclear departments owing to high costs involved. Nyathi et al. [30], proposed a low-cost procedure that uses a license-free software called ImageJ. The technique recommended the use of two regions of interest (region of interest 1 [ROI 1] and region of interest 2 [ROI 2]). ROI 1 was drawn tightly on the boundary of the image to give image counts before PVEs correction, while ROI 2 extended from the boundary of ROI 1 by the FWHM of the gamma camera. ROI 2 recovered activity counts spread by PVEs. The
procedure was found to be dependable for quantification of PVEs on images of the small structures with diameters less than 2-3 times the resolution of the gamma camera.
Image noise has also been cited as an image-degrading factor. The presence of image noise is known to obscure the essential information required to arrive at a conclusive visual interpretation of planar images [3, 30]. In this study, we aimed at determining the optimum planar imaging parameters for small structures (diameters less than 2-3 times the FWHM of the gamma camera) capable of reducing the impact of the limited spatial resolution of the gamma camera and the statistical noise inherent to low photon count, thus reducing bias in quantification.
Materials and Methods 99mTc solutions of the activity concentrations (74
kBq/mL, 100 kBq/mL, 150 kBq/mL, and 300 kBq/mL) were prepared by uniformly mixing distilled water and an aqueous solution 99mTc, when ready for use. The proportions were determined using the formula:
(1)
Where denotes the targeted activity
concentration of the required solution, is the activity of 99mTc measured using the dose calibrator,
and indicates the volume of distilled water required to make the required concentration.
The spheres A, B, and C (16 mm, 12 mm, and 11 mm in diameter, respectively) fitted with capillary stems were filled with the targeted activity concentration of technetium-99m. The targeted activity concentrations of 74 kBq/mL, 100 kBq/mL, 150 kBq/mL, and 300 kBq/mL were employed. For a particular selected targeted activity concentration filled into the sphere, the spheres were mounted inside a Biodex Jaszczak Spect Phantom (manufactured in United States of America) forming a straight line. One sphere was mounted at the centre and the other two adjacent to the phantom walls (Figure 1). The phantom was then filled with distilled water and laid on supine position on the imaging table. The top detector of a Siemens E-Cam dual-head gamma camera, previously subjected to quality control tests as proposed by Fountos et al., (2012)[17], was mounted 5 cm above the phantom, a position that provided a spatial resolution of 4.5 mm. A thyroid protocol was then used to acquire planar images of the same count per pixel.
V
AC
C
A
V

Optimum Planar Imaging Parameters for Small Structures Mpumelelo Nyathi
Iran J Med Phys, Vol. 14, No. 4, December 2017
221
Figure 1. Lateral view of a Jaszczak Phantom filled with distilled water showing the position of the spheres filled with targeted activity concentration
For each targeted activity concentration used, a set
of five planar images with the same count per pixel were acquired on matrix sizes of 64 × 64, 128 × ×128, 256 × 256, 512 × 512, and 1024 × × 1024 pixels. For each matrix size used to acquire new images, a freshly prepared solution of the targeted technetium-99m activity concentration was filled inside the spheres. We used a new solution to avoid the possible biases in quantification due to technetium-99m decay. The acquired events were processed into images using e-Soft software installed into a computer interfaced with the Siemens E-cam dual head gamma camera system. Quantification of Images
The straight-line command tool of the ImageJ software, version 1.48a; Java 1.70_51 [64-bit] [40], was used to insert two diameters on each point image of the spheres A, B, and C. The point of intersection of the two diameters rendered the image centre. With the centre established, the radius of each image was measured. A circular (ROI 1), with a radius equal to the measured value was inserted on each image. A second region of interest (ROI 2) was added on each image (Figure 2) such that it extended from the boundary of ROI 1 by the FWHM (4.5 mm) of the gamma camera measured at a distance of 5 cm from the phantom.
Figure 2. Region of interest 1 and region of interest 2 drawn on the planar of images of the spheres A, B, and C
Signal-to-noise ratio
In order to obtain the signal-to-noise ratio (SNR) [15, 41], the square root of the true image counts (image counts extracted using ROI 2, which included
image counts spread outside the image pixels by the PVEs phenomenon), was calculated for each planar image quantified according to Equation (2) [15, 42],
NSNR (2)
Where N represents the image counts extracted from each planar image under consideration.
Equation 2, emphasizes on the need for maximizing the number of collected photons during imaging in order to obtain an image of good quality in terms of absence of image noise. Furthermore, Equation 2 provides the flexibility of adjusting the noise levels on the image by increasing or decreasing the value of N. As N raises, the SNR also increases. An increment in N will mean an increase in the dose administered to the patient, hence the need of justification of the quantity of the administered doses in order to achieve patient safety [43, 44] while aiming to acquire an image of good quality.
The percentage error in the quantification was calculated through dividing image counts spread outside the image pixels by the true image counts (image counts obtained using ROI 2), according to Equation 3:
Percentage error in quantification =
100
counts image 2 ROI
counts image 1 ROI -counts image 2 ROI
(3)
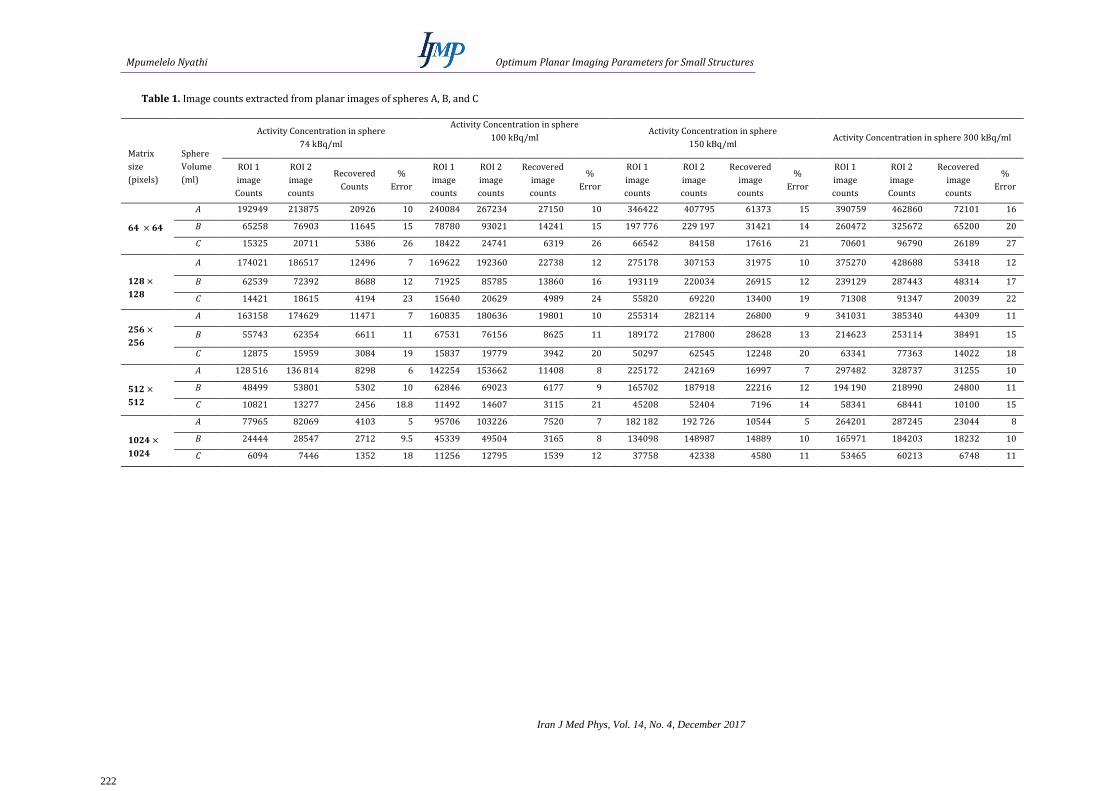
Results The PVEs (Table 1) were successfully quantified
using the two regions of interests (ROI 1 and ROI 2) as proposed by Nyathi et al. [30]. A closer analysis of Table 1 reflects that quantification errors increased as the size of the sphere diminished, thus confirming that the PVEs spread activity more in smaller structures compared to larger ones.
The use of larger matrix sizes greatly improved the spatial resolution (Table 2). However, as the larger matrix sizes were used, the improvement in the spatial resolution was soon overshadowed by the image degradation caused by image noise. The calculated values of the SNR for the acquired images became smaller, prompting the need for striking a balance between improving the spatial resolution and reducing the image degradation caused by image noise. The matrix size of 128 × 128 pixels provided the desired compromise since it resulted in improved spatial resolution compared to the 64 × 64 pixels while also providing high values of SNR compared to those attained using the larger matrix sizes that offered better resolution (Table 2).
Mpumelelo Nyathi Optimum Planar Imaging Parameters for Small Structures
Iran J Med Phys, Vol. 14, No. 4, December 2017
222
Table 1. Image counts extracted from planar images of spheres A, B, and C
Matrix
size
(pixels)
Sphere
Volume
(ml)
Activity Concentration in sphere
74 kBq/ml
Activity Concentration in sphere
100 kBq/ml
Activity Concentration in sphere
150 kBq/ml Activity Concentration in sphere 300 kBq/ml
ROI 1
image
Counts
ROI 2
image
counts
Recovered
Counts
%
Error
ROI 1
image
counts
ROI 2
image
counts
Recovered
image
counts
%
Error
ROI 1
image
counts
ROI 2
image
counts
Recovered
image
counts
%
Error
ROI 1
image
counts
ROI 2
image
Counts
Recovered
image
counts
%
Error
64 × 64
A 192949 213875 20926 10 240084 267234 27150 10 346422 407795 61373 15 390759 462860 72101 16
B 65258 76903 11645 15 78780 93021 14241 15 197 776 229 197 31421 14 260472 325672 65200 20
C 15325 20711 5386 26 18422 24741 6319 26 66542 84158 17616 21 70601 96790 26189 27
128 ×
128
A 174021 186517 12496 7 169622 192360 22738 12 275178 307153 31975 10 375270 428688 53418 12
B 62539 72392 8688 12 71925 85785 13860 16 193119 220034 26915 12 239129 287443 48314 17
C 14421 18615 4194 23 15640 20629 4989 24 55820 69220 13400 19 71308 91347 20039 22
256 ×
256
A 163158 174629 11471 7 160835 180636 19801 10 255314 282114 26800 9 341031 385340 44309 11
B 55743 62354 6611 11 67531 76156 8625 11 189172 217800 28628 13 214623 253114 38491 15
C 12875 15959 3084 19 15837 19779 3942 20 50297 62545 12248 20 63341 77363 14022 18
512 ×
512
A 128 516 136 814 8298 6 142254 153662 11408 8 225172 242169 16997 7 297482 328737 31255 10
B 48499 53801 5302 10 62846 69023 6177 9 165702 187918 22216 12 194 190 218990 24800 11
C 10821 13277 2456 18.8 11492 14607 3115 21 45208 52404 7196 14 58341 68441 10100 15
1024 ×
1024
A 77965 82069 4103 5 95706 103226 7520 7 182 182 192 726 10544 5 264201 287245 23044 8
B 24444 28547 2712 9.5 45339 49504 3165 8 134098 148987 14889 10 165971 184203 18232 10
C 6094 7446 1352 18 11256 12795 1539 12 37758 42338 4580 11 53465 60213 6748 11

Optimum Planar Imaging Parameters for Small Structures Mpumelelo Nyathi
Iran J Med Phys, Vol. 14, No. 4, December 2017
223
Table 2. Signal-to-noise ratio values for the images of the spheres A, B, and C acquired when filled with various activity concentrations in different matrix sizes
Matrix size
(pixels)
Sphere Volume
(ml)
Activity Concentration in sphere 74 kBq/ml
Activity Concentration in sphere 150 kBq/ml
Activity Concentration in sphere 150 kBq/ml
Activity Concentration in sphere 300 kBq/ml
ROI 2 image counts
SNR
ROI 2 image counts
SNR
ROI 2 image
counts
SNR
ROI 2 image
Counts
SNR
64 × 64
A 213875 462 267234 517 407795 639 462860 750 B 76903 277 93021 305 229 197 485 325672 571 C 20711 144 24741 157 84158 290 96790 317
128 ×
128
A 186517 432 192360 439 307153 563 428688 647 B 72392 269 85785 275 220034 513 287443 545 C 18615 136 20629 144 69220 263 91347 302
256 ×
256
A 174629 418 180636 425 282114 531 385340 621 B 62354 250 76156 294 217800 467 253114 503 C 15959 126 19779 141 62545 239 77363 280
512 ×
512
A 136 814 370 153662 392 242169 492 328737 556 B 53801 232 69023 263 187918 433 218990 479 C 13277 115 14607 121 52404 229 68441 262
1024 ×
1024
A 82069 286 103226 321 192 726 439 287245 554 B 28547 169 49504 222 148987 386 184203 429 C 7446 86 12795 113 42338 206 60213 224
Figure 3. Relationship between photon counts and matrix size
Figure 4. Variation of signal-to-noise ratio with matrix size
Selection of Optimal Imaging Parameters The imaging parameters considered as optimum
for planar imaging of the small structures with diameters less than 2-3 times the resolution of the gamma camera established in this study were found to be a matrix size of 128 × 128 pixels and technetium-99m solution of an activity concentration
of 300 kBq/mL, which provided a high SNR. These findings were inferred from a graphical analysis of the experimental results presented in tables 1 and 2.
First Parameter: Matrix Size The relationship between photon count and
matrix size is presented in Figure 3. It can be noted in this diagram that an increase in the matrix size leads to enhanced spatial resolution and image

Mpumelelo Nyathi Optimum Planar Imaging Parameters for Small Structures
Iran J Med Phys, Vol. 14, No. 4, December 2017
224
detail. However, this will be at the expense of SNR since a smaller pixel will have less mean photon count (Figure 4).
Second Parameter: Acceptable Signal-To-
Noise Ratio (SNR) A close observation of Figure 4 exhibits that the
maximum value of SNR was achieved when using a matrix size of 64 × 64 pixels. However, the SNR decreases with the increase in matrix size (Figure 4). The SNR plays a significant role in the selection of the optimal matrix size for imaging small structures with diameters less than 2-3 times the resolution of the gamma camera. The bigger the pixel size, the more photons are accommodated and the less noisy the image [6, 15]. However, the choice of matrix size is also hinged upon spatial resolution, hence the need of a compromise between the improvement of spatial resolution and the desire to increase the SNR. This compromise was found to be offered by a matrix
size of 128 × 128 pixels. The smaller the pixel size, the better the spatial resolution. The spatial resolution is expressed in terms of the FWHM [15]. However, the use of a bigger matrix size resulted in an increase in image noise, which in turn, resulted in loss of information needed for visual interpretation.
Third Parameter: Activity Concentration of
99mTc Solution A concentration of 300 kBq/mL was found to be
ideal for imaging the structures with diameters 2-3 times the resolution of the gamma camera. Technetium-99m solution of the activity concentration of 300 kBq/mL does not affect the physiology of the organ understudy. However, when choosing the activity concentration, ‘the physician should benefit, not harm the patient’ [44], hence the need of choosing an activity concentration that does not burden the patient with radiation.
Figure 5. Relationship between signal-to-noise ratio and activity concentration
Discussion Nuclear Medicine is a diagnostic and therapeutic
medical discipline [3]. In order to achieve its goals, either a small quantity of a radioisotope is introduced into the human body intravenously or by ingestion or inhalation, which targets either the organ understudy or the tumour to be eradicated [3, 20, 45, 46]. Planar images acquired by the gamma camera are then quantified to provide a numerical value that can help with the diagnosis of a patient’s problem or that can be used to detect whether or not tumours are responding to radiation therapy. However, if the imaged structures have diameters less than 2-3 times the resolution of the gamma camera, accurate quantification of their images was found to be hindered by the limited spatial resolution of the gamma camera and the image noise inherent to low photon count. In order to boost quantitative accuracy, our study established that the following planar imaging parameters should be used: a matrix size of 128 × 128 pixels and technetium-99m of activity concentration of 300 kBq/mL. The structures used in this study were custom-made
using the spheres A, B, and C (with diameters of 16 mm, 12 mm, and 11 mm, respectively).
Our study established that limited spatial resolution of the imaging system caused activity counts to blur through the walls of the spheres A, B, and C, resulting in underestimation of the regional distribution and ultimate failure to accurately quantify their images using ROI 1. However, the use of ROI 2 as proposed by Nyathi et al. [30] made it possible to accurately quantify the PVEs, thereby recovering the image counts that were apparently ‘lost’ due to spread of activity caused by the PVEs phenomenon. The columns 5, 9, 13, and 17 denoted ‘recovered image counts’; Table 1 shows that the PVEs phenomenon indeed influenced the spread of activity. A closer analysis of the columns 6, 10, 14, and 18 (Table 1) revealed that as the size of the spheres decreased in the order of A, B, and C, the quantification errors increased regardless of the matrix size used to acquire the image.
The quantification errors registered on the images acquired on 64 ×64 pixels (Table 1, column 6) were found to be 10%, 15%, and 26% for images

Optimum Planar Imaging Parameters for Small Structures Mpumelelo Nyathi
Iran J Med Phys, Vol. 14, No. 4, December 2017
225
of the spheres A, B, and C, respectively, thus confirming that as the size of the imaged sphere decreased, the quantification errors elevated. This trend was observed for all the quantified images of the spheres regardless of the size of the acquisition matrix and the targeted activity concentration filled in the spheres during imaging (columns 6, 10, 14, and 18; Table 1). These findings confirmed that as the dimensions of the structure decreased reduced, accurate quantification became compromised due to the resolution limitation of the gamma camera. These findings concur with the results established in previous studies [18-21, 30] showing that the limited spatial resolution of the gamma camera leads to blurred activity, when imaging structures with diameters less than 2-3 times the resolution of the gamma camera results, in underestimation of the regional distribution in the structure.
Our study further established that the quantitative errors caused by the limited spatial resolution could be reduced by enhancing spatial resolution via increasing the acquisition matrix. An expansion in the acquisition matrix from 64 × 64 pixels to 128 × 128 pixels resulted in the reduction of quantification errors from 10%, 15%, and 26% for the spheres A, B, and C to 7%, 12%, and 23%, respectively. This trend was observed for all the quantified images acquired in bigger matrix sizes regardless of the targeted activity concentration filled in the spheres during imaging (columns 6, 10, 14, and 18; Table 1). These findings confirmed that increasing spatial resolution could lower the quantitative errors introduced by limited spatial resolution of the gamma camera.
The current results demonstrated that the gain in spatial resolution via increase in matrix size was overshadowed by reduction in photon count (Figure 3), thus rendering noisy images. The calculated SNRs for images acquired on larger matrix sizes (Table 2; columns 4, 6, 8, and 10) decreased significantly (Figure 4), an indication that images become noisy as a result of improving spatial resolution.
The presence of image noise is known to obscure essential diagnostic information [3, 4, 47]. In order to achieve accurate quantification of nuclear medicine images; therefore, a compromise between the attempt to improve spatial resolution and acquiring noise-free images is paramount. Image noise and spatial resolution are two intertwined image-degrading factors [3, 47]; we found that any attempt to improve one is accompanied by degradation of the other.
Acquiring images on 64 × 64 pixels was found to yield high photon count (Figure 3) resulting in high SNR values. However, the images acquired on this matrix size had lower resolution compared to those acquired on 128 ×128 pixels. Since the goal was to
improve spatial resolution, the matrix size of choice was found to be 128 × 128 pixels (Figure 4). Although this matrix size resulted in a lower SNR than 64 × 64 pixels, spatial resolution was improved. Furthermore, the matrix size of 128 × 128 pixels yielded images with a higher SNR (Figure 4) compared to those acquired in bigger matrix sizes, which offered improved resolution. The selection of an optimum matrix size was found to be crucial to strike a compromise between improvement in spatial resolution and reduction of image noise. In this study, the ideal matrix size was found to be 128 ×128 pixels. This matrix size strikes a balance between improvement in spatial resolution and maintaining a relatively high value of SNR. These findings confirmed the results of previous studies establishing that nuclear medicine images with
photon deficiency have a low SNR, ( NSNR )
[6, 15, 41, 42]. Falk et al. (2007) [25] stated that noisy nuclear
medicine images are blurred, thus making them difficult to diagnose at the edges. Additionally, image noise conceals the important quantitative information desired by clinicians [3, 47]. The quality of noisy images is therefore poor [3]. In order to enhance the quality of these images, this study proposed acquiring them using the optimum parameters we have established. These parameters will make it possible to remove the blur and reduce the noise from the acquired images. Previous studies have established that image noise and spatial resolution are intertwined [3, 6, 7, 9, 47], hence the need of a trade-off between the two phenomenon in planar imaging. The matrix size of 128 × 128 pixels was found to be ideal for the acquisition of planar images of good quality. For the matrix sizes larger than 128 × 128 pixels, SNR diminished (Table 2 and Figure 4), resulting in increased image degradation.
Lastly, a study also established that in planar imaging, the image noise level is a function of the administered activity (Figure 5), in addition to the already established factors, namely crystal thickness, the type of collimator used, and the energy window selected [3]. Technetium-99m solution of an activity concentration of 300 kB/mL was found to be ideal for planar imaging of the structures with diameters less than 2-3 times the resolution of the gamma camera (Figure 5). This activity concentration provided a high SNR. Furthermore, the images acquired using this activity concentration were of high quality. Any attempt to elevate the value beyond 300 kBq/mL would burden the patient with dose and would not be in line with the as low as reasonable achievable (ALARA) principle [48]. In support of this principle, Grammaticos and Fountos, (2006) [44] expressed that physicians should always aim at benefiting the patient. Therefore, any objective to

Mpumelelo Nyathi Optimum Planar Imaging Parameters for Small Structures
Iran J Med Phys, Vol. 14, No. 4, December 2017
226
acquire a good quality image must not supersede the patient’s safety.
The established planar imaging parameters have a wide range of applications in salivary gland scintigraphy and monitoring tumour response to radiation therapy. Previous salivary scintigraphy studies used a range of matrix sizes to acquire salivary gland images either for semi-quantitative or qualitative evaluation of their function [11-14]. Among the parameters used were the matrix sizes of 64 × 64, 128× 128, and 256 × 256 pixels [12, 14, 16]. It can be concluded from this study that the matrix size of 128× 128 pixels is ideal since it provided a compromise between improvement in the spatial resolution and the image degradation caused by low photon count, thus minimizing the impact of partial volume effects. On the other hand, the use of 64 ×64 pixels to acquire images increased the photon count per pixel [15], but on the other hand, it resulted in a pronounced impact of spill-out effects (Table 1). In this case, quantification errors were bound to increase despite the increase in SNR (Figure 4).
Clinicians and technologists who performed salivary gland scintigraphy on a matrix size of 256 × 256 pixels managed to improve spatial resolution, thus successfully reducing PVEs. However, this approach brings in yet another problem of image noise. The image noise impairs visualisation of discrete signals required for generation of images, hence hindering accurate qualitative and quantitative assessment of images [47]. A matrix size of 256 × 256 pixels, therefore, registers a low SNR compared to the matrix size of 64 × 64 pixels as evidenced by the results from the phantom experiments (Table 2 and Figure 4); acquiring salivary gland images on the matrix size 256 × 256 pixels leaves the images degraded by image noise. Noise results in poor image quality and bias in quantification. This brings us to the conclusion that the count rates per second on parotid and submandibular glands acquired on the 256 × 256 pixels matrix size are not precise despite the improved spatial resolution. The images remain noisy due to photon deficiency, hence the need for a trade-off between improvement in spatial resolution and image noise to achieve accurate quantitative results whilst executing semi-quantitative methods.
Conclusion Accurate quantification of planar images of the
structures with dimensions less than 2-3 times the resolution of the gamma camera can be achieved if their images are acquired using the optimum imaging parameters. In this study, the optimal imaging parameters were found to be a matrix size of 128 × 128 pixels and 99mTc solution of an activity concentration of 300 kBq/mL. The matrix size of
128 × 128 pixels was found to be ideal since it showed a good trade-off between image noise and spatial resolution degradation. An activity concentration of 300 kBq/ml was also found to be ideal since it decays, giving a high density of photons to irradiate the gamma camera crystal. Furthermore, this activity concentration is unlikely to cause a significant radiation burden to the patient.
Acknowledgements The authors would like to thank Dr George
Mukhari Academic Hospital for giving us the permission to use their Siemens E-Cam dual-head gamma camera for this study.
References
1. Dugonjić S, Stefanović D, Đurović B, Spasić-Jokić V, Ajdinović1 B. MD. Evaluation of diagnostic parameters from parotid and submandibular dynamic salivary glands scintigraphy and unstimulated sialometry in Sjögren’s syndrome. Hell J Nucl Med 2014; 17(2): 116-22.
2. Konstantinidis I, Tsakiropoulou E, Chatziavramidis A, Iakovou I. Scintigraphic detection of a parotid salivary gland malfunction, in chronic sialolithiasis and fat infiltration with no risk factors. Hell J Nucl Med 2014; 17(1): 49-51.
3. IAEA. Quantitative nuclear medicine imaging concepts, requirements and methods. Report 9. 2014; 79 pages.
4. Buvat I. Quantification in emission tomography: challenges, solution, and performance. Nucl Instr Meth Phys Res. 2007; 10-3.
5. Bushberg JT, Seibert JA, Leidholdt EM, Boone JM. The Essentials of Medical Physics Imaging. 3rd ed. Philadelphia: Lippincott Williams & Wilkins; 2012.
6. Wernick MN, Aarsvold JN. Emission Tomography, The fundamentals of Pet and Spect Imaging. Oxford: Elsevier Academic Press; 2004.
7. Powsner RA, Powsner ER. Essential Nuclear Medicine Physics. Oxford: Blackwell Publishing Ltd; 2006.
8. Rabillota CC. Emission Tomography: SPECT and PET. Computations y Sistemas. 2004; 7(3): 167-74.
9. Sydoff M. Quantification methods for clinical studies in nuclear medicine. Lund University. 2013; 22-50.
10. Mittra ES, Goris ML, Iagaru AH, Kardan A, Burton L, Berganos R, et al. Pilot pharmacokinetic and dosimetric studies of (18)F-FPPRGD2: a PET radiopharmaceutical agent for imaging α(v)β(3) integrin levels. Radiology. 2011; 260:182–91.
11. Loutfi I, Nair MK, Ebrahim AK. Salivary Gland Scintigraphy: The Use of Semi quantitative Analysis for Uptake and Clearance. Nucl Med Technol. 2003; 31:81-5.
12. Klutmann S, Bohuslavizki, Kroger, Bleckmann C,Bremer W,Mester J, Clausen M. Quantitative Salivary Gland Scintigraphy. J Nucl Technol. 1999; 27:20-6.
13. Preethi BLG, Ulla I, Bhaskar V, Suresh KP, Naveen T. Assessment of parotid salivary gland function in head and neck tumours receiving radiation therapy

Optimum Planar Imaging Parameters for Small Structures Mpumelelo Nyathi
Iran J Med Phys, Vol. 14, No. 4, December 2017
227
of head and neck cancer patients receiving radiation therapy using quantitative salivary gland scintigraphy. Pak J Physiol. 2011;7:1.
14. Orsal E, Seven B, Keles, A, Canyaka E, Ozkan O. Assessment of salivary gland function in patients after successful kidney transplantation using 99mTc- pertechnetate salivary gland scintigraphy. Hell J Nucl. 2013; 16:107-10.
15. Bushberg JT, Seirbert JA, Leidholdt EM, Boone JM. The Essential Physics of Medical Imaging. Baltimore, Maryland: Williams and Wilkins; 2002.
16. Karpetas GE, Michail CM, Fountos G et al. A new PET resolution measurement method through Monte Carlo simulations. Nucl Med Com. 2014; 35(9):967-76.
17. Fountos G P, Michail C M, Zanglis A et al. A novel easy-to-use phantom for the determination of MTF in SPECT scanners. Med Phys. 2012; 39(3):1561-70.
18. Elarndson K, Thomas B, Dickson Hutton BF. Partial Volume correction in SPECT reconstruction with OSEM. Nucl Instrum Methods. 2011; 646:S85-S8.
19. Frey EC, Humm JL, Ljungberg M. Accuracy and Precision of Radioactivity Quantification in Nuclear Medicine Images. Semin Nucl Med. 2012;42(3):208-18.
20. Miguel A. Zisserman AP, Brady M. Estimation of the partial volume effect in MRI. Med Image Anal. 2002; 6:389-405.
21. Elanderson K, Buvat I, Pretorious PH, Thomas AB Hutton BF. A review of partial volume correction techniques for emission tomography neurology, cardiology and oncology and their applications. Phys Med Biol. 2012; 57: R119-R59.
22. Buvat I. Partial volume effect issue: Instrumental and biological components. Taormina workshop. 2012; Aug 31; Orsay, France.
23. Rousset OG, Ma Y, Evans AC. Correction of Partial Volume effect in PET: Principle and Validation. J Nucl Med. 1998; 39: 904-11.
24. Erlandsson K, Hutton BF. Partial Volume Correction in SPECT Using Anatomical Information and Iterative FBP. Tsinghua Sci Technol. 2010; 15:50-5.
25. Fakhri GEL, Buvat I, Benali H, Todd-Pokropek A, Di Paola R. Relative Impact of Scatter, Collimator Response, Attenuation, and Finite Spatial Resolution Corrections in Cardiac SPECT. J Nucl Med. 2000; 41:1400-8.
26. Yang J. Huang S, Mega M. Investigating partial Volume Correction Methods for Brain FDG PET studies. IEEE Trans Nucl Sci. 1996; 43:3322-7.
27. Melter CC, Leal JP, Mayberg HS. Correction of PET data for Partial Volume effects on Human Celebrex by MR imaging. J. Compt Asst Tomogr. 1990; 12: 561-70.
28. Teo BK, Seo Y, Bacharach SL, Carrasquillo JA, Libutti SK, Shukla H, Hasegawa BH, Hawkins RA, Franc BL. Partial Volume correction in PET: Validation of an Iterative Post reconstruction Method with Phantom and Patient Studies. J Nucl Med. 2007; 48: 802-10.
29. Pretorious PH, Kings MA, Pan TS, de Vriest DJ, Dlick SJ, Byrne CL. Reducing the influence of partial volume effect on SPECT activity quantification with 3D modelling of spatial resolution in iterative reconstruction. Phys Med Biol. 1998; 43:407-20.
30. Nyathi M, Sithole ME, O Ramafi. Quantification of partial volumes effects in planar imaging. Iran J Nucl Med. 2016; 24(2):115-20.
31. Ritt P, Vija H, Hornegger J, Kuwert T. Absolute quantification in SPECT. Eur J Nucl Mol Imaging. 2011; 38: S69-S77.
32. Rousset O, Rahmim A, Alavi A, Zaidi H. Partial Volume Correction Strategies in PET Clin. 2007; 2: 235-49.
33. Frouin V, Comtat C, Reilhac A, Gregoire MC. Partial Volume Effect for PET Straital Imaging: Fast Implementation and Study of Robustness. J Nucl Med. 2006; 43:1715-26.
34. Soret M, Bacharach SL, Buvat I. Partial Volume Effect in PET Tumour Imaging. J Nucl Med. 2007; 48:932-45.
35. Soret M, Alaoui J, Koulbaly PM, Darcourt J, Buvat I. Accuracy of partial volume correction in clinical molecular imaging of dopamine transporter using SPECT. Nucl Instrum Methods. 571; A571:173-6.
36. Law I, Iida H, Holm S, Nour S, Rostrup E, Svarer C, Paulson OB. Quantification of Regional Cerebral Blood and Flow Corrected for Partial Volume Effect Using O-15 Water and Pet: II. Normal Values and Gray Matter Blood Flow Response to Visual Activation. J Cereb Blood Flow. Metab. 2000; 20:1252-63.
37. Pretorious PH, King MA. Diminishing the impact of partial Volume Effect in cardiac SPECT perfusion imaging. Med Phys. 2009; 36:105-15.
38. Hoetjes N, van Velden FHP, Hoekstra OS, Hoekstra CJ, Krank NC, Lammertsma AAL, Boellard R. Partial Volume Correction Strategies for Quantitative FDG PET in oncology. Eur J Nucl Med Mol Imaging. 2010; 37:1679-87.
39. Bencherif B, Stumpf M, Links JM, Frost JJ, Application for MRI-Based Partial Volume Correction to the Analysis of PET Images of µ-Opioid Receptors Using Statistical Parametric mapping. J Nucl Med. 2002; 45:402-8.
40. ImageJ software, 1.48a; Java 1.70_51 [64-bit]. [Internet]. 2015 [cited 2015 May 10]. Available from: http://imagej.net/download.html
41. Padhy AK, Groth S. The role of International Atomic Energy Agency in the promotion of nuclear medicine in developing countries. Hell J Nucl. 2001; 1:44-7.
42. Michail CM, Karpetas GE, Fountos G P, et al. A novel method for the optimization of Positron Emission Tomography Scanners Imaging Performance. Hell J Nucl Med. 2016; 19(3):231-40.
43. Karakatsanis NA, Fokou E, Tsoumpas C. Dose optimization in optimization in positron emission tomography: state-of-the-art methods and future prospects. Am J Nucl Med Mol Imaging. 2015; 5(5):527-47.
44. Grammaticos P, Fountos G. The physician should benefit, not harm the patient. Hell J Nucl Med. 2006; 9(2):82-4.
45. Liaros G, Nikolaou A, Karanto E, Daniilidis I. Contribution of Nuclear Medicine in Staging Patients with Nasopharynx and Larynx Carcinoma – A Study on 30 Patients. Hell J Nucl Med. 2000. 3: 135-8.
46. Sedaghat F, Gerasimou G, BasdanI, Christodoulou I, Gamvros O, Grammaticos P, Katsohis K. The

Mpumelelo Nyathi Optimum Planar Imaging Parameters for Small Structures
Iran J Med Phys, Vol. 14, No. 4, December 2017
228
Importance of CEA Scan Radioimmuno scintigraphy in the Diagnosis of Recurrent Colorectal Cancer. Hell J Nucl Med. 2000; 3:168-70.
47. Lyra M, Ploussi A. Filtering in SPECT Reconstruction. Int J Biomed Imaging. 2011:1-14.
48. The Optimisation of Radiological Protection - Broadening the Process. ICRP Publication 101b. Ann. ICRP. 36 (3), 2006.