Embed Size (px)
Citation preview


IRELAND’S DRAFT BUDGETARY PLAN
October 2017
IRELAND | Draft Budgetary Plan - October 2017 1
Introduction
Regulation (EU) 473/2013 of the European Parliament and of the Council (part of the so-called ‘two-
pack’) introduces a common budgetary timeline for euro area Member States. Specifically, Draft
Budgetary Plans for the forthcoming year must be submitted to the European Commission and to the
Eurogroup between the 1st and the 15th October each year.
The document herein is being submitted to the European Commission and Eurogroup in accordance
with the Regulation.
This Draft Budgetary Plan has also been laid before the Houses of the Oireachtas. It is consistent with
the 2018 Budget presented to Dáil Éireann on 10th October 2017.
The format and content of the document are in line with the requirements of the two pack Code of
Conduct which inter alia, requires macroeconomic and budgetary forecasts for the current and
forthcoming years (in this case 2017 and 2018). Pre-Budget macroeconomic forecasts for this year
and next were endorsed by the Irish Fiscal Advisory Council (IFAC), as required under article 4(4) of
the Regulation.
The analysis and forecasts contained in this document are based on data to early October. All data
presented herein are on an ESA 2010 statistical basis.

IRELAND | Draft Budgetary Plan - October 2017 2
Summary
The baseline forecast is for solid growth in the short-term, with GDP projected to increase by 3.5 per cent next year, following growth of 4.3 per cent this year1. While GDP figures can be difficult to interpret in an Irish context, a broader range of measures – labour market indicators, tax revenue developments and trends in purchasing managers indices – confirm that the economy continues to perform strongly. Employment growth of 2.3 per cent is projected for next year, the equivalent of 48,000 additional jobs. Unemployment is expected to fall in parallel, with an average unemployment rate of 5.7 per cent expected. Inflationary pressures are set to remain muted reflecting inter alia the recent appreciation of the euro-sterling bilateral rate which will dampen import prices. Having said that, if sustained, euro appreciation will undermine Irish competitiveness and lower exports next year, given the lagged impact of exchange rate developments on the real economy. Determined policy implementation has helped move the public finances into a much healthier position. A headline general government deficit of 0.3 per cent of GDP is expected this year, with a further narrowing of the deficit to 0.2 per cent of GDP next year. The debt-to-GDP ratio continues to decline, and is projected to be 69 per cent by end-2018. An improvement of 0.6 per cent of GDP in the structural deficit is envisaged for 2018, consistent with the requirements of the preventive arm of the Stability and Growth Pact. This will result in the achievement of the Medium Term Budgetary Objective of a structural deficit of 0.5 per cent of GDP.
1 The Macroeconomic forecasts contained in this document were produced by the Department of Finance and subsequently
endorsed by the Irish Fiscal Advisory Council on the 29th of September 2017.
IRELAND | Draft Budgetary Plan - October 2017 3
Section 1 Economic Developments and Outlook
Macroeconomic Outturn 2017 GDP is forecast to increase by 4.3 per cent this year, a projection which, in aggregate terms, is unchanged relative to the Department’s last forecast published in the spring. Positive contributions from both underlying domestic demand – that is excluding the volatile components of investment – and net exports are expected for this year. The level of GNP is expected to be broadly unchanged this year. Consumer spending is assumed to increase by 2.3 per cent this year, as solid employment growth, wage increases and low inflation continue to support real household disposable income. The recovery in investment is forecast to continue this year, although the headline figure is distorted by the assumption that intangible investment falls relative to last year’s exceptionally high level. Building and construction spending is expected to drive growth in underlying investment this year, with significant increases in both residential and non-residential spending. Exports of goods and services are forecast to grow by 3.5 per cent this year with contract manufacturing – exports of goods produced abroad under contract from an Irish-based entity – continuing to act as a significant drag on the headline figures, as has been the case in the first half of the year. On an underlying basis – that is after excluding exports associated with contract manufacturing – exports are expected to perform strongly once again this year, driven by robust merchandise exports and, in particular, double-digit growth in service exports. Imports of goods and services are projected to decline this year reflecting, inter alia, a reduction in aircraft imports as well as the assumption of a significant fall in intellectual property imports (the counter-part to the assumed fall in intangible investment). Macroeconomic Projections 2018 The external situation is somewhat of a mixed bag at present. The pace of growth in some key export
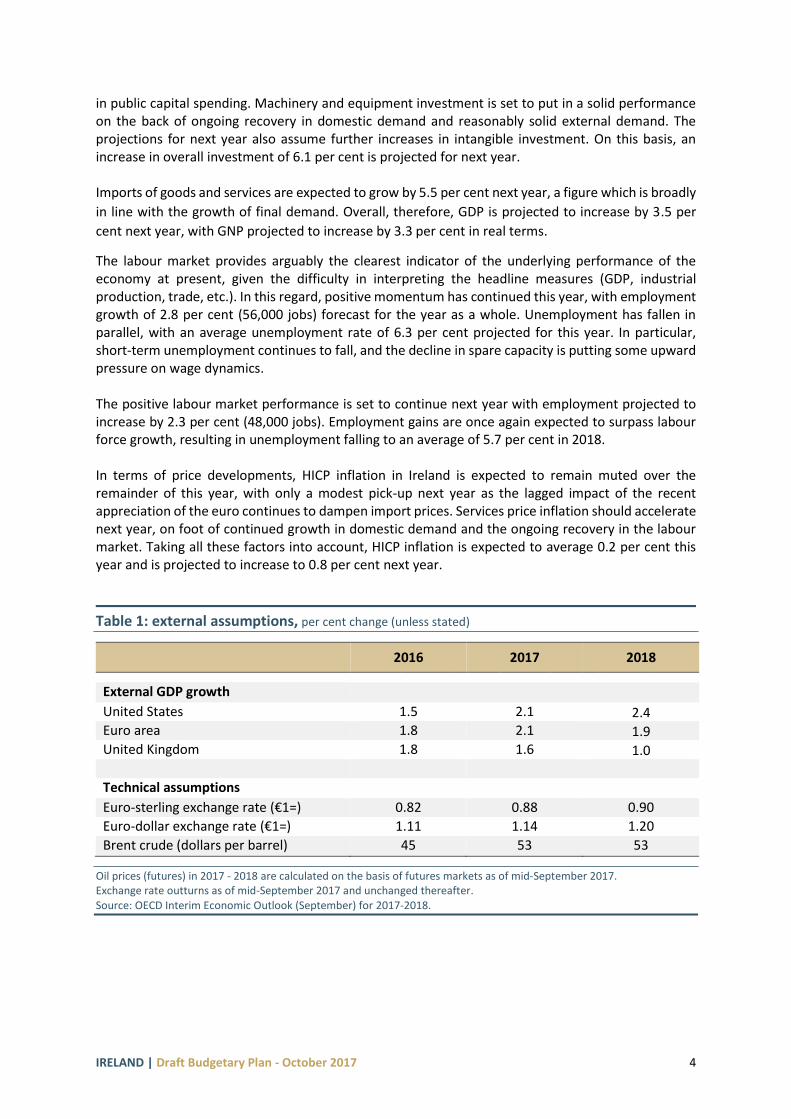
markets is accelerating, most notably in the euro area where the cyclical recovery has gained
momentum this year and where real GDP per capita looks set to finally surpass its level immediately
preceding the crisis. On the other hand, the probability of a policy-induced stimulus in the US economy
is fading, while incoming data suggest a marked slowdown is underway in the UK economy.
Projections for growth in key external markets are presented in table 1
Against this background, headline exports are expected to increase by 4.8 per cent next year. Crucially, this forecast is based on the assumption that exports linked to contract manufacturing activity no longer weigh on overall exports. On an underlying basis, export growth is projected to decelerate next year reflecting inter alia unfavourable exchange rate developments and a moderation in service exports from the double-digit growth recorded in recent quarters. Domestic demand is projected to drive growth next year with strong contributions from consumption and, in particular, investment spending. Consumer spending is forecast to increase by 2.3 per cent. Household income is projected to continue to strengthen driven primarily by gains in labour income, with employment and wage growth expected to remain relatively strong. Investment spending is projected to accelerate next year, with broad-based growth across all components. Building and construction spending is projected to record double-digit growth once again driven by increases in house completions – albeit from still relatively low levels – and a pick-up
IRELAND | Draft Budgetary Plan - October 2017 4
in public capital spending. Machinery and equipment investment is set to put in a solid performance on the back of ongoing recovery in domestic demand and reasonably solid external demand. The projections for next year also assume further increases in intangible investment. On this basis, an increase in overall investment of 6.1 per cent is projected for next year. Imports of goods and services are expected to grow by 5.5 per cent next year, a figure which is broadly
in line with the growth of final demand. Overall, therefore, GDP is projected to increase by 3.5 per
cent next year, with GNP projected to increase by 3.3 per cent in real terms.
The labour market provides arguably the clearest indicator of the underlying performance of the economy at present, given the difficulty in interpreting the headline measures (GDP, industrial production, trade, etc.). In this regard, positive momentum has continued this year, with employment growth of 2.8 per cent (56,000 jobs) forecast for the year as a whole. Unemployment has fallen in parallel, with an average unemployment rate of 6.3 per cent projected for this year. In particular, short-term unemployment continues to fall, and the decline in spare capacity is putting some upward pressure on wage dynamics. The positive labour market performance is set to continue next year with employment projected to increase by 2.3 per cent (48,000 jobs). Employment gains are once again expected to surpass labour force growth, resulting in unemployment falling to an average of 5.7 per cent in 2018. In terms of price developments, HICP inflation in Ireland is expected to remain muted over the remainder of this year, with only a modest pick-up next year as the lagged impact of the recent appreciation of the euro continues to dampen import prices. Services price inflation should accelerate next year, on foot of continued growth in domestic demand and the ongoing recovery in the labour market. Taking all these factors into account, HICP inflation is expected to average 0.2 per cent this year and is projected to increase to 0.8 per cent next year.
Table 1: external assumptions, per cent change (unless stated)
2016 2017 2018
External GDP growth
United States 1.5 2.1 2.4 Euro area 1.8 2.1 1.9 United Kingdom 1.8 1.6 1.0
Technical assumptions
Euro-sterling exchange rate (€1=) 0.82 0.88 0.90
Euro-dollar exchange rate (€1=) 1.11 1.14 1.20
Brent crude (dollars per barrel) 45 53 53
Oil prices (futures) in 2017 - 2018 are calculated on the basis of futures markets as of mid-September 2017. Exchange rate outturns as of mid-September 2017 and unchanged thereafter. Source: OECD Interim Economic Outlook (September) for 2017-2018.
IRELAND | Draft Budgetary Plan - October 2017 5
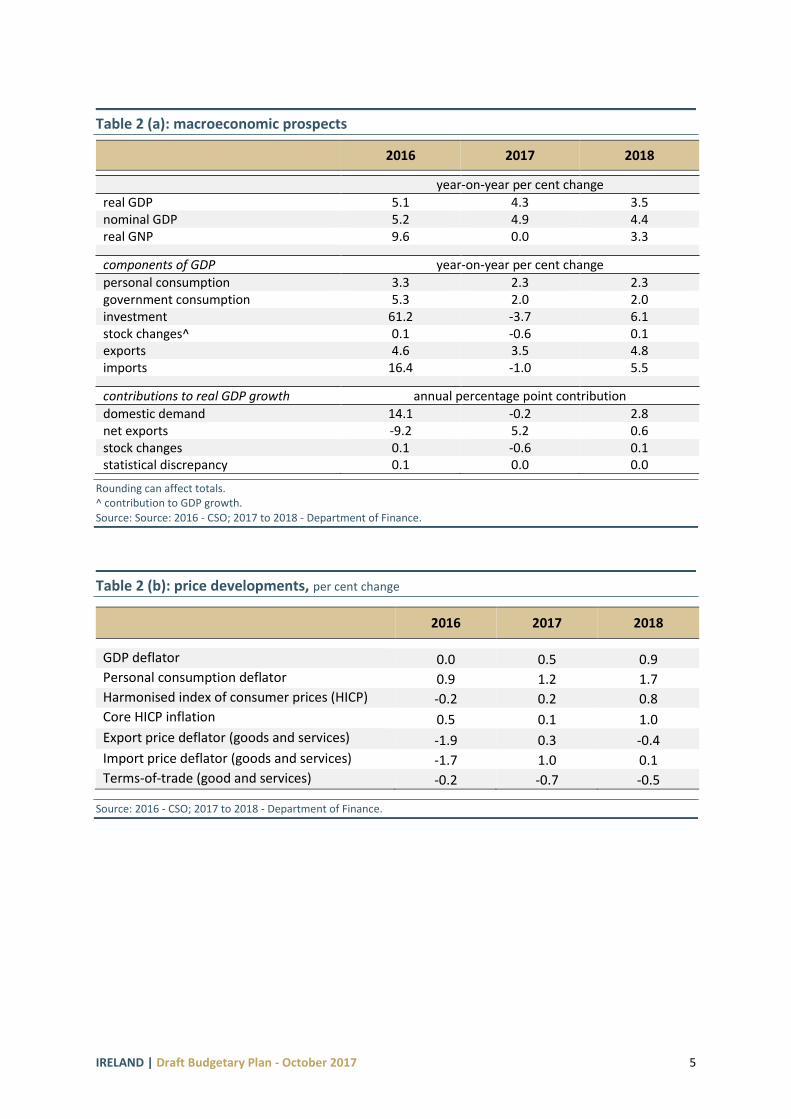
Table 2 (a): macroeconomic prospects
2016 2017 2018
year-on-year per cent change
real GDP 5.1 4.3 3.5 nominal GDP 5.2 4.9 4.4 real GNP 9.6 0.0 3.3
components of GDP year-on-year per cent change
personal consumption 3.3 2.3 2.3 government consumption 5.3 2.0 2.0 investment 61.2 -3.7 6.1 stock changes^ 0.1 -0.6 0.1 exports 4.6 3.5 4.8 imports 16.4 -1.0 5.5
contributions to real GDP growth annual percentage point contribution
domestic demand 14.1 -0.2 2.8 net exports -9.2 5.2 0.6 stock changes 0.1 -0.6 0.1 statistical discrepancy 0.1 0.0 0.0
Rounding can affect totals. ^ contribution to GDP growth. Source: Source: 2016 - CSO; 2017 to 2018 - Department of Finance.
Table 2 (b): price developments, per cent change
2016 2017 2018
GDP deflator 0.0 0.5 0.9 Personal consumption deflator 0.9 1.2 1.7 Harmonised index of consumer prices (HICP) -0.2 0.2 0.8 Core HICP inflation 0.5 0.1 1.0 Export price deflator (goods and services) -1.9 0.3 -0.4 Import price deflator (goods and services) -1.7 1.0 0.1 Terms-of-trade (good and services) -0.2 -0.7 -0.5
Source: 2016 - CSO; 2017 to 2018 - Department of Finance.
IRELAND | Draft Budgetary Plan - October 2017 6
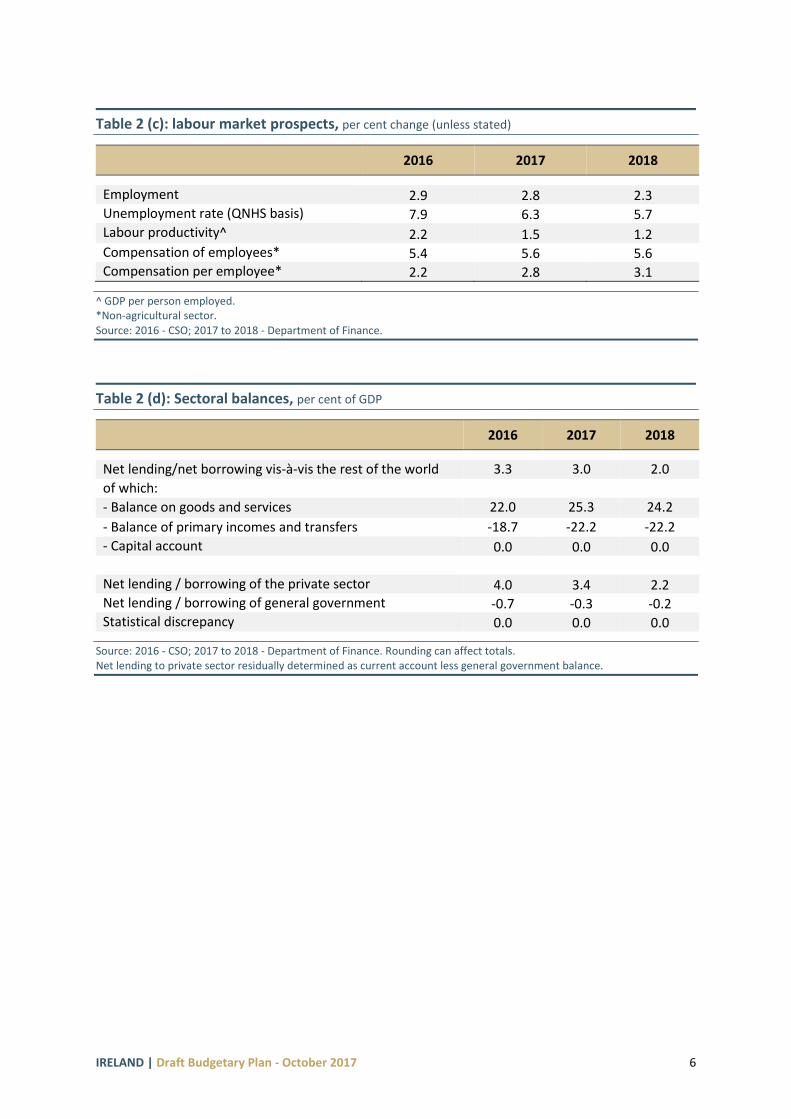
Table 2 (c): labour market prospects, per cent change (unless stated)
2016 2017 2018
Employment 2.9 2.8 2.3 Unemployment rate (QNHS basis) 7.9 6.3 5.7 Labour productivity^ 2.2 1.5 1.2 Compensation of employees* 5.4 5.6 5.6 Compensation per employee* 2.2 2.8 3.1
^ GDP per person employed. *Non-agricultural sector. Source: 2016 - CSO; 2017 to 2018 - Department of Finance.
Table 2 (d): Sectoral balances, per cent of GDP
2016 2017 2018
Net lending/net borrowing vis-à-vis the rest of the world 3.3 3.0 2.0
of which: - Balance on goods and services 22.0 25.3 24.2
- Balance of primary incomes and transfers -18.7 -22.2 -22.2
- Capital account 0.0 0.0 0.0 Net lending / borrowing of the private sector 4.0 3.4 2.2 Net lending / borrowing of general government -0.7 -0.3 -0.2 Statistical discrepancy 0.0 0.0 0.0
Source: 2016 - CSO; 2017 to 2018 - Department of Finance. Rounding can affect totals. Net lending to private sector residually determined as current account less general government balance.

IRELAND | Draft Budgetary Plan - October 2017 7
Section 2 Budgetary Developments and Outlook
For this year, tax receipts are set to grow by 5.8 per cent in year-on-year terms with growth broadly based across income, capital and consumption taxes. The deficit is forecast to continue to narrow, with a general government deficit of 0.3 per cent of GDP expected for 2017 down from 0.7 per cent in 2016. Taking account of the budgetary measures, a deficit of 0.2 per cent of GDP is forecast for 2018, which compares to a balance of 0.0 per cent on a no-policy change basis. General government revenue is expected to grow from €75,395 million in 2017 to €78,730 million in 2018, while general government expenditure is forecast to increase from €76,385 million to €79,265 million.
Table 3(a): General government budgetary targets broken down by subsector, per cent GDP (unless stated)
ESA 2016 2017 2018
Code
General government S.13 -0.7 -0.3 -0.2
Central government S.1311 -0.8 -0.3 -0.2
Local government S.1313 0.1 0.0 0.0
Social security funds S.1314 M M M
Interest expenditure D.41 2.2 2.0 1.9
Primary balance 1.6 1.7 1.7
One-off and other temporary measures 0.1 -0.1 0.0
9. Real GDP growth 5.1 4.3 3.5
10. Potential GDP growth 5.6 4.5 4.5
11. Output gap (% of potential GDP) 1.7 1.6 0.7
Cyclical budgetary component (% of potential GDP) 0.9 0.8 0.3
Cyclically-adjusted balance -1.6 -1.2 -0.5
Cyclically-adjusted primary balance 0.7 0.9 1.3
Structural balance -1.7 -1.1 -0.5
Source: CSO; 2015-2016 Department of Finance forecasts.
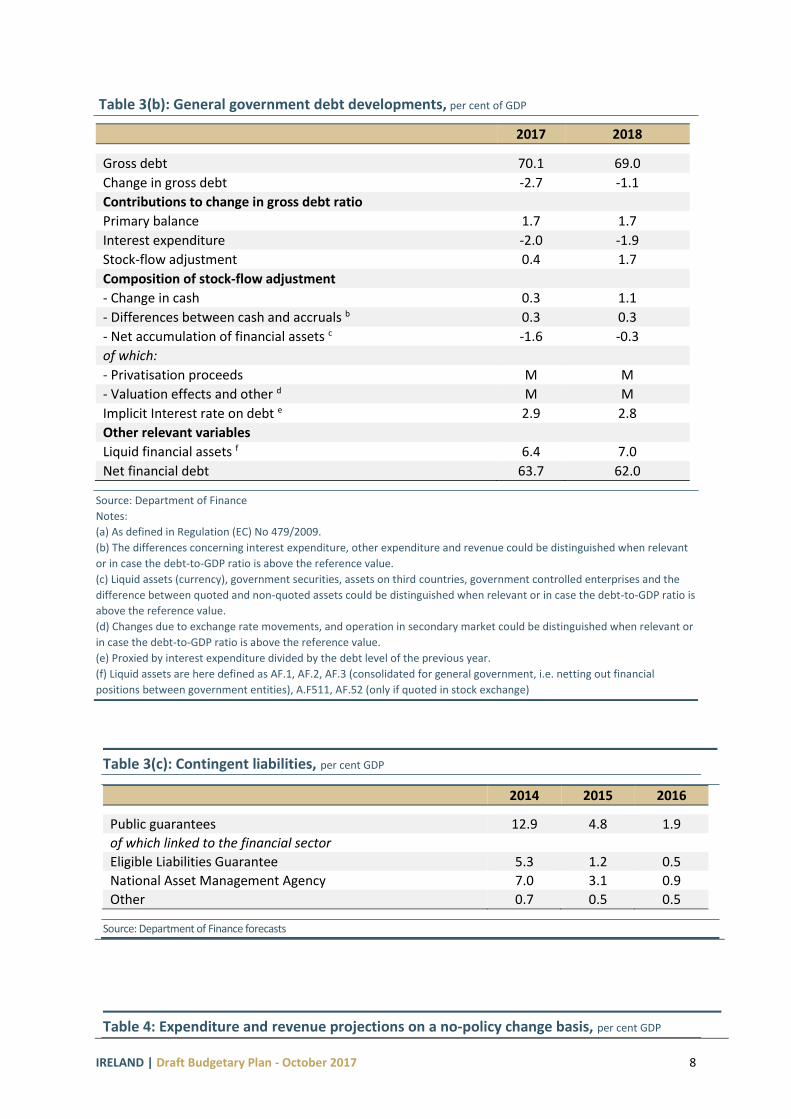
With regard to gross general government debt, the debt-to-GDP ratio peaked in 2012 at almost 120 per cent. While the significant decline in the debt ratio in 2015 is primarily due to the large revision to 2015 GDP in the July 2016 National Accounts, the downward trajectory is forecast to continue over the forecast horizon, with a debt-to-GDP ratio of 69 per cent projected for 2018. Net public indebtedness – which takes account of accumulated cash and other assets – is much lower than the gross figure at 61.2 per cent of GDP at end 2017.
IRELAND | Draft Budgetary Plan - October 2017 8
Table 3(b): General government debt developments, per cent of GDP
2017 2018
Gross debt 70.1 69.0
Change in gross debt -2.7 -1.1
Contributions to change in gross debt ratio
Primary balance 1.7 1.7
Interest expenditure -2.0 -1.9
Stock-flow adjustment 0.4 1.7
Composition of stock-flow adjustment
- Change in cash 0.3 1.1
- Differences between cash and accruals b 0.3 0.3
- Net accumulation of financial assets c -1.6 -0.3
of which:
- Privatisation proceeds M M
- Valuation effects and other d M M
Implicit Interest rate on debt e 2.9 2.8
Other relevant variables
Liquid financial assets f 6.4 7.0
Net financial debt 63.7 62.0
Source: Department of Finance
Notes:
(a) As defined in Regulation (EC) No 479/2009.
(b) The differences concerning interest expenditure, other expenditure and revenue could be distinguished when relevant
or in case the debt-to-GDP ratio is above the reference value.
(c) Liquid assets (currency), government securities, assets on third countries, government controlled enterprises and the
difference between quoted and non-quoted assets could be distinguished when relevant or in case the debt-to-GDP ratio is
above the reference value.
(d) Changes due to exchange rate movements, and operation in secondary market could be distinguished when relevant or
in case the debt-to-GDP ratio is above the reference value.
(e) Proxied by interest expenditure divided by the debt level of the previous year.
(f) Liquid assets are here defined as AF.1, AF.2, AF.3 (consolidated for general government, i.e. netting out financial
positions between government entities), A.F511, AF.52 (only if quoted in stock exchange)
Table 3(c): Contingent liabilities, per cent GDP
2014 2015 2016
Public guarantees 12.9 4.8 1.9
of which linked to the financial sector
Eligible Liabilities Guarantee 5.3 1.2 0.5
National Asset Management Agency 7.0 3.1 0.9
Other 0.7 0.5 0.5
Source: Department of Finance forecasts
Table 4: Expenditure and revenue projections on a no-policy change basis, per cent GDP

IRELAND | Draft Budgetary Plan - October 2017 9
ESA Code 2017 2018
Total revenue at unchanged policies TR 26.4 25.9
of which:
Taxes on production and imports D.2 8.5 8.4
Current taxes on income, wealth, etc. D.5 10.6 10.7
Capital taxes D.91 0.1 0.1
Social contributions D.61 4.4 4.4
Property income D.4 0.7 0.6
Other 2.1 1.7
p.m.: Tax burden (D.2+D.5+D.61+D.91-D.995) 26.4 26.1
Total expenditure at unchanged policies TE 27.1 26.1
of which:
Compensation of employees D.1 7.0 7.0
Intermediate consumption P.2 3.4 3.3
Social payments D.62 / D.632 10.3 9.9
of which unemployment benefits
Interest expenditure D.41 2.2 2.0
Subsidies D.3 0.6 0.6
Gross fixed capital formation P.51g 1.8 1.8
Capital transfers D.9 0.5 0.4
Other 1.1 1.1
Source: Department of Finance forecasts

IRELAND | Draft Budgetary Plan - October 2017 10
Table 5(a): Expenditure and revenue targets, broken down by main components, per cent GDP
ESA Code 2017 2018
Total revenue target TR 26.1 26.1
of which:
Taxes on production and imports D.2 8.5 8.5
Current taxes on income, wealth, etc. D.5 10.8 10.9
Capital taxes D.91 0.1 0.1
Social contributions D.61 4.4 4.4
Property income D.4 0.6 0.4
Other 1.7 1.8
p.m.: Tax burden 26.1 26.1
(D.2+D.5+D.61+D.91-D.995)
Total expenditure target TE3 26.4 26.3
of which:
Compensation of employees D.1 7.1 7.0
Intermediate consumption P.2 3.4 3.5
Social payments D.62, D.632
10.0 9.6
of which: unemployment benefits
Interest expenditure D.41 2.0 1.9
Subsidies D.3 0.6 0.5
Gross fixed capital formation P.51g 1.8 2.0
Capital transfers D.9 0.4 0.4
Other 1.1 1.2
Source: Department of Finance forecasts
Table 5(b): Amounts to be excluded from the expenditure benchmark, per cent of GDP (unless stated)
2016 2016 2017 2018
€billion
Expenditure on EU programmes fully matched by EU funds revenue
0.4 0.2 0.2 0.2
Cyclical unemployment benefit expenditure* -0.1 0.0 -0.2 -0.1
Effect of discretionary revenue measures** -0.8 -0.3 0.0 0.3
Revenue increases mandated by law M M M M
*The cyclical component of unemployment benefit expenditure is derived by applying a projected cost per person employed to an estimate of the unemployment gap (i.e. difference between the actual and structural unemployment rates. The latter is the estimated NAWRU consistent with the harmonised EU methodology **This captures the multi-annual impact of all discretionary revenue measures enacted in all budget announcements to date (not just those in excess of 0.05% GDP) *** M = not applicable Source: Department of Finance forecasts
IRELAND | Draft Budgetary Plan - October 2017 11
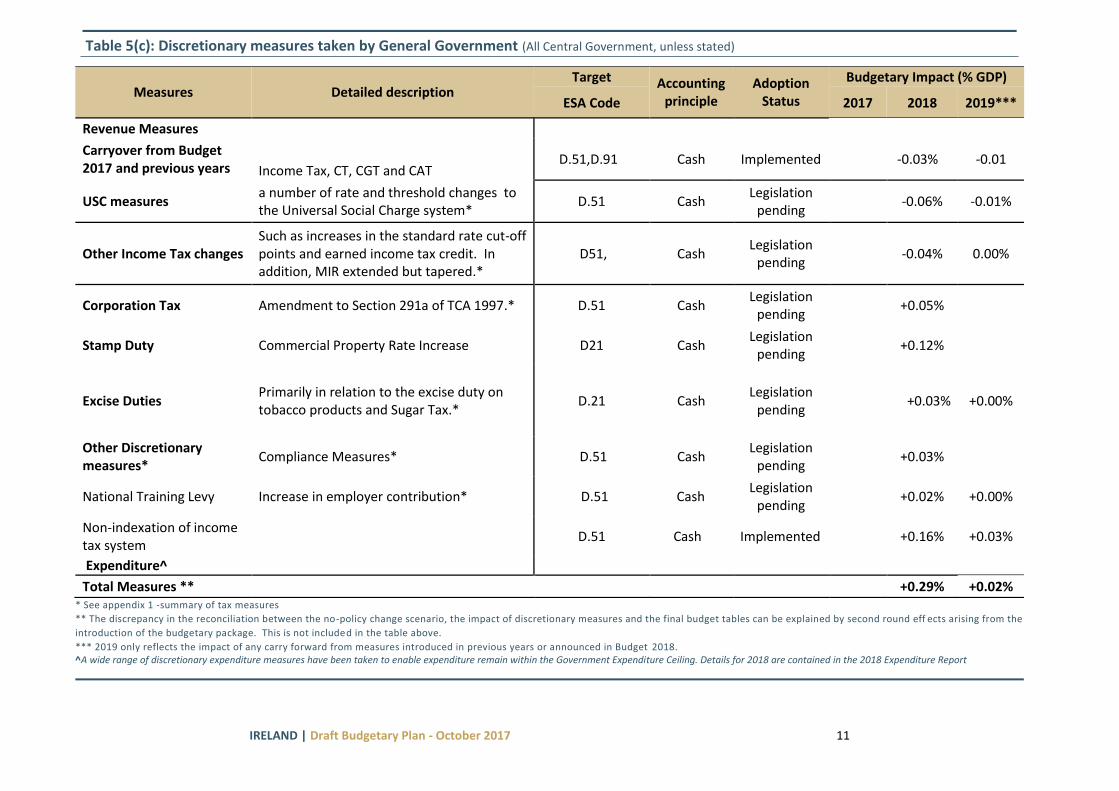
* See appendix 1 -summary of tax measures
** The discrepancy in the reconciliation between the no-policy change scenario, the impact of discretionary measures and the final budget tables can be explained by second round eff ects arising from the
introduction of the budgetary package. This is not included in the table above.
*** 2019 only reflects the impact of any carry forward from measures introduced in previous years or announced in Budget 2018. ^A wide range of discretionary expenditure measures have been taken to enable expenditure remain within the Government Expenditure Ceiling. Details for 2018 are contained in the 2018 Expenditure Report
Table 5(c): Discretionary measures taken by General Government (All Central Government, unless stated)
Measures Detailed description Target Accounting
principle Adoption
Status
Budgetary Impact (% GDP)
ESA Code 2017 2018 2019***
Revenue Measures
Carryover from Budget 2017 and previous years Income Tax, CT, CGT and CAT
D.51,D.91 Cash Implemented -0.03% -0.01
USC measures a number of rate and threshold changes to the Universal Social Charge system*
D.51 Cash Legislation
pending -0.06% -0.01%
Other Income Tax changes Such as increases in the standard rate cut-off points and earned income tax credit. In addition, MIR extended but tapered.*
D51, Cash Legislation
pending -0.04% 0.00%
Corporation Tax Amendment to Section 291a of TCA 1997.* D.51 Cash Legislation
pending +0.05%
Stamp Duty Commercial Property Rate Increase D21 Cash Legislation
pending +0.12%
Excise Duties
Primarily in relation to the excise duty on tobacco products and Sugar Tax.*
D.21 Cash Legislation
pending +0.03% +0.00%
Other Discretionary measures*
Compliance Measures* D.51 Cash Legislation
pending +0.03%
National Training Levy Increase in employer contribution* D.51 Cash Legislation
pending +0.02% +0.00%
Non-indexation of income tax system
D.51 Cash Implemented +0.16% +0.03%
Expenditure^
Total Measures ** +0.29% +0.02%
IRELAND | Draft Budgetary Plan - October 2017 12
Section 3 Comparison with April 2017 Stability Programme
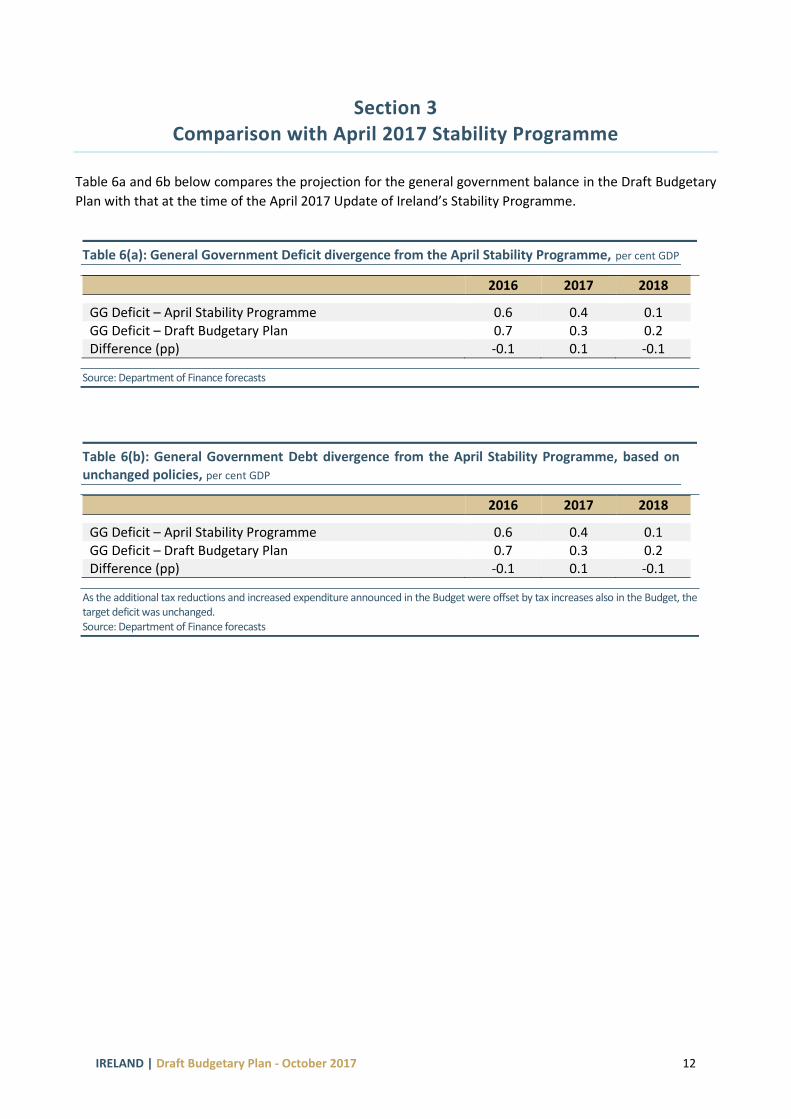
Table 6a and 6b below compares the projection for the general government balance in the Draft Budgetary
Plan with that at the time of the April 2017 Update of Ireland’s Stability Programme.
Table 6(a): General Government Deficit divergence from the April Stability Programme, per cent GDP
2016 2017 2018
GG Deficit – April Stability Programme 0.6 0.4 0.1 GG Deficit – Draft Budgetary Plan 0.7 0.3 0.2 Difference (pp) -0.1 0.1 -0.1
Source: Department of Finance forecasts
Table 6(b): General Government Debt divergence from the April Stability Programme, based on unchanged policies, per cent GDP
2016 2017 2018
GG Deficit – April Stability Programme 0.6 0.4 0.1 GG Deficit – Draft Budgetary Plan 0.7 0.3 0.2 Difference (pp) -0.1 0.1 -0.1
As the additional tax reductions and increased expenditure announced in the Budget were offset by tax increases also in the Budget, the target deficit was unchanged. Source: Department of Finance forecasts
IRELAND | Draft Budgetary Plan - October 2017 13
Section 4 Distributional impact of the main budgetary measures
Article 6(3) of Regulation 473/2013 requires Member States, where possible, to provide information (either
qualitative or quantitative) on the distributional effects of budgetary measures. Material on the Effect of
Budget 2018 Measures on Different Categories of income earners is presented in the Budget and some of it
is reflected in this section.
The full document is available at:
http://www.budget.gov.ie/Budgets/2018/Documents/Budget_2018_Tax_Policy_Changes.pdf
The Departments of Finance, Public Expenditure and Reform and Social Protection conduct distributional
assessments of proposed tax and welfare measures in line with the Government’s commitment to undertake
a Social Impact Assessment (SIA) of the Budget. An extensive volume of distributional analysis of various tax
and social welfare options has been carried out by the three Departments in the lead-up to the Budget. These
analyses are in addition to the comprehensive social impact assessment document that the Department of
Social Protection publishes in the months following the Budget.
Distributional analysis of Budget 2018 measures on a variety of household family types across a range of income levels.
The table below shows the impact on net income of changes in Income Tax and Universal Social Charge for various categories of income earners. The calculations are based on specimen incomes with the basic tax credits including the home carer tax credit, where relevant. The examples do not take account of additional tax reliefs such as Mortgage Interest Relief. The examples do not take into account gross wage increases arising from the increase to the Minimum Wage announced in Budget 2018. Variations can arise due to rounding.

IRELAND | Draft Budgetary Plan - October 2017 14
Single person, no children, private sector employee taxed under
PAYE Full rate PRSI contributor
Married couple, one income, no children,
private sector employee taxed under PAYE full rate PRSI contributor
Married couple, one income, two children,
private sector employee taxed under PAYE full rate
PRSI contributor
Single person, no children, taxed
under Schedule D
Married couple, one income, no children,
taxed under Schedule D
Married couple, one income, two
children, taxed under Schedule D
Gross Income Change as % of Net Income
€ % % % % % %
12,000 0.0 0.0 0.0 0.0 0.0 0.0
14,000 0.1 0.1 0.1 1.6 0.1 0.1
18,000 0.2 0.2 0.2 1.4 0.2 0.1
20,000 0.3 0.3 0.3 1.4 0.3 0.2
25,000 0.3 0.3 0.3 1.3 1.2 0.2
30,000 0.3 0.3 0.3 1.1 1.1 1.2
35,000 0.8 0.3 0.6 1.6 1.0 1.1
45,000 0.8 0.7 1.0 1.4 1.3 1.4
55,000 0.7 0.7 0.9 1.3 1.2 1.3
70,000 0.7 0.7 0.8 1.2 1.1 1.2
100,000 0.5 0.5 0.7 0.9 0.8 0.9
150,000 0.4 0.4 0.5 0.6 0.6 0.7
175,000 0.3 0.3 0.4 0.6 0.5 0.6

IRELAND | Draft Budgetary Plan - October 2017 15
Section 5 European Union’s Strategy for growth and jobs
The European Council adopted the following Country Specific Recommendations (CSRs) for Ireland. These
may be found at:
https://ec.europa.eu/info/publications/2017-european-semester-country-specific-recommendations-
council-recommendations_en
Table 7(a) summarises measures taken to address the CSRs.
Europe 2020 was adopted by the European Council in June 2010 and, in a nutshell, is the growth strategy
for the Union over the period to the end of this decade. The strategy is aimed at promoting smart,
sustainable and inclusive growth in the EU. Five headline targets for 2020 have been set at the level of the
EU as a whole, covering employment, research and development, climate change, education and poverty.
All EU Member states have committed to achieving Europe 2020 targets and have translated them into
national targets.
Table 7(b) shows the Irish national targets and the most important policy measures that are being taken
in order to achieve the targets set within the framework of the European Union’s Strategy for Growth and
Jobs.
IRELAND | Draft Budgetary Plan - October 2017 16
Country Specific Recommendation
Progress to Date
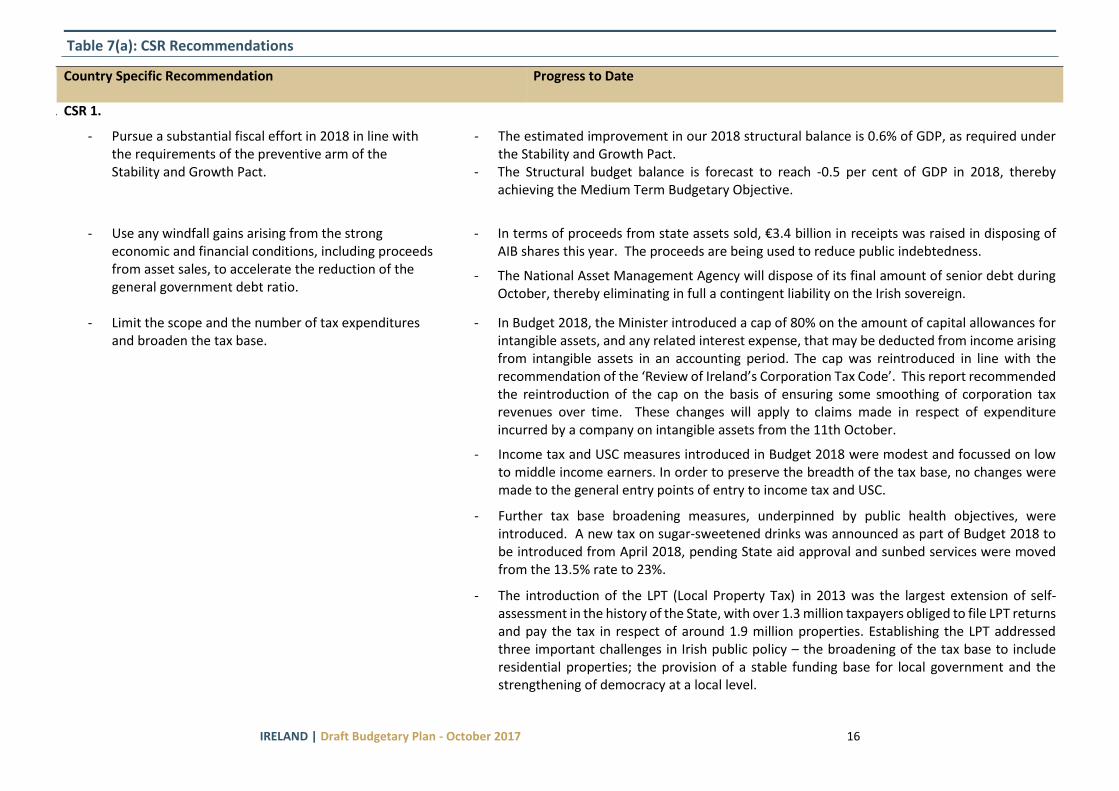
1. CSR 1.
- Pursue a substantial fiscal effort in 2018 in line with the requirements of the preventive arm of the Stability and Growth Pact.
- The estimated improvement in our 2018 structural balance is 0.6% of GDP, as required under the Stability and Growth Pact.
- The Structural budget balance is forecast to reach -0.5 per cent of GDP in 2018, thereby achieving the Medium Term Budgetary Objective.
- Use any windfall gains arising from the strong
economic and financial conditions, including proceeds from asset sales, to accelerate the reduction of the general government debt ratio.
- In terms of proceeds from state assets sold, €3.4 billion in receipts was raised in disposing of
AIB shares this year. The proceeds are being used to reduce public indebtedness.
- The National Asset Management Agency will dispose of its final amount of senior debt during October, thereby eliminating in full a contingent liability on the Irish sovereign.
- Limit the scope and the number of tax expenditures and broaden the tax base.
- In Budget 2018, the Minister introduced a cap of 80% on the amount of capital allowances for intangible assets, and any related interest expense, that may be deducted from income arising from intangible assets in an accounting period. The cap was reintroduced in line with the recommendation of the ‘Review of Ireland’s Corporation Tax Code’. This report recommended the reintroduction of the cap on the basis of ensuring some smoothing of corporation tax revenues over time. These changes will apply to claims made in respect of expenditure incurred by a company on intangible assets from the 11th October.
- Income tax and USC measures introduced in Budget 2018 were modest and focussed on low to middle income earners. In order to preserve the breadth of the tax base, no changes were made to the general entry points of entry to income tax and USC.
- Further tax base broadening measures, underpinned by public health objectives, were introduced. A new tax on sugar-sweetened drinks was announced as part of Budget 2018 to be introduced from April 2018, pending State aid approval and sunbed services were moved from the 13.5% rate to 23%.
- The introduction of the LPT (Local Property Tax) in 2013 was the largest extension of self-assessment in the history of the State, with over 1.3 million taxpayers obliged to file LPT returns and pay the tax in respect of around 1.9 million properties. Establishing the LPT addressed three important challenges in Irish public policy – the broadening of the tax base to include residential properties; the provision of a stable funding base for local government and the strengthening of democracy at a local level.
Table 7(a): CSR Recommendations
IRELAND | Draft Budgetary Plan - October 2017 17
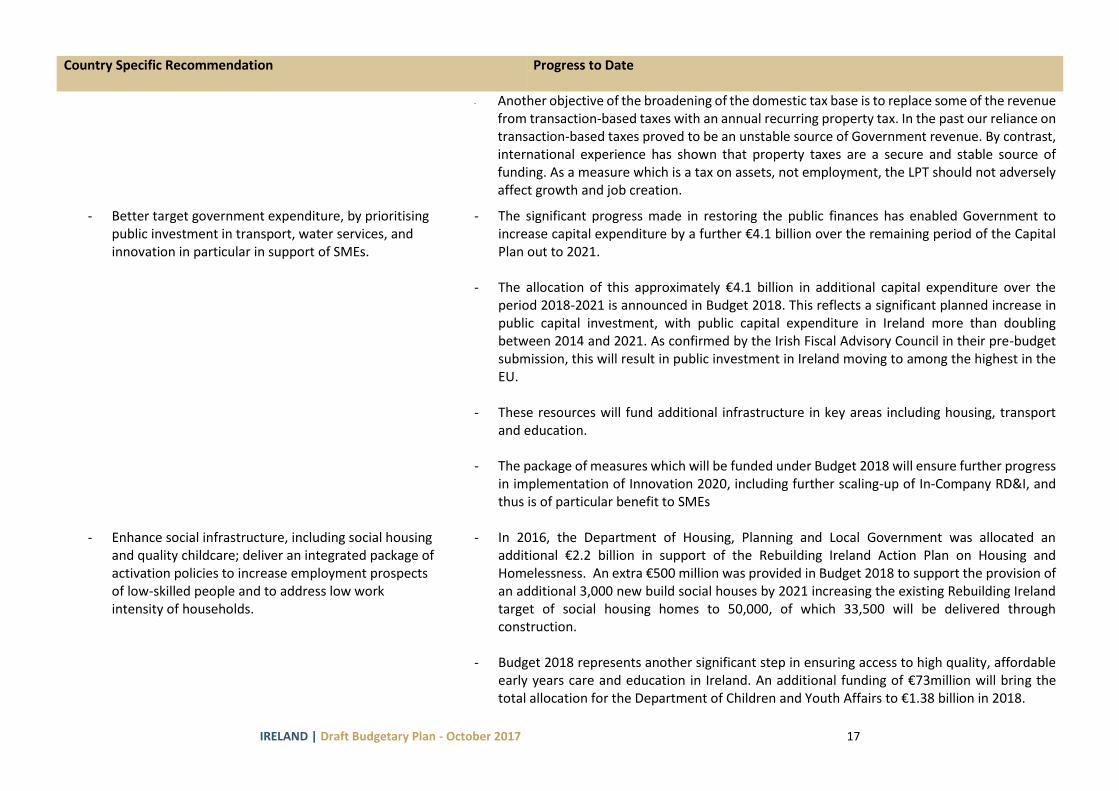
Country Specific Recommendation
Progress to Date
- Another objective of the broadening of the domestic tax base is to replace some of the revenue from transaction-based taxes with an annual recurring property tax. In the past our reliance on transaction-based taxes proved to be an unstable source of Government revenue. By contrast, international experience has shown that property taxes are a secure and stable source of funding. As a measure which is a tax on assets, not employment, the LPT should not adversely affect growth and job creation.
- Better target government expenditure, by prioritising public investment in transport, water services, and innovation in particular in support of SMEs.
- The significant progress made in restoring the public finances has enabled Government to increase capital expenditure by a further €4.1 billion over the remaining period of the Capital Plan out to 2021.
- The allocation of this approximately €4.1 billion in additional capital expenditure over the period 2018-2021 is announced in Budget 2018. This reflects a significant planned increase in public capital investment, with public capital expenditure in Ireland more than doubling between 2014 and 2021. As confirmed by the Irish Fiscal Advisory Council in their pre-budget submission, this will result in public investment in Ireland moving to among the highest in the EU.
- These resources will fund additional infrastructure in key areas including housing, transport and education.
- The package of measures which will be funded under Budget 2018 will ensure further progress in implementation of Innovation 2020, including further scaling-up of In-Company RD&I, and thus is of particular benefit to SMEs
- Enhance social infrastructure, including social housing and quality childcare; deliver an integrated package of activation policies to increase employment prospects of low-skilled people and to address low work intensity of households.
- In 2016, the Department of Housing, Planning and Local Government was allocated an additional €2.2 billion in support of the Rebuilding Ireland Action Plan on Housing and Homelessness. An extra €500 million was provided in Budget 2018 to support the provision of an additional 3,000 new build social houses by 2021 increasing the existing Rebuilding Ireland target of social housing homes to 50,000, of which 33,500 will be delivered through construction.
- Budget 2018 represents another significant step in ensuring access to high quality, affordable early years care and education in Ireland. An additional funding of €73million will bring the total allocation for the Department of Children and Youth Affairs to €1.38 billion in 2018.
IRELAND | Draft Budgetary Plan - October 2017 18
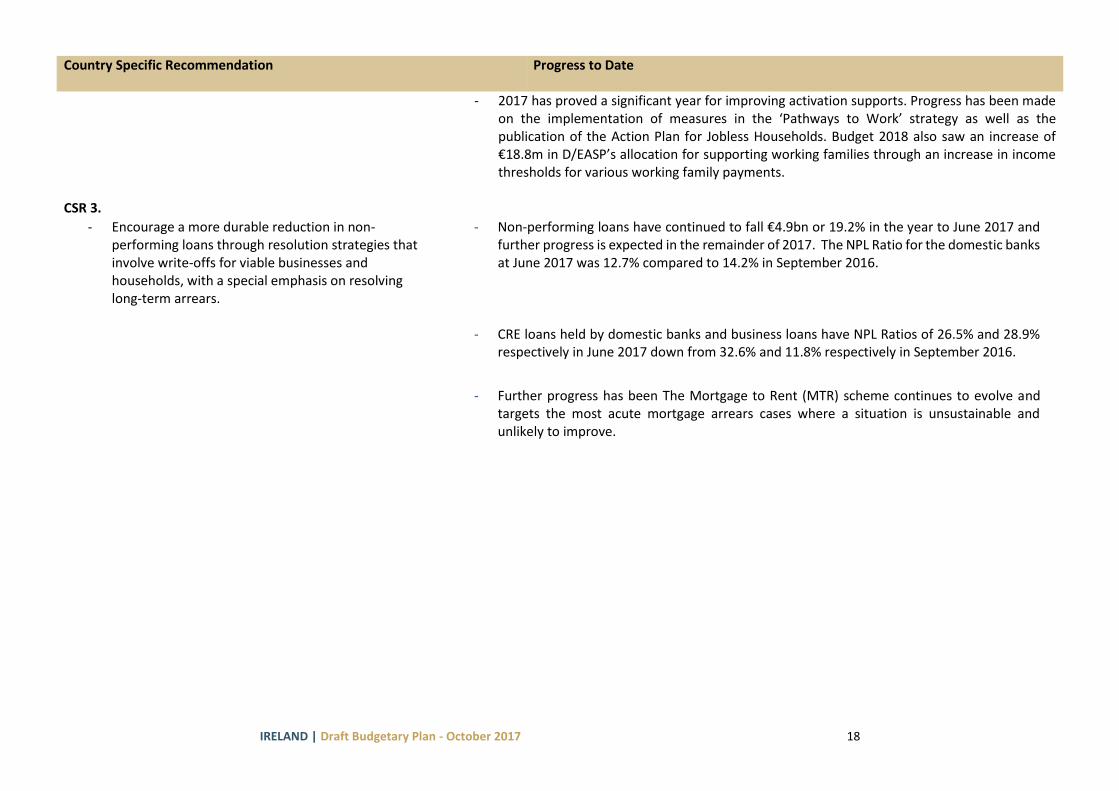
Country Specific Recommendation
Progress to Date
- 2017 has proved a significant year for improving activation supports. Progress has been made on the implementation of measures in the ‘Pathways to Work’ strategy as well as the publication of the Action Plan for Jobless Households. Budget 2018 also saw an increase of €18.8m in D/EASP’s allocation for supporting working families through an increase in income thresholds for various working family payments.
CSR 3.
- Encourage a more durable reduction in non-performing loans through resolution strategies that involve write-offs for viable businesses and households, with a special emphasis on resolving long-term arrears.
- Non-performing loans have continued to fall €4.9bn or 19.2% in the year to June 2017 and further progress is expected in the remainder of 2017. The NPL Ratio for the domestic banks at June 2017 was 12.7% compared to 14.2% in September 2016.
- CRE loans held by domestic banks and business loans have NPL Ratios of 26.5% and 28.9% respectively in June 2017 down from 32.6% and 11.8% respectively in September 2016.
- Further progress has been The Mortgage to Rent (MTR) scheme continues to evolve and
targets the most acute mortgage arrears cases where a situation is unsustainable and unlikely to improve.
IRELAND | Draft Budgetary Plan - October 2017 19
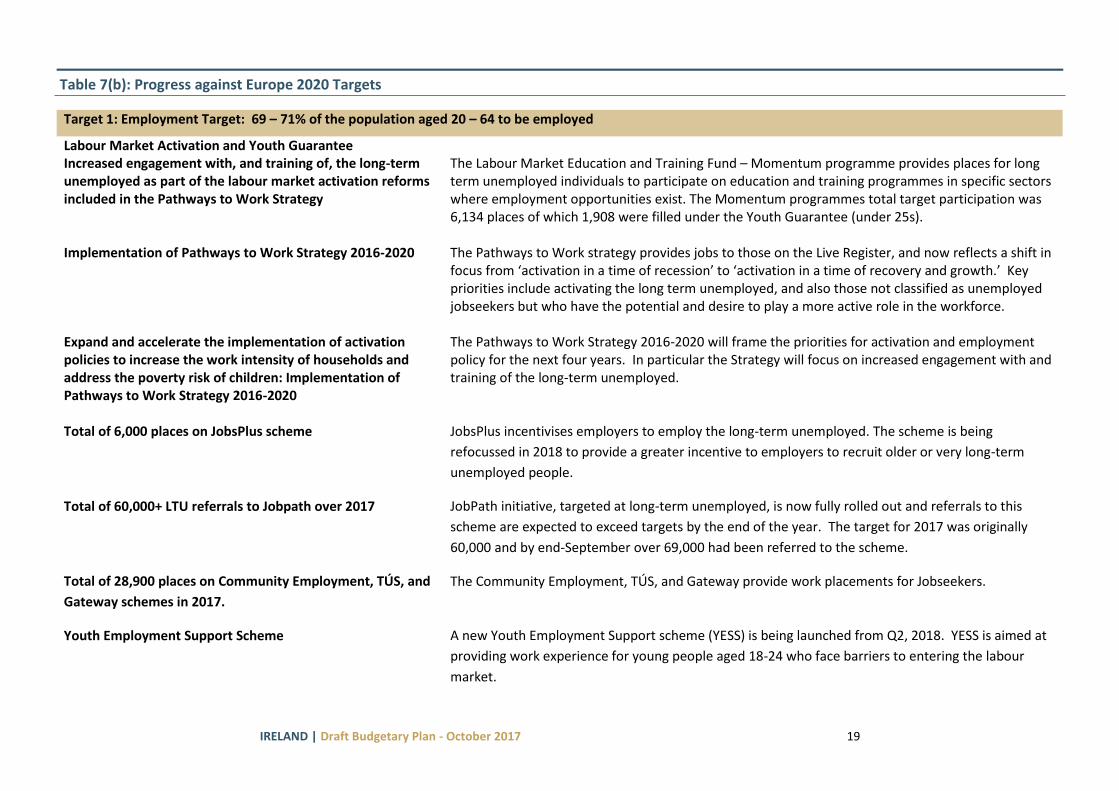
Table 7(b): Progress against Europe 2020 Targets
Target 1: Employment Target: 69 – 71% of the population aged 20 – 64 to be employed
Labour Market Activation and Youth Guarantee Increased engagement with, and training of, the long-term unemployed as part of the labour market activation reforms included in the Pathways to Work Strategy
The Labour Market Education and Training Fund – Momentum programme provides places for long term unemployed individuals to participate on education and training programmes in specific sectors where employment opportunities exist. The Momentum programmes total target participation was 6,134 places of which 1,908 were filled under the Youth Guarantee (under 25s).
Implementation of Pathways to Work Strategy 2016-2020 The Pathways to Work strategy provides jobs to those on the Live Register, and now reflects a shift in
focus from ‘activation in a time of recession’ to ‘activation in a time of recovery and growth.’ Key priorities include activating the long term unemployed, and also those not classified as unemployed jobseekers but who have the potential and desire to play a more active role in the workforce.
Expand and accelerate the implementation of activation policies to increase the work intensity of households and address the poverty risk of children: Implementation of Pathways to Work Strategy 2016-2020
The Pathways to Work Strategy 2016-2020 will frame the priorities for activation and employment policy for the next four years. In particular the Strategy will focus on increased engagement with and training of the long-term unemployed.
Total of 6,000 places on JobsPlus scheme JobsPlus incentivises employers to employ the long-term unemployed. The scheme is being
refocussed in 2018 to provide a greater incentive to employers to recruit older or very long-term
unemployed people.
Total of 60,000+ LTU referrals to Jobpath over 2017 JobPath initiative, targeted at long-term unemployed, is now fully rolled out and referrals to this
scheme are expected to exceed targets by the end of the year. The target for 2017 was originally
60,000 and by end-September over 69,000 had been referred to the scheme.
Total of 28,900 places on Community Employment, TÚS, and
Gateway schemes in 2017.
The Community Employment, TÚS, and Gateway provide work placements for Jobseekers.
Youth Employment Support Scheme A new Youth Employment Support scheme (YESS) is being launched from Q2, 2018. YESS is aimed at
providing work experience for young people aged 18-24 who face barriers to entering the labour
market.

IRELAND | Draft Budgetary Plan - October 2017 20
Pursue measures to incentivise employment by tapering the
withdrawal of benefits and supplementary payments: Back
to Work Family Dividend
The Back to Work Family Dividend helps families make the transition from welfare to work by
enabling social welfare recipients to retain the child dependent portion of their weekly social welfare
payment for up to 2 years upon entering employment. This scheme was due to close to new entrants
from 31 March 2018; Budget 2018 provides for the continuation of this scheme.
Further Education and Training On-going implementation and development of the Further
Education and Training Strategy 2014-2019
The Further Education and Training (FET) Strategy 2014-2019 sets out a roadmap for the sector to
respond to the needs and opportunities for the short, medium and longer term and contains five key
strategic goals:
Skills for the Economy - The aim is that FET will address current and future needs of learners,
jobseekers, employers and employees and will contribute to national economic development.
Active Inclusion – The aim is that FET provision will support the active inclusion of people of all abilities
in society with special reference to literacy and numeracy.
Quality Provision – The aim is that FET will provide high quality education and training programmes
and will meet appropriate national and international quality standards.
Integrated Planning and Funding – The aim is that FET provision will be planned and funded on the
basis of objective analysis of needs and evidence of social and economic impact.
Standing of FET – The aim is to ensure a valued learning path leading to agreed employment, career
development, personal and social options.
Implementation of the Strategy is taking place at pace under the management and monitoring of a
detailed implementation plan.
Significant progress has been made to date with the delivery of a framework for the improved planning
and funding of further education and training, including the development and refinement of the
annual service planning model. This process will be further enhanced with the integration of the new
data system, the Programme Leaner Support System (PLSS), which is in place from this year 2017 and
from 2018 will enable greater tracking of learner outcomes and more informed funding decisions using
a National FET Course Calendar.
A series of independent evaluations of the full and employment focused FET programmes will take
place over the lifetime of the FET Strategy. The first of these evaluations was the PLC programme
which is now complete. The report is currently under consideration in the Department. A review of the
IRELAND | Draft Budgetary Plan - October 2017 21
Youthreach Programme will commence in Q4 2017. The evaluation of VTOS, Specific Skills training as a
single exercise will commence in the autumn, Q4 2017.
The FET strategic implementation plan provides for a mid-term review of the FET Strategy taking place
in 2017. Arrangements are being made by SOLAS for an external review of the strategy to be
conducted.
2017 FET Services Plan The Annual Further Education and Training Service Plan, agreed between SOLAS and the 16 ETB's ,
provides details of FET provision to be funded including numbers, costs and estimated outputs. The
2017 FET Services Plan set out the detail of FET provision for 323,000 beneficiaries across the full range
of FET programmes. The Services Plan is available at http://www.solas.ie/Pages/FETServicesPlan.aspx
Provision of FET to skill, re-skill or upskill unemployed
persons that will equip them to participate in the labour
market.
The Further Education and Training (FET) sector has undergone major structural and policy changes
over the last number of years, with the purpose of ensuring that we have a FET sector that is flexible
and responsive to the needs of learners and industry alike. The FET Strategy 2014-2019, underpinning
reform of the sector, contains over 50 individual actions that are tracked through a detailed
implementation plan around five key goals, and includes the action to support active inclusion for all.
Under the strategy, a new planning and funding model has been established, so that provision is
planned on a strategic basis to meet the needs of learners and employers in each ETB region and is
published in the annual FET Services Plan. Intreo offices provide an important input into the annual
service planning process and specific revised protocols have been completed and signed between ETB's
and INTREO/Local DSP's to foster closer collaboration and engagement and to support better client
matching to education and training provision.
New Apprenticeship Programme
To date nine new apprenticeship programmes have been developed by the Apprenticeship Council
following its first call for proposals in 2015, in Insurance Practice, Industrial Electrical Engineering,
Polymer Processing Technology, Manufacturing Technology, Manufacturing Engineer, Accounting
Technician, Commis Chef and two programmes in International Financial Services (Associate &
Specialist). Further new apprenticeships are to be submitted for validation to Quality and
Qualifications Ireland (QQI) shortly and, subject to successful validation, it is expected that a further six
new schemes will get underway later this year in various sectors including ICT and Haulage.A key

IRELAND | Draft Budgetary Plan - October 2017 22
commitment set out in the Action Plan to Expand Apprenticeship and Traineeship in Ireland 2016-2020
for this year was the issuing of a second call for apprenticeship proposals to refresh the pipeline of
proposals already established through the first call. The second call closed on the 1st September with
77 proposals received across a range of sectors and occupations. The Apprenticeship Council are
currently evaluating these proposals and will report its findings to the Minister in November. As of
September 2017 there were over 3,500 new apprentice registrations.
Skillnets
Skillnets funds and facilitates training through over 60 networks of private sector companies under the
Training Networks Programme (TNP), in a range of sectors and regions across the country. The
networks identify their own common training needs typically on a regional or sectoral basis. In 2016,
Skillnets will provide training and related services to 42,000 individuals, of which 8,000 are
unemployed or work in a part time capacity.
Skills to Work Campaign
The Skills to Work campaign represents a coordinated approach to presenting information on a single
platform, to employers and jobseekers alike, on the range of education and training initiatives that are
available for them to participate in. It includes information on Momentum, Springboard, JobPlus,
JobBridge and Skillnets.
Pathways to Work
Under the Pathways to Work 2016-2020, the Department of Education and Skills will work closely with
Department of Emplyment Affairs and Social Protection to plan education and training provision to
achieve the best possible outcomes for unemployed people. As the unemployment position continues
to improve there will be a need to closely monitor the level of provision going forward.
Regional Skills Fora
To help foster stronger links between employers and the education and training sector, the
Department of Education and Skills has established a network of nine Regional Skills Fora and
appointed nine Regional Skills Fora Managers. The Fora have been established to align with wider
Government policy and initiatives on regional economic development, including the Regional Action
Plans for Jobs. The innovative structure of the fora sees the work plan within each region being driven
by key stakeholders in the region including employers, enterprises and education and training
providers. Feedback from key players across the Regions is positive about the potential of the Fora to
have a major impact at regional level in bringing together the key stakeholders to develop swift
IRELAND | Draft Budgetary Plan - October 2017 23
responses to emerging needs and to help drive Government policy around rural and regional
development.
National Skills Strategy
The Department of Education and Skills published a new National Skills Strategy to 2025 (NSS) in
January 2016 and implementation of the Strategy is ongoing.The Strategy has over 125 measures and
over 50 different stakeholders and it provides a framework for skills development that will help drive
Ireland’s growth both economically and societally over the next decade.One of the key elements of the
Strategy is the development of a new skills architecture, including a National Skills Council and the
Regional Skills Fora. This architecture will foster closer collaboration between relevant Government
Departments and agencies and develop structures to strengthen engagement between the education
and training system and enterprise.
Higher Education – Springboard
Springboard was introduced in 2011 as part of the Government’s Jobs Initiative and was renamed
Springboard+ in 2015 following the incorporation of ICT Conversion Courses. The Springboard element
of the programme targets funding to provide free part-time higher education courses to enable
unemployed people to upskill or reskill in areas where there are identified skills needs. ICT Conversion
Courses enable those with a level 8 qualification in a cognate discipline to reskill in the area of ICT and
are open to individuals who meet the qualification criteria regardless of their employment status. Due
to the success of the programme and the improving economic situation, it has been decided to expand
the eligibility for Springboard+ to other priority groups where new talent can be reached and
supported. From Autumn 2017, these include people who have been out of the work environment due
to childcare or other caring obligations and who require upskilling or reskilling to transition back to the
workforce; those in employment who wish to upskill or reskill to meet a specific emerging skills need in
the Biopharma/MedTech sector, and those in employment or self-employment in the ICT sector who
wish to upskill from a level 7 to a level 8 qualification. Since 2011 over €134m has been allocated to
Springboard+ providing for over 35,000 places. Additional places commencing in 2017 will represent an
investment of an additional 27 million euro. Springboard + 2017 will provide 6,471 places on 198
courses across the country. Courses will commence in Autumn 2017.
IRELAND | Draft Budgetary Plan - October 2017 24
Target 2: Research and Development (R&D) Headline Target: Approximately 2% of GDP (2.5% of GNP) to be invested in R&D
Strategy Innovation 2020, a new national Strategy for Science, Technology and Innovation was published on 8th
December 2015.
Science Foundation Ireland Science Foundation Ireland is maintaining supports to 16 world-leading Research Centres that conduct
excellent and impactful applied and basic research, attracting industry and talent to Ireland. A cohort
of 4,239 people work on SFI supported research projects. Furthermore SFI awards directly supported
1,603 industry collaborations - 929 with 399 MNCs, and 674 with 491 SMEs.
Increase in investment Ireland has increased its investment in R&D over the past decade while also introducing a range of
measures to improve commercialisation of research and build strong linkages between the higher
education sector and enterprise. Ireland has committed to an investment intensity rate of 2.5% GNP as
part of Europe 2020. Initiatives to reach this target are identified in Innovation 2020.
GERD (Gross Expenditure on R&D) has doubled from €1,637 million in 2003 to an estimated €3,133
million in 2015. Within this, HERD (Higher Education R&D) has also doubled from €378 million in 2002
to an estimated €764 million in 2015.
Research Intensity Ireland’s research intensity rate for 2016 is an estimated 1.44% of GNP. (1.62% in 2015)
R&D Supports In its 2017-2020 strategy Enterprise Ireland (EI) has a set a goal to drive innovation in Irish enterprise to
new levels through a range of new supports to reach the target of €1.25bn in R&D expenditure per
annum by 2020 – a 50% increase. Delivering on this will include roll out (Q4 2017) of a vastly improved
and responsive EI In-Company RD&I Toolkit to include funding for Business Innovation, Design and
Intellectual Property protection. Together with IDA Ireland EI will continue to invest in existing
supports to drive R&D including Technology Centres, Innovation Vouchers, and the scaling up of the
Health Innovation Hub.
The Knowledge Development Box has been in operation since 1 January 2016. This will give support
to all Irish companies that carry out substantive innovative activities. Since the commencement of the
Knowledge Development Box (certification of inventions) Act 2017 on the 19th May 2017 this support
now extends/applies to indigenous SMEs with inventions that are certified by the Controller of Patents
etc as novel, non-obvious and useful.

IRELAND | Draft Budgetary Plan - October 2017 25
Target 3: Climate Change and Energy 3(a) Greenhouse Gas (GHG) Emissions - Headline Target: 20% reduction in Carbon Emissions relative to 2005 National Mitigation Plan.
Ireland's policies and measures in relation to adaptation and mitigation were given legislative
underpinning by the Climate Action and Low Carbon Development Act 2015. In accordance with this
Act, Ireland published its first National Mitigation Plan in July 2017. This Plan contains a series of
mitigation measures and actions covering greenhouse gas emissions in the Electricity Generation, Built
Environment, Transport and Agriculture sectors.
The Plan sets out an extensive list of mitigation measures already in place across the four sectors
concerned, including measures introduced at EU level and domestic measures. The Plan also presents a
range of options for further measures to reduce emissions.
In addition to setting out the full range of measures that the Irish Government has already
implemented or is considering to reduce Ireland’s greenhouse gas emissions, the Plan includes over
100 individual actions to be implemented across Government in order to advance the national
transition agenda. It is intended that the Plan becomes a living
document which is continually updated as ongoing analysis, dialogue and
technological innovation generate more cost-effective sectoral mitigation options. The scale of the
challenge to reduce Ireland's emissions in line with our domestic and international targets is illustrated
by the latest projections of greenhouse gas emissions by the Environmental Protection Agency (April
2017). These indicate that emissions from those sectors of the economy covered by Ireland's 2020
targets could be between 4% and 6% below 2005 levels by 2020. The projected shortfall to the 2020
targets reflects both Ireland's constrained investment capacity over the past decade due to the
economic crisis, and the extremely challenging nature of the target itself.
3(b) Renewable Energy – Headline Target: 16% of total energy consumption from renewable sources
Ireland is committed to meeting 16% of total energy consumption from renewable sources (40% of
electricity demand, 12% of heat and 10% of transport). Provisional figures for 2016 indicate that 9.4%
of Ireland’s energy came from renewable sources (electricity 27.1%, heat 6.7% and transport 5.0%).
Achieving the level of renewable energy in heat and transport remains challenging particularly given
Ireland's settlement patterns (with Eurostat showing Ireland as having the highest share of the
population living in predominantly rural regions). The deployment of sustainable biofuels will be the
IRELAND | Draft Budgetary Plan - October 2017 26
main mechanism to help achieve the transport target. A Draft Bioenergy Plan, published in 2014,
identified key policy actions for the use of bio-energy resources which should assist Ireland in closing
the gap to target on renewable heat. It is currently envisaged that the Plan will be finalised in late
2018. In addition, two support schemes are being developed - a Renewable Electricity Support Scheme
(RESS) and a Renewable Heat Incentive Scheme. A public consultation on RESS is underway. Both
schemes will be subject to Government and State Aid approval.
3(c) Energy Efficiency – Headline Target: to move towards 20% increase in Energy Efficiency
National Energy Efficiency Action Plan
The National Energy Efficiency Action Plan (NEEAP) sets out Ireland’s approach in pursuit of the 20%
energy efficient target. Based on latest available data Ireland had achieved 58% of the energy
efficiency 2020 target (i.e. just under 12 of the 20%) at end 2016. Meeting the 20% target presents
significant challenges across the commercial, domestic and public sectors. SEAI projects that at current
levels of effort some 16 of the 20% should be achieved by end 2020. The level of effort would need to
grow by 5% per year to meet the 20% target. DCCAE secured very significant additional resources in
Budget 2017 (with the allocation to SEAI for energy efficiency and related measures increasing from
€72.7m in 2016 to €100.2m in 2017) to facilitate an intensification of effort including an expansion of
existing initiatives and introduction of new initiatives designed to reduce the shortfall to target and to
build capacity to absorb more investment in following years should that become available. Ireland’s
4th NEEAP, published by DCCAE in April 2017 sets out the range of measures including new and
enhanced measures in place and in development. Ireland has set a more ambitious energy efficiency
target of 33% for the public sector. This public sector effort also contributes to the national effort on
the NEEAP 20% target as well as ensuring our public sector provides leadership on energy efficiency for
the whole of our economy and society. This ambitious effort by the public sector is supported by a new
Public Sector Energy Efficiency Strategy developed by DCCAE and approved by Government in
December 2016. Monitoring by SEAI showed that at end of 2015 energy efficiency in Ireland’s public
sector had improved by 21%.
Energy Efficiency Fund
The Government has committed €35 million to an Energy Efficiency Fund (EEF), which makes
commercial financing available to businesses who want to boost their energy efficiency.
The objectives of the Fund are to address barriers to increased activity in this sector, namely
introduction of specialist sectoral expertise in structuring finance for energy efficiency projects and
provision of funding in a timely manner of appropriate term.
IRELAND | Draft Budgetary Plan - October 2017 27
National Energy Services Framework
The National Energy Services Framework was developed to have a framework in place for use by
organisations wishing to implement energy projects outlining a number of approaches.
It continues to be in place and evolve setting out best practice, approach options, standard templates
including standard contract clauses and a model contract for full Energy Performance contracting
which was reviewed and approved by the GCCCC in 2014/2015.
This will be used by public bodies as they work towards the 33% energy efficiency target for 2020 and
specifically as they approach the implementation of the Public Sector Energy Efficiency Strategy,
published by DCCAE in January 2017, one element of which is the establishment of a project pipeline.
TARGET 4: Education 4(a) Early Leaving from Education and Training - Headline Target: Reduce percentage of 18-24 year olds with secondary education and not in further education to 8%
Progress towards target The EU2020 headline target for this category is 10%. The national target set by Ireland is 8%. The EU
average is currently 12%.
Ireland’s current share of early school leavers (i.e. 18-24 year olds with at most lower secondary
education and not in further education and training) fell from 10.8% in 2011 to 9.7% in 2012, to 8.4% in
2013, 6.9% in 2014 and 2015 and 6.3% in 2016, which exceeds Ireland's adopted target of 8%
A number of measures have been put in place to support achievement of the target.
Implementation of the Delivering Equality of Opportunity
in Schools (DEIS) Programme
DEIS is the main policy initiative of the Department of Education and Skills to address educational
disadvantage at school level. The DEIS Plan 2017, which was launched on 13th February 2017, sets out
the vision for future interventions in the critical area of educational disadvantage policy and builds on
what has already been achieved by schools who have benefitted from the additional supports available
under the initial DEIS programme introduced in 2005. The DEIS Plan 2017 is based on the findings of
an extensive review of the DEIS programme, which involved extensive consultations with all relevant
stakeholders and resulted in the publication of the Report of the Review on DEIS. On foot of the
application of the new identification process, 79 additional schools were designated as DEIS There are
now 902 schools in the DEIS Programme – 704 Primary and 198 Post Primary. Supports under DEIS
enclude Enhanced book grants, additional teaching posts, school meals and access to Home School
Community Liason scheme supports. The DEIS Plan 2017 is available at the following link:
https://www.education.ie/en/Publications/Policy-Reports/DEIS-Plan-2017.pdf

IRELAND | Draft Budgetary Plan - October 2017 28
Evaluation
A Report from an Interim Review of the National Strategy on Literacy and Numeracy (2011-2020) was
published in March 2017. The Interim Review was informed by consultations with key stakeholders and
by evidence from national and international studies, including the 2014 National Assessments of
English Reading and Mathematics, the 2015 Programme for International Student Assessment and
2015 Trends in International Mathematics and Science Study. The Report shows the significant
progress made since 2011 and points to key priority areas where continued attention is needed.
See https://www.education.ie/en/Publications/Education-
Reports/pub_ed_interim_review_literacy_numeracy_2011_2020.PDF
Review of DEIS programme published
The Report of the Review on DEIS was published in February 2017. The review showed improvements
in terms of educational outcomes and in the progression through school for the students involved. It
also identified areas for improvements which signpost the way ahead. The review report is available at
the following link: https://www.education.ie/en/Schools-Colleges/Services/DEIS-Delivering-Equality-of-
Opportunity-in-Schools-/DEIS-Review-Report.pdf
Role of Tusla Tusla provides statutory and other educational welfare services through its Educational Welfare
Services (EWS) structure. Tusla has appointed a senior management team to drive the reform of
structures that will lead to a more fully integrated service provision across the range of its educational
welfare services such as Home School Community Liaison, School Completion Programme and
Statutory School Attendance Services. Tusla also works closely with the Department of Education and
Skills with a particular focus on the DEIS programme.
Significant gains have been made in improving school attendance and school completion rates. School
completion rates across DEIS schools is currently around 83% indicating that a significant cohort of the
students who need support are located in these schools. The EWS Home School Community Liaison
and School Completion Programmes (SCP) are based around meeting the needs of students and
parents attending these schools in order to support those most at risk of dropping out of school early.
The reforms of SCP currently being planned are designed to ensure that SCP is flexible and responding
in an evidence based way to identified needs.
IRELAND | Draft Budgetary Plan - October 2017 29
TARGET 4(b): Tertiary Education Headline Target: At least 60% of 30-34 year olds should complete third level education
Continued investment in Third-Level Education to meet
increased student numbers
Ireland is aiming to have 60% of the 30-34 year old population with a tertiary level qualification by
2020. The latest Eurostat data shows that Ireland’s current tertiary attainment rate for 30-34 year olds
was 52.3% in 2015, which is a slight increase on the 52.2% rate recorded in 2014. Ireland previously
had the highest rate for this indicator of all EU28 countries however, Ireland now ranks 3rd in the EU28
having been overtaken by both Lithuania and Cyprus. Ireland is still significantly ahead of the EU28
average which rests at 38.7% in 2015.
In 2016, 52% of 25-34 year olds in Ireland have a tertiary degree, higher than the OECD average of
43%.
The adult education level for 25-64 year olds in 2015 was 42.8% which is above the OECD average of
34.5%.
There has also been steady growth in the inclusion of students from socio-economic disadvantaged
areas from 22% in 2012/13 to 26% participation in 2014/15. There has been an increase in the number
of students attending the tertiary sector (108.2 for 2014 with 2010 = 100 reference year).
There was a decline in numbers of research graduates from 2009/10 to 2013/14 but renewed growth
in 2014/15. Irish HEIs accounted for c. 63% of Irish draw-down of research funding from the Seventh
Framework Programme.
The H2020 success rate stands at 14.2% compared to a member state average of 13.3%. Ireland also
achieved a top-ranking performance in the European Commission’s 2013 Knowledge Transfer Study, –
0,387 compared to the EU average of 0,256.
The number of PhD students fell from 10,367 in 2011/2012 to 9,606 in 2014/2015. The plans, under
Innovation 2020 to increase the number of research students by 30 per cent by 2020 are welcomed.
In 2014/2015 the number of students in who undertook outgoing mobility opportunities was 2,501,
73% of whom (1,835) were Erasmus+ students, in line with the European average. As the number of
level 8 graduates’ stands at around 28,000, those choosing to travel represent about 9% of the
IRELAND | Draft Budgetary Plan - October 2017 30
graduate cohort, some way below the target rate of 20%. The projections of the institutions suggest
that growth will be maintained or increased, and that international students will account for about 13
per cent of total students by 2016/17.
OECD data for Ireland indicates that international student enrolment in 2013 stood at 6% of total
enrolment. This places Ireland below the OECD average50 of 9%. The Government target aims to have
international students to represent 15% of full-time students by 2020.
2.9% of public spending is spent on tertiary education while 1.1% of GDP is privately spent on the
tertiary sector. Ireland spends USD 14131 per student in tertiary education which falls below the OECD
average of USD 16143.
This strong performance is confirmed in the recent OECD publication Education at a Glance which was
published on 15 September 2016 and which placed Ireland 6th in the OECD in terms of its Tertiary
Attainment Rate amongst 25-34 year olds.
Development of a new National Access Plan for Higher
Education
The new National Access Plan was published in December 2015. The Plan contains targets to increase
participation in higher education by target groups. There are more than 30 actions contained in the
Plan that are intended to achieve the overall vision of ensuring that the higher education sector
reflects the diversity of Irish society. A Steering Group, chaired by the Department of Education and
Skills, is monitoring implementation of the Plan. Working Groups are convened as necessary to assist
with the implementation of the plan.
Subsequent to the launch of the National Access Plan, the Department of Education and Skills (DES)
established the Programme for Access to Higher Education (PATH) Fund. This Fund comprises
dedicated funding to support access to higher education, which is allocated on a competitive basis to
higher education institutions to support particular priority areas within the Plan as determined by the
DES. Funding of €2.4m was made available in April 2017 for widening access to initial teacher
education under PATH 1. Two further strands of this fund have been announced as follows; PATH 2:
the 1916 Bursary Fund (€6m) and PATH 3: the Higher Education Community Engagement Fund (€7.5m).
Progress is also being made in a number of other key actions in the Plan. A mid-term review of the plan
will be commenced later this year (2017) to review and assess progress against the Plan’s goals,
objectives and targets.

IRELAND | Draft Budgetary Plan - October 2017 31
TARGET 5: Reduction of Population at Risk of Poverty Headline Target: To reduce the number experiencing consistent poverty to 4% by 2016 (interim target) and to 2% or less by 2020, from the 2010 baseline rate of 6.3%.
Weekly rates of social welfare payments
Building on the Budget 2017 measure increasing the maximum weekly rate of all social welfare
payments by €5 from March, Budget 2018 is providing for a further €5 increase in the maximum
weekly rates for all social welfare payments. This includes pensioners, carers, people with disabilities,
lone parents, maternity/paternity recipients, jobseekers, and people participating in employment
programmes. Budget 2018 is also providing a €2 increase in the qualified child payment, paid to
families in receipt of a weekly social welfare payment with dependent children.
Telephone Support Allowance
Budget 2018 provides for the introduction of a new Telephone Support Allowance (TSA). This
payment, of €2.50 per week, will be paid to pensioners and people with disabilities who live alone and
are in receipt of both the Living Alone Allowance and Fuel Allowance. As Fuel Allowance is a means-
tested payment, the TSA is a targeted payment to those who are vulnerable to poverty and social
isolation.
Fuel Allowance
The Fuel Allowance is a means-tested payment, paid at €22.50 per week for the duration of the fuel
season. Budget 2018 provides for an extension of the fuel season by an additional week.
Housing Assistance Payment (HAP)
By end 2017, the Housing Assistance Payment (HAP) scheme will have been rolled out to all 31 local
authority areas. At that point, given the current rate of HAP take up it is expected that 31,493
households will be supported by the scheme. Additional funding has been allocated in Budget 2018
and the target number of new households to be supported by HAP in 2018 is 17,472.
Community Childcare Subvention Scheme
Changes were made to the targeted Community Childcare Subvention Scheme during 2017 as
preparations to launch a new Single Affordable Childcare Scheme continue. The key changes were the
introduction of a universal non-means tested subsidy for qualifying parents and a significant increase in
targeted subvention rates. The universal element provides up to €1,040 per year and targeted
supports have increased from €95 per week to €145 per week for fulltime childcare places.
IRELAND | Draft Budgetary Plan - October 2017 32
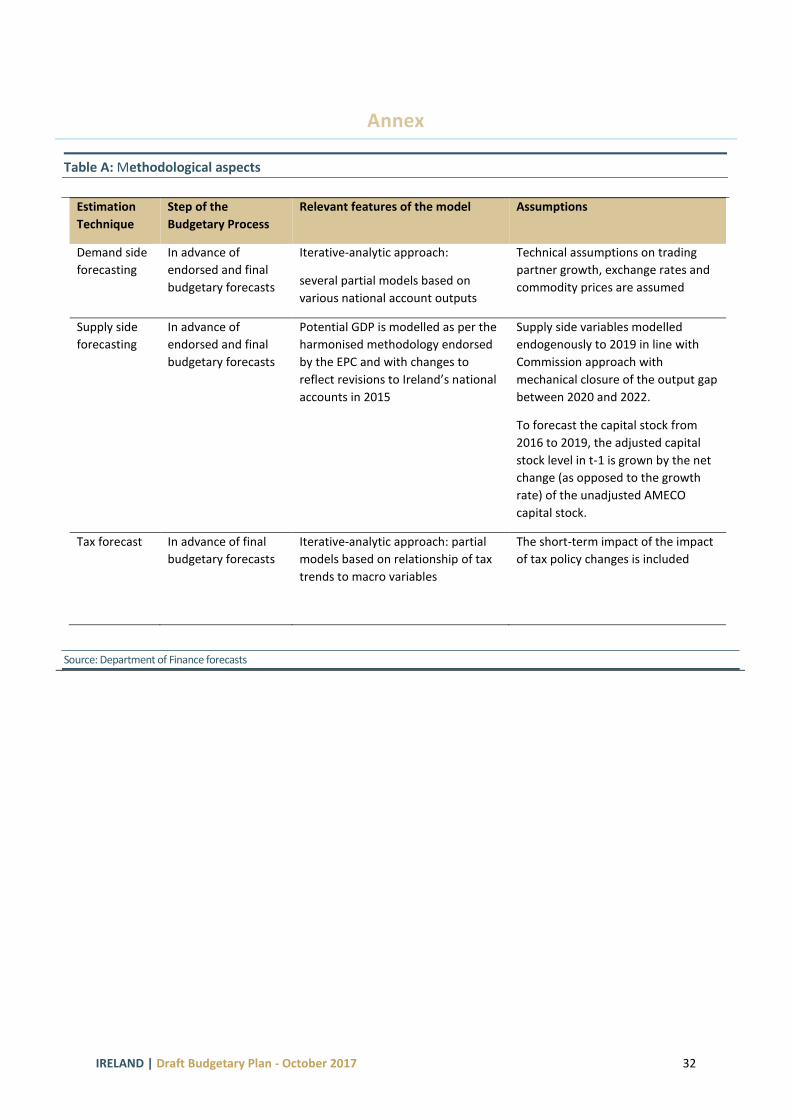
Annex
Table A: Methodological aspects
Estimation
Technique
Step of the
Budgetary Process
Relevant features of the model Assumptions
Demand side
forecasting
In advance of
endorsed and final
budgetary forecasts
Iterative-analytic approach:
several partial models based on
various national account outputs
Technical assumptions on trading
partner growth, exchange rates and
commodity prices are assumed
Supply side
forecasting
In advance of
endorsed and final
budgetary forecasts
Potential GDP is modelled as per the
harmonised methodology endorsed
by the EPC and with changes to
reflect revisions to Ireland’s national
accounts in 2015
Supply side variables modelled
endogenously to 2019 in line with
Commission approach with
mechanical closure of the output gap
between 2020 and 2022.
To forecast the capital stock from
2016 to 2019, the adjusted capital
stock level in t-1 is grown by the net
change (as opposed to the growth
rate) of the unadjusted AMECO
capital stock.
Tax forecast In advance of final
budgetary forecasts
Iterative-analytic approach: partial
models based on relationship of tax
trends to macro variables
The short-term impact of the impact
of tax policy changes is included
Source: Department of Finance forecasts

IRELAND | Draft Budgetary Plan - October 2017 33
Taxation Measures for Introduction in 2018
Additional details on the measures below may be found in the Summary of Budgetary Measures in the
2018 Tax Policy Changes Book. The forthcoming Finance Bill will include legislative provision where
necessary.
Measure
Yield/Cost
2018
Yield/Cost Full
Year
USC
2.5% rate reduced to 2%
€600 increase to €18,772 band ceiling
5% rate reduced to 4.75%
Total cost of USC measures
USC Rates & Bands from 1 January 2018:
Incomes of €13,000 are exempt. Otherwise:
€0 – €12,012 @ 0.5%
€12,012 – €19,372 @ 2%
€19,372 – €70,044 @ 4.75%
€70,044+ @ 8%
Self-employed income over €100,000: 3% surcharge
Marginal tax rate on incomes up to €70,044 reduced from 49% to
48.75%
The USC relief for medical card holders is being extended for a further
two years (revenue neutral as already in tax base). Medical card
holders and individuals aged 70 years and older whose aggregate
income does not exceed €60,000 will now pay a maximum USC rate of
2%.
-€72m
-€21m
-€84m
-€177m
-€83m
-€24m
-€99m
-€206m
Income Tax An increase of €750 in the income tax standard rate band for all
earners, from €33,800 to €34,550 for single individuals and from
€42,800 to €43,550 for married one earner couples.
An increase in the Home Carer Tax Credit from €1,100 to €1,200
An increase in the Earned Income Credit from €950 to €1,150
-€132m
-€7m
-€17m
-€152m
-€8m
-€31m
Excise Duties
Tobacco Products Tax
The excise duty on a packet of 20 cigarettes is being increased by 50
cents (including VAT) with a pro-rata increase on the other tobacco
products, and an additional 25c on roll your own tobacco. This will
take effect from midnight on 10 October 2017.
+€64m
+€64m
IRELAND | Draft Budgetary Plan - October 2017 34
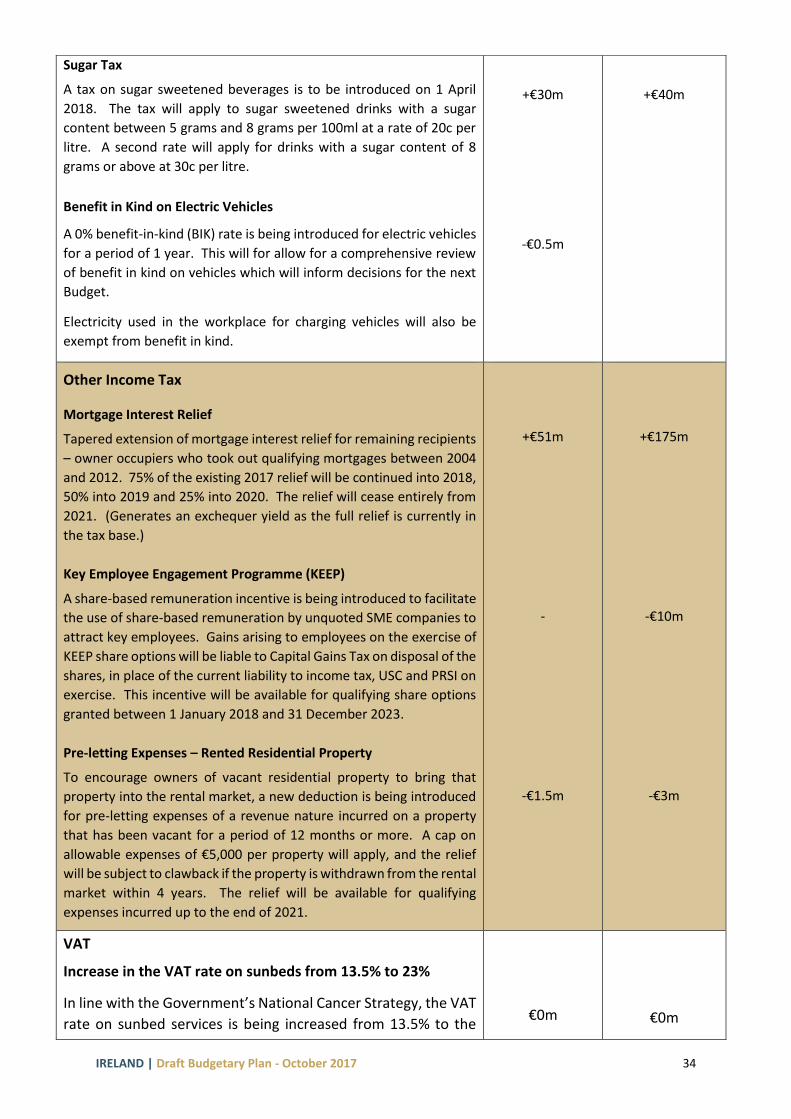
Sugar Tax
A tax on sugar sweetened beverages is to be introduced on 1 April
2018. The tax will apply to sugar sweetened drinks with a sugar
content between 5 grams and 8 grams per 100ml at a rate of 20c per
litre. A second rate will apply for drinks with a sugar content of 8
grams or above at 30c per litre.
Benefit in Kind on Electric Vehicles
A 0% benefit-in-kind (BIK) rate is being introduced for electric vehicles
for a period of 1 year. This will for allow for a comprehensive review
of benefit in kind on vehicles which will inform decisions for the next
Budget.
Electricity used in the workplace for charging vehicles will also be
exempt from benefit in kind.
+€30m
-€0.5m
+€40m
Other Income Tax Mortgage Interest Relief
Tapered extension of mortgage interest relief for remaining recipients
– owner occupiers who took out qualifying mortgages between 2004
and 2012. 75% of the existing 2017 relief will be continued into 2018,
50% into 2019 and 25% into 2020. The relief will cease entirely from
2021. (Generates an exchequer yield as the full relief is currently in
the tax base.)
Key Employee Engagement Programme (KEEP)
A share-based remuneration incentive is being introduced to facilitate
the use of share-based remuneration by unquoted SME companies to
attract key employees. Gains arising to employees on the exercise of
KEEP share options will be liable to Capital Gains Tax on disposal of the
shares, in place of the current liability to income tax, USC and PRSI on
exercise. This incentive will be available for qualifying share options
granted between 1 January 2018 and 31 December 2023.
Pre-letting Expenses – Rented Residential Property
To encourage owners of vacant residential property to bring that
property into the rental market, a new deduction is being introduced
for pre-letting expenses of a revenue nature incurred on a property
that has been vacant for a period of 12 months or more. A cap on
allowable expenses of €5,000 per property will apply, and the relief
will be subject to clawback if the property is withdrawn from the rental
market within 4 years. The relief will be available for qualifying
expenses incurred up to the end of 2021.
+€51m
-
-€1.5m
+€175m
-€10m
-€3m
VAT
Increase in the VAT rate on sunbeds from 13.5% to 23%
In line with the Government’s National Cancer Strategy, the VAT
rate on sunbed services is being increased from 13.5% to the
€0m
€0m
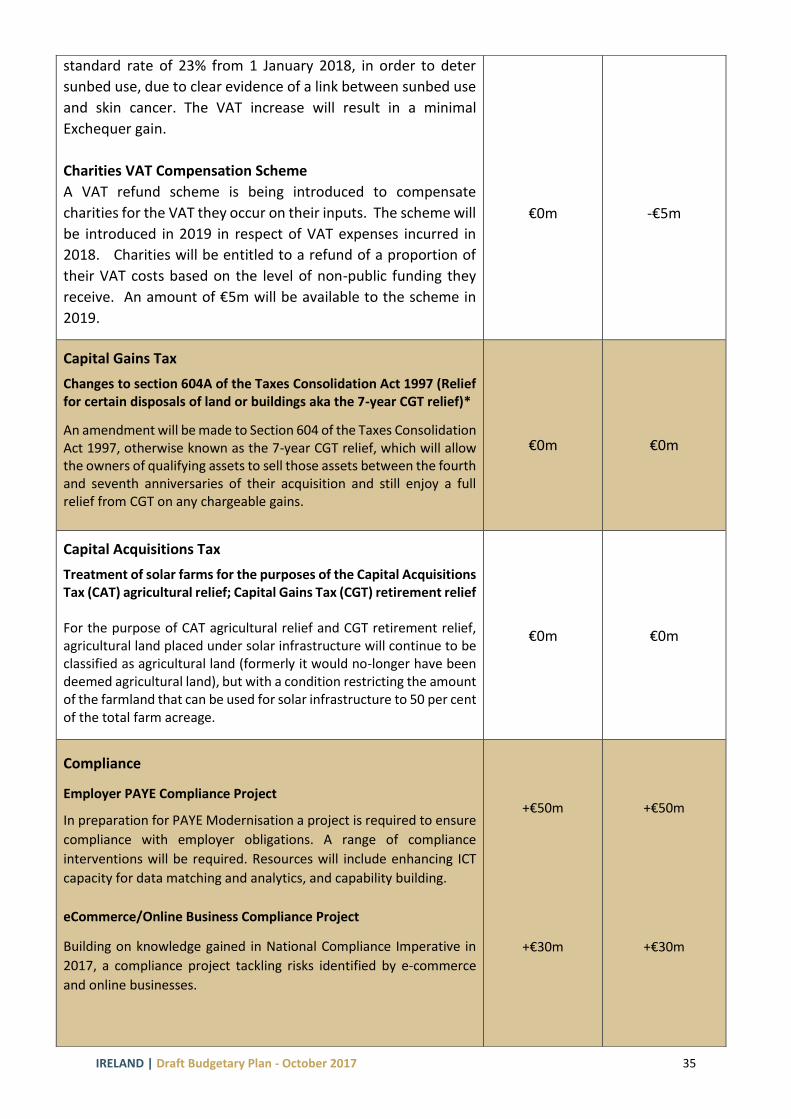
IRELAND | Draft Budgetary Plan - October 2017 35
standard rate of 23% from 1 January 2018, in order to deter
sunbed use, due to clear evidence of a link between sunbed use
and skin cancer. The VAT increase will result in a minimal
Exchequer gain.
Charities VAT Compensation Scheme
A VAT refund scheme is being introduced to compensate
charities for the VAT they occur on their inputs. The scheme will
be introduced in 2019 in respect of VAT expenses incurred in
2018. Charities will be entitled to a refund of a proportion of
their VAT costs based on the level of non-public funding they
receive. An amount of €5m will be available to the scheme in
2019.
€0m
-€5m
Capital Gains Tax
Changes to section 604A of the Taxes Consolidation Act 1997 (Relief for certain disposals of land or buildings aka the 7-year CGT relief)*
An amendment will be made to Section 604 of the Taxes Consolidation Act 1997, otherwise known as the 7-year CGT relief, which will allow the owners of qualifying assets to sell those assets between the fourth and seventh anniversaries of their acquisition and still enjoy a full relief from CGT on any chargeable gains.
€0m
€0m
Capital Acquisitions Tax
Treatment of solar farms for the purposes of the Capital Acquisitions Tax (CAT) agricultural relief; Capital Gains Tax (CGT) retirement relief For the purpose of CAT agricultural relief and CGT retirement relief, agricultural land placed under solar infrastructure will continue to be classified as agricultural land (formerly it would no-longer have been deemed agricultural land), but with a condition restricting the amount of the farmland that can be used for solar infrastructure to 50 per cent of the total farm acreage.
€0m
€0m
Compliance
Employer PAYE Compliance Project
In preparation for PAYE Modernisation a project is required to ensure
compliance with employer obligations. A range of compliance
interventions will be required. Resources will include enhancing ICT
capacity for data matching and analytics, and capability building.
eCommerce/Online Business Compliance Project
Building on knowledge gained in National Compliance Imperative in
2017, a compliance project tackling risks identified by e-commerce
and online businesses.
+€50m
+€30m
+€50m
+€30m

IRELAND | Draft Budgetary Plan - October 2017 36
Tax avoidance and base erosion capacity
Build high level technical capacity to tackle complex tax avoidance and
transfer pricing cases. Also to support Competent Authority role,
including MAPs. Required to protect tax base and contribute to
additional yield.
+€20m
+€20m
Corporation Tax
Capital Allowances for Intangible Assets
This measure will provide that the deduction for capital allowances for
intangible assets, and any related interest expense, will be limited to
80% of the relevant income arising from the intangible asset in an
accounting period.
Full details of this measure will be contained in the Finance Bill.
Accelerated Capital Allowances for Energy Efficient Equipment
This is a measure to incentivise companies to invest in energy efficient
equipment.
This measure was due to expire at the end of 2017 and following a
review by the Department of Finance is being extended to the end of
2020.
+€150m
€0m
+€150m
€0m
Stamp Duty
Change of rate of Stamp Duty on Non-Residential Property from 2%
to 6%
Extension of Consanguinity Relief and Change of Rate of Relief (This
is an extension of a relief, net amount coming in should not change)
+€376m
€0m
+€376m
€0m
Increase in employer contribution to National Training Fund
levy
From 1st January 2018 there will be a 0.1% increase (from 0.7% to
0.8%) in the National Training Fund Levy payable by employers with
respect of reckonable earnings of employees in Class A and Class
H employments.
+€58m +€63m