Embed Size (px)
Citation preview
Irish Census of Population & National Disability Survey, 2006
7th Meeting of the Washington Group on Disability Statistics
September 19-21, 2007Dublin, Ireland
Gerry BradyGillian RocheCentral Statistics Office, Ireland
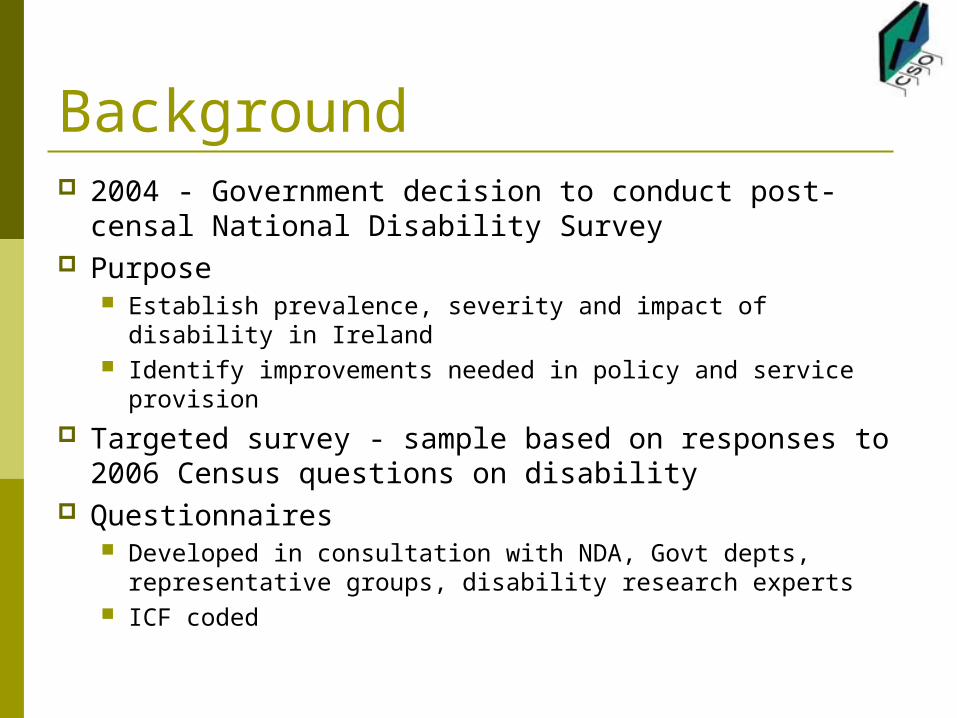
Background 2004 - Government decision to conduct post-censal
National Disability Survey Purpose
Establish prevalence, severity and impact of disability in Ireland
Identify improvements needed in policy and service provision
Targeted survey - sample based on responses to 2006 Census questions on disability
Questionnaires Developed in consultation with NDA, Govt depts,
representative groups, disability research experts ICF coded
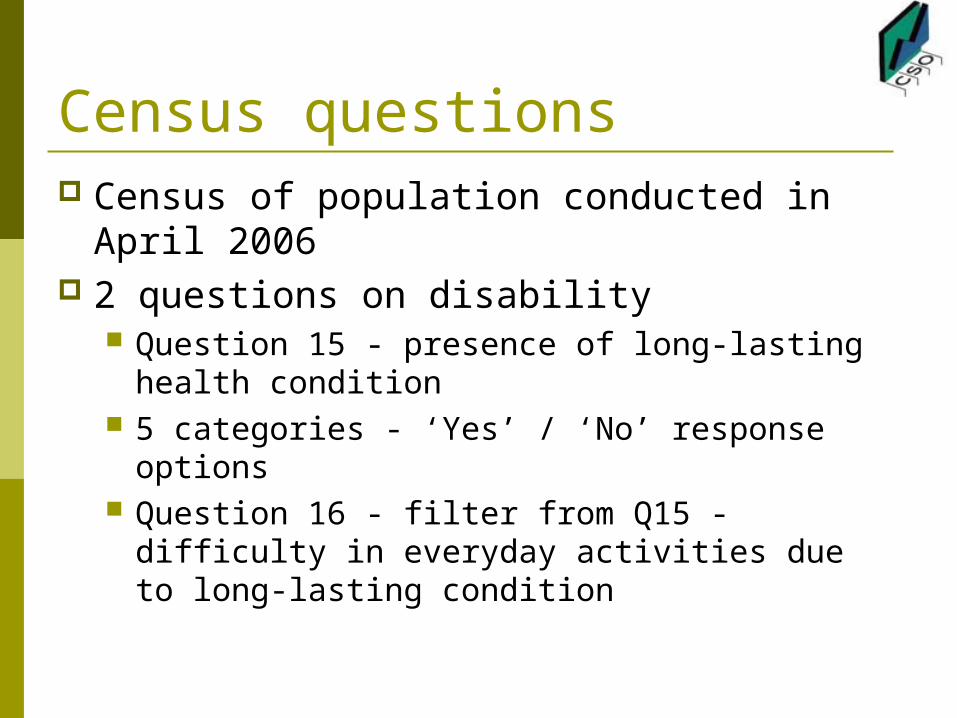
Census questions Census of population conducted in April
2006 2 questions on disability
Question 15 - presence of long-lasting health condition
5 categories - ‘Yes’ / ‘No’ response options Question 16 - filter from Q15 - difficulty in
everyday activities due to long-lasting condition
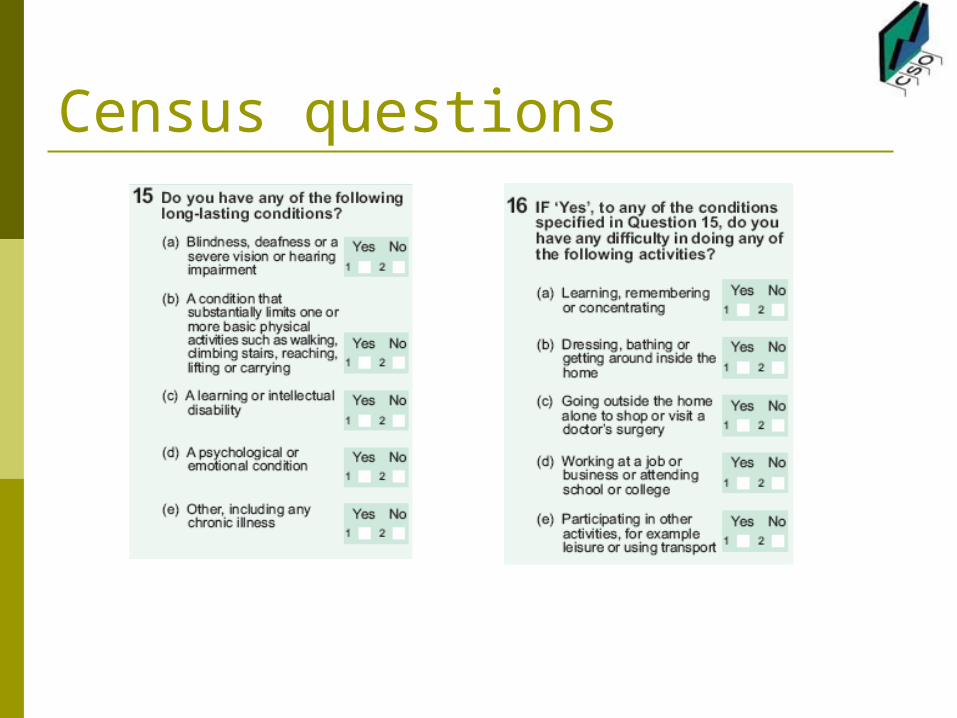
Census questions
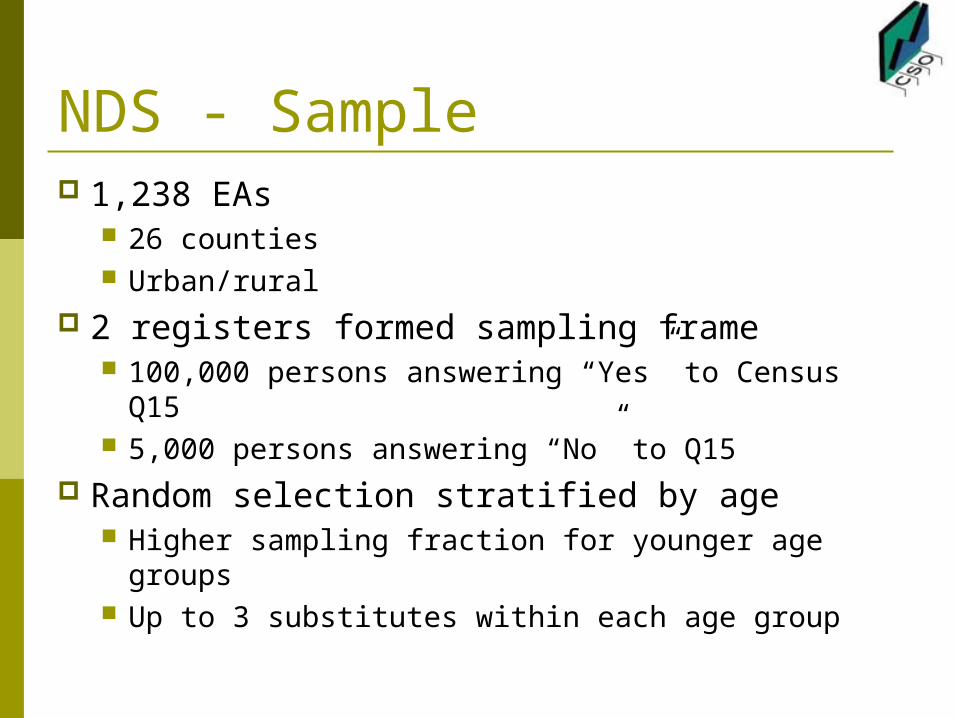
NDS - Sample 1,238 EAs
26 counties Urban/rural
2 registers formed sampling frame 100,000 persons answering “Yes” to Census Q15 5,000 persons answering “No” to Q15
Random selection stratified by age Higher sampling fraction for younger age groups Up to 3 substitutes within each age group
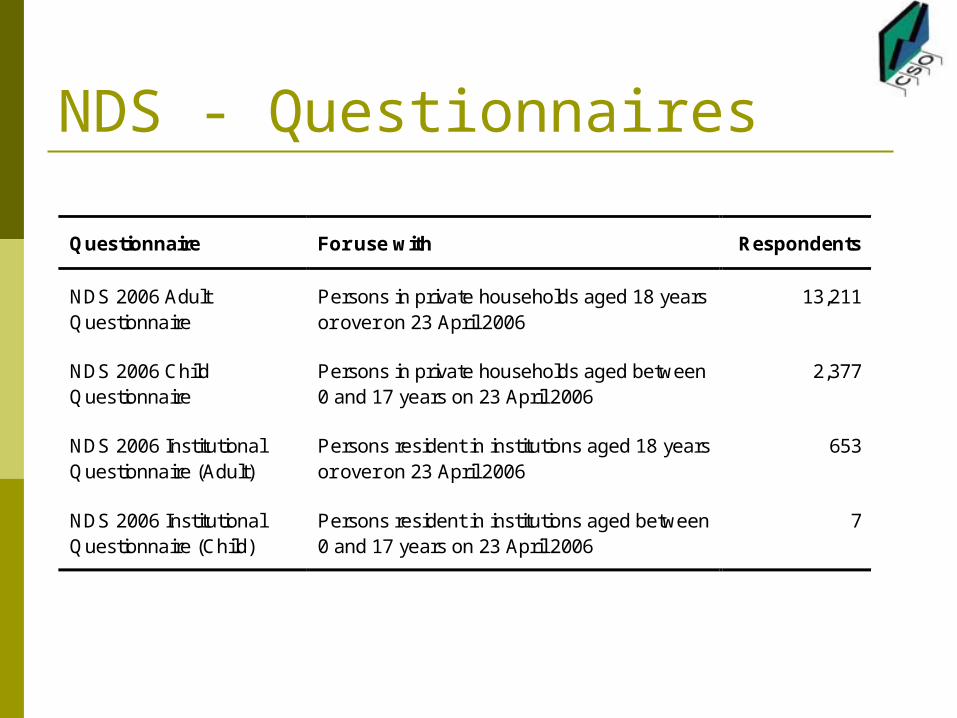
NDS - Questionnaires
Questionnaire For use with Respondents
NDS 2006 AdultQuestionnaire
Persons in private households aged 18 yearsor over on 23 April 2006
13,211
NDS 2006 ChildQuestionnaire
Persons in private households aged between0 and 17 years on 23 April 2006
2,377
NDS 2006 InstitutionalQuestionnaire (Adult)
Persons resident in institutions aged 18 yearsor over on 23 April 2006
653
NDS 2006 InstitutionalQuestionnaire (Child)
Persons resident in institutions aged between0 and 17 years on 23 April 2006
7
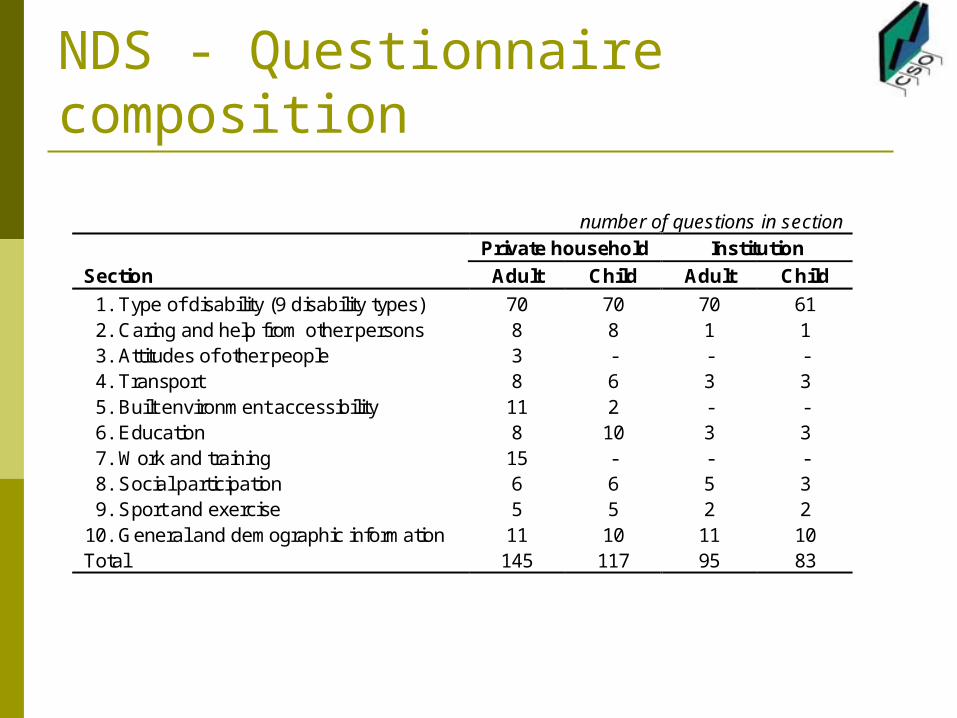
NDS - Questionnaire composition
number of questions in sectionPrivate household Institution
Section Adult Child Adult Child
1. Type of disability (9 disability types) 70 70 70 61 2. Caring and help from other persons 8 8 1 1 3. Attitudes of other people 3 - - - 4. Transport 8 6 3 3 5. Built environment accessibility 11 2 - - 6. Education 8 10 3 3 7. Work and training 15 - - - 8. Social participation 6 6 5 3 9. Sport and exercise 5 5 2 2 10. General and demographic information 11 10 11 10
Total 145 117 95 83
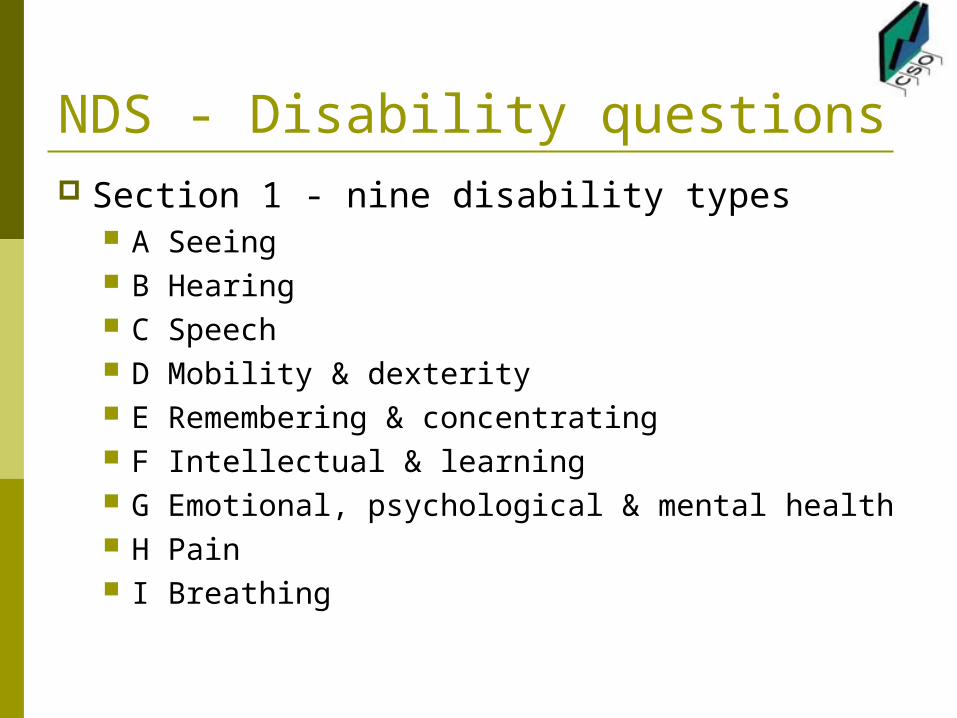
NDS - Disability questions Section 1 - nine disability types
A Seeing B Hearing C Speech D Mobility & dexterity E Remembering & concentrating F Intellectual & learning G Emotional, psychological & mental health H Pain I Breathing
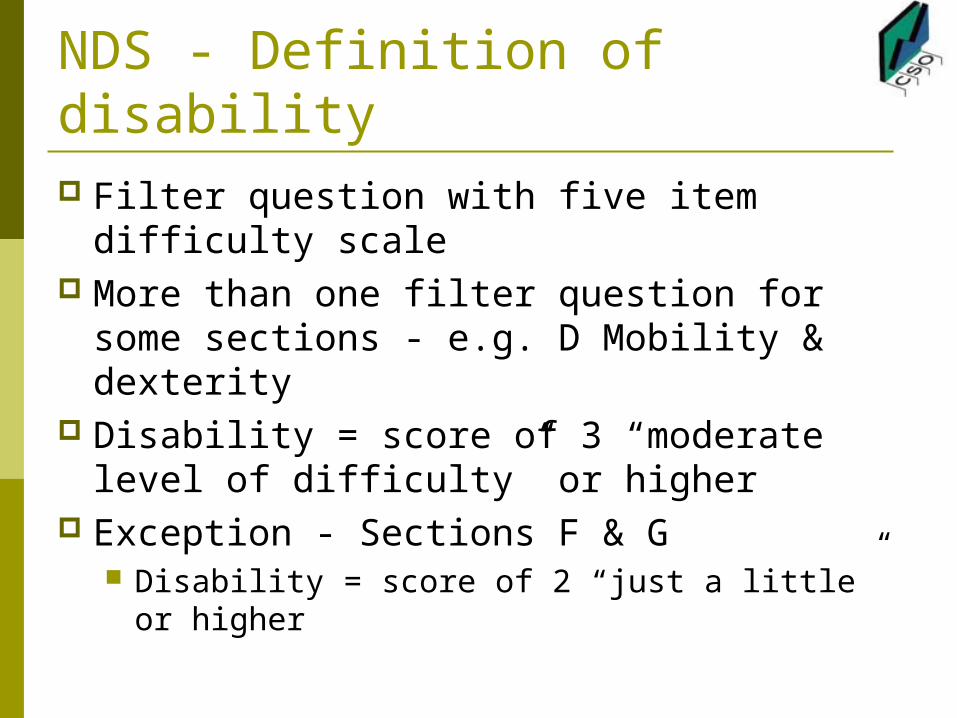
NDS - Definition of disability Filter question with five item difficulty
scale More than one filter question for some
sections - e.g. D Mobility & dexterity Disability = score of 3 “moderate level of
difficulty” or higher Exception - Sections F & G
Disability = score of 2 “just a little” or higher
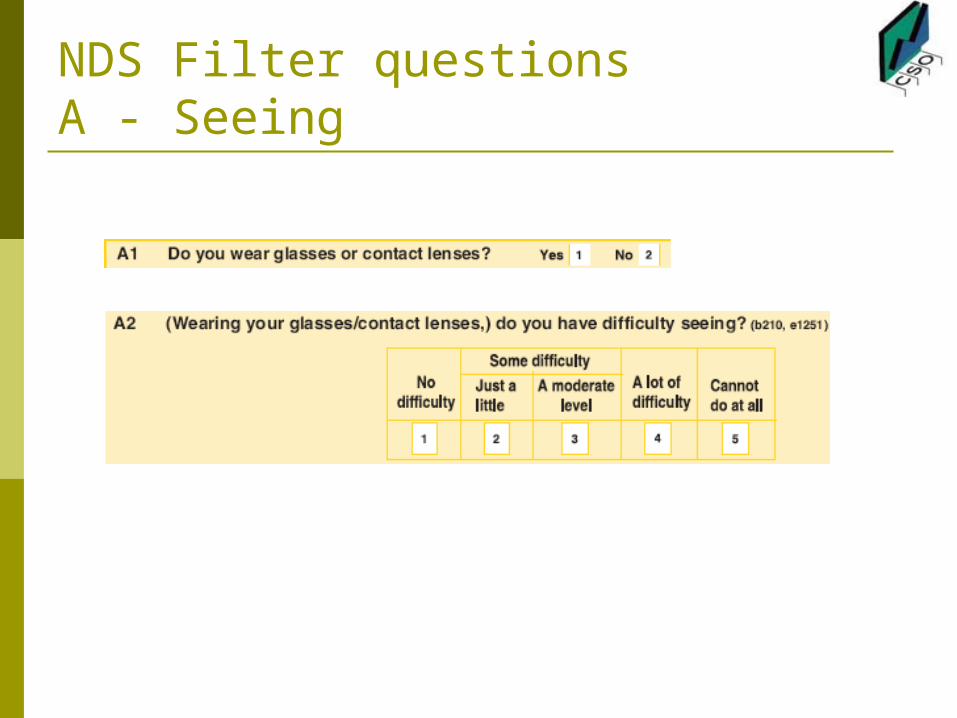
NDS Filter questionsA - Seeing
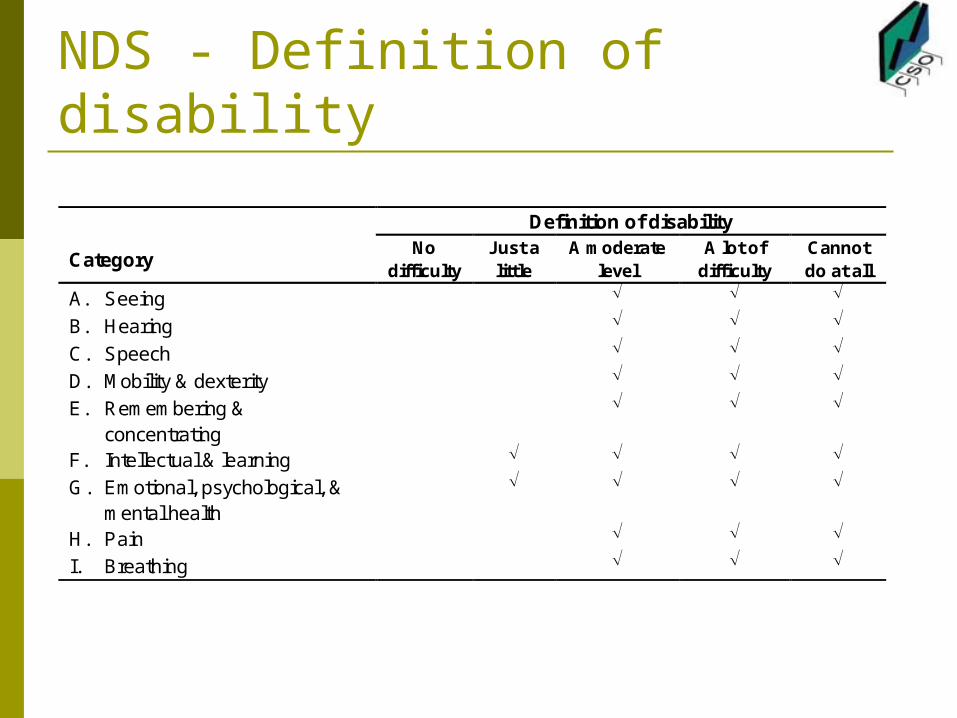
NDS - Definition of disability
Definition of disability
CategoryNo
difficultyJust alittle
A moderatelevel
A lot ofdifficulty
Cannotdo at all
A. Seeing
B. Hearing
C. Speech
D. Mobility & dexterity
E. Remembering &concentrating
F. Intellectual & learning
G. Emotional, psychological, &mental health
H. Pain
I. Breathing
Census and NDS – comparison NDS private household sample matched to
Census data file Analysis here based on unweighted sample
data only Comparison of distribution of ‘Yes’ and ‘No’
responses in each - ‘false positive’ / ‘false negative’ responses to Census question
Types of disability reported in Census and NDS Consistency of reporting of disabilities between
Census and NDS
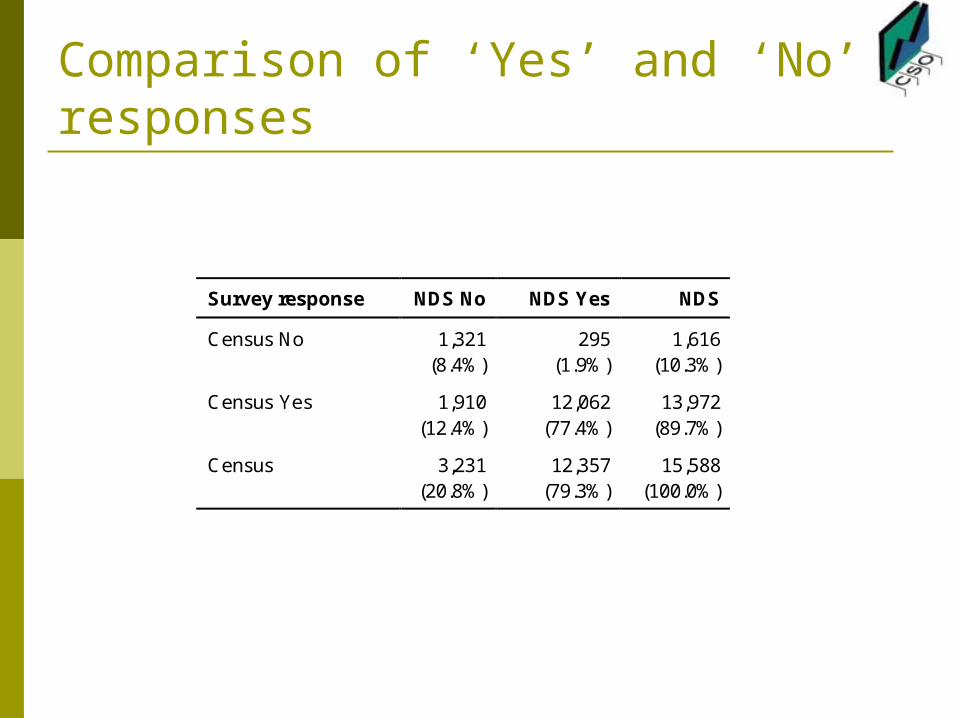
Comparison of ‘Yes’ and ‘No’ responses
Survey response NDS No NDS Yes NDS
Census No 1,321(8.4%)
295(1.9%)
1,616(10.3%)
Census Yes 1,910(12.4%)
12,062(77.4%)
13,972(89.7%)
Census 3,231(20.8%)
12,357(79.3%)
15,588(100.0%)
Census ‘false positives’ Persons reporting a disability in Census
but not in NDS 1,910 persons 2/3 in 18-64 age group 53% - Census category “Other including
chronic illness”
Census ‘false negatives’ Persons reporting disability in NDS who did
not report one in Census 295 persons in sample 51% aged 65 or over Highest proportion of responses:
Pain disability category - 51% Mobility & dexterity disability category - 46%
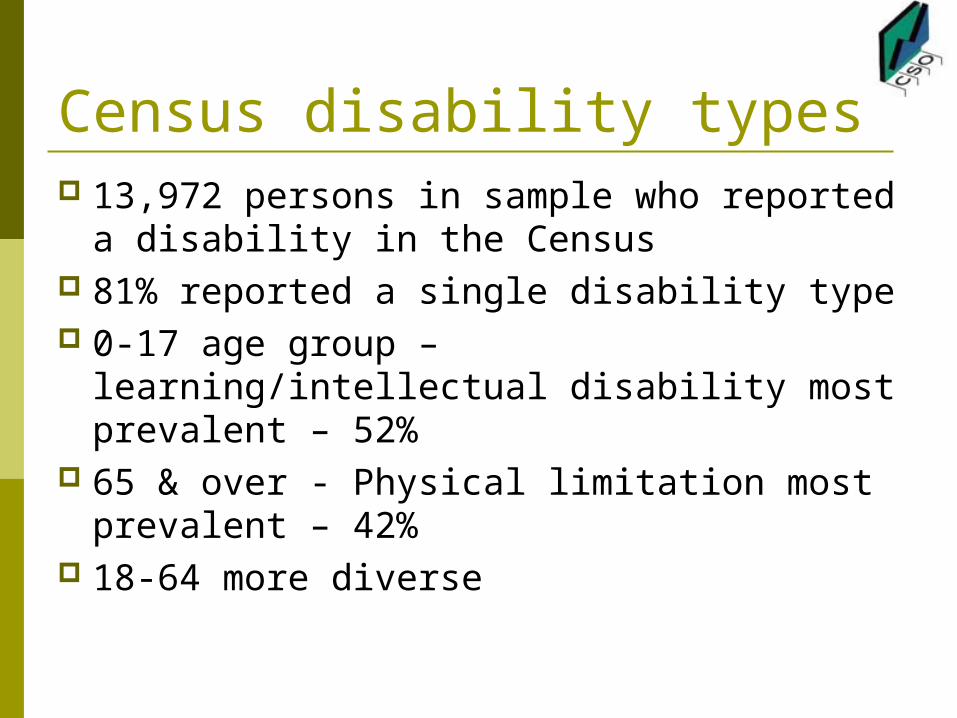
Census disability types 13,972 persons in sample who reported a
disability in the Census 81% reported a single disability type 0-17 age group – learning/intellectual
disability most prevalent – 52% 65 & over - Physical limitation most
prevalent – 42% 18-64 more diverse
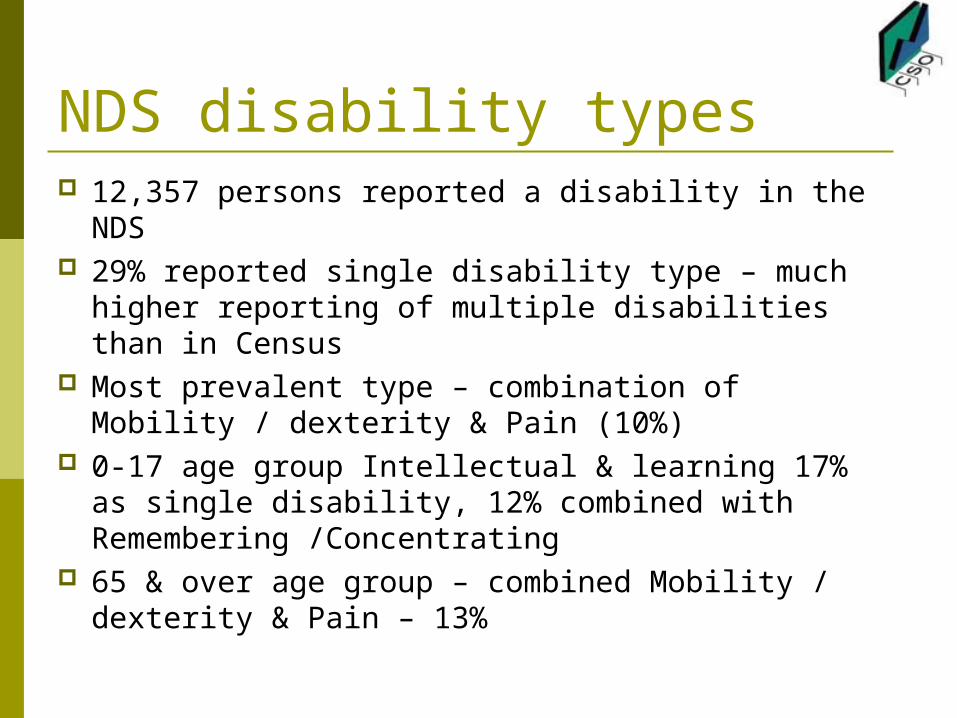
NDS disability types 12,357 persons reported a disability in the NDS 29% reported single disability type – much higher
reporting of multiple disabilities than in Census Most prevalent type – combination of Mobility /
dexterity & Pain (10%) 0-17 age group Intellectual & learning 17% as
single disability, 12% combined with Remembering /Concentrating
65 & over age group – combined Mobility / dexterity & Pain – 13%
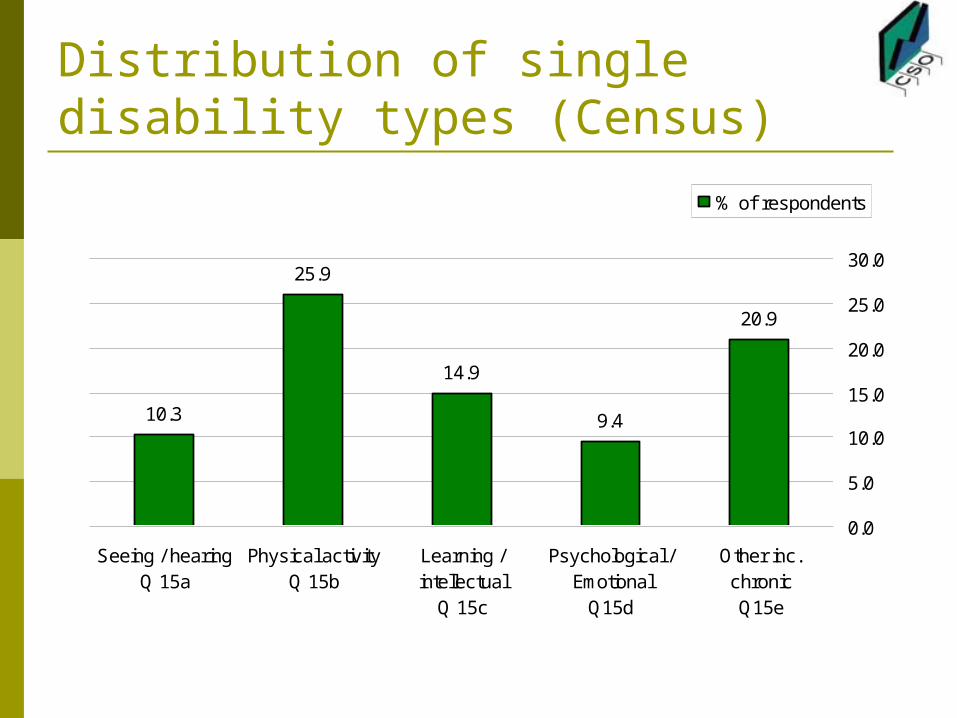
Distribution of single disability types (Census)
10.3
25.9
14.9
9.4
20.9
0.0
5.0
10.0
15.0
20.0
25.0
30.0
Seeing / hearingQ 15a
Physical activityQ 15b
Learning /intellectual
Q 15c
Psychological /Emotional
Q15d
Other inc.chronicQ15e
% of respondents
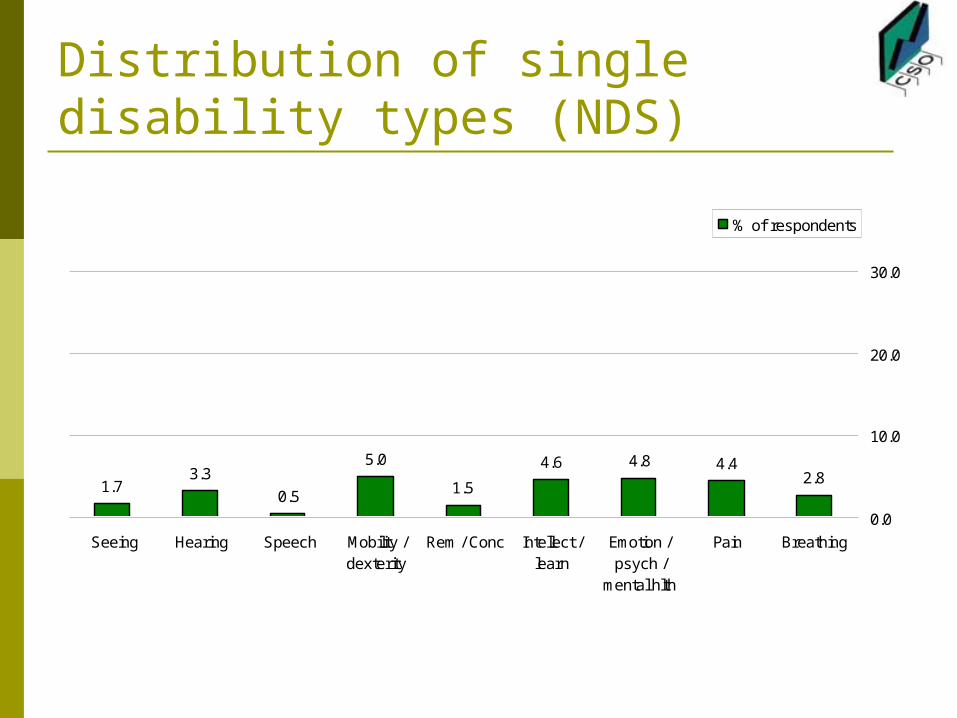
Distribution of single disability types (NDS)
1.73.3
0.5
5.0
1.5
4.6 4.8 4.42.8
0.0
10.0
20.0
30.0
Seeing Hearing Speech Mobility /dexterity
Rem / Conc Intellect /learn
Emotion /psych /
mental hlth
Pain Breathing
% of respondents
NDS and Census disability types - comparison Higher consistency in
Younger (0-17) and older (65 & over) age groups Intellectual / learning disability category
0-17 – 88% with Intellectual/learning disability (F) in NDS reported this on Census Q15c also
65 & over – 79 % with Mobility / dexterity (D) disability in NDS reported physical activity limitation (Q15b) in Census
Greater diversity among 18-64 age group
Conclusions Matching of NDS records to Census at person level,
increases statistical value of NDS output A high proportion of the Census false positive responses in
the sample due to responses in the residual ‘Other’ category >3/4 of sample reported a disability in both surveys The Census questions & methodology resulted in a much
higher level of single disability reporting then in the NDS Learning related difficulties prevalent among children in the
sample Mobility and Pain most prevalent disabilities for older people People of working age had a more mixed range of difficulties