Embed Size (px)
Citation preview
Irish Traveller Movement in Britain The Resource Centre, 356 Holloway Road, London N7 6PA
Tel: 020 7607 2002 Fax: 020 7607 2005 [email protected]
www.irishtraveller.org
Gypsy and Traveller population in England and the
2011 Census
An Irish Traveller Movement in Britain Report August 2013
About ITMB: The Irish Traveller Movement in Britain (ITMB) was established in 1999
and is a leading national policy and voice charity, working to raise the capacity and
social inclusion of the Traveller communities in Britain. ITMB act as a bridge builder
bringing the Traveller communities, service providers and policy makers together,
stimulating debate and promoting forward-looking strategies to promote increased
race equality, civic engagement, inclusion, service provision and community cohesion.
For further information about ITMB visit www.irishtraveller.org.uk
1
1. Introduction and background In December last year, the first ever census figures for the population of Gypsies and Irish Travellers in England and Wales were released. In all 54,895 Gypsies and Irish Travellers in England and 2,785 in Wales were counted.1 While the Census population is considerably less than previous estimates of 150,000-300,000 it is important to acknowledge that tens of thousands of community members did identify as Gypsies and Travellers. In the absence of a robust figure as a comparator to the census, the ITMB undertook research to estimate a minimum population for Gypsies and Travellers in England, based on Local Authority Gypsy and Traveller Accommodation Assessments (GTAA)2 and the Department for Communities and Local Government bi-annual Caravan Count. Definitions of Gypsies and Travellers For the purposes of this report it is important to understand the varying definitions of Gypsies, Irish Travellers and other Travelling groups in official data sources. Understanding these definitions will help understand the limitations of this research and put its findings in context. There are two key distinctions. Firstly the 2011 Census only includes ethnic Romany Gypsies and Irish Travellers, whilst the GTAAs and Caravan Count also include non-ethnic Travellers or caravan dwellers. Secondly the Caravan Count only includes Gypsies and Travellers living in caravans whilst the Census and GTAAs include those in housing. Existing population estimates There have been a number of different estimates of the population of Gypsies and Travellers living in the UK. The first national census of ‘Gypsies and other Travellers’ was carried out in March 1965 and found a total population for England and Wales of 13,401, with 1,040 living in Wales (see Appendix A, 1967 House of Commons Hansard records), however, other sources have cited the 1965 Census figure as 15,500 individuals.3 The 1965 census was acknowledged as an underestimate for two main reasons: Firstly, it was carried out by members of the police force and public health inspectors and was therefore unlikely to encourage cooperation from many Gypsies and Travellers. Secondly it was widely reported that local authorities appeared to be competing to drive Gypsy and Traveller families beyond their own boundaries to reduce future responsibility for these communities.4
1 ONS, 11 December 2012, 2011 Census: KS201EW Ethnic group, local authorities in England and
Wales http://www.ons.gov.uk/ons/publications/re-reference-tables.html?edition=tcm%3A77-286262 2 Housing Act 2004, section 225, Duties of local housing authorities: accommodation needs of gypsies
and travellers http://www.legislation.gov.uk/ukpga/2004/34/section/225
3 Thane, P. (editor), Porter and Taylor, 2010, Unequal Britain: Equalities in Britain Since 1945, p. 83
4 Okely, J. 1983, The Traveller-Gypsies, p. 110
2
The more recent estimate of 90,000-120,000 is a figure which originates in a 1994 Council of Europe report researched and written by the European Roma Academic Jean Pierre Liegeois.5 Liegeois’ estimate is based on the 1991 caravan count, with which he applies an average multiplier for family size and a ‘doubling’ of these figures based on anecdotal evidence from ‘experts and Gypsy/Traveller organisations’ in the UK. However, in a 2007 report by the Council of Europe, the same 1994 figures and methodology appear to be re-used to estimate the Gypsy and Traveller population in the UK, without consideration of new data and population growth in the years between 1994 and 2007.6 What is also evident in the 2007 report is that the population estimate for the UK has increased to 150,000, without explanation for this increase. At the time of writing Council of Europe statistics estimated the UK’s Gypsy, Roma and Traveller population to be in the region of 150,000 to 300,000.7 The COE statistics reference a number of different sources to support these figures, including a 2004 Commission for Racial Equality strategy document. However, the CRE strategy document in question references a 1987 COE report to support the figure of 300,000. Unfortunately for the purposes of this research we were unable to get a copy of this report. What is also unclear is the breakdown of the COE figures between the Gypsy, Roma and Traveller groups. Census 2011 The 2011 census figures show that there are 54,895 Gypsy and Traveller persons living in England equating to 0.1% of the total population. Gypsies and Travellers were by far the smallest group counted when compared to the other smallest categories such as ‘White and Black African’ at 0.3% and ‘Arab’ at 0.4%. ITMB and numerous other Gypsy and Traveller organisations believe that the 2011 census figure is a significant undercount. This is most likely due to many Gypsies and Travellers not self-ascribing as a result of:
- The marginalization and discrimination these communities face on a regular basis leading to mistrust of official processes
- Low educational attainment and poor literacy skills limiting people’s ability to understand and complete the forms
- Failure of the ONS enumeration process to engage marginalised communities, especially those living on unauthorised sites
5 Liegeois, J.P. 1994 Council of Europe, Roma, Gypsies, Travellers
http://books.google.co.uk/books?id=W7l-fGIA2ZkC&printsec=frontcover&source=gbs_ge_summary_r&cad=0#v=onepage&q&f=false 6 Liegeois, J.P. 2007, Council of Europe, p. 27
http://book.coe.int/sysmodules/RBS_fichier/admin/download.php?fileid=3017 7 Council of Europe, 2012, Roma and Travellers
http://www.coe.int/t/dg3/romatravellers/archive/documentation/strategies/statistiques_en.asp
3
2. Methodology The research project utilised population and household estimates in 46 Gypsy Traveller Accommodation Assessments (GTAA) across all the 9 regions of England (see Appendix A). Through the GTAAs we were able to calculate a minimum population of Gypsies and Travellers in England which was then used as a comparator to the figures in the 2011 Census and DCLG caravan count. Some of the GTAAs did not make available the number of individuals but gave an estimate of number of households in the study area. Using the average household size in the GTAAs we were able to calculate the number of individuals. Because most of the GTAAs were conducted between 2005 and 2009, we had to calculate the average annual population growth in the Gypsy and Traveller communities to bring these figures up to 2011 (census year). We did this by taking an average of the estimated population growth figures in each of the GTAAs. As we were previously aware, many GTAAs were of poor quality and just used the DCLG caravan count as a base line figure, whilst other GTAAs were far more robust and utilised local authority household surveys, local schools data and other research to inform their estimates. For this reason the findings in this research most likely represent a significant underestimate of the Gypsy and Traveller population for England and should only be used as a minimum comparator to the 2011 census. This position is supported by the fact that many of the robust GTAAs themselves comment that their figures are most likely an underestimate.
3. Key Findings
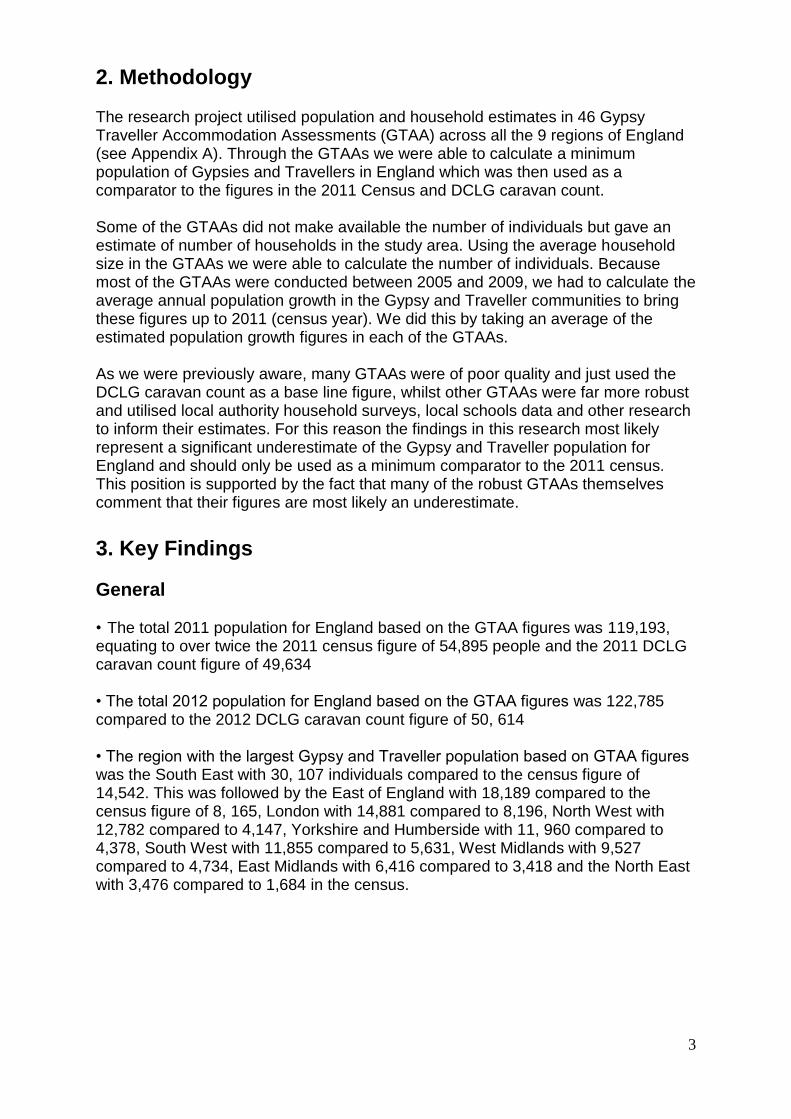
General • The total 2011 population for England based on the GTAA figures was 119,193, equating to over twice the 2011 census figure of 54,895 people and the 2011 DCLG caravan count figure of 49,634 • The total 2012 population for England based on the GTAA figures was 122,785 compared to the 2012 DCLG caravan count figure of 50, 614 • The region with the largest Gypsy and Traveller population based on GTAA figures was the South East with 30, 107 individuals compared to the census figure of 14,542. This was followed by the East of England with 18,189 compared to the census figure of 8, 165, London with 14,881 compared to 8,196, North West with 12,782 compared to 4,147, Yorkshire and Humberside with 11, 960 compared to 4,378, South West with 11,855 compared to 5,631, West Midlands with 9,527 compared to 4,734, East Midlands with 6,416 compared to 3,418 and the North East with 3,476 compared to 1,684 in the census.
4
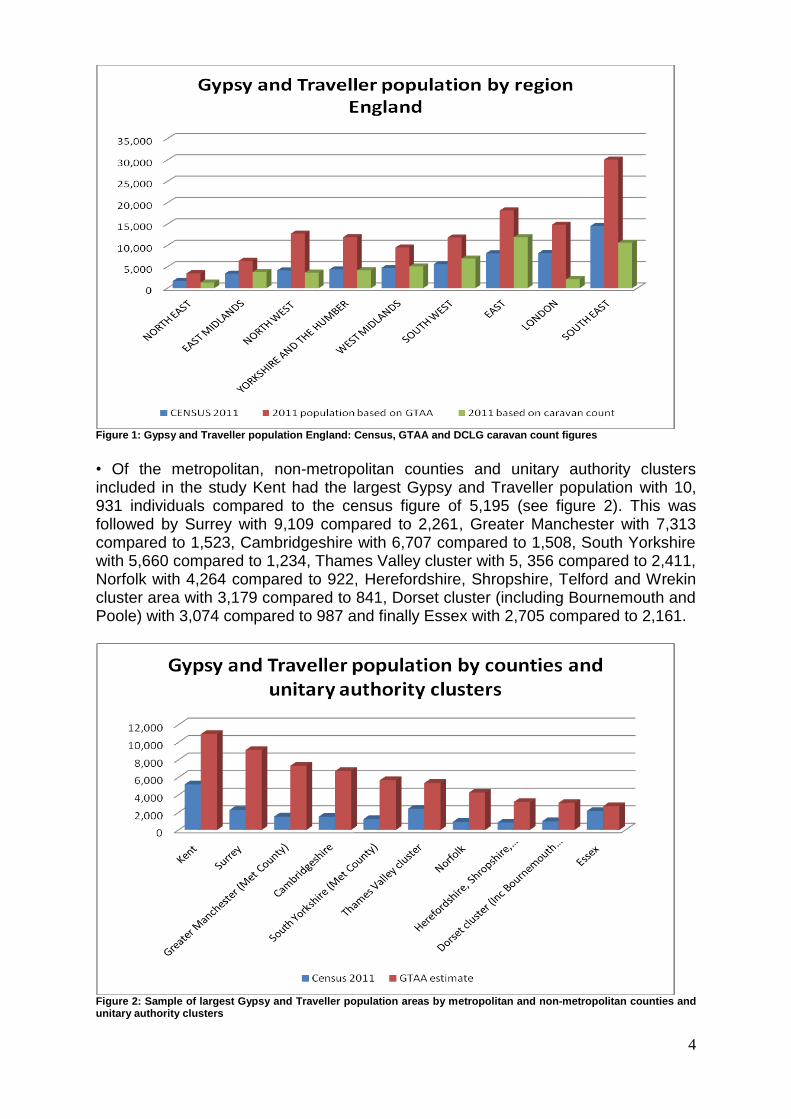
Figure 1: Gypsy and Traveller population England: Census, GTAA and DCLG caravan count figures • Of the metropolitan, non-metropolitan counties and unitary authority clusters included in the study Kent had the largest Gypsy and Traveller population with 10, 931 individuals compared to the census figure of 5,195 (see figure 2). This was followed by Surrey with 9,109 compared to 2,261, Greater Manchester with 7,313 compared to 1,523, Cambridgeshire with 6,707 compared to 1,508, South Yorkshire with 5,660 compared to 1,234, Thames Valley cluster with 5, 356 compared to 2,411, Norfolk with 4,264 compared to 922, Herefordshire, Shropshire, Telford and Wrekin cluster area with 3,179 compared to 841, Dorset cluster (including Bournemouth and Poole) with 3,074 compared to 987 and finally Essex with 2,705 compared to 2,161.
Figure 2: Sample of largest Gypsy and Traveller population areas by metropolitan and non-metropolitan counties and unitary authority clusters
5
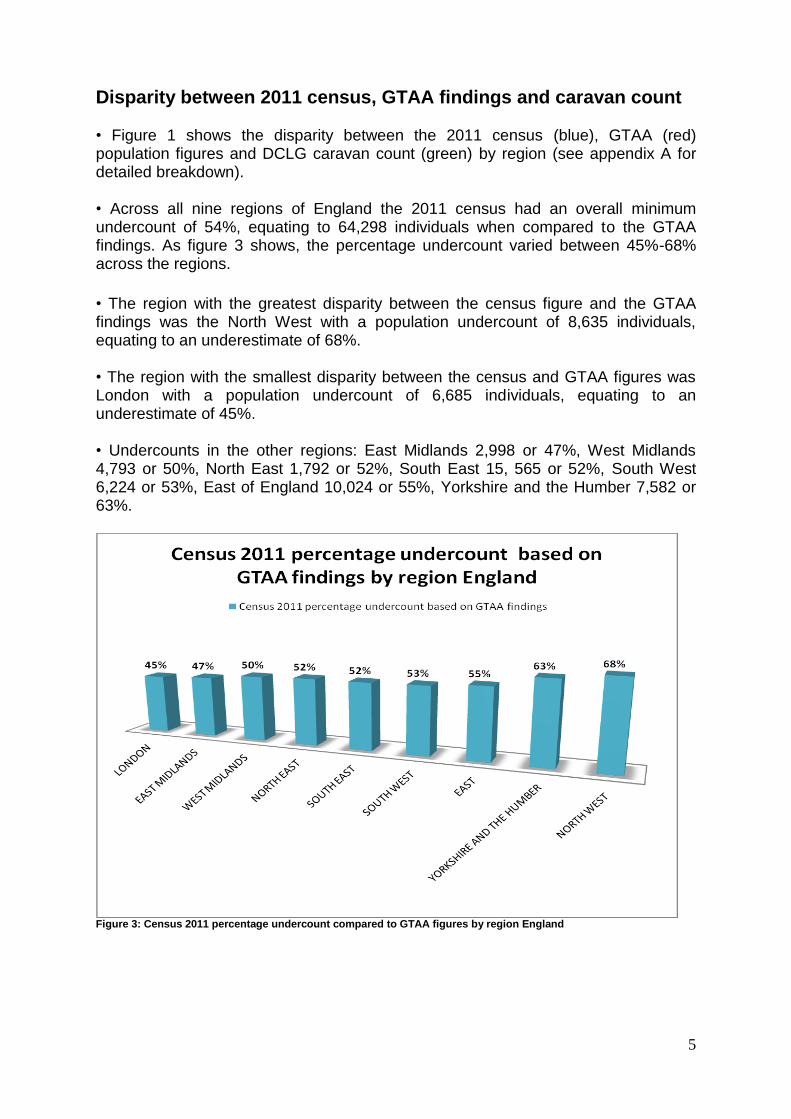
Disparity between 2011 census, GTAA findings and caravan count • Figure 1 shows the disparity between the 2011 census (blue), GTAA (red) population figures and DCLG caravan count (green) by region (see appendix A for detailed breakdown). • Across all nine regions of England the 2011 census had an overall minimum undercount of 54%, equating to 64,298 individuals when compared to the GTAA findings. As figure 3 shows, the percentage undercount varied between 45%-68% across the regions.
• The region with the greatest disparity between the census figure and the GTAA findings was the North West with a population undercount of 8,635 individuals, equating to an underestimate of 68%. • The region with the smallest disparity between the census and GTAA figures was London with a population undercount of 6,685 individuals, equating to an underestimate of 45%. • Undercounts in the other regions: East Midlands 2,998 or 47%, West Midlands 4,793 or 50%, North East 1,792 or 52%, South East 15, 565 or 52%, South West 6,224 or 53%, East of England 10,024 or 55%, Yorkshire and the Humber 7,582 or 63%.
Figure 3: Census 2011 percentage undercount compared to GTAA figures by region England
6
Comparisons between the 2011 census, GTAA findings and caravan count • Figure 1 gives an indication of accommodation types and possible gaps in the census and caravan count data in each of the regions. For example the 2011 caravan count shows that London and the South East both have relatively low populations of Gypsies and Travellers living in caravans compared to the significantly higher census and GTAA population figures. This may indicate a larger population of Gypsies and Travellers living in ‘bricks and mortar’ as a result of the significant land stress in these green belt constrained regions. Considering the disparity between the GTAA findings and the census was 45% and 52% respectively for London and the South East, it’s likely that many of the estimated 6,685 and 15,565 individuals who were not counted in these two regions are residing in ‘bricks and mortar’ accommodation. • Figure 1 also shows areas such as the South West and East of England where the caravan count is significantly larger than the 2011 census yet smaller than the GTAA findings. In the South West this may be attributed to the above average population of New Travellers living in the region who would be included in the GTAA but not in the 2011 Census. In the East of England and the South West the differences in figure 1 may indicate a higher number of unauthorised sites in these regions many of whose residents were not captured in the census data. This is supported by figures in the caravan count showing the highest incidence of unauthorised sites being in the South West and East of England with 31% and 27% respectively (based on number of caravans on unauthorised sites).
4. Conclusion
This report does not claim to give an accurate total estimate for the population of Gypsies and Travellers living in the England which we believe to be significantly higher than found in this research. It does however provide a minimum estimate of the population highlighting the extent to which the 2011 census has undercounted Gypsies and Travellers. In doing so it evidences the case for the ONS to conduct a further study that establishes a more accurate figure for the total population. This is entirely possible considering after 1991 census the ONS looked at the undercount of young Black and Asian males and actually undertook model-based estimates of the undercount. This research has shown that many Gypsies and Travellers have been excluded from the census data resulting in a minimum undercount of 54% or 64,298 individuals. Many of those excluded appear to be living in ‘bricks and mortar’ housing and unauthorised sites. We would also posit that those Gypsies and Travellers who weren’t counted are more likely to experience marginalisation, discrimination and low education and literacy. This research has also shown significant variations in undercounts throughout regions and districts and in certain local authority areas such as Doncaster where the estimated minimum population is nearly 7 times greater than that in the census. This raises serious questions about the 2011 census enumeration process in these areas and wider issues as to how local services are engaging and being inclusive of Gypsies and Travellers.
7
5. Recommendations • The ONS should undertake a model-based estimate of the 2011 Census undercount of Gypsies and Travellers and produce revised population figures for these communities. • Welcome the ONS commitment to conduct a Gypsy and Irish Traveller census analysis in consultation with community members and representative organisations. Where possible (depending on the risk of disclosure) the ONS should ensure detailed characteristics are available at the local and regional level to inform Joint Strategic Needs Assessments, Accommodation Needs Assessments and other assessments that inform service providers. • When allocating budgets and services, local authorities should take into consideration the 2011 census undercount of Gypsies and Travellers and ensure they conduct a robust assessment of their local population and its needs. • Government departments should collate their data in line with the ethnic categories in the 2011 census which includes Gypsies and Travellers. • The ONS should supply information on the number of enumerators used at Local Authority level in the 2011 census identifying any differential amounts of resource used to collect data that may have impacted on undercounts in specific areas.
8
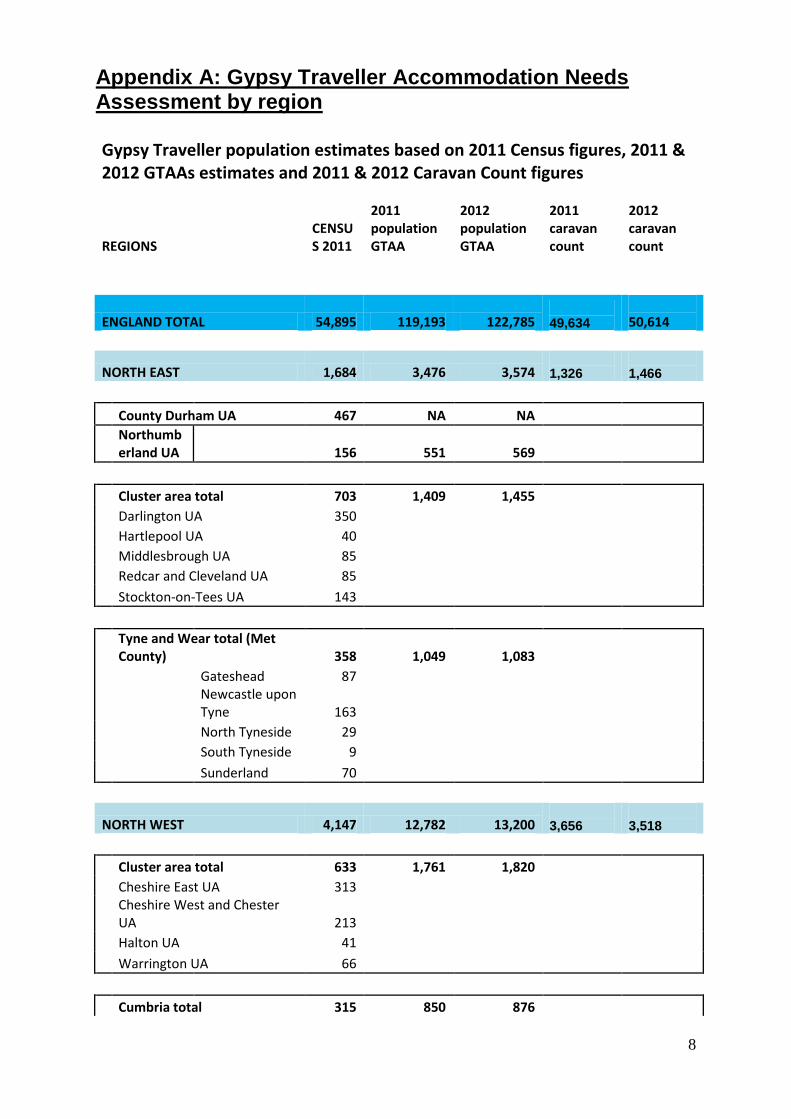
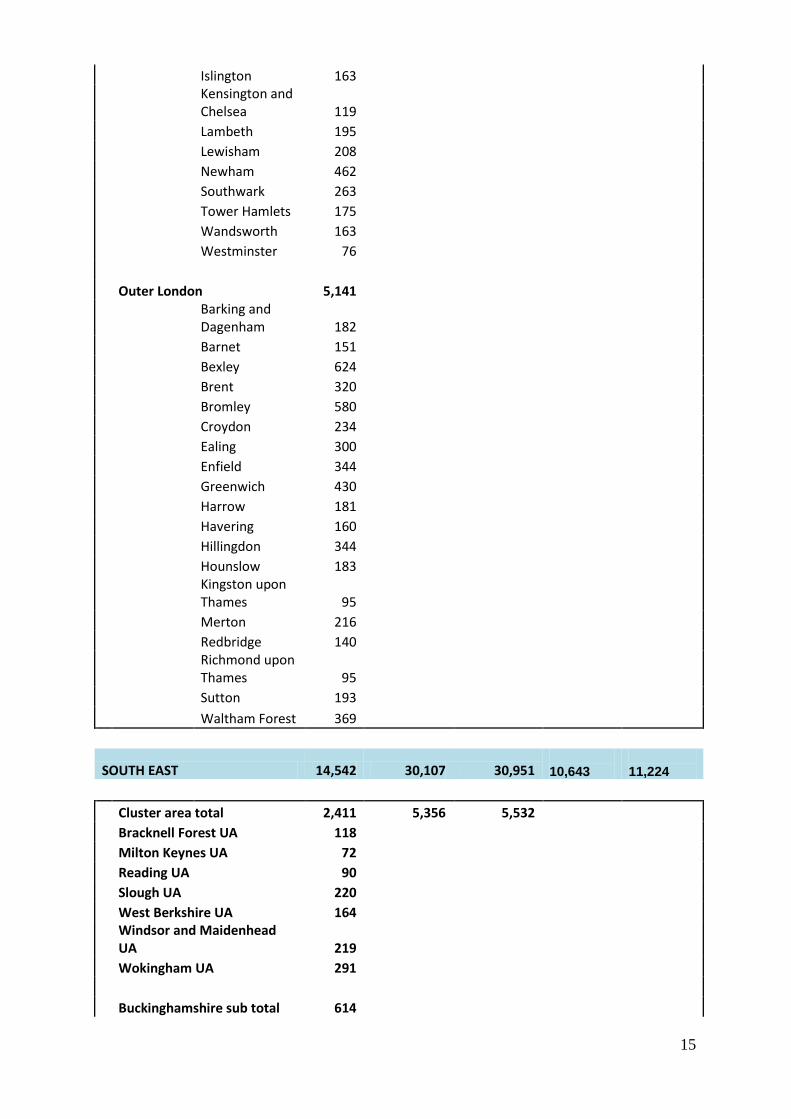
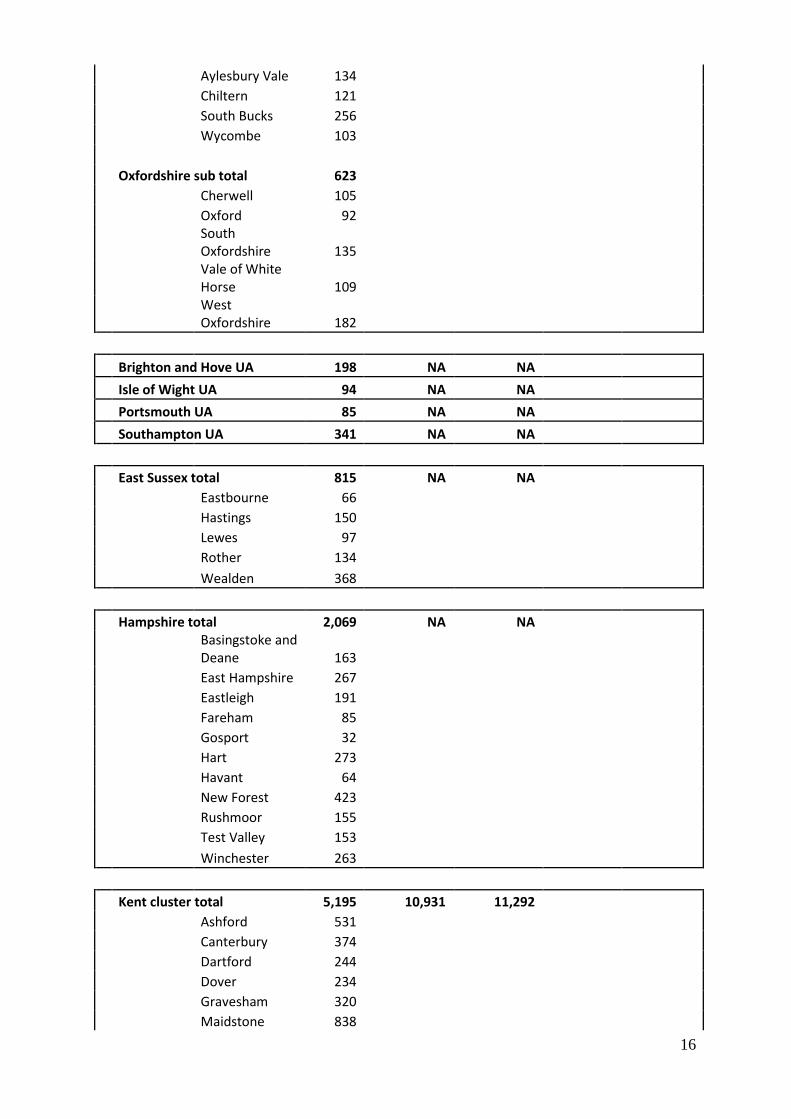
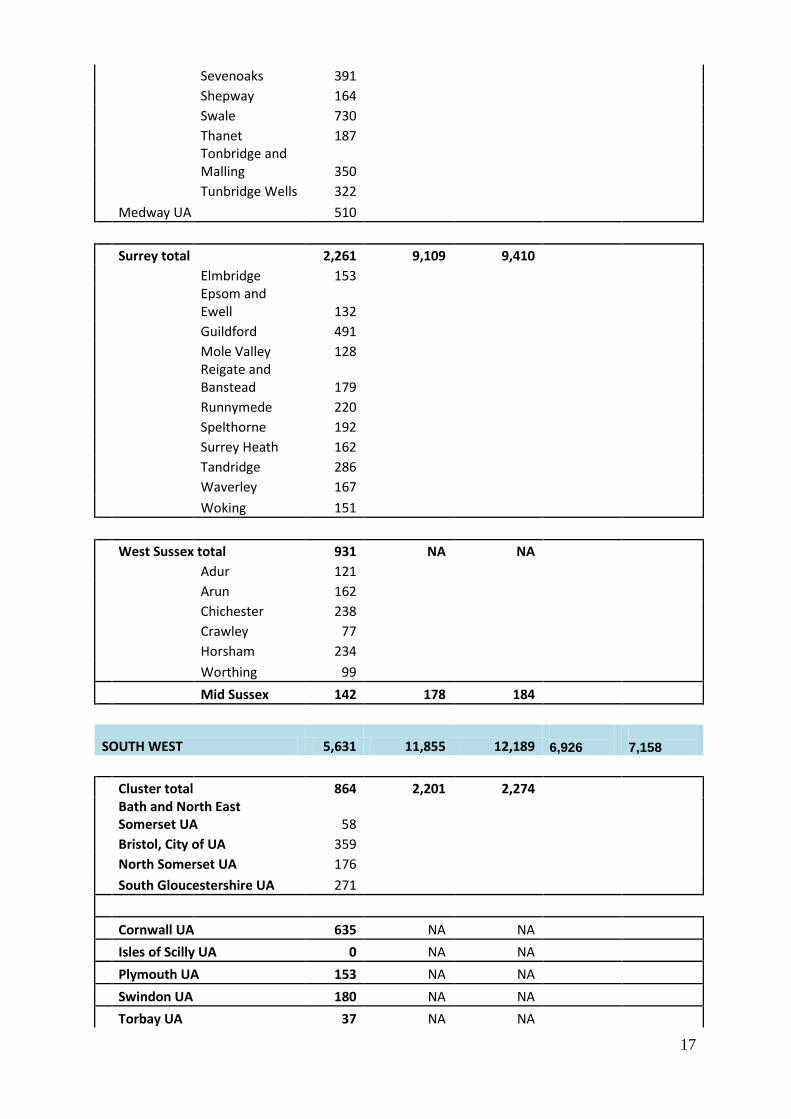
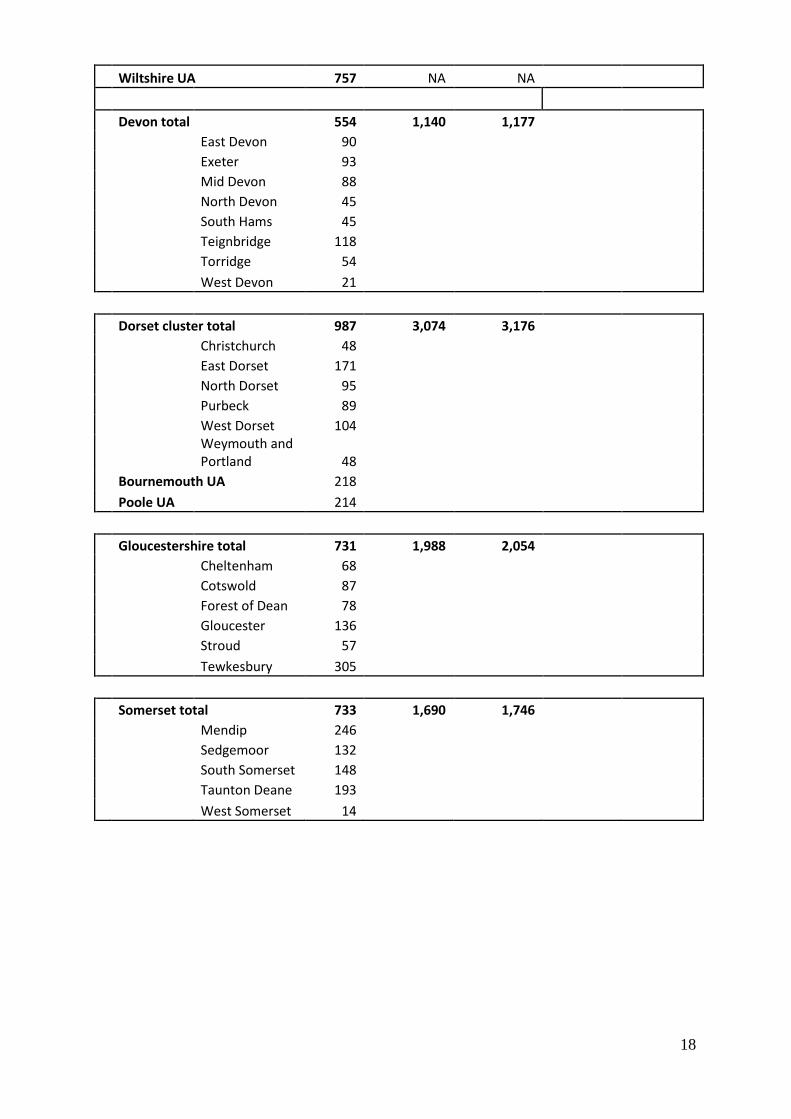
Appendix A: Gypsy Traveller Accommodation Needs Assessment by region Gypsy Traveller population estimates based on 2011 Census figures, 2011 & 2012 GTAAs estimates and 2011 & 2012 Caravan Count figures
REGIONS CENSUS 2011
2011 population GTAA
2012 population GTAA
2011 caravan count
2012 caravan count
ENGLAND TOTAL 54,895 119,193 122,785
49,634
50,614
NORTH EAST 1,684 3,476 3,574
1,326
1,466
County Durham UA 467 NA NA
Northumberland UA 156 551 569
Cluster area total 703 1,409 1,455
Darlington UA 350
Hartlepool UA 40
Middlesbrough UA 85
Redcar and Cleveland UA 85
Stockton-on-Tees UA 143
Tyne and Wear total (Met County) 358 1,049 1,083
Gateshead 87
Newcastle upon Tyne 163
North Tyneside 29
South Tyneside 9
Sunderland 70
NORTH WEST 4,147 12,782 13,200
3,656
3,518
Cluster area total 633 1,761 1,820
Cheshire East UA 313
Cheshire West and Chester UA 213
Halton UA 41
Warrington UA 66
Cumbria total 315 850 876
9
Allerdale 14
Barrow-in-Furness 39
Carlisle 196
Copeland 15
Eden 15
South Lakeland 36
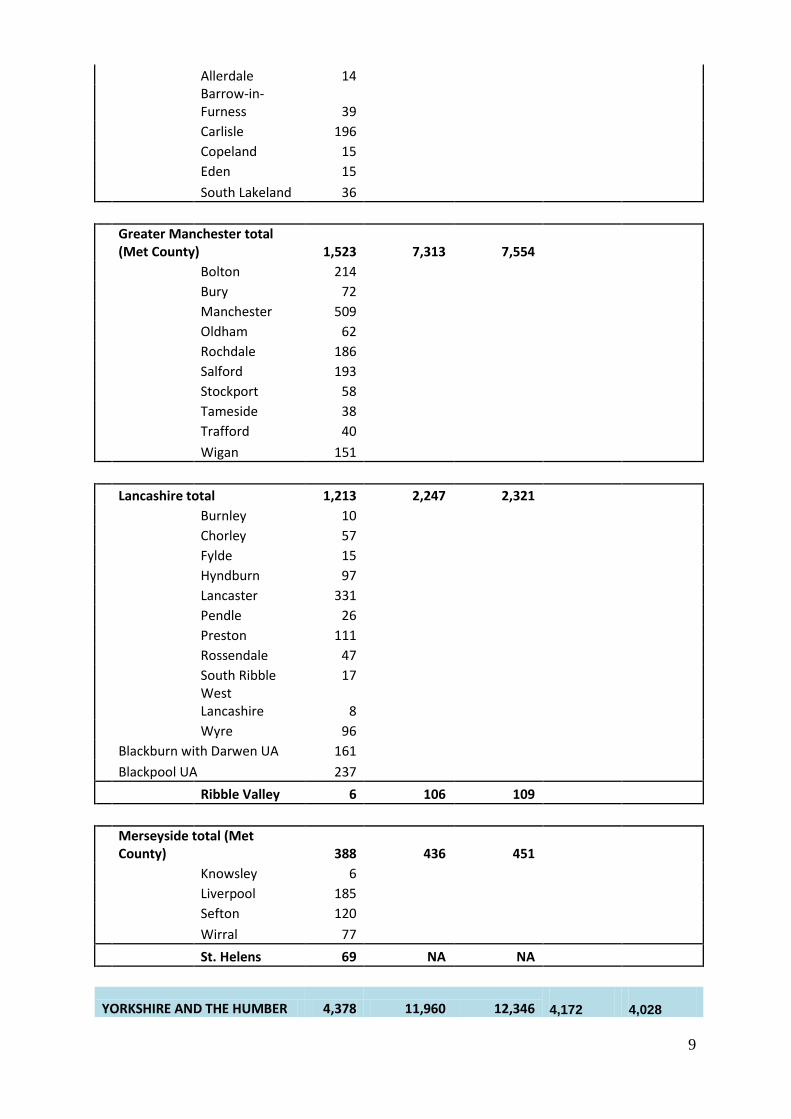
Greater Manchester total (Met County) 1,523 7,313 7,554
Bolton 214
Bury 72
Manchester 509
Oldham 62
Rochdale 186
Salford 193
Stockport 58
Tameside 38
Trafford 40
Wigan 151
Lancashire total 1,213 2,247 2,321
Burnley 10
Chorley 57
Fylde 15
Hyndburn 97
Lancaster 331
Pendle 26
Preston 111
Rossendale 47
South Ribble 17
West Lancashire 8
Wyre 96
Blackburn with Darwen UA 161
Blackpool UA 237
Ribble Valley 6 106 109
Merseyside total (Met County) 388 436 451
Knowsley 6
Liverpool 185
Sefton 120
Wirral 77
St. Helens 69 NA NA
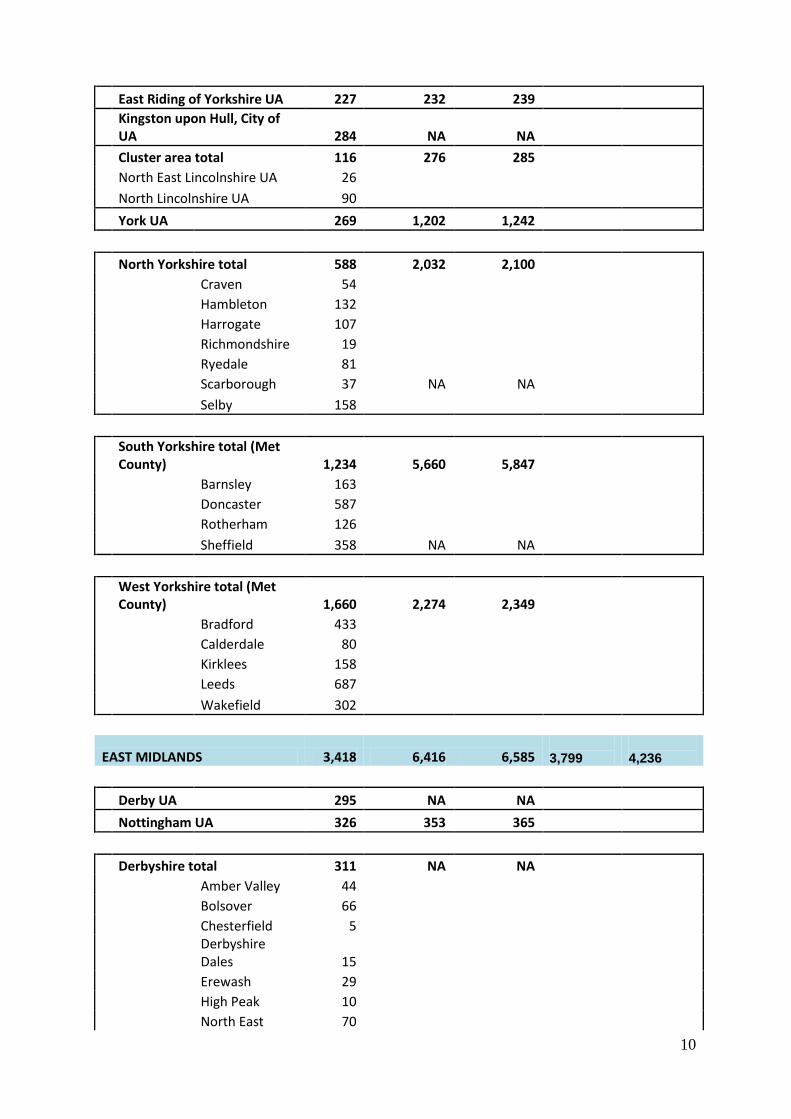
YORKSHIRE AND THE HUMBER 4,378 11,960 12,346
4,172
4,028
10
East Riding of Yorkshire UA 227 232 239
Kingston upon Hull, City of UA 284 NA NA
Cluster area total 116 276 285
North East Lincolnshire UA 26
North Lincolnshire UA 90
York UA 269 1,202 1,242
North Yorkshire total 588 2,032 2,100
Craven 54
Hambleton 132
Harrogate 107
Richmondshire 19
Ryedale 81
Scarborough 37 NA NA
Selby 158
South Yorkshire total (Met County) 1,234 5,660 5,847
Barnsley 163
Doncaster 587
Rotherham 126
Sheffield 358 NA NA
West Yorkshire total (Met County) 1,660 2,274 2,349
Bradford 433
Calderdale 80
Kirklees 158
Leeds 687
Wakefield 302
EAST MIDLANDS 3,418 6,416 6,585
3,799
4,236
Derby UA 295 NA NA
Nottingham UA 326 353 365
Derbyshire total 311 NA NA
Amber Valley 44
Bolsover 66
Chesterfield 5
Derbyshire Dales 15
Erewash 29
High Peak 10
North East 70
11
Derbyshire
South Derbyshire 72
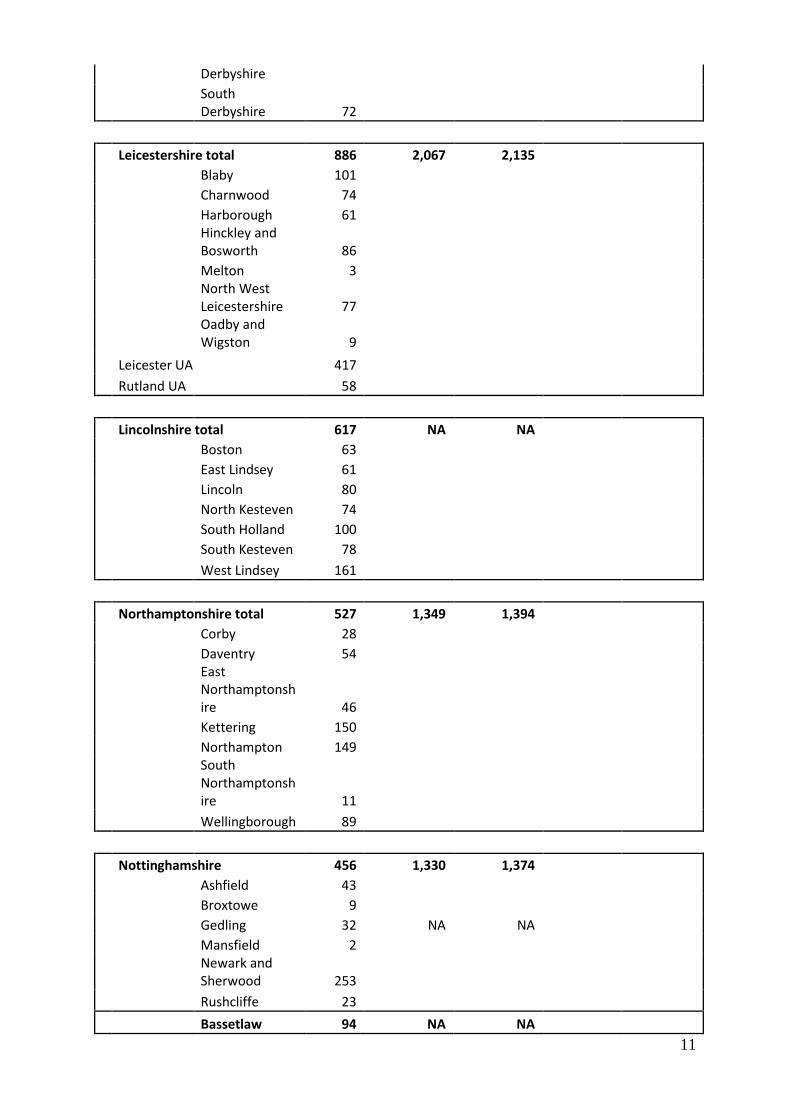
Leicestershire total 886 2,067 2,135
Blaby 101
Charnwood 74
Harborough 61
Hinckley and Bosworth 86
Melton 3
North West Leicestershire 77
Oadby and Wigston 9
Leicester UA 417
Rutland UA 58
Lincolnshire total 617 NA NA
Boston 63
East Lindsey 61
Lincoln 80
North Kesteven 74
South Holland 100
South Kesteven 78
West Lindsey 161
Northamptonshire total 527 1,349 1,394
Corby 28
Daventry 54
East Northamptonshire 46
Kettering 150
Northampton 149
South Northamptonshire 11
Wellingborough 89
Nottinghamshire 456 1,330 1,374
Ashfield 43
Broxtowe 9
Gedling 32 NA NA
Mansfield 2
Newark and Sherwood 253
Rushcliffe 23
Bassetlaw 94 NA NA
12
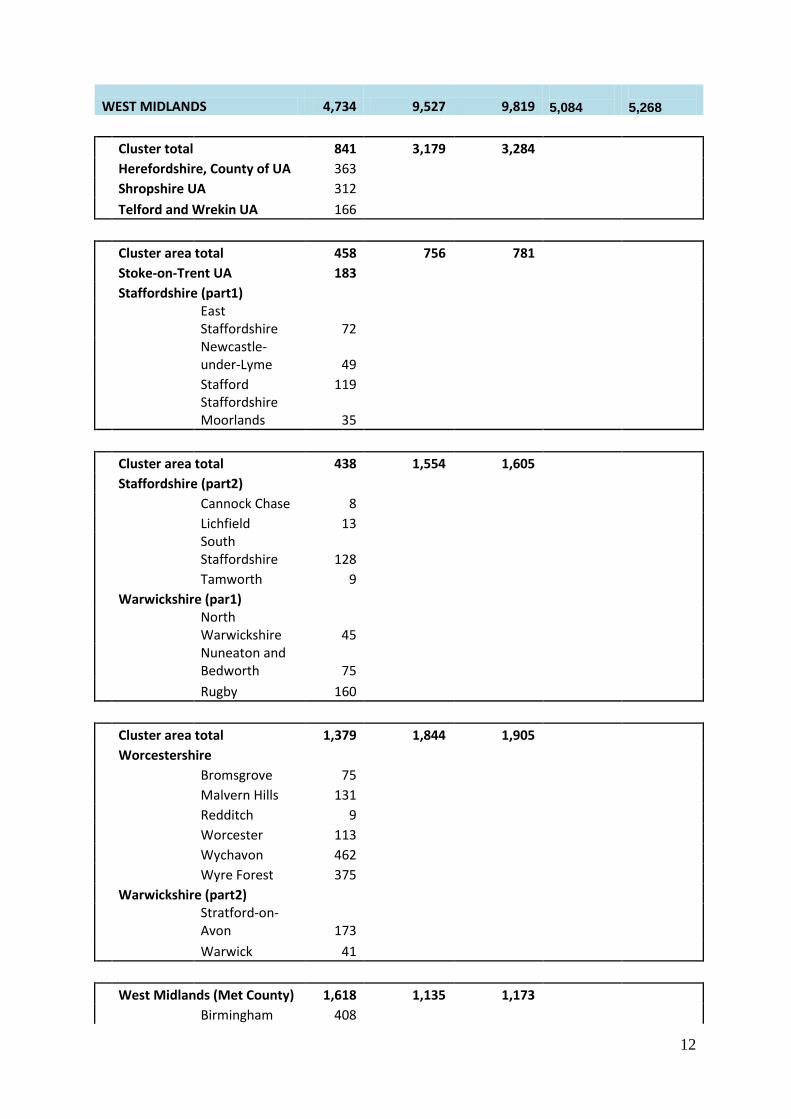
WEST MIDLANDS 4,734 9,527 9,819
5,084
5,268
Cluster total 841 3,179 3,284
Herefordshire, County of UA 363
Shropshire UA 312
Telford and Wrekin UA 166
Cluster area total 458 756 781
Stoke-on-Trent UA 183
Staffordshire (part1)
East Staffordshire 72
Newcastle-under-Lyme 49
Stafford 119
Staffordshire Moorlands 35
Cluster area total 438 1,554 1,605
Staffordshire (part2)
Cannock Chase 8
Lichfield 13
South Staffordshire 128
Tamworth 9
Warwickshire (par1)
North Warwickshire 45
Nuneaton and Bedworth 75
Rugby 160
Cluster area total 1,379 1,844 1,905
Worcestershire
Bromsgrove 75
Malvern Hills 131
Redditch 9
Worcester 113
Wychavon 462
Wyre Forest 375
Warwickshire (part2)
Stratford-on-Avon 173
Warwick 41
West Midlands (Met County) 1,618 1,135 1,173
Birmingham 408
13
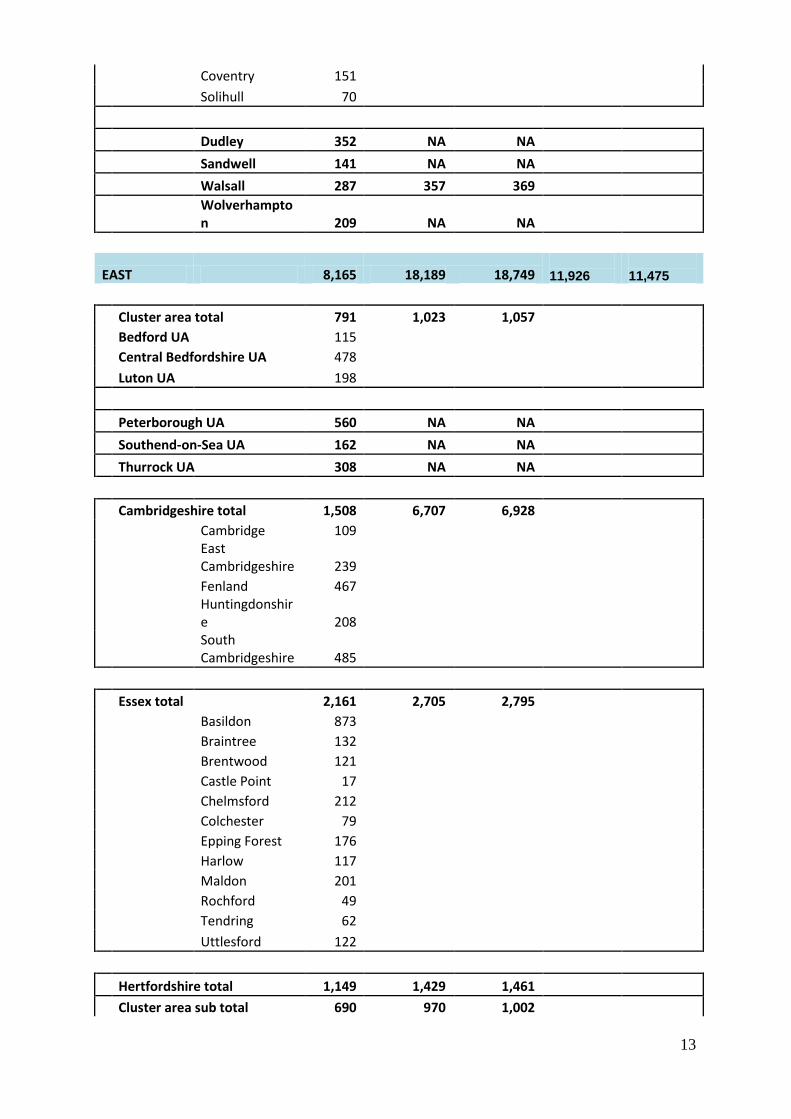
Coventry 151
Solihull 70
Dudley 352 NA NA
Sandwell 141 NA NA
Walsall 287 357 369
Wolverhampton 209 NA NA
EAST 8,165 18,189 18,749
11,926
11,475
Cluster area total 791 1,023 1,057
Bedford UA 115
Central Bedfordshire UA 478
Luton UA 198
Peterborough UA 560 NA NA
Southend-on-Sea UA 162 NA NA
Thurrock UA 308 NA NA
Cambridgeshire total 1,508 6,707 6,928
Cambridge 109
East Cambridgeshire 239
Fenland 467
Huntingdonshire 208
South Cambridgeshire 485
Essex total 2,161 2,705 2,795
Basildon 873
Braintree 132
Brentwood 121
Castle Point 17
Chelmsford 212
Colchester 79
Epping Forest 176
Harlow 117
Maldon 201
Rochford 49
Tendring 62
Uttlesford 122
Hertfordshire total 1,149 1,429 1,461
Cluster area sub total 690 970 1,002
14
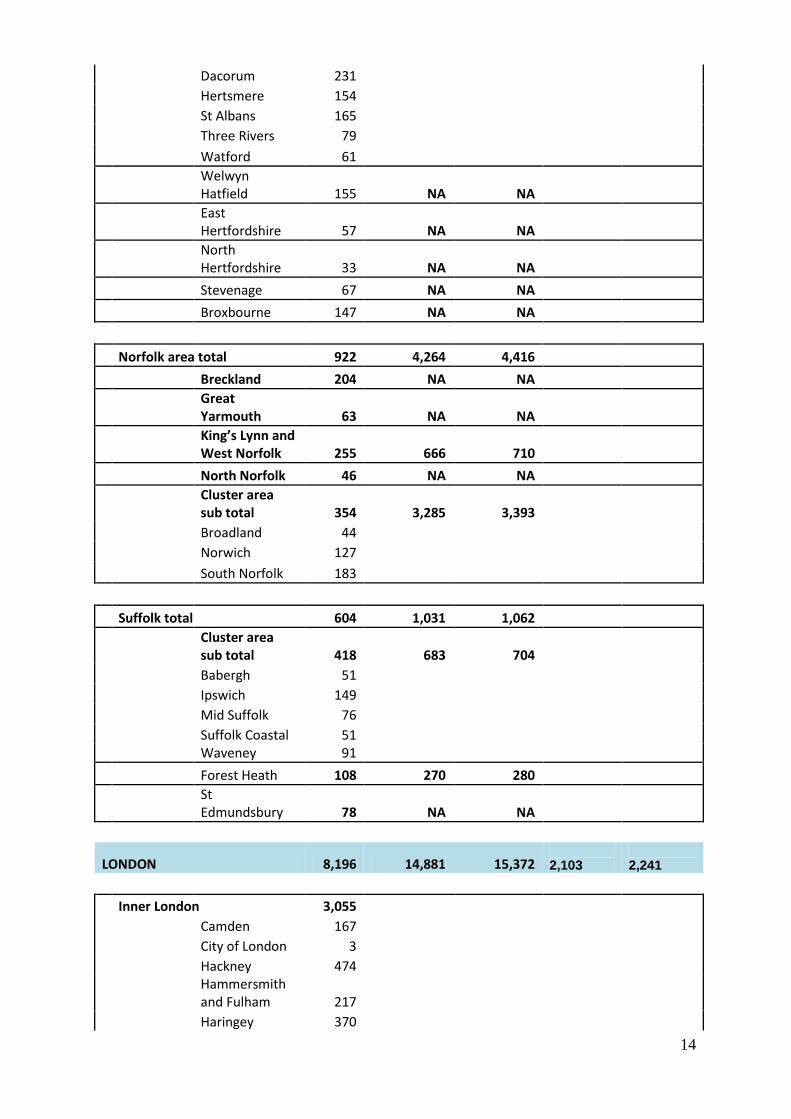
Dacorum 231
Hertsmere 154
St Albans 165
Three Rivers 79
Watford 61
Welwyn Hatfield 155 NA NA
East Hertfordshire 57 NA NA
North Hertfordshire 33 NA NA
Stevenage 67 NA NA
Broxbourne 147 NA NA
Norfolk area total 922 4,264 4,416
Breckland 204 NA NA
Great Yarmouth 63 NA NA
King’s Lynn and West Norfolk 255 666 710
North Norfolk 46 NA NA
Cluster area sub total 354 3,285 3,393
Broadland 44
Norwich 127
South Norfolk 183
Suffolk total 604 1,031 1,062
Cluster area sub total 418 683 704
Babergh 51
Ipswich 149
Mid Suffolk 76
Suffolk Coastal 51
Waveney 91
Forest Heath 108 270 280
St Edmundsbury 78 NA NA
LONDON 8,196 14,881 15,372
2,103
2,241
Inner London 3,055
Camden 167
City of London 3
Hackney 474
Hammersmith and Fulham 217
Haringey 370
15
Islington 163
Kensington and Chelsea 119
Lambeth 195
Lewisham 208
Newham 462
Southwark 263
Tower Hamlets 175
Wandsworth 163
Westminster 76
Outer London 5,141
Barking and Dagenham 182
Barnet 151
Bexley 624
Brent 320
Bromley 580
Croydon 234
Ealing 300
Enfield 344
Greenwich 430
Harrow 181
Havering 160
Hillingdon 344
Hounslow 183
Kingston upon Thames 95
Merton 216
Redbridge 140
Richmond upon Thames 95
Sutton 193
Waltham Forest 369
SOUTH EAST 14,542 30,107 30,951
10,643
11,224
Cluster area total 2,411 5,356 5,532
Bracknell Forest UA 118
Milton Keynes UA 72
Reading UA 90
Slough UA 220
West Berkshire UA 164
Windsor and Maidenhead UA 219
Wokingham UA 291
Buckinghamshire sub total 614
16
Aylesbury Vale 134
Chiltern 121
South Bucks 256
Wycombe 103
Oxfordshire sub total 623
Cherwell 105
Oxford 92
South Oxfordshire 135
Vale of White Horse 109
West Oxfordshire 182
Brighton and Hove UA 198 NA NA
Isle of Wight UA 94 NA NA
Portsmouth UA 85 NA NA
Southampton UA 341 NA NA
East Sussex total 815 NA NA
Eastbourne 66
Hastings 150
Lewes 97
Rother 134
Wealden 368
Hampshire total 2,069 NA NA
Basingstoke and Deane 163
East Hampshire 267
Eastleigh 191
Fareham 85
Gosport 32
Hart 273
Havant 64
New Forest 423
Rushmoor 155
Test Valley 153
Winchester 263
Kent cluster total 5,195 10,931 11,292
Ashford 531
Canterbury 374
Dartford 244
Dover 234
Gravesham 320
Maidstone 838
17
Sevenoaks 391
Shepway 164
Swale 730
Thanet 187
Tonbridge and Malling 350
Tunbridge Wells 322
Medway UA 510
Surrey total 2,261 9,109 9,410
Elmbridge 153
Epsom and Ewell 132
Guildford 491
Mole Valley 128
Reigate and Banstead 179
Runnymede 220
Spelthorne 192
Surrey Heath 162
Tandridge 286
Waverley 167
Woking 151
West Sussex total 931 NA NA
Adur 121
Arun 162
Chichester 238
Crawley 77
Horsham 234
Worthing 99
Mid Sussex 142 178 184
SOUTH WEST 5,631 11,855 12,189
6,926
7,158
Cluster total 864 2,201 2,274
Bath and North East Somerset UA 58
Bristol, City of UA 359
North Somerset UA 176
South Gloucestershire UA 271
Cornwall UA 635 NA NA
Isles of Scilly UA 0 NA NA
Plymouth UA 153 NA NA
Swindon UA 180 NA NA
Torbay UA 37 NA NA
18
Wiltshire UA 757 NA NA
Devon total 554 1,140 1,177
East Devon 90
Exeter 93
Mid Devon 88
North Devon 45
South Hams 45
Teignbridge 118
Torridge 54
West Devon 21
Dorset cluster total 987 3,074 3,176
Christchurch 48
East Dorset 171
North Dorset 95
Purbeck 89
West Dorset 104
Weymouth and Portland 48
Bournemouth UA 218
Poole UA 214
Gloucestershire total 731 1,988 2,054
Cheltenham 68
Cotswold 87
Forest of Dean 78
Gloucester 136
Stroud 57
Tewkesbury 305
Somerset total 733 1,690 1,746
Mendip 246
Sedgemoor 132
South Somerset 148
Taunton Deane 193
West Somerset 14
19
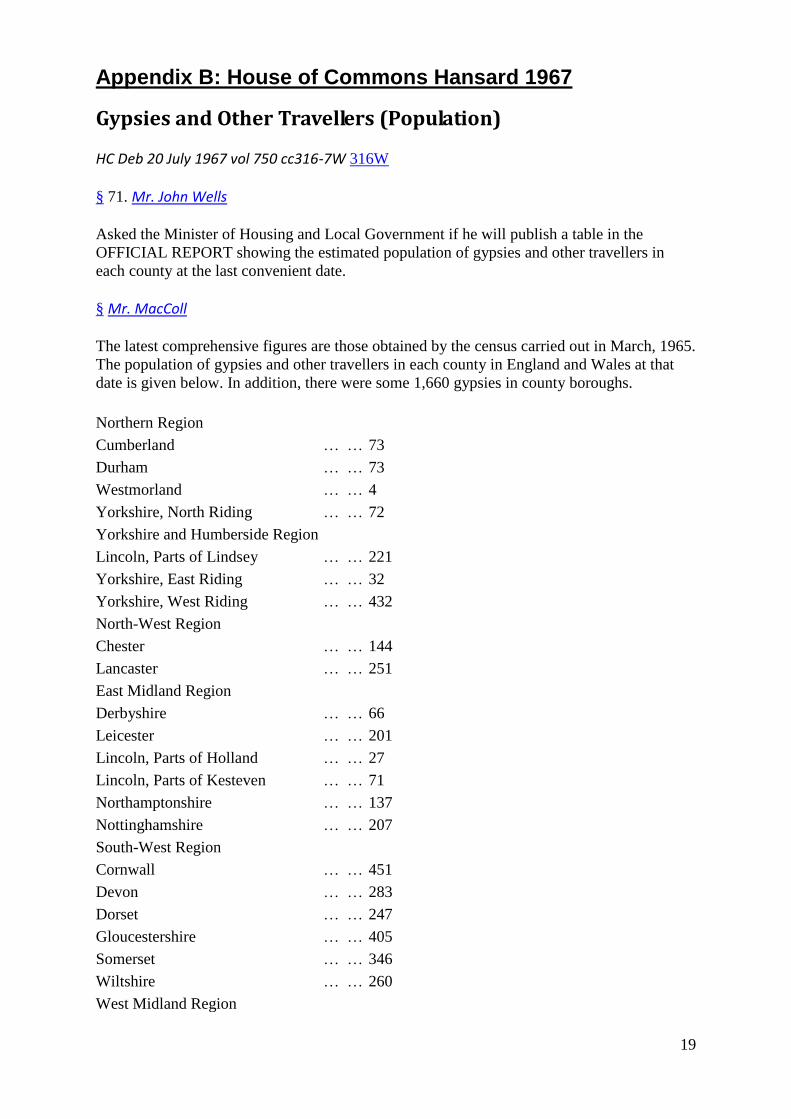
Appendix B: House of Commons Hansard 1967
Gypsies and Other Travellers (Population)
HC Deb 20 July 1967 vol 750 cc316-7W 316W
§ 71. Mr. John Wells
Asked the Minister of Housing and Local Government if he will publish a table in the
OFFICIAL REPORT showing the estimated population of gypsies and other travellers in
each county at the last convenient date.
§ Mr. MacColl
The latest comprehensive figures are those obtained by the census carried out in March, 1965.
The population of gypsies and other travellers in each county in England and Wales at that
date is given below. In addition, there were some 1,660 gypsies in county boroughs.
Northern Region
Cumberland … … 73
Durham … … 73
Westmorland … … 4
Yorkshire, North Riding … … 72
Yorkshire and Humberside Region
Lincoln, Parts of Lindsey … … 221
Yorkshire, East Riding … … 32
Yorkshire, West Riding … … 432
North-West Region
Chester … … 144
Lancaster … … 251
East Midland Region
Derbyshire … … 66
Leicester … … 201
Lincoln, Parts of Holland … … 27
Lincoln, Parts of Kesteven … … 71
Northamptonshire … … 137
Nottinghamshire … … 207
South-West Region
Cornwall … … 451
Devon … … 283
Dorset … … 247
Gloucestershire … … 405
Somerset … … 346
Wiltshire … … 260
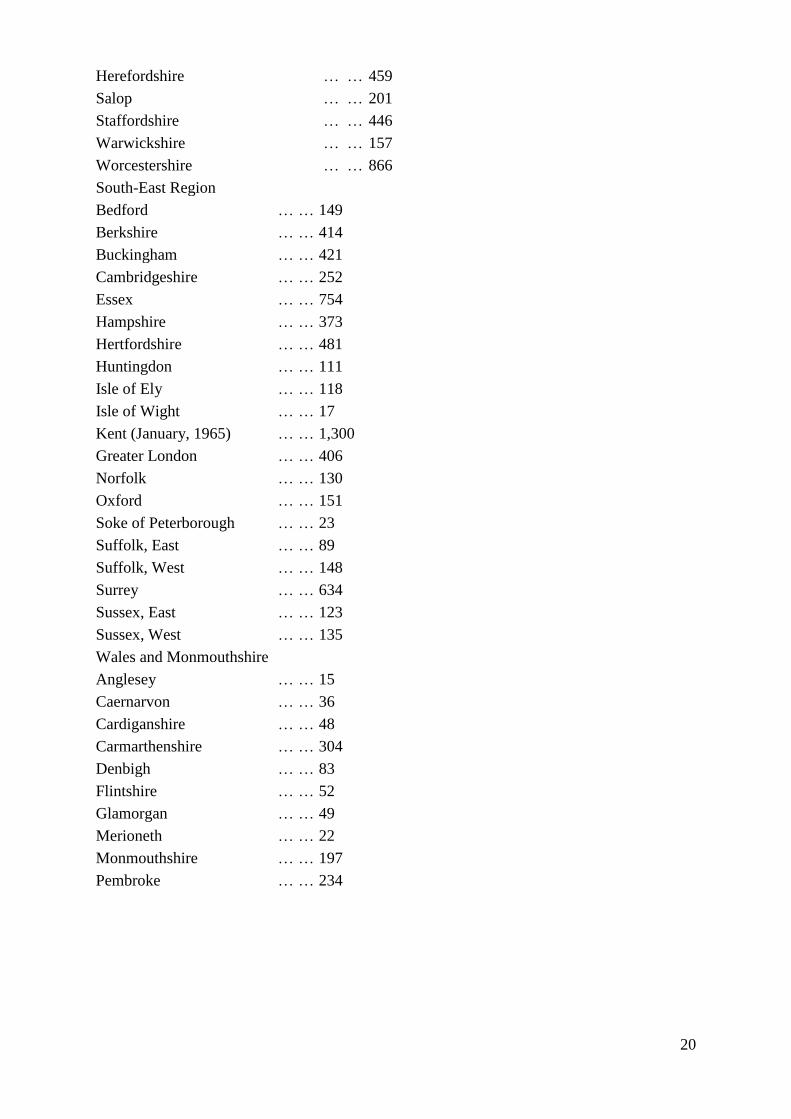
West Midland Region
20
Herefordshire … … 459
Salop … … 201
Staffordshire … … 446
Warwickshire … … 157
Worcestershire … … 866
South-East Region
Bedford … … 149
Berkshire … … 414
Buckingham … … 421
Cambridgeshire … … 252
Essex … … 754
Hampshire … … 373
Hertfordshire … … 481
Huntingdon … … 111
Isle of Ely … … 118
Isle of Wight … … 17
Kent (January, 1965) … … 1,300
Greater London … … 406
Norfolk … … 130
Oxford … … 151
Soke of Peterborough … … 23
Suffolk, East … … 89
Suffolk, West … … 148
Surrey … … 634
Sussex, East … … 123
Sussex, West … … 135
Wales and Monmouthshire
Anglesey … … 15
Caernarvon … … 36
Cardiganshire … … 48
Carmarthenshire … … 304
Denbigh … … 83
Flintshire … … 52
Glamorgan … … 49
Merioneth … … 22
Monmouthshire … … 197
Pembroke … … 234