Embed Size (px)
Citation preview
ARTICLE IN PRESS
Chemical Engineering Science 65 (2010) 3591–3601
Contents lists available at ScienceDirect
Chemical Engineering Science
0009-25
doi:10.1
� Corr
E-m
journal homepage: www.elsevier.com/locate/ces
Iron doped phenolic resin based activated carbon micro and nanoparticles bymilling: Synthesis, characterization and application in arsenic removal
Ajit Sharma a, Nishith Verma a,�, Ashutosh Sharma a,�, Dinesh Deva a, Nalini Sankararamakrishnan b
a Department of Chemical Engineering and DST Unit on Nanosciences, Indian Institute of Technology Kanpur, Kanpur 208016, Indiab Center for Environmental Science and Engineering, Indian Institute of Technology Kanpur, Kanpur 208016, India
a r t i c l e i n f o
Article history:
Received 28 August 2009
Received in revised form
21 February 2010
Accepted 28 February 2010Available online 16 March 2010
Keywords:
Arsenic
Wastewater
Environment
Polymerisation
Adsorption
Nano particles
Packed bed
09/$ - see front matter & 2010 Elsevier Ltd. A
016/j.ces.2010.02.052
esponding authors. Tel.: +91 512 2596124; fa
ail addresses: [email protected] (N. Verma), as
a b s t r a c t
In this study, we have prepared iron-doped activated micro/nano carbon particles as efficient
adsorbents for arsenic removal. Starting with phenolic resin monomers, polymeric spherical beads of
size �0.2–1 mm were first synthesized by suspension polymerization. Iron (Fe) was incorporated in an
intermediate step during polymerization. The internal porous structure was developed in the Fe-doped
polymeric beads by carbonization followed by physical activation using steam. Subsequent to
activation, beads were milled to prepare the micro/nano particles in the size range of 100–500 nm.
In an alternate route to preparing the adsorbents, the synthesized polymeric beads were first milled and
then carbonized and activated. The absorbent particles thus prepared were applied in the removal of
arsenic (III and V) present at low concentration levels (o20 mg/L) in water. The method in which
milling was performed first produced a superior adsorbent. For both the ions, the equilibrium loading
(�3–15 mg/g) in the adsorbate were found to be comparable to the adsorbates reported in literature.
The simple and up-scalable methodology developed in this study has the potential for the preparation
of a wide variety of similar metal impregnated porous (polymeric precursor based) adsorbents/catalysts
in other environmental remediation applications.
& 2010 Elsevier Ltd. All rights reserved.
1. Introduction
The adverse effects of arsenic present in water on humanhealth and ecosystems are well recognized (Thorne, 1995). Themaximum arsenic level in drinking water has been set at 10mg/L(or ppb) by the World Health Organization (WHO), whereas thepermitted limit for industrial effluents is o0.2 mg/L (or ppm)(Smedley and Kinniburgh, 2002). In recent times, adsorption hasemerged as a front line defence against arsenic contamination inwater. Among the several types of adsorptive materials used forthe control of arsenic ions in water, activated alumina (Singh andPant, 2004; Kuriakose et al., 2004), activated carbon (Huang andVane, 1989; Vaughan and Reed, 2005; Gu et al., 2005), silica (Xuand Axe, 2005), and zeolite (Onyango et al., 2003) are theextensively studied adsorbents. The affinity of iron (Fe-III)towards inorganic arsenics and its selectivity in sorption werewell recognized by many researchers (Fendorf et al., 1997; Ravenet al., 1998; Appelo et al., 2002). Consequently, concerted effortshave been made, especially in the last decade, to develop Fe-impregnated adsorbents with a view to increase their adsorptioncapacity for arsenic (Munoz et al., 2002; Deliyanni et al., 2003;
ll rights reserved.
x: +91 512 2590104.
[email protected] (A. Sharma).
Chen et al., 2007; Muniz et al., 2009). The focus in most of thesestudies is on impregnation of the substrate with iron; carbon andalumina being the two most common substrate materials studiedfor impregnation, primarily due to their porous structure suitablefor providing large active surface area. Some of the studies pertainto determining isotherms and kinetics for the adsorption ofarsenic, whereas a few pertain to the column experiment forevaluating the performance of the adsorbents under dynamic(flow) conditions. A few studies also deal with the surfacecharacterization of adsorbents for BET area, pore size distribution,and surface functional groups (Huang and Vane, 1989; Fendorfet al., 1997). Effect of pH has also been extensively studied andshown to significantly influence the adsorption of As (Singh andPant, 2004; Vaughan and Reed, 2005; Raven et al., 1998; Munozet al., 2002; Deliyanni et al., 2003; Muniz et al., 2009).
Comparing the performance of the adsorbents in those studies,it is fair to comment that the applicability of the materials islimited by Fe-loading of the substrate, typically in the range of1–10%. For such adsorbents, the adsorption capacity for arsenictypically ranges from low concentration values, �0.01 mg/g tomoderate values of �5 mg/g. There are also a few recent studiesin which the adsorption capacity has been reported to be as largeas �40 mg/g (Chen et al., 2007; Jang et al., 2008). There are,however, several aspects in addition to the equilibrium loadingthat must also be considered in preparing or selecting the
ARTICLE IN PRESS
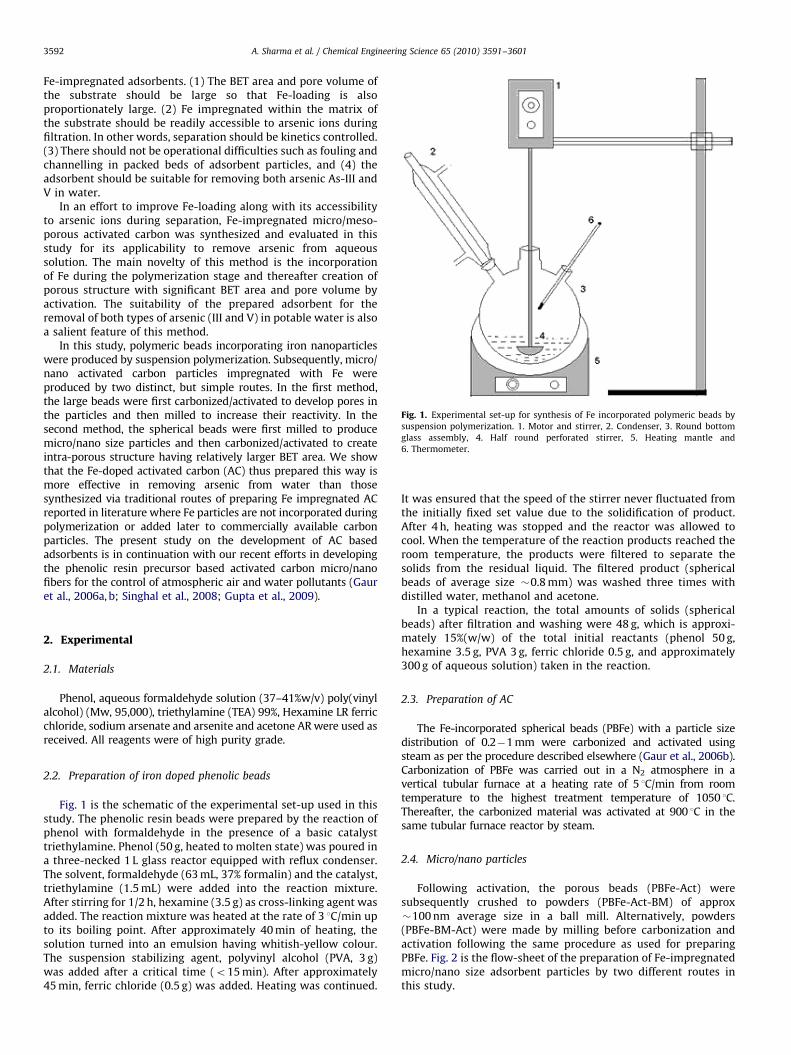
Fig. 1. Experimental set-up for synthesis of Fe incorporated polymeric beads by
suspension polymerization. 1. Motor and stirrer, 2. Condenser, 3. Round bottom
glass assembly, 4. Half round perforated stirrer, 5. Heating mantle and
6. Thermometer.
A. Sharma et al. / Chemical Engineering Science 65 (2010) 3591–36013592
Fe-impregnated adsorbents. (1) The BET area and pore volume ofthe substrate should be large so that Fe-loading is alsoproportionately large. (2) Fe impregnated within the matrix ofthe substrate should be readily accessible to arsenic ions duringfiltration. In other words, separation should be kinetics controlled.(3) There should not be operational difficulties such as fouling andchannelling in packed beds of adsorbent particles, and (4) theadsorbent should be suitable for removing both arsenic As-III andV in water.
In an effort to improve Fe-loading along with its accessibilityto arsenic ions during separation, Fe-impregnated micro/meso-porous activated carbon was synthesized and evaluated in thisstudy for its applicability to remove arsenic from aqueoussolution. The main novelty of this method is the incorporationof Fe during the polymerization stage and thereafter creation ofporous structure with significant BET area and pore volume byactivation. The suitability of the prepared adsorbent for theremoval of both types of arsenic (III and V) in potable water is alsoa salient feature of this method.
In this study, polymeric beads incorporating iron nanoparticleswere produced by suspension polymerization. Subsequently, micro/nano activated carbon particles impregnated with Fe wereproduced by two distinct, but simple routes. In the first method,the large beads were first carbonized/activated to develop pores inthe particles and then milled to increase their reactivity. In thesecond method, the spherical beads were first milled to producemicro/nano size particles and then carbonized/activated to createintra-porous structure having relatively larger BET area. We showthat the Fe-doped activated carbon (AC) thus prepared this way ismore effective in removing arsenic from water than thosesynthesized via traditional routes of preparing Fe impregnated ACreported in literature where Fe particles are not incorporated duringpolymerization or added later to commercially available carbonparticles. The present study on the development of AC basedadsorbents is in continuation with our recent efforts in developingthe phenolic resin precursor based activated carbon micro/nanofibers for the control of atmospheric air and water pollutants (Gauret al., 2006a, b; Singhal et al., 2008; Gupta et al., 2009).
2. Experimental
2.1. Materials
Phenol, aqueous formaldehyde solution (37–41%w/v) poly(vinylalcohol) (Mw, 95,000), triethylamine (TEA) 99%, Hexamine LR ferricchloride, sodium arsenate and arsenite and acetone AR were used asreceived. All reagents were of high purity grade.
2.2. Preparation of iron doped phenolic beads
Fig. 1 is the schematic of the experimental set-up used in thisstudy. The phenolic resin beads were prepared by the reaction ofphenol with formaldehyde in the presence of a basic catalysttriethylamine. Phenol (50 g, heated to molten state) was poured ina three-necked 1 L glass reactor equipped with reflux condenser.The solvent, formaldehyde (63 mL, 37% formalin) and the catalyst,triethylamine (1.5 mL) were added into the reaction mixture.After stirring for 1/2 h, hexamine (3.5 g) as cross-linking agent wasadded. The reaction mixture was heated at the rate of 3 1C/min upto its boiling point. After approximately 40 min of heating, thesolution turned into an emulsion having whitish-yellow colour.The suspension stabilizing agent, polyvinyl alcohol (PVA, 3 g)was added after a critical time (o15 min). After approximately45 min, ferric chloride (0.5 g) was added. Heating was continued.
It was ensured that the speed of the stirrer never fluctuated fromthe initially fixed set value due to the solidification of product.After 4 h, heating was stopped and the reactor was allowed tocool. When the temperature of the reaction products reached theroom temperature, the products were filtered to separate thesolids from the residual liquid. The filtered product (sphericalbeads of average size �0.8 mm) was washed three times withdistilled water, methanol and acetone.
In a typical reaction, the total amounts of solids (sphericalbeads) after filtration and washing were 48 g, which is approxi-mately 15%(w/w) of the total initial reactants (phenol 50 g,hexamine 3.5 g, PVA 3 g, ferric chloride 0.5 g, and approximately300 g of aqueous solution) taken in the reaction.
2.3. Preparation of AC
The Fe-incorporated spherical beads (PBFe) with a particle sizedistribution of 0.2�1 mm were carbonized and activated usingsteam as per the procedure described elsewhere (Gaur et al., 2006b).Carbonization of PBFe was carried out in a N2 atmosphere in avertical tubular furnace at a heating rate of 5 1C/min from roomtemperature to the highest treatment temperature of 1050 1C.Thereafter, the carbonized material was activated at 900 1C in thesame tubular furnace reactor by steam.
2.4. Micro/nano particles
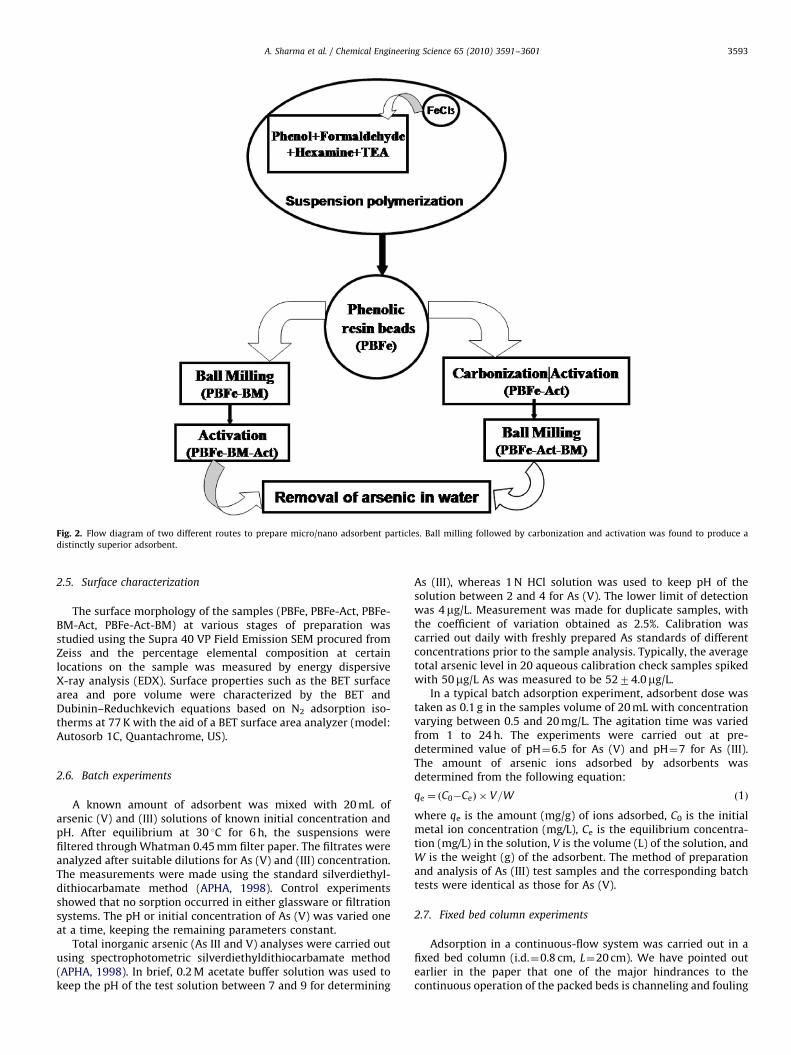
Following activation, the porous beads (PBFe-Act) weresubsequently crushed to powders (PBFe-Act-BM) of approx�100 nm average size in a ball mill. Alternatively, powders(PBFe-BM-Act) were made by milling before carbonization andactivation following the same procedure as used for preparingPBFe. Fig. 2 is the flow-sheet of the preparation of Fe-impregnatedmicro/nano size adsorbent particles by two different routes inthis study.
ARTICLE IN PRESS
Fig. 2. Flow diagram of two different routes to prepare micro/nano adsorbent particles. Ball milling followed by carbonization and activation was found to produce a
distinctly superior adsorbent.
A. Sharma et al. / Chemical Engineering Science 65 (2010) 3591–3601 3593
2.5. Surface characterization
The surface morphology of the samples (PBFe, PBFe-Act, PBFe-BM-Act, PBFe-Act-BM) at various stages of preparation wasstudied using the Supra 40 VP Field Emission SEM procured fromZeiss and the percentage elemental composition at certainlocations on the sample was measured by energy dispersiveX-ray analysis (EDX). Surface properties such as the BET surfacearea and pore volume were characterized by the BET andDubinin–Reduchkevich equations based on N2 adsorption iso-therms at 77 K with the aid of a BET surface area analyzer (model:Autosorb 1C, Quantachrome, US).
2.6. Batch experiments
A known amount of adsorbent was mixed with 20 mL ofarsenic (V) and (III) solutions of known initial concentration andpH. After equilibrium at 30 1C for 6 h, the suspensions werefiltered through Whatman 0.45 mm filter paper. The filtrates wereanalyzed after suitable dilutions for As (V) and (III) concentration.The measurements were made using the standard silverdiethyl-dithiocarbamate method (APHA, 1998). Control experimentsshowed that no sorption occurred in either glassware or filtrationsystems. The pH or initial concentration of As (V) was varied oneat a time, keeping the remaining parameters constant.
Total inorganic arsenic (As III and V) analyses were carried outusing spectrophotometric silverdiethyldithiocarbamate method(APHA, 1998). In brief, 0.2 M acetate buffer solution was used tokeep the pH of the test solution between 7 and 9 for determining
As (III), whereas 1 N HCl solution was used to keep pH of thesolution between 2 and 4 for As (V). The lower limit of detectionwas 4mg/L. Measurement was made for duplicate samples, withthe coefficient of variation obtained as 2.5%. Calibration wascarried out daily with freshly prepared As standards of differentconcentrations prior to the sample analysis. Typically, the averagetotal arsenic level in 20 aqueous calibration check samples spikedwith 50mg/L As was measured to be 5274.0mg/L.
In a typical batch adsorption experiment, adsorbent dose wastaken as 0.1 g in the samples volume of 20 mL with concentrationvarying between 0.5 and 20 mg/L. The agitation time was variedfrom 1 to 24 h. The experiments were carried out at pre-determined value of pH¼6.5 for As (V) and pH¼7 for As (III).The amount of arsenic ions adsorbed by adsorbents wasdetermined from the following equation:
qe ¼ ðC0�CeÞ � V=W ð1Þ
where qe is the amount (mg/g) of ions adsorbed, C0 is the initialmetal ion concentration (mg/L), Ce is the equilibrium concentra-tion (mg/L) in the solution, V is the volume (L) of the solution, andW is the weight (g) of the adsorbent. The method of preparationand analysis of As (III) test samples and the corresponding batchtests were identical as those for As (V).
2.7. Fixed bed column experiments
Adsorption in a continuous-flow system was carried out in afixed bed column (i.d.¼0.8 cm, L¼20 cm). We have pointed outearlier in the paper that one of the major hindrances to thecontinuous operation of the packed beds is channeling and fouling
ARTICLE IN PRESS
A. Sharma et al. / Chemical Engineering Science 65 (2010) 3591–36013594
arising due to non-uniformity in flow. This flow non-uniformity,combined with the loss of particles, is usually prevalent in thebeds of relatively smaller size particles, and certainly in nano-particles. Thus, in the present study, flow experiments werecarried out on a column packed with the parent material withoutsubstantial milling—PBFe-Act beads (size �0.6 mm) to assess theusefulness of the basic material. The nano size adsorbent particlesof PBFe-Act-BM or PBFe-BM-Act, when used as packing material,
Table 1Surface characterization data of adsorbents.
Sample Average size(mm)
BET surfacearea (m2/g)
Total porevolume (cc/g)
PBFe 0.6 0.14 0.001
PBFe-Act 0.6 231 0.142
PBFe-Act-BM 100 288 0.1978
PBFe-BM-Act 100 781 0.4682
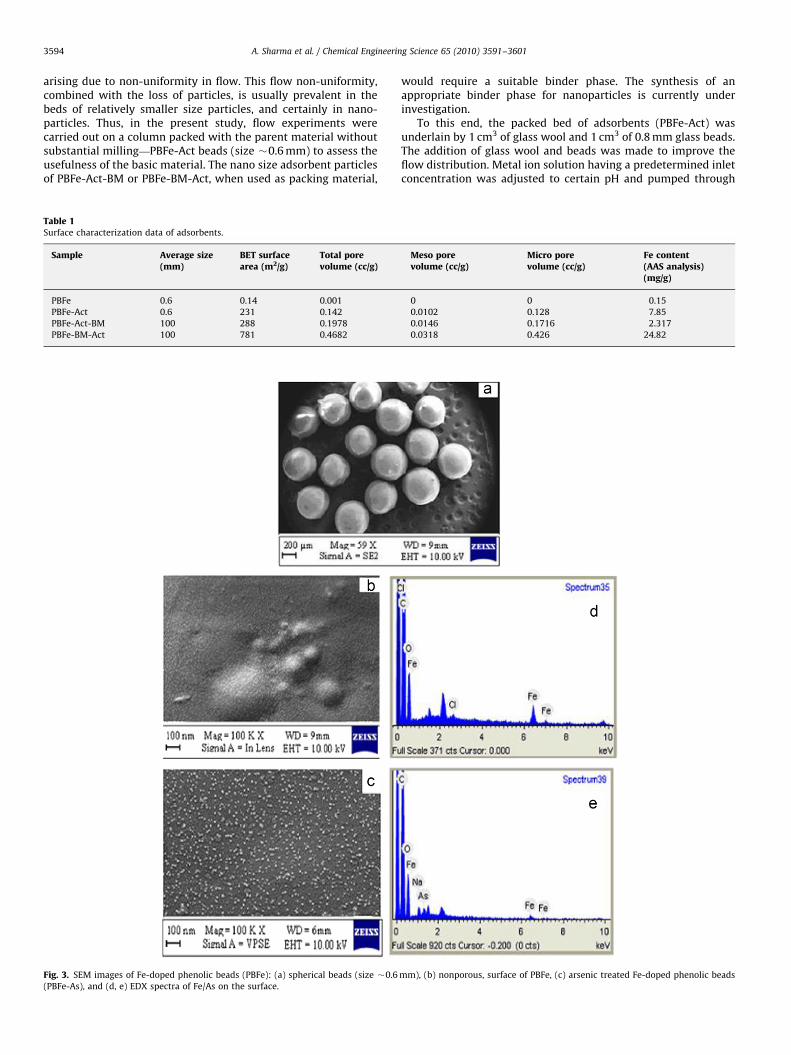
Fig. 3. SEM images of Fe-doped phenolic beads (PBFe): (a) spherical beads (size �0.6
(PBFe-As), and (d, e) EDX spectra of Fe/As on the surface.
would require a suitable binder phase. The synthesis of anappropriate binder phase for nanoparticles is currently underinvestigation.
To this end, the packed bed of adsorbents (PBFe-Act) wasunderlain by 1 cm3 of glass wool and 1 cm3 of 0.8 mm glass beads.The addition of glass wool and beads was made to improve theflow distribution. Metal ion solution having a predetermined inletconcentration was adjusted to certain pH and pumped through
Meso porevolume (cc/g)
Micro porevolume (cc/g)
Fe content(AAS analysis)(mg/g)
0 0 0.15
0.0102 0.128 7.85
0.0146 0.1716 2.317
0.0318 0.426 24.82
mm), (b) nonporous, surface of PBFe, (c) arsenic treated Fe-doped phenolic beads
ARTICLE IN PRESS
A. Sharma et al. / Chemical Engineering Science 65 (2010) 3591–3601 3595
the column at a desired flow rate by a peristaltic pump in anup-flow mode. Samples were collected from the exit of thecolumn at different time intervals and analyzed for arsenic.
3. Characterization of sorbents
3.1. Surface area (BET) and pore volume
Table 1 summarizes the BET surface area, total pore volume,and pore size distribution (PSD) of the adsorbents at variousstages of preparation. The results show that the sequence ofactivation and milling of the polymeric beads is critical to creatingporosity inside the bead. As observed from the table, millingbefore activation is more effective than activation followed bymilling of the beads in creating relatively larger BET area. The BETarea of the nanoparticles was obtained as 781 m2/g in the formerroute to synthesis, in comparison to 288 m2/g obtained in thelatter route. The pore volume was found to increase from�0.1 cm3/g to 0.4 cm3/g under the identical conditions. Table 1also describes the percentage volume of different pores (macro,
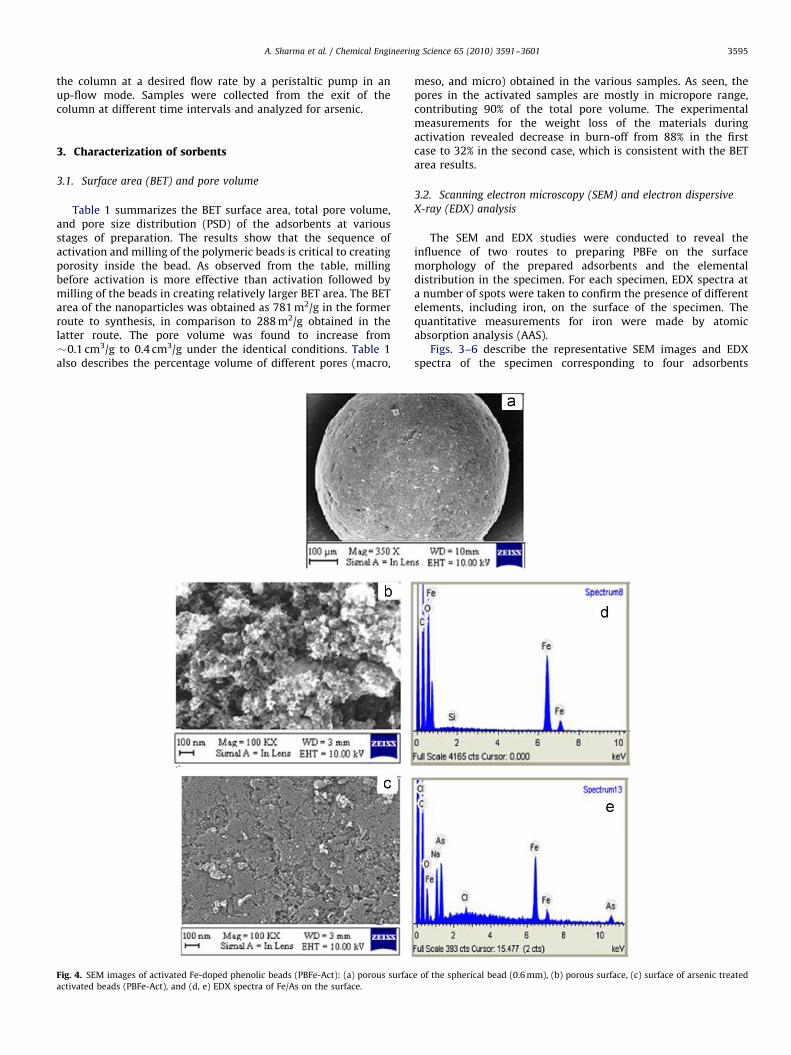
Fig. 4. SEM images of activated Fe-doped phenolic beads (PBFe-Act): (a) porous surfac
activated beads (PBFe-Act), and (d, e) EDX spectra of Fe/As on the surface.
meso, and micro) obtained in the various samples. As seen, thepores in the activated samples are mostly in micropore range,contributing 90% of the total pore volume. The experimentalmeasurements for the weight loss of the materials duringactivation revealed decrease in burn-off from 88% in the firstcase to 32% in the second case, which is consistent with the BETarea results.
3.2. Scanning electron microscopy (SEM) and electron dispersive
X-ray (EDX) analysis
The SEM and EDX studies were conducted to reveal theinfluence of two routes to preparing PBFe on the surfacemorphology of the prepared adsorbents and the elementaldistribution in the specimen. For each specimen, EDX spectra ata number of spots were taken to confirm the presence of differentelements, including iron, on the surface of the specimen. Thequantitative measurements for iron were made by atomicabsorption analysis (AAS).
Figs. 3–6 describe the representative SEM images and EDXspectra of the specimen corresponding to four adsorbents
e of the spherical bead (0.6 mm), (b) porous surface, (c) surface of arsenic treated
ARTICLE IN PRESS
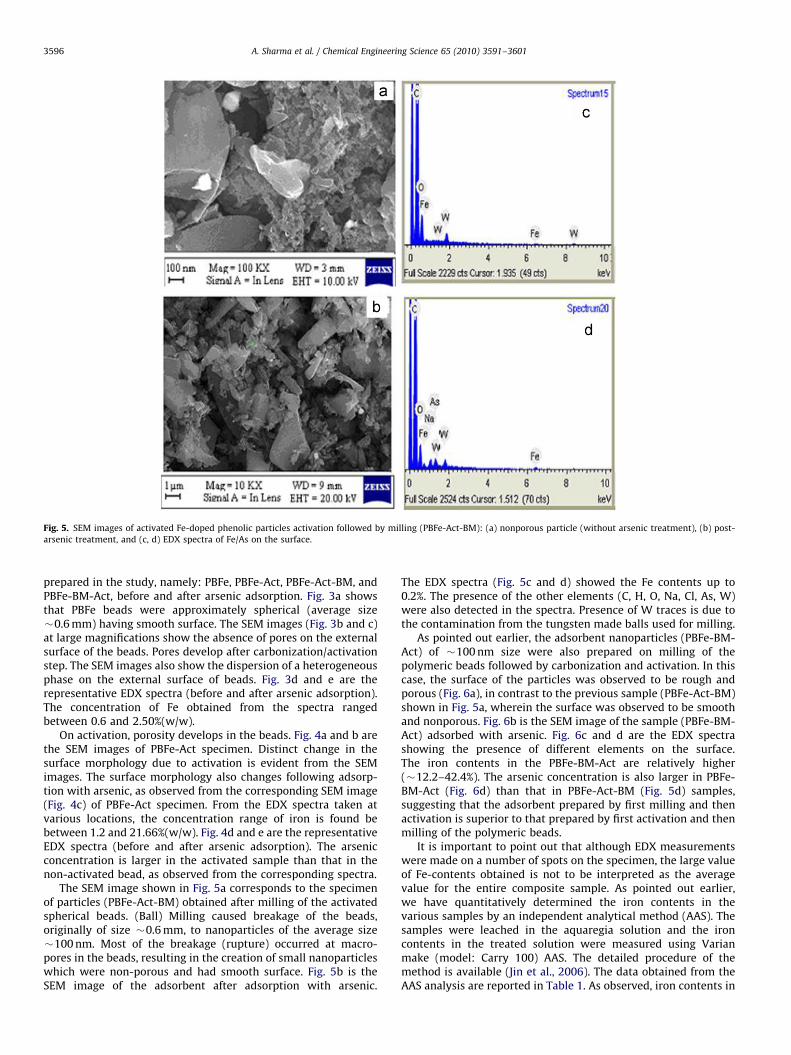
Fig. 5. SEM images of activated Fe-doped phenolic particles activation followed by milling (PBFe-Act-BM): (a) nonporous particle (without arsenic treatment), (b) post-
arsenic treatment, and (c, d) EDX spectra of Fe/As on the surface.
A. Sharma et al. / Chemical Engineering Science 65 (2010) 3591–36013596
prepared in the study, namely: PBFe, PBFe-Act, PBFe-Act-BM, andPBFe-BM-Act, before and after arsenic adsorption. Fig. 3a showsthat PBFe beads were approximately spherical (average size�0.6 mm) having smooth surface. The SEM images (Fig. 3b and c)at large magnifications show the absence of pores on the externalsurface of the beads. Pores develop after carbonization/activationstep. The SEM images also show the dispersion of a heterogeneousphase on the external surface of beads. Fig. 3d and e are therepresentative EDX spectra (before and after arsenic adsorption).The concentration of Fe obtained from the spectra rangedbetween 0.6 and 2.50%(w/w).
On activation, porosity develops in the beads. Fig. 4a and b arethe SEM images of PBFe-Act specimen. Distinct change in thesurface morphology due to activation is evident from the SEMimages. The surface morphology also changes following adsorp-tion with arsenic, as observed from the corresponding SEM image(Fig. 4c) of PBFe-Act specimen. From the EDX spectra taken atvarious locations, the concentration range of iron is found bebetween 1.2 and 21.66%(w/w). Fig. 4d and e are the representativeEDX spectra (before and after arsenic adsorption). The arsenicconcentration is larger in the activated sample than that in thenon-activated bead, as observed from the corresponding spectra.
The SEM image shown in Fig. 5a corresponds to the specimenof particles (PBFe-Act-BM) obtained after milling of the activatedspherical beads. (Ball) Milling caused breakage of the beads,originally of size �0.6 mm, to nanoparticles of the average size�100 nm. Most of the breakage (rupture) occurred at macro-pores in the beads, resulting in the creation of small nanoparticleswhich were non-porous and had smooth surface. Fig. 5b is theSEM image of the adsorbent after adsorption with arsenic.
The EDX spectra (Fig. 5c and d) showed the Fe contents up to0.2%. The presence of the other elements (C, H, O, Na, Cl, As, W)were also detected in the spectra. Presence of W traces is due tothe contamination from the tungsten made balls used for milling.
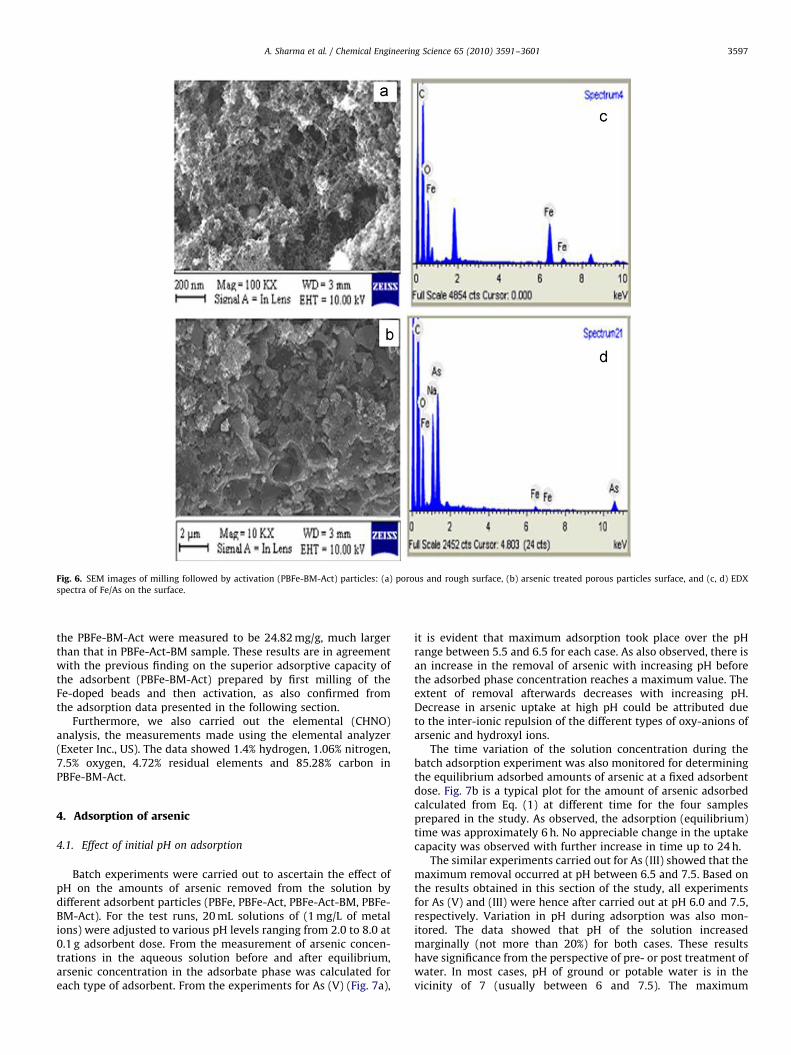
As pointed out earlier, the adsorbent nanoparticles (PBFe-BM-Act) of �100 nm size were also prepared on milling of thepolymeric beads followed by carbonization and activation. In thiscase, the surface of the particles was observed to be rough andporous (Fig. 6a), in contrast to the previous sample (PBFe-Act-BM)shown in Fig. 5a, wherein the surface was observed to be smoothand nonporous. Fig. 6b is the SEM image of the sample (PBFe-BM-Act) adsorbed with arsenic. Fig. 6c and d are the EDX spectrashowing the presence of different elements on the surface.The iron contents in the PBFe-BM-Act are relatively higher(�12.2–42.4%). The arsenic concentration is also larger in PBFe-BM-Act (Fig. 6d) than that in PBFe-Act-BM (Fig. 5d) samples,suggesting that the adsorbent prepared by first milling and thenactivation is superior to that prepared by first activation and thenmilling of the polymeric beads.
It is important to point out that although EDX measurementswere made on a number of spots on the specimen, the large valueof Fe-contents obtained is not to be interpreted as the averagevalue for the entire composite sample. As pointed out earlier,we have quantitatively determined the iron contents in thevarious samples by an independent analytical method (AAS). Thesamples were leached in the aquaregia solution and the ironcontents in the treated solution were measured using Varianmake (model: Carry 100) AAS. The detailed procedure of themethod is available (Jin et al., 2006). The data obtained from theAAS analysis are reported in Table 1. As observed, iron contents in
ARTICLE IN PRESS
Fig. 6. SEM images of milling followed by activation (PBFe-BM-Act) particles: (a) porous and rough surface, (b) arsenic treated porous particles surface, and (c, d) EDX
spectra of Fe/As on the surface.
A. Sharma et al. / Chemical Engineering Science 65 (2010) 3591–3601 3597
the PBFe-BM-Act were measured to be 24.82 mg/g, much largerthan that in PBFe-Act-BM sample. These results are in agreementwith the previous finding on the superior adsorptive capacity ofthe adsorbent (PBFe-BM-Act) prepared by first milling of theFe-doped beads and then activation, as also confirmed fromthe adsorption data presented in the following section.
Furthermore, we also carried out the elemental (CHNO)analysis, the measurements made using the elemental analyzer(Exeter Inc., US). The data showed 1.4% hydrogen, 1.06% nitrogen,7.5% oxygen, 4.72% residual elements and 85.28% carbon inPBFe-BM-Act.
4. Adsorption of arsenic
4.1. Effect of initial pH on adsorption
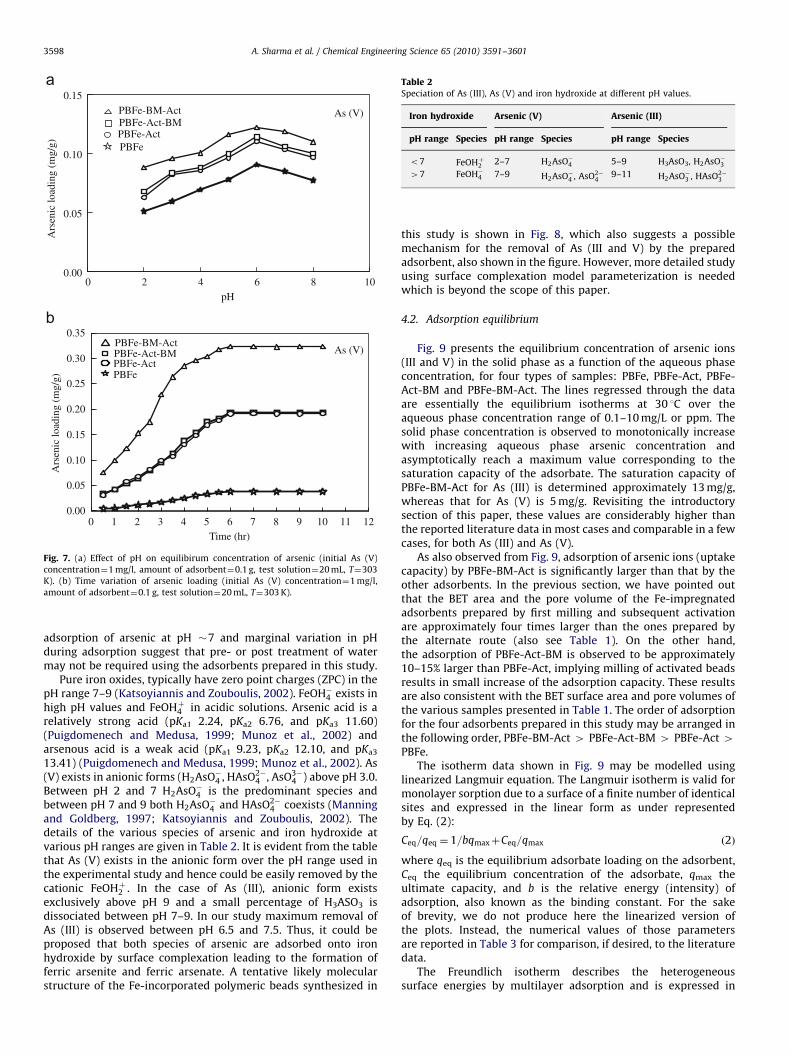
Batch experiments were carried out to ascertain the effect ofpH on the amounts of arsenic removed from the solution bydifferent adsorbent particles (PBFe, PBFe-Act, PBFe-Act-BM, PBFe-BM-Act). For the test runs, 20 mL solutions of (1 mg/L of metalions) were adjusted to various pH levels ranging from 2.0 to 8.0 at0.1 g adsorbent dose. From the measurement of arsenic concen-trations in the aqueous solution before and after equilibrium,arsenic concentration in the adsorbate phase was calculated foreach type of adsorbent. From the experiments for As (V) (Fig. 7a),
it is evident that maximum adsorption took place over the pHrange between 5.5 and 6.5 for each case. As also observed, there isan increase in the removal of arsenic with increasing pH beforethe adsorbed phase concentration reaches a maximum value. Theextent of removal afterwards decreases with increasing pH.Decrease in arsenic uptake at high pH could be attributed dueto the inter-ionic repulsion of the different types of oxy-anions ofarsenic and hydroxyl ions.
The time variation of the solution concentration during thebatch adsorption experiment was also monitored for determiningthe equilibrium adsorbed amounts of arsenic at a fixed adsorbentdose. Fig. 7b is a typical plot for the amount of arsenic adsorbedcalculated from Eq. (1) at different time for the four samplesprepared in the study. As observed, the adsorption (equilibrium)time was approximately 6 h. No appreciable change in the uptakecapacity was observed with further increase in time up to 24 h.
The similar experiments carried out for As (III) showed that themaximum removal occurred at pH between 6.5 and 7.5. Based onthe results obtained in this section of the study, all experimentsfor As (V) and (III) were hence after carried out at pH 6.0 and 7.5,respectively. Variation in pH during adsorption was also mon-itored. The data showed that pH of the solution increasedmarginally (not more than 20%) for both cases. These resultshave significance from the perspective of pre- or post treatment ofwater. In most cases, pH of ground or potable water is in thevicinity of 7 (usually between 6 and 7.5). The maximum
ARTICLE IN PRESS
pH0
Ars
enic
load
ing
(mg/
g)
0.00
0.05
0.10
0.15PBFe-BM-ActPBFe-Act-BMPBFe-ActPBFe
As (V)
0
Ars
enic
load
ing
(mg/
g)
0.00
0.05
0.10
0.15
0.20
0.25
0.30
0.35
Time (hr)
PBFePBFe-ActPBFe-Act-BMPBFe-BM-Act
As (V)
2 4 6 8 10
1 2 3 4 5 6 7 8 9 10 11 12
Fig. 7. (a) Effect of pH on equilibirum concentration of arsenic (initial As (V)
concentration¼1 mg/l, amount of adsorbent¼0.1 g, test solution¼20 mL, T¼303
K). (b) Time variation of arsenic loading (initial As (V) concentration¼1 mg/l,
amount of adsorbent¼0.1 g, test solution¼20 mL, T¼303 K).
Table 2Speciation of As (III), As (V) and iron hydroxide at different pH values.
Iron hydroxide Arsenic (V) Arsenic (III)
pH range Species pH range Species pH range Species
o7 FeOHþ2 2–7 H2AsO�4 5–9 H3AsO3, H2AsO�347 FeOH�4 7–9 H2AsO�4 , AsO2�
49–11 H2AsO�3 , HAsO2�
3
A. Sharma et al. / Chemical Engineering Science 65 (2010) 3591–36013598
adsorption of arsenic at pH �7 and marginal variation in pHduring adsorption suggest that pre- or post treatment of watermay not be required using the adsorbents prepared in this study.
Pure iron oxides, typically have zero point charges (ZPC) in thepH range 7–9 (Katsoyiannis and Zouboulis, 2002). FeOH�4 exists inhigh pH values and FeOHþ4 in acidic solutions. Arsenic acid is arelatively strong acid (pKa1 2.24, pKa2 6.76, and pKa3 11.60)(Puigdomenech and Medusa, 1999; Munoz et al., 2002) andarsenous acid is a weak acid (pKa1 9.23, pKa2 12.10, and pKa3
13.41) (Puigdomenech and Medusa, 1999; Munoz et al., 2002). As(V) exists in anionic forms (H2AsO�4 , HAsO2�
4 , AsO3�4 ) above pH 3.0.
Between pH 2 and 7 H2AsO�4 is the predominant species andbetween pH 7 and 9 both H2AsO�4 and HAsO2�
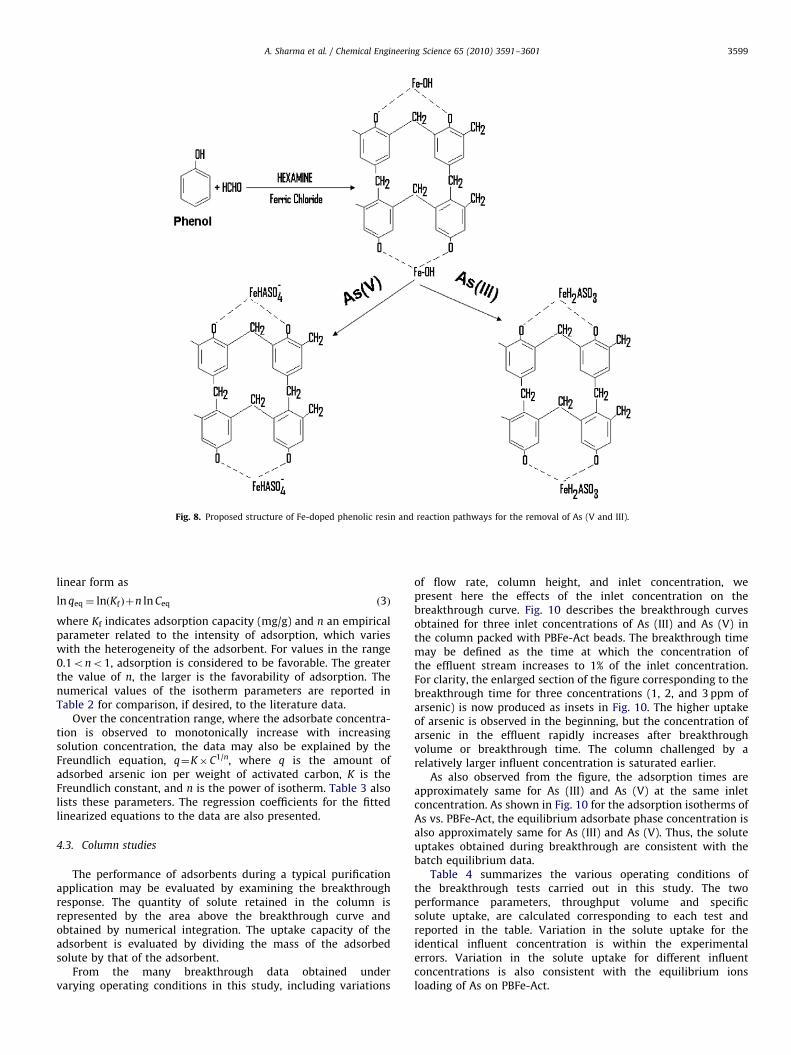
4 coexists (Manningand Goldberg, 1997; Katsoyiannis and Zouboulis, 2002). Thedetails of the various species of arsenic and iron hydroxide atvarious pH ranges are given in Table 2. It is evident from the tablethat As (V) exists in the anionic form over the pH range used inthe experimental study and hence could be easily removed by thecationic FeOHþ2 . In the case of As (III), anionic form existsexclusively above pH 9 and a small percentage of H3ASO3 isdissociated between pH 7–9. In our study maximum removal ofAs (III) is observed between pH 6.5 and 7.5. Thus, it could beproposed that both species of arsenic are adsorbed onto ironhydroxide by surface complexation leading to the formation offerric arsenite and ferric arsenate. A tentative likely molecularstructure of the Fe-incorporated polymeric beads synthesized in
this study is shown in Fig. 8, which also suggests a possiblemechanism for the removal of As (III and V) by the preparedadsorbent, also shown in the figure. However, more detailed studyusing surface complexation model parameterization is neededwhich is beyond the scope of this paper.
4.2. Adsorption equilibrium
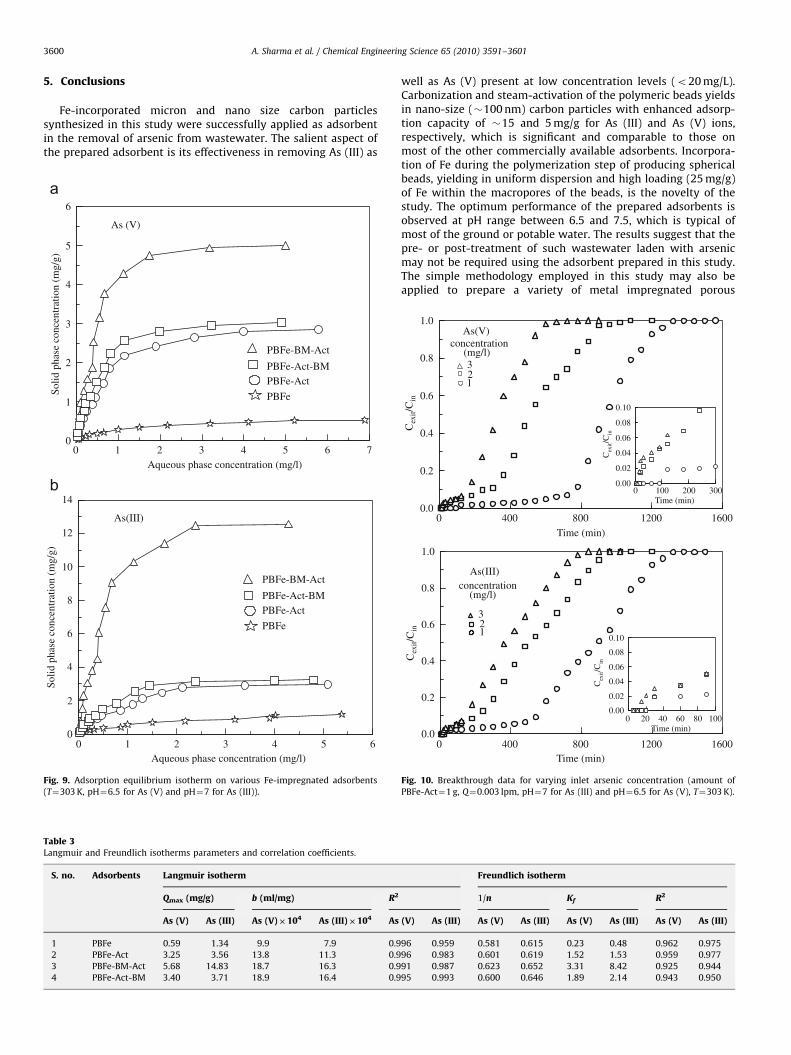
Fig. 9 presents the equilibrium concentration of arsenic ions(III and V) in the solid phase as a function of the aqueous phaseconcentration, for four types of samples: PBFe, PBFe-Act, PBFe-Act-BM and PBFe-BM-Act. The lines regressed through the dataare essentially the equilibrium isotherms at 30 1C over theaqueous phase concentration range of 0.1–10 mg/L or ppm. Thesolid phase concentration is observed to monotonically increasewith increasing aqueous phase arsenic concentration andasymptotically reach a maximum value corresponding to thesaturation capacity of the adsorbate. The saturation capacity ofPBFe-BM-Act for As (III) is determined approximately 13 mg/g,whereas that for As (V) is 5 mg/g. Revisiting the introductorysection of this paper, these values are considerably higher thanthe reported literature data in most cases and comparable in a fewcases, for both As (III) and As (V).
As also observed from Fig. 9, adsorption of arsenic ions (uptakecapacity) by PBFe-BM-Act is significantly larger than that by theother adsorbents. In the previous section, we have pointed outthat the BET area and the pore volume of the Fe-impregnatedadsorbents prepared by first milling and subsequent activationare approximately four times larger than the ones prepared bythe alternate route (also see Table 1). On the other hand,the adsorption of PBFe-Act-BM is observed to be approximately10–15% larger than PBFe-Act, implying milling of activated beadsresults in small increase of the adsorption capacity. These resultsare also consistent with the BET surface area and pore volumes ofthe various samples presented in Table 1. The order of adsorptionfor the four adsorbents prepared in this study may be arranged inthe following order, PBFe-BM-Act 4 PBFe-Act-BM 4 PBFe-Act 4PBFe.
The isotherm data shown in Fig. 9 may be modelled usinglinearized Langmuir equation. The Langmuir isotherm is valid formonolayer sorption due to a surface of a finite number of identicalsites and expressed in the linear form as under representedby Eq. (2):
Ceq=qeq ¼ 1=bqmaxþCeq=qmax ð2Þ
where qeq is the equilibrium adsorbate loading on the adsorbent,Ceq the equilibrium concentration of the adsorbate, qmax theultimate capacity, and b is the relative energy (intensity) ofadsorption, also known as the binding constant. For the sakeof brevity, we do not produce here the linearized version ofthe plots. Instead, the numerical values of those parametersare reported in Table 3 for comparison, if desired, to the literaturedata.
The Freundlich isotherm describes the heterogeneoussurface energies by multilayer adsorption and is expressed in
ARTICLE IN PRESS
Fig. 8. Proposed structure of Fe-doped phenolic resin and reaction pathways for the removal of As (V and III).
A. Sharma et al. / Chemical Engineering Science 65 (2010) 3591–3601 3599
linear form as
ln qeq ¼ lnðKf Þþn ln Ceq ð3Þ
where Kf indicates adsorption capacity (mg/g) and n an empiricalparameter related to the intensity of adsorption, which varieswith the heterogeneity of the adsorbent. For values in the range0.1ono1, adsorption is considered to be favorable. The greaterthe value of n, the larger is the favorability of adsorption. Thenumerical values of the isotherm parameters are reported inTable 2 for comparison, if desired, to the literature data.
Over the concentration range, where the adsorbate concentra-tion is observed to monotonically increase with increasingsolution concentration, the data may also be explained by theFreundlich equation, q¼K�C1/n, where q is the amount ofadsorbed arsenic ion per weight of activated carbon, K is theFreundlich constant, and n is the power of isotherm. Table 3 alsolists these parameters. The regression coefficients for the fittedlinearized equations to the data are also presented.
4.3. Column studies
The performance of adsorbents during a typical purificationapplication may be evaluated by examining the breakthroughresponse. The quantity of solute retained in the column isrepresented by the area above the breakthrough curve andobtained by numerical integration. The uptake capacity of theadsorbent is evaluated by dividing the mass of the adsorbedsolute by that of the adsorbent.
From the many breakthrough data obtained undervarying operating conditions in this study, including variations
of flow rate, column height, and inlet concentration, wepresent here the effects of the inlet concentration on thebreakthrough curve. Fig. 10 describes the breakthrough curvesobtained for three inlet concentrations of As (III) and As (V) inthe column packed with PBFe-Act beads. The breakthrough timemay be defined as the time at which the concentration ofthe effluent stream increases to 1% of the inlet concentration.For clarity, the enlarged section of the figure corresponding to thebreakthrough time for three concentrations (1, 2, and 3 ppm ofarsenic) is now produced as insets in Fig. 10. The higher uptakeof arsenic is observed in the beginning, but the concentration ofarsenic in the effluent rapidly increases after breakthroughvolume or breakthrough time. The column challenged by arelatively larger influent concentration is saturated earlier.
As also observed from the figure, the adsorption times areapproximately same for As (III) and As (V) at the same inletconcentration. As shown in Fig. 10 for the adsorption isotherms ofAs vs. PBFe-Act, the equilibrium adsorbate phase concentration isalso approximately same for As (III) and As (V). Thus, the soluteuptakes obtained during breakthrough are consistent with thebatch equilibrium data.
Table 4 summarizes the various operating conditions ofthe breakthrough tests carried out in this study. The twoperformance parameters, throughput volume and specificsolute uptake, are calculated corresponding to each test andreported in the table. Variation in the solute uptake for theidentical influent concentration is within the experimentalerrors. Variation in the solute uptake for different influentconcentrations is also consistent with the equilibrium ionsloading of As on PBFe-Act.
ARTICLE IN PRESS
A. Sharma et al. / Chemical Engineering Science 65 (2010) 3591–36013600
5. Conclusions
Fe-incorporated micron and nano size carbon particlessynthesized in this study were successfully applied as adsorbentin the removal of arsenic from wastewater. The salient aspect ofthe prepared adsorbent is its effectiveness in removing As (III) as
Aqueous phase concentration (mg/l)0
Solid
pha
se c
once
ntra
tion
(mg/
g)
0
1
2
3
4
5
6
As (V)
PBFe-BM-Act
PBFe-Act-BMPBFe-Act
PBFe
Aqueous phase concentration (mg/l)0
Solid
pha
se c
once
ntra
tion
(mg/
g)
0
2
4
6
8
10
12
14
As(III)
PBFe-BM-Act
PBFe-Act-BMPBFe-Act
PBFe
1 2 3 4 5 6 7
1 2 3 4 5 6
Fig. 9. Adsorption equilibrium isotherm on various Fe-impregnated adsorbents
(T¼303 K, pH¼6.5 for As (V) and pH¼7 for As (III)).
Table 3Langmuir and Freundlich isotherms parameters and correlation coefficients.
S. no. Adsorbents Langmuir isotherm
Qmax (mg/g) b (ml/mg) R2
As (V) As (III) As (V)�104 As (III)�104 As
1 PBFe 0.59 1.34 9.9 7.9 0.9
2 PBFe-Act 3.25 3.56 13.8 11.3 0.9
3 PBFe-BM-Act 5.68 14.83 18.7 16.3 0.9
4 PBFe-Act-BM 3.40 3.71 18.9 16.4 0.9
well as As (V) present at low concentration levels (o20 mg/L).Carbonization and steam-activation of the polymeric beads yieldsin nano-size (�100 nm) carbon particles with enhanced adsorp-tion capacity of �15 and 5 mg/g for As (III) and As (V) ions,respectively, which is significant and comparable to those onmost of the other commercially available adsorbents. Incorpora-tion of Fe during the polymerization step of producing sphericalbeads, yielding in uniform dispersion and high loading (25 mg/g)of Fe within the macropores of the beads, is the novelty of thestudy. The optimum performance of the prepared adsorbents isobserved at pH range between 6.5 and 7.5, which is typical ofmost of the ground or potable water. The results suggest that thepre- or post-treatment of such wastewater laden with arsenicmay not be required using the adsorbent prepared in this study.The simple methodology employed in this study may also beapplied to prepare a variety of metal impregnated porous
Freundlich isotherm
1/n Kf R2
(V) As (III) As (V) As (III) As (V) As (III) As (V) As (III)
96 0.959 0.581 0.615 0.23 0.48 0.962 0.975
96 0.983 0.601 0.619 1.52 1.53 0.959 0.977
91 0.987 0.623 0.652 3.31 8.42 0.925 0.944
95 0.993 0.600 0.646 1.89 2.14 0.943 0.950
Time (min)0
Cex
it/C
in
0.0
0.2
0.4
0.6
0.8
1.0
concentration (mg/l)
321
As(V)
Time (min)0
Cex
it/C
in
0.00
0.02
0.04
0.06
0.08
0.10
As(III)
Time (min)0
Cex
it/C
in
0.0
0.2
0.4
0.6
0.8
1.0
concentration (mg/l)
321
Time (min)0
Cex
it/C
in
0.00
0.02
0.04
0.06
0.08
0.10
400 800 1200 1600
400 800 1200 1600
100 200 300
20 40 60 80 100
Fig. 10. Breakthrough data for varying inlet arsenic concentration (amount of
PBFe-Act¼1 g, Q¼0.003 lpm, pH¼7 for As (III) and pH¼6.5 for As (V), T¼303 K).
ARTICLE IN PRESS
Table 4Total uptake of arsenic during adsorption on PBFe-Act under flow conditions. (Particle diameter¼0.6�10�3 m).
S. no Cin (mg/L) Lbed (cm) Q (lpm) VR�104 (m/s) Through-put volume, QDt (L) Specific-solute uptake (mg/g)
As (V) As (III) As (V) As (III)
1 1 3 0.003 9.95 3.96 4.00 2.80 2.60
2 2 3 0.003 9.95 3.06 2.78 3.16 3.00
3 3 3 0.003 9.95 1.98 2.34 3.20 3.30
4 1 3 0.006 19.8 4.12 4.40 3.17 2.70
5 1 3 0.009 29.8 4.32 4.33 3.24 2.68
6 1 6 0.003 9.95 7.30 7.56 2.91 2.83
7 1 12 0.003 9.95 13.4 13.68 2.78 2.73
A. Sharma et al. / Chemical Engineering Science 65 (2010) 3591–3601 3601
(polymeric precursor based) adsorbents/catalysts in bulk forenvironmental remediation applications, in particular, waterpurifiers.
Acknowledgments
The authors acknowledge the support from the Department ofScience and Technology (DST), New Delhi in the form of researchgrants and through its Center on Nanosciences.
References
APHA. 1998. Standard Methods for the Examination of Water and Wastewater.19th ed., American Public Health Association, Washington, DC, USA.
Appelo, C.A.J., Weiden, V.D., Tournassat, C., Charlet, L., 2002. Surface complexationof ferrous iron and carbonate on ferrihydrite and the mobilization of arsenic.Environmental Science and Technology 36 (14), 3096–3103.
Chen, W., Parettea, R., Zoua, J., Cannon, F.S., Dempseya, B.A., 2007. Arsenic removalby iron-modified activated carbon. Water Research 41 (9), 1851.
Deliyanni, E.A., Bakoyannakis, D.N., Zouboulis, A.I., Matis, K.A., 2003. Sorption of As(V) ions by akaganeite-type nanocrystals. Chemosphere 50, 155–163.
Fendorf, S., Eick, M.J., Grossl, P., Sparks, D.L., 1997. Arsenate and chromateretention mechanism on goethite. Surface structure. Environmental Scienceand Technology 31 (1), 315–320.
Gaur, V., Asthana, R., Verma, N., 2006a. Removal of SO2 by activated carbon fibersin presence of O2 and H2O. Carbon 44, 46–60.
Gaur, V., Sharma, A., Verma, N., 2006b. Preparation and characterization ofactivated carbon fiber for the control of BTX and SO2. Chemical EngineeringProcessing 45 (1), 1–13.
Gupta, A., Deva, D., Sharma, A., Verma, N., 2009. Adsorptive removal of fluoride bymicro-nano hierarchal web of activated carbon fibers. Industrial andEngineering Chemistry Research 48, 9697–9707.
Gu, Z., Fang, J., Deng, B., 2005. Preparation and evaluation of GAC based iron-containing adsorbents for arsenic removal. Environmental Science andTechnology 39 (10), 3833–3843.
Huang, C.P., Vane, L.M., 1989. Enhancing As5 + removal by a Fe2 + treated activatedcarbon. Journal of WPCF 61 (9), 1596–1603.
Jang, M., Chen, W., Cannon, F.S., 2008. Preloading hydrous ferric oxide intogranular activated carbon for arsenic removal. Environmental Science andTechnology 42, 3369–3375.
Jin, Y.-S., Jiang, T., Yang, Y.-B., Li, Q., Li, G.-H., Guo, Y.-F., 2006. Removal ofphosphorus from iron ores by chemical leaching. Journal of Central SouthUniversity of Technology 06, 0673–0675.
Katsoyiannis, I.A., Zouboulis, A.I., 2002. Removal of arsenic from contaminatedwater sources by sorption onto iron-oxide coated polymeric materials. WaterResearch 36, 5141–5155.
Manning, B.A., Goldberg, S., 1997. Adsorption and stability of arsenic(III) at theclay mineral–water interface. Environmental Science and Technology 31 (7),2005–2011.
Kuriakose, S., Singh, T.S., Pant, K.K., 2004. Adsorption of As (III) from aqueoussolution onto iron oxide impregnated activated alumina. Water QualityResearch Journal 39 (3), 258–266.
Muniz, G., Fierro, V., Celzard, A., Furdin, G., Gonzalez-Sanchez, G., Ballinas, M.L.,2009. Synthesis, characterization and performance in arsenic removal of iron-doped activated carbons prepared by impregnation with Fe(III) and Fe(II).Journal of Hazardous Materials 165, 893–899.
Munoz, J.A., Gonzalo, A., Valiente, M., 2002. Arsenic adsorption by Fe(III)-loadedopen-celled cellulose sponge. Thermodynamic and selectively aspects. Envir-onmental Science and Technology 36 (14), 3405–3411.
Onyango, M.S., Kojima, Y., Matsuda, H., Ochieng, A., 2003. Adsorption kinetics ofarsenic removal from groundwater by iron-modified zeolite. Journal ChemicalEngineering Japan 36 (12), 1516–1522.
Puigdomenech, I., 1999. Medusa. Royal Institut of Technology, Estocolm, /www.inorg.kth.seS. Software.
Raven, K.P., Jain, A., Loeppert, R.H., 1998. Arsenite and arsenate adsorption onferrihydrite: kinetics, equilibrium, and adsorption envelope. EnvironmentalScience and Technology 32, 344–349.
Singhal, R., Sharma, A., Verma, N., 2008. Micro/nano hierarchal web of activatedcarbon fibers for catalytic gas adsorption and reaction. Industrial andEngineering Chemistry Research 47 (10), 3700–3707.
Singh, T.S., Pant, K.K., 2004. Equilibrium, kinetic and thermodynamic studies foradsorption of As (III) on activated alumina. Separation and PurificationTechnology 36 (2), 139–147.
Smedley, P.L., Kinniburgh, D.G., 2002. A review of the source, distributionand behaviour of arsenic in natural waters. Applied Geochemistry 17,517–568.
Thorne, P.S., 1995. Arsenic in the environment part I: cycling and characterization.Arsenic in the environment part II: human health and ecosystem effects.Chemical Engineering Science 50 (4), 741–742.
Vaughan Jr., R.L., Reed, B.E., 2005. Modeling As (V) removal by a iron oxideimpregnated activated carbon using the surface complexation approach.Water Research 39 (6), 1005–1014.
Xu, Y., Axe, L., 2005. Synthesis and characterization of iron oxide coated silicaand its effect on metal adsorption. Journal of Colloid Interface Science 282,11–19.