Embed Size (px)
Citation preview

Eur J Nutr 42 : 287–292 (2003)DOI 10.1007/s00394-003-0425-3
■ Summary Background Enrich-ment of wheat flour with iron,which commenced in Finland inthe mid-1970s, ceased in 1994. Nodata on iron status among adultshave been published since 1993.
Received: 28 June 2002Accepted: 26 March 2003
M. Lahti-Koski · Liisa M. Valsta, PhD (�) ·H. TapanainenDept. of Epidemiology and Health PromotionNational Public Health Institute (KTL)Mannerheimintie 16600300 Helsinki, FinlandTel.: +3 58-9/47 44-85 98Fax: +3 58-9/47 44-85 91E-Mail: [email protected]
G. Alfthan · A. AroDept. of Health and Functional CapacityNational Public Health Institute (KTL)Helsinki, Finland
Aim of the study To assess the ironstatus, adequacy of iron intake anddietary sources of iron in Finnishadults. Methods A random sampleof adults aged 25–64 years in thecapital area of Finland was strati-fied for sex and 10-year age groups.Food consumption was measuredwith 24-h recall and a 38-item foodfrequency questionnaire. Iron sta-tus was evaluated by haemoglobin(Hb) concentration and otherhaematological variables from ve-nous blood samples in both gen-ders (n = 239 men and 190 women),and serum ferritin (SF) for women(n = 137). Results The mean Hbconcentration was 133 ± 12 g/l and137±10 g/l for women aged < 50years and ≥ 50 years, respectively,and 150 ± 10 g/l for men. Inyounger women, the mean SF levelwas 32 ± 30 µg/l and 20 % of
women showed iron depletion(SF < 12 µg/l), whereas in olderwomen, the respective results were62 ± 59 µg/l and 11 %. The preva-lence of anaemia was 5.8 % forwomen (Hb < 120 g/l) and 1.3 % formen (Hb < 130 g/l). The respectivemean intakes of iron were 10 mg/dand 13 mg/d. Cereals and meatwere the major dietary sources ofiron. Conclusions While iron statusis fairly good among Finnishmales, especially in youngerwomen it is suboptimal, with ironintake failing to reach recom-mended levels. Food consumptionwas poorly associated with ironstatus.
■ Key words iron status – ferritin– haemoglobin – iron intake –dietary sources – Finland
ORIGINAL CONTRIBUTION
Marjaana Lahti-KoskiLiisa M. ValstaGeorg AlfthanHeli TapanainenAntti Aro
Iron status of adults in the capital area of Finland
Introduction
Dietary habits in Finland have improved over the pastfew decades. Most of these changes in food consump-tion, such as increased consumption of sources ofhaeme iron (meat) and foods rich in vitamin C (vegeta-bles and fruits) should have been favourable regardingiron status. However, cereal consumption has decreased[1]. In addition, the fortification of white flour with in-organic iron (4 mg ferrum reductum/100 g flour), whichbegan in 1974, ceased in 1994.
Although iron deficiency is typical for populations indeveloping countries, iron depletion and anaemia are
also present in Western populations, based on studiescarried out in Europe [2]. Some thirty years ago, theprevalence of anaemia was shown to be about 6 % inFinnish women [3]. In a more recent study, the propor-tion of women with low iron stores was still a matter ofconcern [4]. However, recent studies on iron status ofFinns, particularly men, are lacking.
This study was carried out to assess the iron status ina random sample of adults living in the capital area ofFinland. We also investigated the dietary intake andsources of iron and the prevalence of iron supplementuse as well as the associations of these with indicators ofiron status.
EJN 425
288 European Journal of Nutrition, Vol. 42, Number 5 (2003)© Steinkopff Verlag 2003
Subjects and methods
■ Participants
The data used in this study were collected as a part of theFINDIET 1997 study, which was carried out in Finlandbetween January and March 1997 [5].The FINDIET 1997study, in turn, formed a part of the FINRISK 1997 study[6], for which an age- and sex-stratified random sampleof 10 000 persons aged 25–64 years was drawn from thepopulation registers of five regions. One of these regionswas the capital area, including the cities of Helsinki andVantaa. The subjects were invited to a health examina-tion at the local health care centre. At the examination,40 % of these subjects were invited to participate in amore extensive dietary survey. Iron status was assessedin the capital area only.
The original sample for this study included 400women and 400 men aged 25–64 years living in the cap-ital area of Finland. These subjects were invited to ahealth examination and were asked to participate in adietary survey after the examination. In all, 275 womenand 266 men participated in the dietary survey and wereinterviewed by 24-h recall. Blood samples of 190 non-pregnant women and 239 men were obtained. In addi-tion, since iron status is more likely to be poor inwomen, samples for serum ferritin analysis were ran-domly taken from 137 women.The final numbers of par-ticipants divided in two age groups (aged < 50 yearsand ≥ 50 years) are presented in Table 1.
This study protocol was approved, as part of the FIN-RISK 1997 study, by the Ethical Committee of the Na-tional Public Health Institute.
■ Measurements
Blood samples were drawn after a four hour fasting fromthe antecubital vein into EDTA vacuum tubes and a0.5 ml whole blood sample was taken for assaying bloodhaemoglobin (Hb) concentration and other haemato-logical variables. The sample was kept at 4 °C in the darkuntil being transferred to the laboratory (VITA-Ter-veyspalvelut Oy), where Hb and erythrocyte indices,mean corpuscular volume (MCV), mean corpuscularhaemoglobin (MCH) and mean corpuscular haemoglo-bin concentration (MCHC) were measured with a Coul-ter Counter Analyser (Sysmex NE 8000).
Serum samples for ferritin measurements werefrozen in polyethene tubes at –20 °C at the health carecentre. Next, these samples were transferred to the Na-tional Public Health Institute, where they were stored at–20 °C until analyzed. Serum ferritin (SF) was deter-mined using AxSYM Ferritin Microparticle Enzyme Im-munoassay (Abbott Laboratories, Abbott Park, IL). Theaccuracy of the ferritin method was –6 % and the preci-sion between series was 3.5 CV%.
Based on conventional cut-off points, anaemia wasdefined as a Hb concentration of less than 120 g/l forwomen and 130 g/l for men. The results for serum fer-ritin levels were described using two cut-off points: < 12µg/l as an indicator for absent iron stores [7] and < 16µg/l as an indicator for small iron stores [8]. These cut-off points were also chosen in order for the results to becomparable with earlier Finnish studies [4].
As suggested by Hulthén et al. [9], infections shouldbe considered when using serum ferritin in the diagno-sis of iron deficiency. In this study, the subjects were notinquired about their infections but ultrasensitive c-reac-tive protein (CRP) was used as an indicator of presentinflammatory processes. Ultrasensitive CRP was deter-mined by immunoturbidimetry (Orion Diagnostica, Es-poo, Finland, kit no. 68025). The results for serum fer-ritin were analysed both with and without the subjectswith high CRP-levels (> 8 mg/l,n = 6).The results did notchange materially, however, and all the subjects were in-cluded in the final analyses.
Food and nutrient intakes of the participants werecalculated on the basis of 24-hour recalls collected at theexamination. These dietary interviews were conductedby trained nutritionists. A 126-item picture booklet to-gether with food models were used in estimating por-tion sizes. The Finnish food composition database(FINELI®), created and maintained at the National Pub-lic Health Institute [10], was used for calculating nutri-ent intakes.
Along with the invitation to the local health care cen-tre, a questionnaire was sent to subjects to be completedat home. It covered questions on socio-economic fac-tors, medical history, health behaviour and psychosocialfactors, which were used as background variables in this
Table 1 Number of blood samples and participation rates in women and men inthe FINDIET 1997 study in the capital area of Finland
Variable
Haemoglobin Serum ferritin
WomenBlood samples (n)
Women < 50 years of age 118 84Women ≥ 50 years of age 72 53All women 190 137
Proportion (%) of total sample (n = 400) 48 34Proportion (%) of participants (n = 275a) 69 50
MenBlood samples (n)
Men < 50 years of age 141Men ≥ 50 years of age 98All men 239
Proportion (%) of total sample (n = 400) 60Proportion (%) of participants (n = 266a) 90
a Total sample of the dietary study in the capital area of Finland
M. Lahti-Koski et al. 289Iron status in Finland
study. In addition, a 38-item food frequency question-naire was included. Food frequency data were used ininvestigating associations between iron status and foodconsumption. The frequency of food consumption dur-ing the past 12 months was assessed with six response al-ternatives, ranging from “less than once a month or notat all” to “daily”. Responses were converted into numberof portions for food consumptions per month. Four sumindices were calculated to indicate the consumption of1) foods rich in haeme iron, 2) foods rich in non-haemeiron, and foods either 3) enhancing or 4) inhibiting ab-sorption of iron. The first group included the consump-tion of fish, poultry, meat and sausages. The secondgroup included cereal and legume consumption. Thethird group included fresh vegetables, fruit, berries andjuices made with fruit or berries. The fourth group in-cluded coffee, tea, chocolate and milk products.
Information on the use of vitamin and mineral sup-plements, including iron supplements, was collectedwith a questionnaire in which subjects were asked aboutuse during the past six months. The type of supplementsand the regularity of use (occasional, regular) were alsoqueried. This questionnaire was given to the partici-pants after the dietary interview to be completed athome and returned by mail to the researchers. Of thequestionnaires, 92 % were returned. Subjects reportingregular use of iron supplements were defined as supple-ment users.
■ Statistical analysis
In statistical analysis, Student’s t-test and the Mann-Whitney rank sum test were used to evaluate the signif-icance of differences between subgroups in variables in-dicating iron status and use of iron supplements. Thenon-parametric test (Mann-Whitney) was chosen when
the distribution did not fulfil the assumptions neededfor parametric tests. A mixed model for measurementerror was used to test differences in nutrient intakesbased on 24-h recall. P-values ≤ 0.05 were consideredsignificant.
Linear regression analysis was used to estimate theeffect of food consumption on iron status. These testswere performed using the generalized linear model(GLM) procedure of the SAS statistical package, with in-dicators of iron status as dependent variables. Four sumindices indicating the consumption of haeme ironsources, non-haeme iron sources, and foods enhancingor inhibiting iron absorption were used as independentvariables in the models. These models were controlledfor the use of iron supplements.The SAS statistical pack-age was used in other statistical analyses as well.
Results
The mean Hb concentration was 134 g/l for women and150 g/l for men (Table 2). Also other haemotological pa-rameters of women were lower than those of men. Theseparameters did not vary much across the age groups inmen, whereas in women, the mean Hb concentrationwas lower in younger women (aged < 50 years) com-pared with older women (aged ≥ 50 years).Furthermore,the mean serum ferritin level was 32 µg/l in youngerwomen and 62 µg/l in older women.
Fourteen (3 %) subjects proved to be anaemic. Only 3men had Hb < 130 g/l, whereas 11 women, of which 4were 50 years of age or older, had Hb < 120 g/l. Thus, theprevalence of anaemia was 5.8 % in women and 1.3 % inmen.
Serum ferritin levels were used in defining iron de-pletion in women. Based on the cut-off point of < 12µg/l, 23 women (16 %) were observed with depleted iron
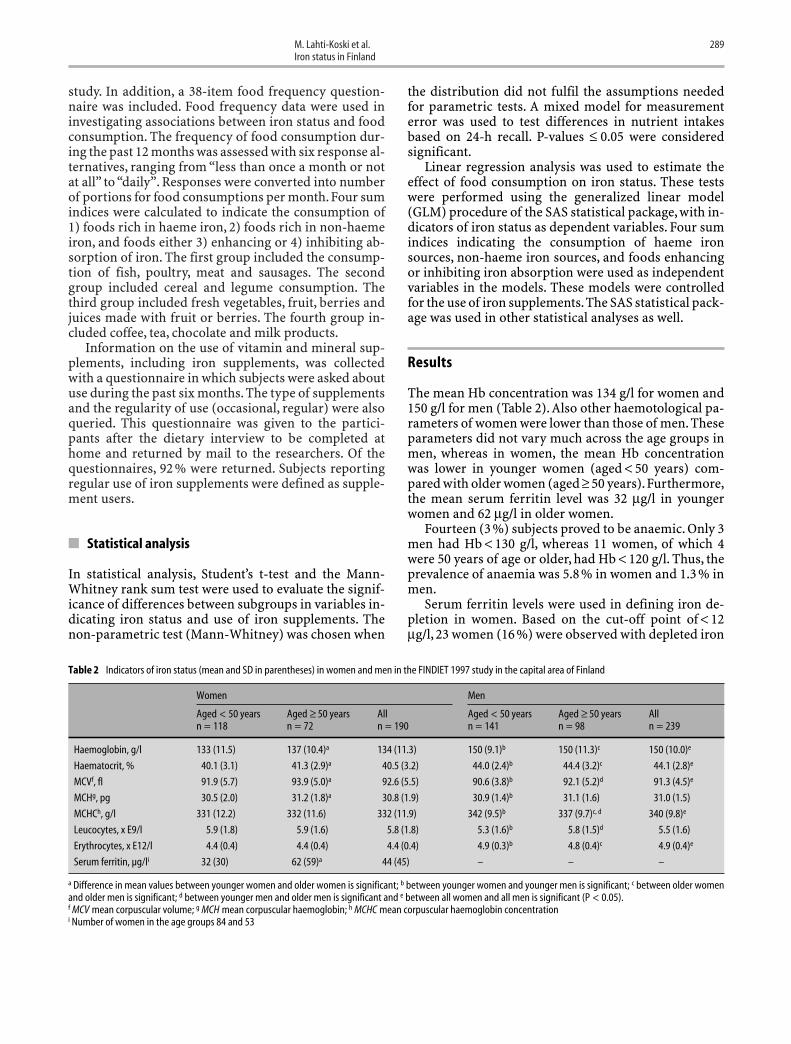
Table 2 Indicators of iron status (mean and SD in parentheses) in women and men in the FINDIET 1997 study in the capital area of Finland
Women Men
Aged < 50 years Aged ≥ 50 years All Aged < 50 years Aged ≥ 50 years Alln = 118 n = 72 n = 190 n = 141 n = 98 n = 239
Haemoglobin, g/l 133 (11.5) 137 (10.4)a 134 (11.3) 150 (9.1)b 150 (11.3)c 150 (10.0)e
Haematocrit, % 40.1 (3.1) 41.3 (2.9)a 40.5 (3.2) 44.0 (2.4)b 44.4 (3.2)c 44.1 (2.8)e
MCVf, fl 91.9 (5.7) 93.9 (5.0)a 92.6 (5.5) 90.6 (3.8)b 92.1 (5.2)d 91.3 (4.5)e
MCHg, pg 30.5 (2.0) 31.2 (1.8)a 30.8 (1.9) 30.9 (1.4)b 31.1 (1.6) 31.0 (1.5)
MCHCh, g/l 331 (12.2) 332 (11.6) 332 (11.9) 342 (9.5)b 337 (9.7)c, d 340 (9.8)e
Leucocytes, x E9/l 5.9 (1.8) 5.9 (1.6) 5.8 (1.8) 5.3 (1.6)b 5.8 (1.5)d 5.5 (1.6)
Erythrocytes, x E12/l 4.4 (0.4) 4.4 (0.4) 4.4 (0.4) 4.9 (0.3)b 4.8 (0.4)c 4.9 (0.4)e
Serum ferritin, µg/li 32 (30) 62 (59)a 44 (45) – – –
a Difference in mean values between younger women and older women is significant; b between younger women and younger men is significant; c between older womenand older men is significant; d between younger men and older men is significant and e between all women and all men is significant (P < 0.05).f MCV mean corpuscular volume; g MCH mean corpuscular haemoglobin; h MCHC mean corpuscular haemoglobin concentrationi Number of women in the age groups 84 and 53
290 European Journal of Nutrition, Vol. 42, Number 5 (2003)© Steinkopff Verlag 2003
stores. Of these, 17 were younger than 50 years of age.The proportion of women with depleted iron stores was20 % in younger women and 11 % in older women. Ofyounger women, 27 (32 %) had a serum ferritin level of16 µg/l or less, whereas in older women, the respectivenumber of women was 7 (13 %).
The mean iron intake did not vary across the agegroups, being 10 mg/d for women and 13 mg/d for men,when the intake from iron supplements was excluded(Table 3). Energy-adjusted intake of iron was 1.5 mg/MJfor both genders. The number of subjects using ironsupplements regularly was 16 (4 %), 12 of whom werewomen.For supplement users, the average additional in-take of iron from supplements was 80 mg/d.
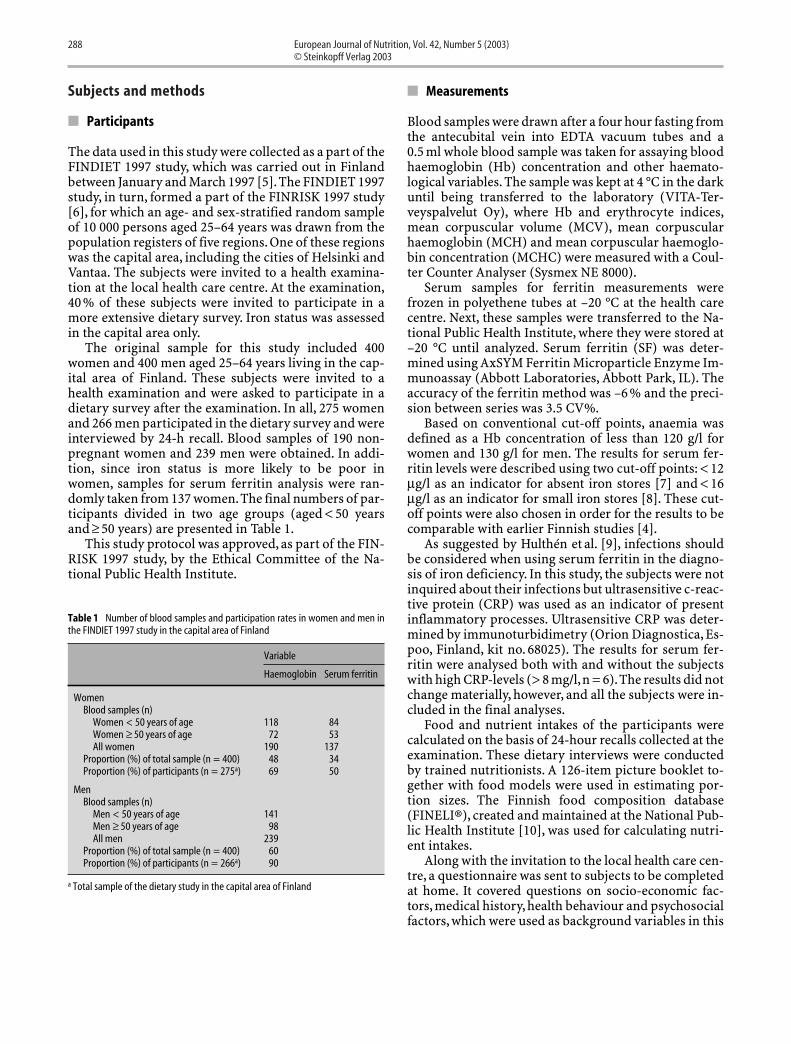
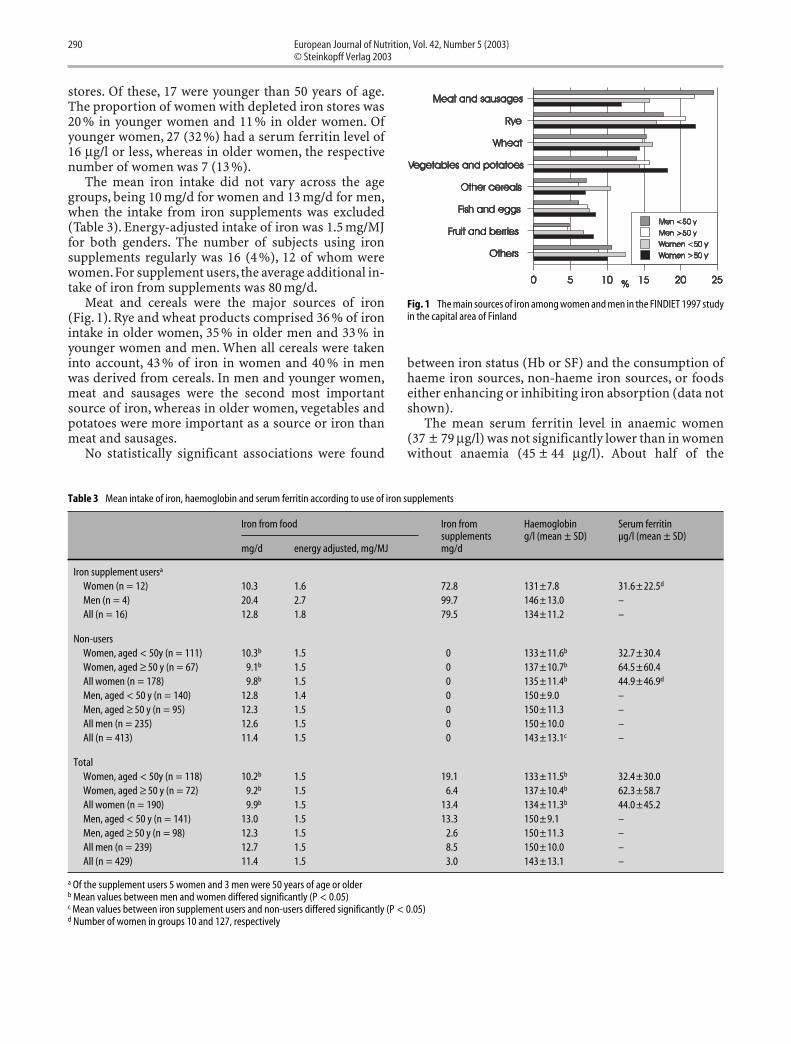
Meat and cereals were the major sources of iron(Fig. 1). Rye and wheat products comprised 36 % of ironintake in older women, 35 % in older men and 33 % inyounger women and men. When all cereals were takeninto account, 43 % of iron in women and 40 % in menwas derived from cereals. In men and younger women,meat and sausages were the second most importantsource of iron, whereas in older women, vegetables andpotatoes were more important as a source or iron thanmeat and sausages.
No statistically significant associations were found
between iron status (Hb or SF) and the consumption ofhaeme iron sources, non-haeme iron sources, or foodseither enhancing or inhibiting iron absorption (data notshown).
The mean serum ferritin level in anaemic women(37 ± 79 µg/l) was not significantly lower than in womenwithout anaemia (45 ± 44 µg/l). About half of the
Table 3 Mean intake of iron, haemoglobin and serum ferritin according to use of iron supplements
Iron from food Iron from Haemoglobin Serum ferritinsupplements g/l (mean ± SD) µg/l (mean ± SD)
mg/d energy adjusted, mg/MJ mg/d
Iron supplement usersa
Women (n = 12) 10.3 1.6 72.8 131±7.8 31.6±22.5d
Men (n = 4) 20.4 2.7 99.7 146±13.0 –All (n = 16) 12.8 1.8 79.5 134±11.2 –
Non-usersWomen, aged < 50y (n = 111) 10.3b 1.5 0 133±11.6b 32.7±30.4Women, aged ≥ 50 y (n = 67) 9.1b 1.5 0 137±10.7b 64.5±60.4All women (n = 178) 9.8b 1.5 0 135±11.4b 44.9±46.9d
Men, aged < 50 y (n = 140) 12.8 1.4 0 150±9.0 –Men, aged ≥ 50 y (n = 95) 12.3 1.5 0 150±11.3 –All men (n = 235) 12.6 1.5 0 150±10.0 –All (n = 413) 11.4 1.5 0 143±13.1c –
TotalWomen, aged < 50y (n = 118) 10.2b 1.5 19.1 133±11.5b 32.4±30.0Women, aged ≥ 50 y (n = 72) 9.2b 1.5 6.4 137±10.4b 62.3±58.7All women (n = 190) 9.9b 1.5 13.4 134±11.3b 44.0±45.2Men, aged < 50 y (n = 141) 13.0 1.5 13.3 150±9.1 –Men, aged ≥ 50 y (n = 98) 12.3 1.5 2.6 150±11.3 –All men (n = 239) 12.7 1.5 8.5 150±10.0 –All (n = 429) 11.4 1.5 3.0 143±13.1 –
a Of the supplement users 5 women and 3 men were 50 years of age or olderb Mean values between men and women differed significantly (P < 0.05)c Mean values between iron supplement users and non-users differed significantly (P < 0.05)d Number of women in groups 10 and 127, respectively
Fig. 1 The main sources of iron among women and men in the FINDIET 1997 studyin the capital area of Finland

M. Lahti-Koski et al. 291Iron status in Finland
anaemic women had a serum ferritin level of 16 µg/l orlower. Neither the intake nor the sources of iron differedbetween these groups (data not shown).
Discussion
In this random urban population study, the iron statusof Finnish men was fairly good, with only three menhaving haemoglobin levels of less than 130 g/l.The num-ber of anaemic women was not alarming (n = 11; 6 %),although the prevalence of low serum ferritin levels was20 % in younger women and 11 % in older women.
Surprisingly, our findings were in agreement withdata collected about 30 years ago when the enrichmentof wheat flour with iron had not yet commenced. In thatlarge epidemiological study (n = 6046) carried out indifferent parts of Finland, the prevalence of anaemiawas about 2 % in men and 6 % in women. Serum ferritinlevel was not evaluated [3]. In a more recent study, per-formed before the enrichment was ceased, the preva-lence of iron depletion (SF 12 µg/l or less) was 11 % inwomen aged 17–50 years [4]. This prevalence was some-what lower than in our study, as was the prevalence ofanaemia (2.5 %, Hb < 120 g/l) [4]. Although the earlierstudy was also carried out in the capital area, it shouldbe noted that these subjects were younger than in ourstudy and were not randomly selected but volunteersfrom an occupational health care clinic. Methodologicaldifferences should always be considered when compar-ing results from different studies [2].
In women, the mean iron intake failed to meet rec-ommendations of 10 mg/d for men and non-menstruat-ing women and 12–18 mg/d for menstruating women[11]. Similar to our findings, the average iron intake in aDutch study was low compared with recommendations,especially among women aged 20–49 years [12].
Although in some studies [12, 13], iron status hasbeen shown to be positively associated with meat andfish consumption and inversely associated with veg-etable consumption, our finding of no association be-tween food intake and iron status is supported by severalprevious studies [4, 14]. However, dietary intake being apoor predictor of iron status has been suggested, in part,to be caused by reporting error in diet [15]. While weagree that the methods used in our study, i. e. 24-h recalland a food frequency questionnaire, are prone to re-porting bias, using both should provide more accurateresults. Regardless of the method, no association wasfound between iron status and dietary intake. As shownin several studies [4, 16], variation in iron status maymostly be explained by blood losses via blood donationor menstrual bleeding. These factors were not investi-gated in this survey.
Based on the 1997 survey, the current intake of ironin Finland seems to be lower than in the early 1990s. En-
ergy-adjusted intake was 1.7 mg/MJ in men and1.6 mg/MJ in women in 1992 [17],whereas in 1997, it was1.5 mg/MJ in both men and women [5]. However, thechanges were not statistically significant. Overall, thesecomparisons should be interpreted with caution be-cause information on dietary intake was collected with3-d food records in 1992 and with 24-h recall in 1997.
Comparisons between 1992 [17] and the 1997 dietarysurvey [5] suggest that sources of iron may havechanged. The proportion of cereals as an iron source hasdecreased from 54 % to 47 % in men and from 52 % to45 % in women, whereas that of meat has increased from17 % to 22 % and from 15 % to 17 %, respectively. Part ofthe decreasing role of cereals as an iron source could beexplained by iron fortification of wheat flour ceasing in1994. Cereal consumption did not change over the five-year period.Almost two thirds of cereals consumed con-sisted of wheat and one fifth of rye. Of cereals, however,rye was the most important source of iron.
When considering iron sources in this substudy andin the larger 1997 dietary survey, variation in foodchoices across the regions in Finland should be takeninto account. In eastern Finland, the consumption of ryeproducts, and thus, its role as an iron source, is greaterthan in the capital area.
Our data suggest that the decision to discontinue for-tification of flour with iron may have been premature;the current iron status among Finnish adults seems to beat pre-enrichment levels. One of the reasons for ceasingfortification was the poor availability of iron in the formof ferrum reductum. Furthermore, an iron supplementwas considered unnecessary and potentially even harm-ful to men and post-menopausal women [18].
In Danish studies, iron status was shown to remainconsistent regardless of whether or not iron was taken asa supplement [8, 16]. Our finding of lower iron status ofsubjects using iron supplementation may indicate cau-tion in the use of these supplements. Iron supplementa-tion was probably used because of a diagnosed poor ironstatus rather than supplementation merely to be on thesafe side or because of health consciousness. Consump-tion of vitamin and mineral supplements, in general,hasbeen shown to be associated with higher consumptionof vegetables, fruits and berries as well as higher intakesof carotenoids and vitamins C and E, i. e. with healthierfood choices [19].
To conclude, the iron status of Finnish men seems tobe relatively good, despite the lack of iron fortificationin wheat flour since 1994. In contrast, based on the num-ber of women with low iron stores, the iron status ofFinnish women aged less than 50 years is suboptimal.Average iron intake also failed to reach the recom-mended levels. It remains to be seen, however, whetherthis status can be improved by dietary choices since noassociation was found between iron intake from food orsupplements and iron status.
292 European Journal of Nutrition, Vol. 42, Number 5 (2003)© Steinkopff Verlag 2003
■ Acknowledgements We thank all those who contributed to datacollection. Special thanks are due to Meri Simojoki, MSc, and IrmaSalminen, MSc, for data management, and to Päivi Mustonen and
Pirjo Laaksonen for biochemical analysis. Jouko Sundvall, PhD, isgratefully acknowledged for CRP analysis. This study was supportedby the Ministry of Social Affairs and Health.
References
1. Pietinen P, Lahti-Koski M,Vartiainen E,Puska P (2001) Nutrition and cardio-vascular disease in Finland since theearly 1970s: a success story. J NutrHealth Aging 5:150–154
2. Hallberg L (1995) Results of surveys toassess iron status in Europe. Nutr Rev53:314–322
3. Takkunen H, Seppänen R (1975) Irondeficiency and dietary factors in Fin-land. Am J Clin Nutr 28:1141–1147
4. Fogelholm M, Alopeus K, SilvennoinenT, Teirilä J (1993) Factors affecting ironstatus in non-pregnant women fromurban South Finland.Eur J Clin Nutr 47:567–574
5. The Findiet Study Group (1998) The1997 Dietary Survey of Finnish Adults.Publications of the National PublicHealth Institute B8/1998, Helsinki
6. Vartiainen E, Jousilahti P, Alfthan G,Sundvall J, Pietinen P, Puska P (2000)Cardiovascular risk factor changes inFinland from 1972 to 1997. Int J Epi-demiol 29:49–56
7. Cook JD, Skikne B (1989) Iron defi-ciency: definition and diagnosis. J In-tern Med 226:349–355
8. Milman N, Byg K-E, Ovensen L (2000)Iron status in Danes 1994, II: Prevalenceof iron deficiency and iron overload in1319 Danish women aged 40–70 years.Influence of blood donation,alcohol in-take and iron supplementation. AnnHematol 79:612–621
9. Hulthén L, Lindstedt G, Lundberg P-A,Hallberg L (1998) Effect of a mild infec-tion on serum ferritin concentration –clinical and epidemiological implica-tions. Eur J Clin Nutr 52:376–379
10. Ovaskainen M, Reinivuo H, KorhonenT (2001) Food Composition Table (inFinnish). National Public Health Insti-tute and Otava, Helsinki
11. National Nutrition Council (1998)Finnish Nutrition Recommendations.Committee Report 1998:7. Ministry ofAgriculture and Forestry, Helsinki
12. Brussaard JH, Brants HAM, Bouman M,Löwik MRH (1997) Iron intake and ironstatus among adults in the Netherlands.Eur J Clin Nutr 51:S51–S58
13. Galan P, Yoon H-C, Preziosi P, et al.(1998) Determining factors in the ironstatus of adult women in theSU.VI.MAX study. Eur J Clin Nutr 52:383–388
14. Osler M, Milman N, Heitmann BL(1998) Dietary and non-dietary factorsassociated with iron status in a cohortof Danish adults followed for six years.Eur J Clin Nutr 52:459–463
15. Heitmann BL, Milman N, Hansen GL(1996) Relationship between dietaryiron intake, corrected for diet reportingerror, and serum ferritin in Danishwomen aged 35–65 years. Br J Nutr 75:905–913
16. Milman N, Clausen J, Byg K-E (1998)Iron status in 268 Danish women aged18–30 years: influence of menstruation,contraceptive method, and iron supple-mentation. Ann Hematol 77:13–19
17. Kleemola P, Virtanen M, Pietinen P(1995) The 1992 Dietary Survey ofFinnish Adults. Publications of the Na-tional Public Health Institute B2/1994,Helsinki
18. Salonen JT, Nyyssönen K, Korpela H,Tuomilehto J, Seppänen R, Salonen R(1992) High stored iron levels are asso-ciated with excess risk of myocardial in-farction in eastern Finnish men. Circu-lation 86:803–811
19. Kaartinen P, Ovaskainen M-L, PietinenP (1997) The use of dietary supple-ments among Finnish adults. Scand JNutr 41:13–17