Embed Size (px)
Citation preview

IRRIGATION
DESIGN
THAT HELPS TO MEET
SUSTAINABILITY
Donald D. Franklin CID, CLIA,
(916) 899-9437
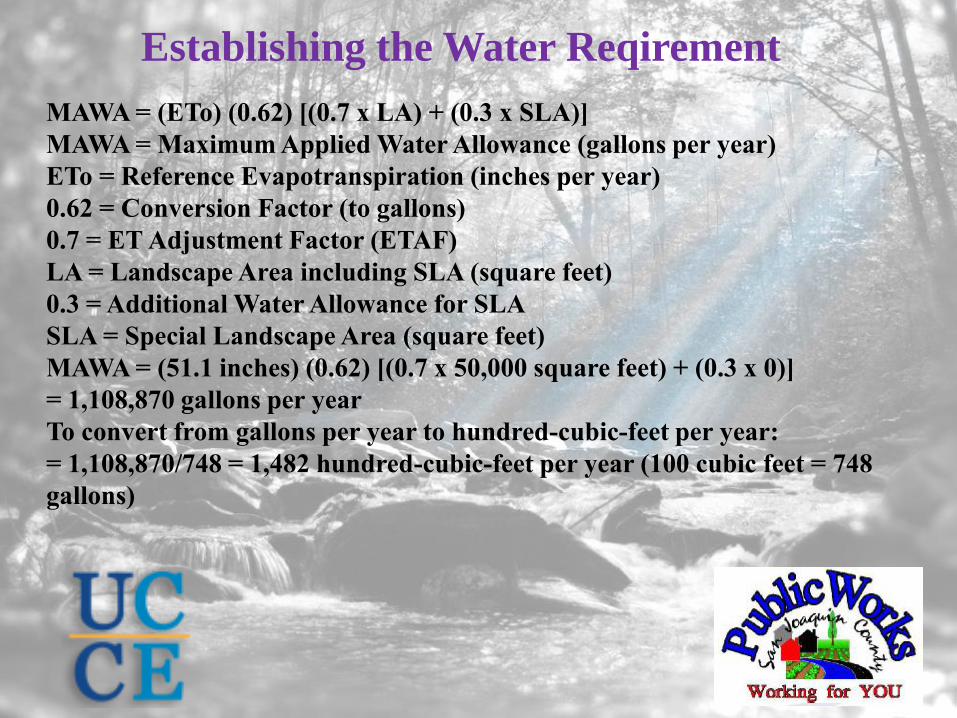
Establishing the Water Reqirement
MAWA = (ETo) (0.62) [(0.7 x LA) + (0.3 x SLA)]
MAWA = Maximum Applied Water Allowance (gallons per year)
ETo = Reference Evapotranspiration (inches per year)
0.62 = Conversion Factor (to gallons)
0.7 = ET Adjustment Factor (ETAF)
LA = Landscape Area including SLA (square feet)
0.3 = Additional Water Allowance for SLA
SLA = Special Landscape Area (square feet)
MAWA = (51.1 inches) (0.62) [(0.7 x 50,000 square feet) + (0.3 x 0)]
= 1,108,870 gallons per year
To convert from gallons per year to hundred-cubic-feet per year:
= 1,108,870/748 = 1,482 hundred-cubic-feet per year (100 cubic feet = 748
gallons)

ETWU = (ETo x 0.62) x [((PF x HA)/IE) +SLA]
Where:
ETWU = Estimated Total Water Use per year (gallons)
ETo = Reference Evapotranspiration (inches per year)
PF = Plant Factor from WUCOLS (see Section 491)
HA = Hydrozone Area [high, medium, and low water use areas]
(square feet)
SLA = Special Landscape Area (square feet)
0.62 = Conversion Factor
IE = Irrigation Efficiency (minimum 0.71)
1,090,740 = (51.6*0.62)*((0.65*50000)+0)
COMPLYING WITH LOCAL ORDINANCES

WHAT TOOLS ARE
AVAILABLE FOR WATER
CONSERVATION?

WHERE DOES
WATER CONSERVATION
BEGIN?

What Are The Goals Of Irrigation
Design?
Provide adequate soil moisture content in the plants root zone, as a supplement to rainfall.
Protect the landscape investment.
Minimize financial risk of a costly under or over designed system.
Minimize the amount of water the system will need to use.
Minimize the amount of labor required to efficiently operate the system.
Provide a system that will last for years with as little maintenance as possible.

CALCULATING REQUIRED SYSTEM GPM
GPM = (0.0104 x ETo x Area x Kc) / (DU x Hrs. Available)
Variable Value Ranges:
GPM = gallons per minute required
ETo = peak daily evapotranspiration for the worst case scenario in inches
Area = area to be irrigated in square feet
Kc = Crop Coefficient – use 1.0 if actual crop coefficient is not known
DU = distribution uniformity or irrigation efficiency
Hrs. Available = hours available for irrigation each day in the worst case
0.0104 = constant for conversion of area, flow and inches per day, etc. into
common units
(0.0104 x 0.36 x 50,000 x 0.7) / (0.71 x 8) =
23.07 GPM

Pipe Sizing

Static PSI Measurement
Calculate the static pressure at the following points: Outlet of control valve __________ Pressure gauge A __________ Pressure gauge B __________ Pressure gauge C __________
60 PSI
60 PSI
55.67 PSI = [60-4.33 =(0.433 x 10)]
51.34 PSI
100’ 50’ 50’
3/4” Class 200 PVC Pipe
1” Class 200 PVC Pipe
1-1/4” Class 200 PVC Pipe
A 10’
B 10’
C
ICV-101G Valve Inlet 60 PSI Static

Dynamic PSI Measurement
ICV-101G Valve Inlet 60 PSI Static
Calculate the dynamic pressure at the following points: Outlet of control valve __________ Inlet of sprinkler A __________ Inlet of sprinkler B __________ Inlet of sprinkler C __________
100’ 50’ 50’
B
C
10’
10’
3/4” Class 200 PVC Pipe
1-1/4” Class 200 PVC Pipe
1-1/2” Class 200 PVC Pipe
I25 Rotor 10 GPM each
A
56 PSI
54.35 PSI = 56-1.65 (from chart)
49.9 PSI = loss from chart + elevation
45.1 PSI

Pipe Sizing
Question - Why Do We Use Different
Pipe Sizes In An Irrigation System?

DESIGNING TO MANUFACTURER’S
SPECIFICATION
When Does It Pay To Install A Booster Pump

DESIGN TO MANUFACTURER’S
SPECIFICATION
(C) The irrigation system shall be designed to ensure that the
dynamic pressure at each emission device
is within the manufacturer’s recommended pressure range for
optimal performance.

Pressure Regulation At The Head
Standard in-stem pressure
regulator eliminates misting
and fogging – regulates
nozzle output to a true
30 PSI optimum
Passive Conservation Devices (C) The irrigation system shall be designed to ensure that the
dynamic pressure at each emission device is within the
manufacturer’s recommended pressure range for optimal
performance.

Correct Operating Pressure
12’ fixed 30 psi

Incorrect Operating Pressure
12’ fixed 45 psi

Check valve installed to
control low head drainage.
Check Valve Eliminates Low Head Drainage
§ 492.7 (1-Q) Check valves or anti-drain valves are required for all
irrigation systems.

1” 4.08
1 1/2” 9.17
2” 16.31
2 1/2” 25.49
3” 36.71
4” 65.26
Gallons per 100 feet

Typical Residence
• 500’ of 1” pipe
• 4.08 gallons per 100’
• 20.4 gallons drains per irrigation cycle
• 180 irrigation days per year
3,672 gallons per year wasted

Climate Based
or
Soil Moisture Based?
SWAT Tested?


What Head Should I Use?

Excellent
Very
Good
Good
Fair
Poor
Micro Spray 0.80 0.70 0.60 0.50 0.40
Drip Standard 0.80 0.70 0.65 0.55 0.50
Drip – Pressure Compensating 0.95 0.90 0.85 0.80 0.70
Excellent
Very
Good
Good
Fair
Poor
Fixed Spray 0.75 0.65 0.55 0.50 0.40
Rotor 0.80 0.70 0.65 0.60 0.50
Stream Rotor 0.85 0.80 0.75 0.65 0.55
Impact 0.80 0.70 0.65 0.60 0.50
From Predicting and Estimating Landscape Water Use (2001)
Sprinklers
Table 5-3: Estimated Sprinkler DU
Drip Systems
Table 5-4: Estimated Drip/Micro EU

High Distribution Uniformity

Impact Rotor Head
High Distribution Uniformity

Impact Rotor
High Distribution Uniformity

Spray or Mist Head
Typically Poor Distribution Uniformity

Uniformity Improvements 51 Audits


High Distribution Uniformity


Point Source Emitter
High Distribution Uniformity

In-Line Emitter
High Distribution Uniformity

Line
Source
Emitters
High Distribution Uniformity

Recent installs

Eco-Mat Installation Water Test
3 Min after startup 24 Min after startup

Eco-Mat Installation


Selecting Sprinklers & Spacing Ranges
• PSI: – sprinkler operating pressure.
• Radius: – distance from the sprinkler to the edge of
throw (in feet).
• GPM: – flow rate of the sprinkler with different size
nozzle orifices.
• Precipitation Rate: – delivery rate based on nozzle,
arc and spacing.
Sprinkler performance charts contain the following:

A B
C
Head A throws to heads
B & C
Head to Head Spacing

Selecting Sprinklers & Spacing Ranges
Head Spacing & Layout Impacts on Uniformity
• “Coverage” does not always mean good uniformity
• Triangle Patterns are not always better than Square Patterns

Selecting Sprinklers & Spacing Ranges
DU=68 SC=1.5 DU=82 SC=1.2 DU=87 SC=1.3
Triangle
DU=55 SC=2.2 DU=67 SC=1.7 DU=70 SC=1.5
Square
40 psi 50 psi 70 psi
#10 47’ O.C. Head Spacing

Selecting Sprinklers & Spacing Ranges
DU=70 SC=1.6 DU=84 SC=1.2 DU=91 SC=1.1
Square
DU=63 SC=1.9 DU=74 SC=1.5 DU=83 SC=1.3
Triangle
#10 Nozzle 40’ o.c. spacing
40 psi 50 psi 70 psi

RESULTS OF HEAD TO HEAD
COVERAGE

AVOIDING RUN OFF


TYING IT ALL TOGETHER
• Landscape Design
• Determine The Water Requirement
• Is There Sufficient Pressure?
• Select The Proper Equipment (Controls, Heads, Sensors)
• Proper Hydro Zoning
• Head Placement
• Pipe Sizing
• Educate The End User