Embed Size (px)
Citation preview
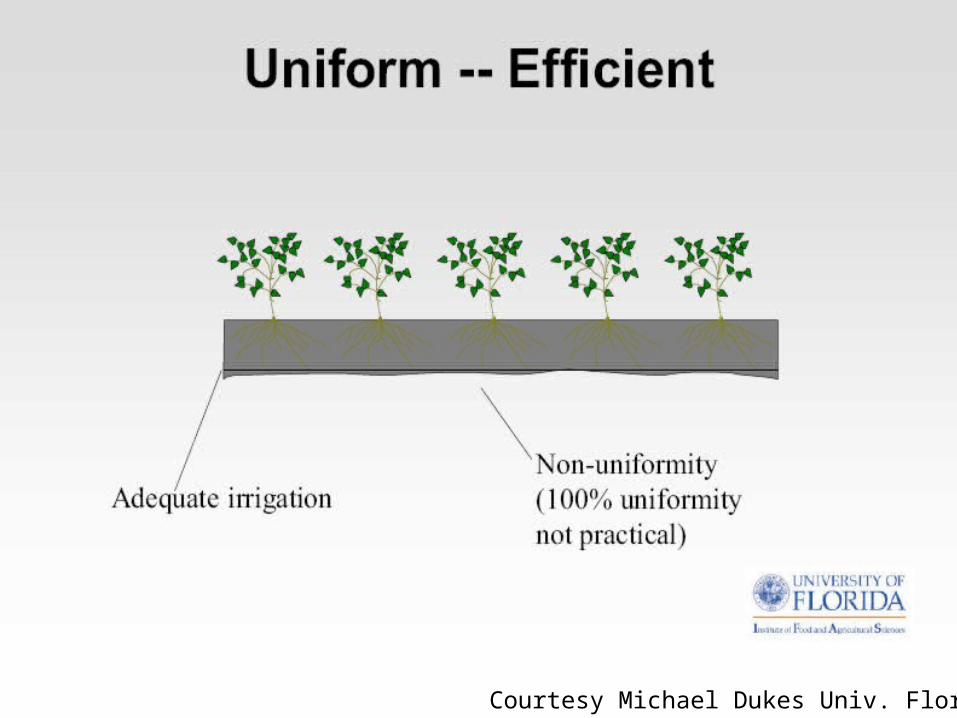
Irrigation Efficiency and Uniformity
R. Troy Peters, PhD, PE
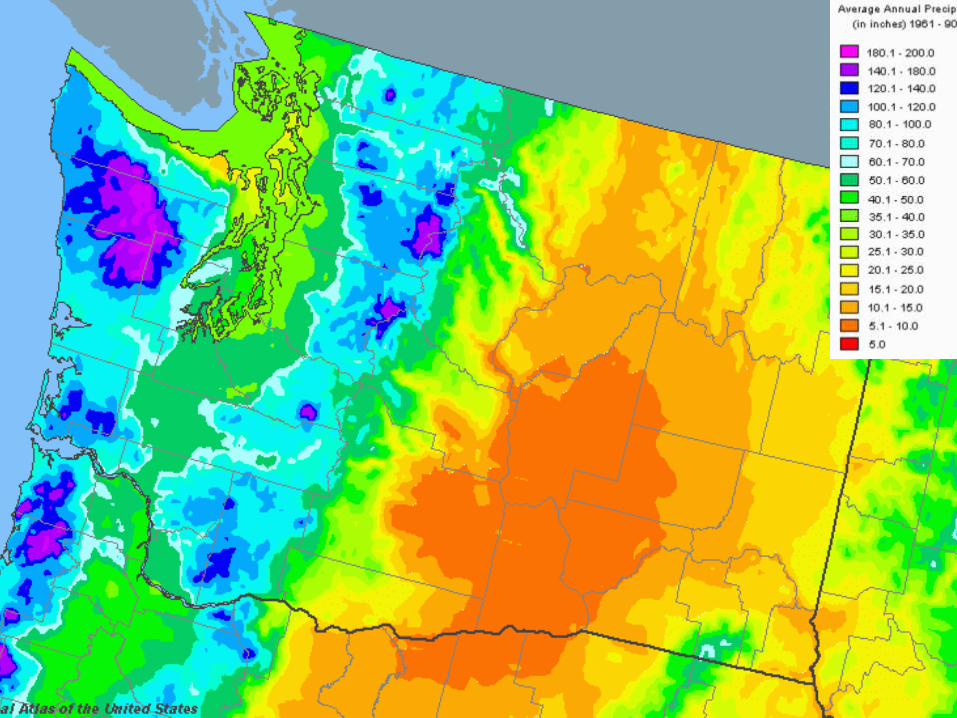
Average Annual Rainfall
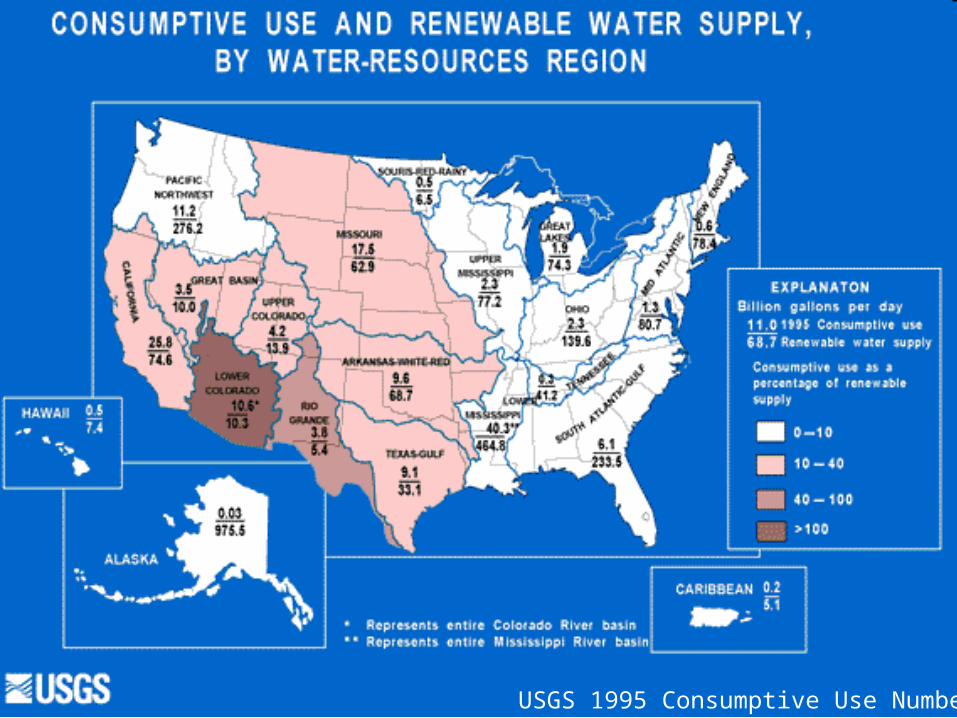
USGS 1995 Consumptive Use Numbers
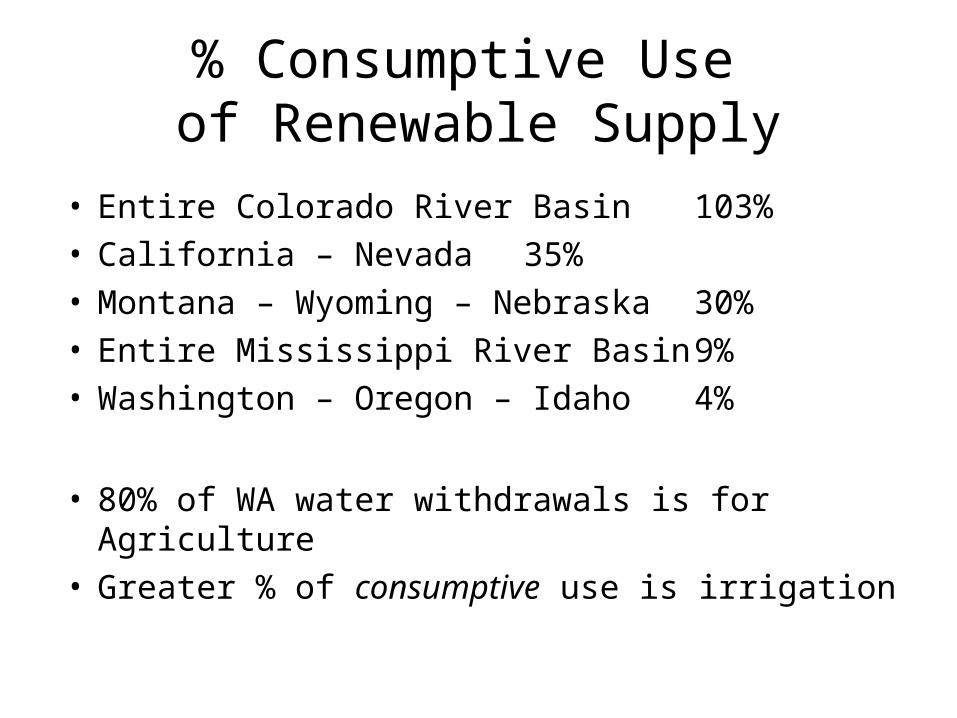
% Consumptive Use of Renewable Supply
• Entire Colorado River Basin 103%• California – Nevada 35%• Montana – Wyoming – Nebraska 30%• Entire Mississippi River Basin 9%• Washington – Oregon – Idaho 4%
• 80% of WA water withdrawals is for Agriculture• Greater % of consumptive use is irrigation
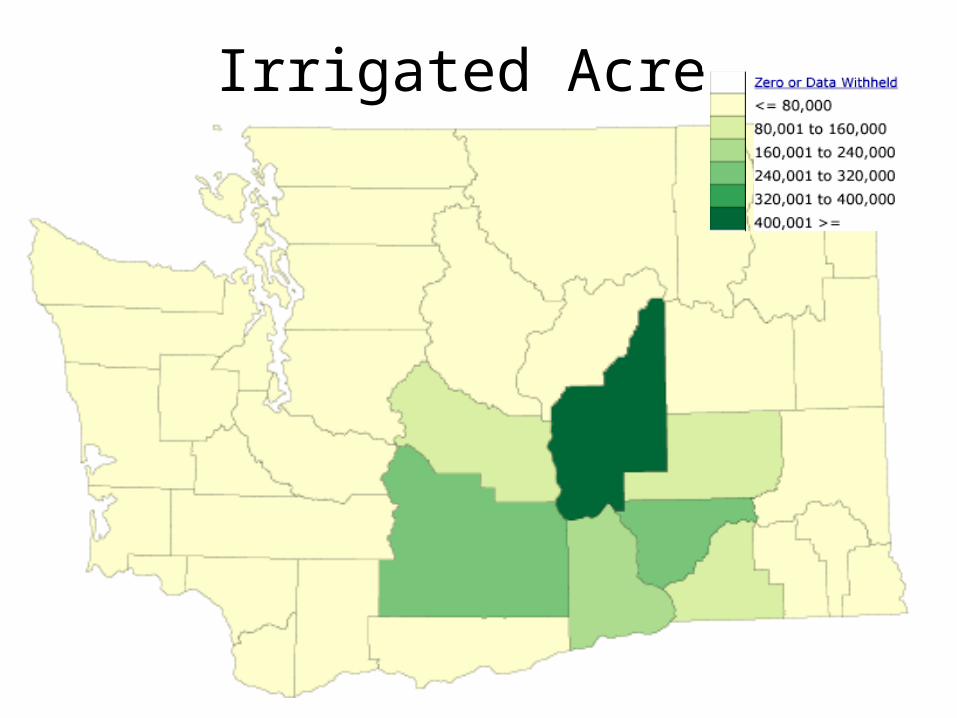
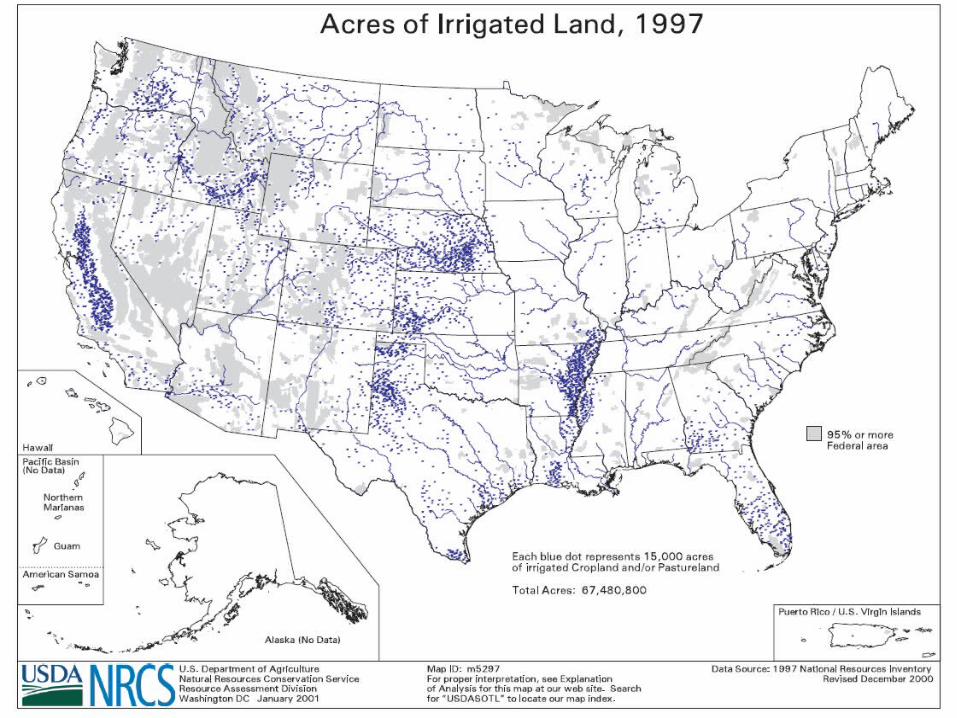
Irrigated Acres
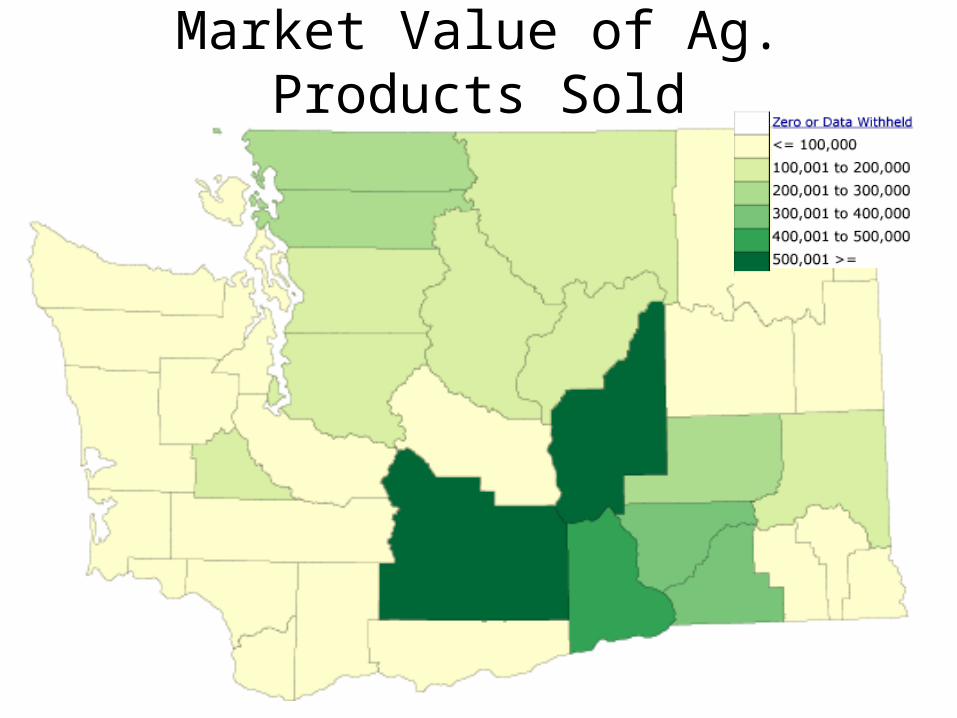
Market Value of Ag. Products Sold
Washington Irrigation
• 1.8 M irrigated acres• 80% sprinkler, 15% surface (gravity), 5% drip• 75% surface water, 25% groundwater• Today irrigators apply ¾ the amount of water
that they were in the early 1970’s and getting much better yields
• Recently (2002) the total sprinkler irrigated acres in the U.S. surpassed surface irrigated acres
2003 Census of Agriculture. Farm and Ranch Irrigation Survey
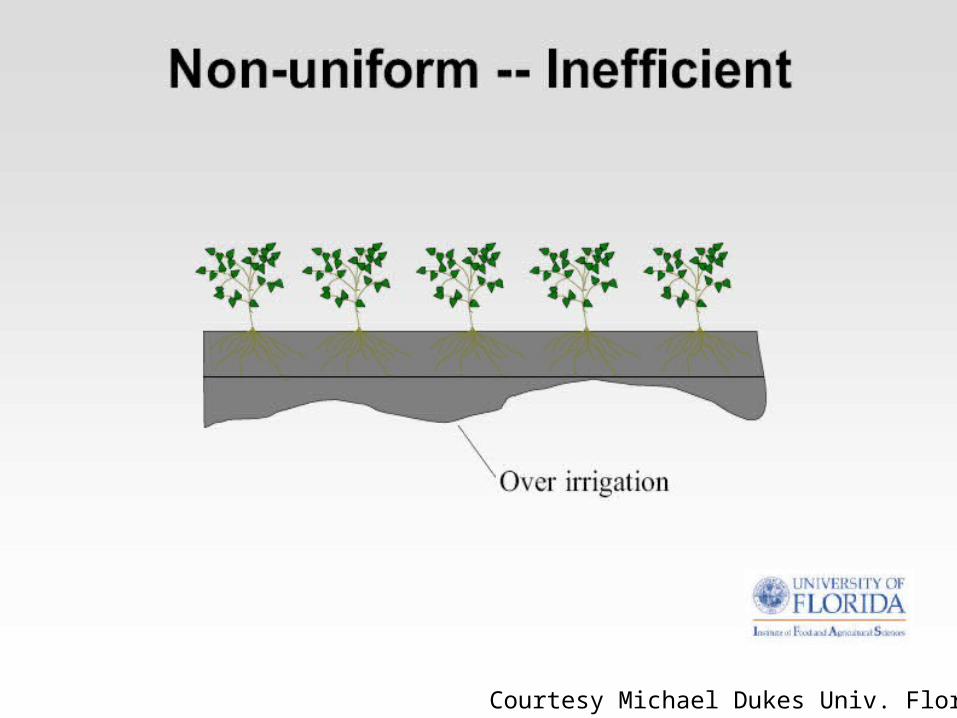
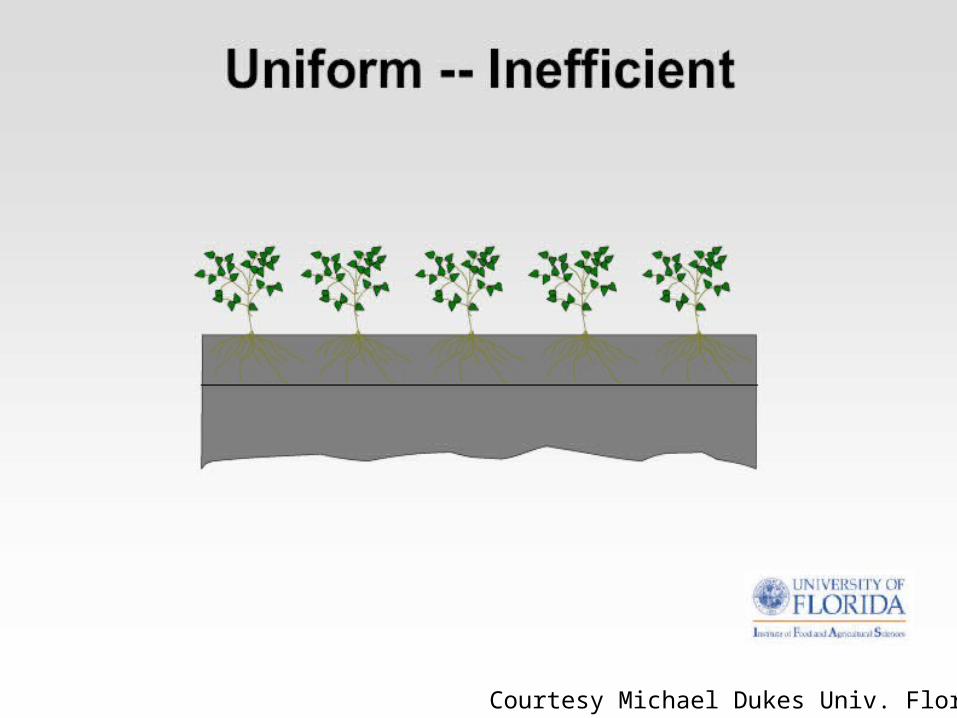
Courtesy Michael Dukes Univ. Florida
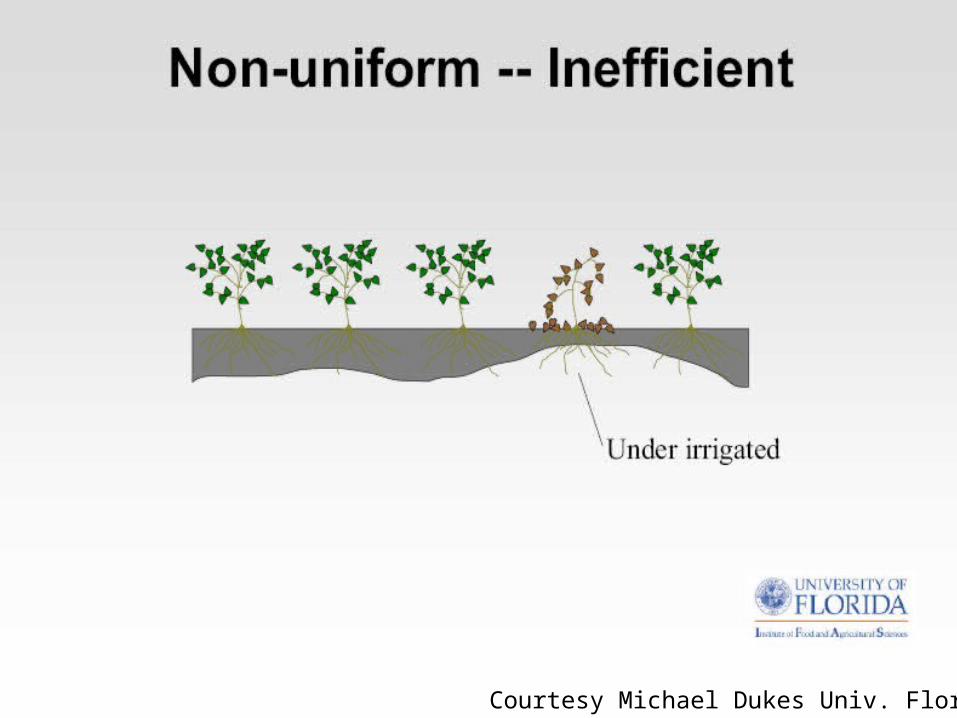
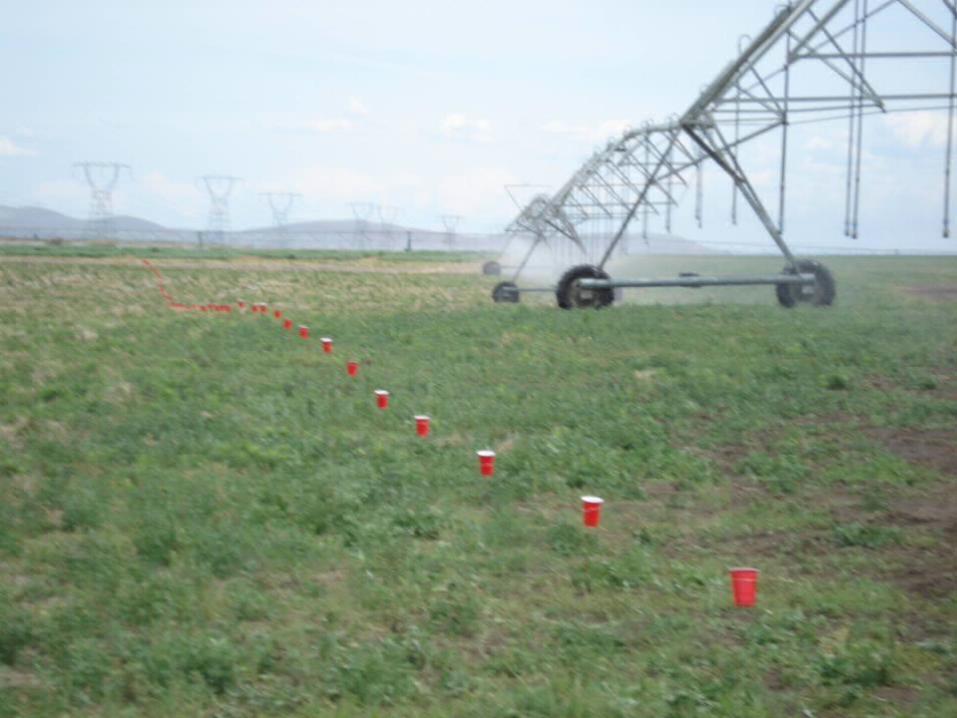
Courtesy Michael Dukes Univ. Florida
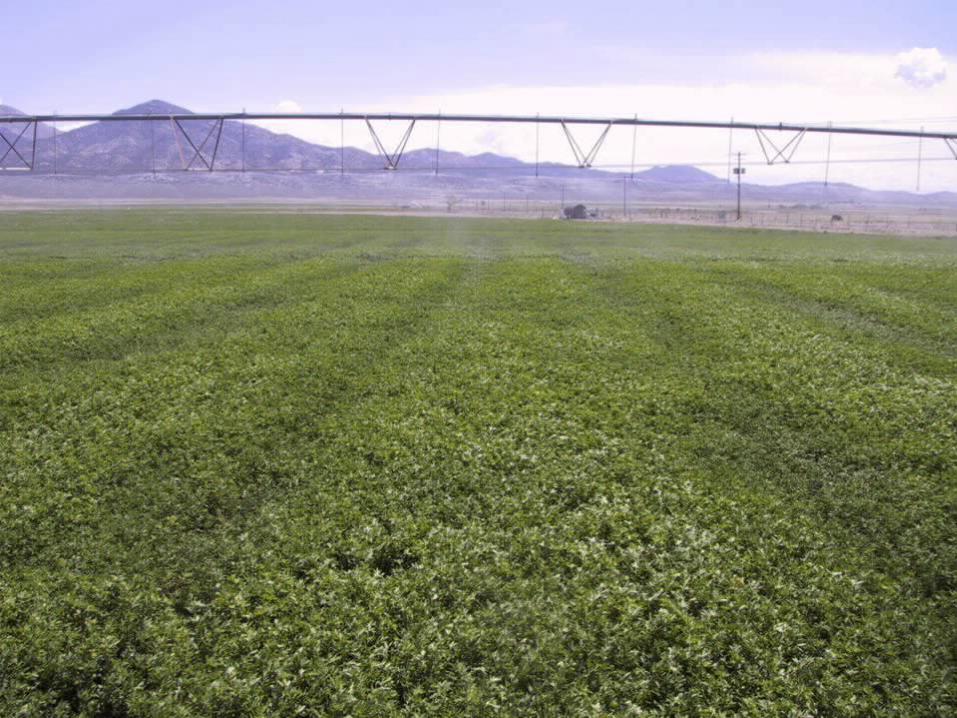
Courtesy Michael Dukes Univ. Florida
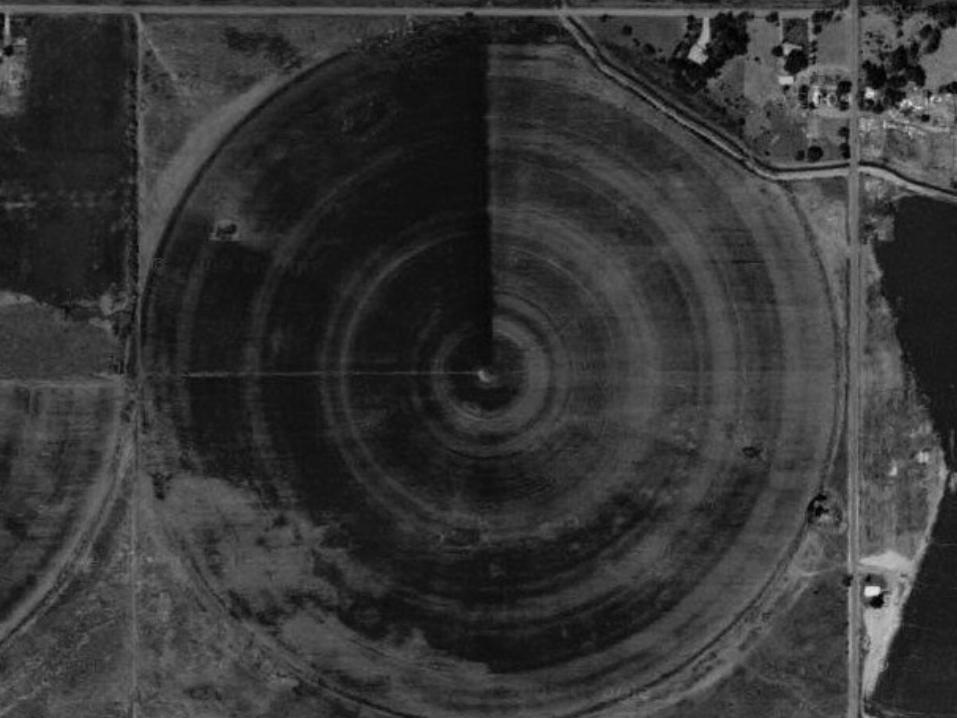
Courtesy Michael Dukes Univ. Florida
Courtesy Michael Dukes Univ. Florida
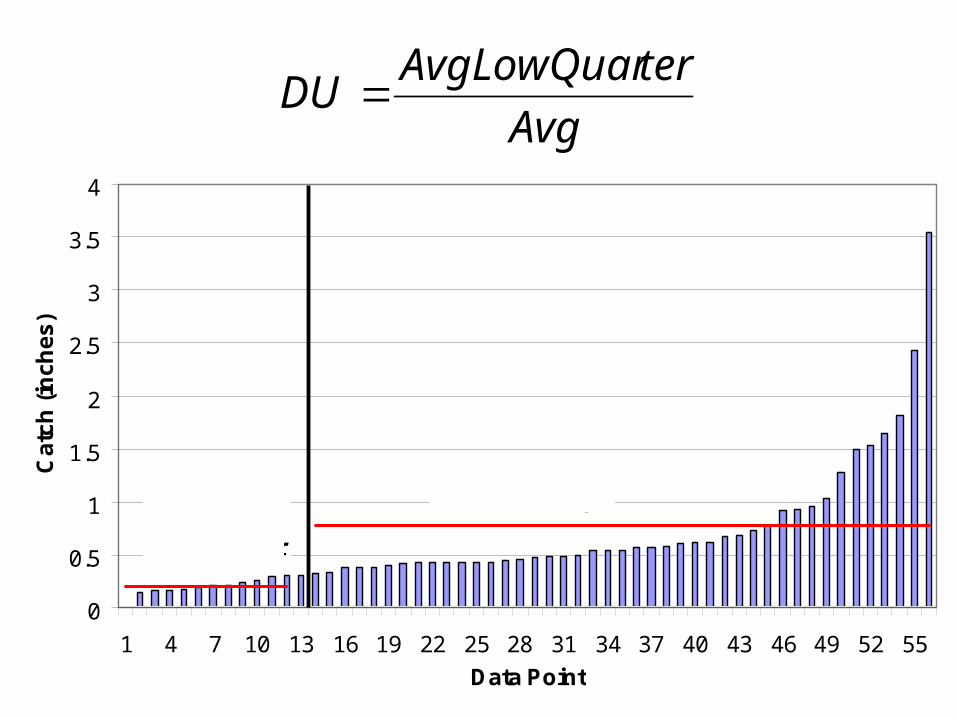
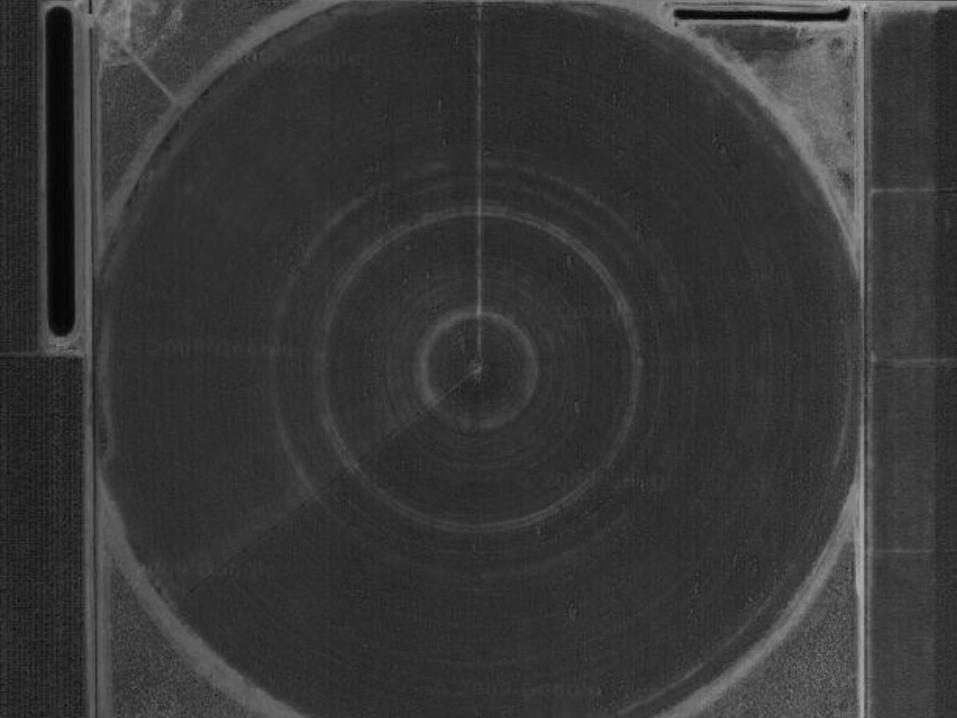
Calculation of DU
0
0.5
1
1.5
2
2.5
3
3.5
4
1 4 7 10 13 16 19 22 25 28 31 34 37 40 43 46 49 52 55
Data Point
Ca
tch
(in
ch
es
)
AverageLow Quarter
Overall Average
Avg
terAvgLowQuarDU
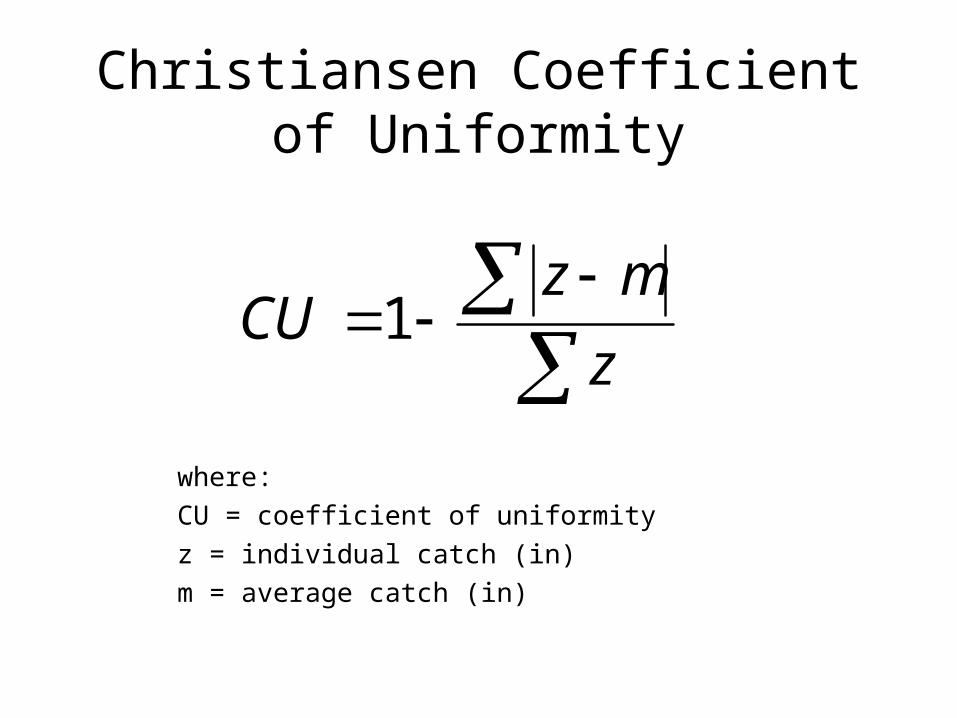
Christiansen Coefficient of Uniformity
where:
CU = coefficient of uniformity
z = individual catch (in)
m = average catch (in)
z
mzCU 1
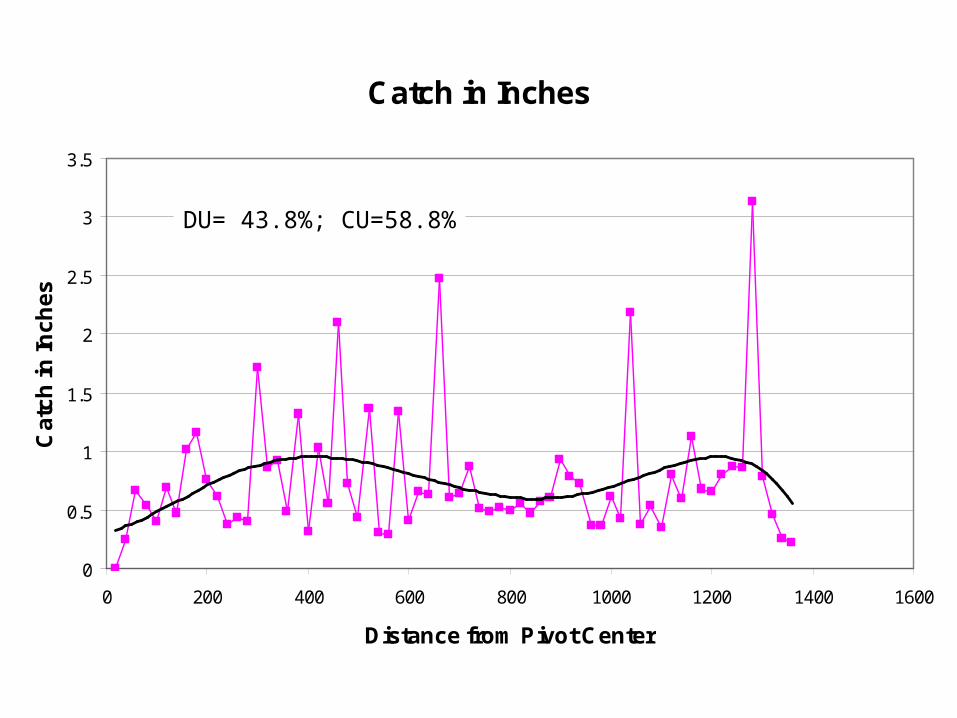
Catch in Inches
0
0.5
1
1.5
2
2.5
3
3.5
0 200 400 600 800 1000 1200 1400 1600
Distance from Pivot Center
Ca
tch
in In
ch
es
DU= 43.8%; CU=58.8%
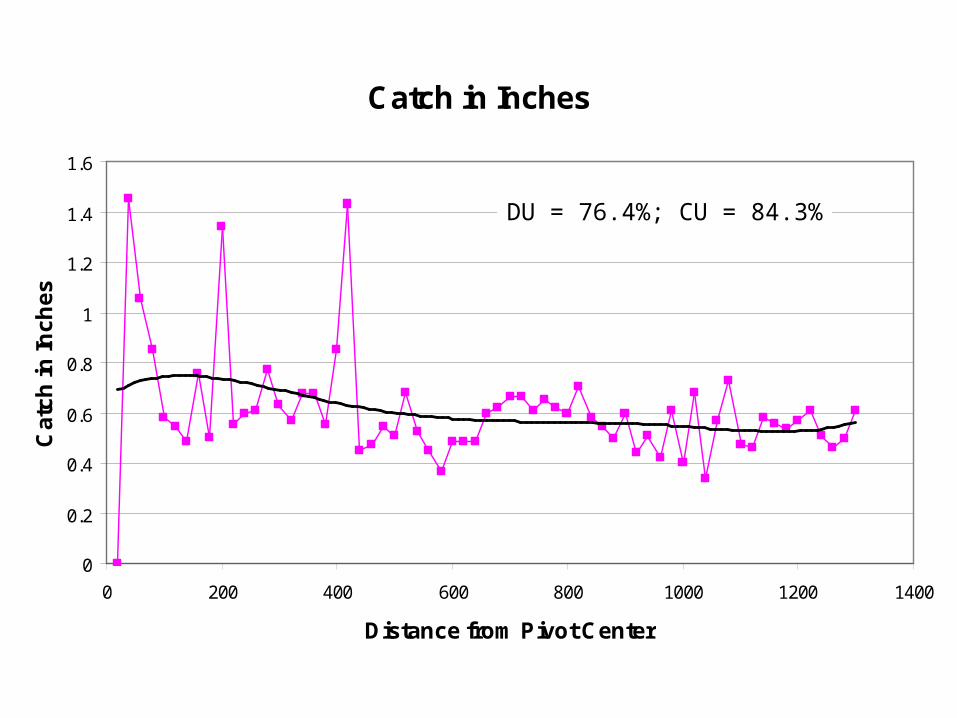
Catch in Inches
0
0.2
0.4
0.6
0.8
1
1.2
1.4
1.6
0 200 400 600 800 1000 1200 1400
Distance from Pivot Center
Ca
tch
in In
ch
es
DU = 76.4%; CU = 84.3%
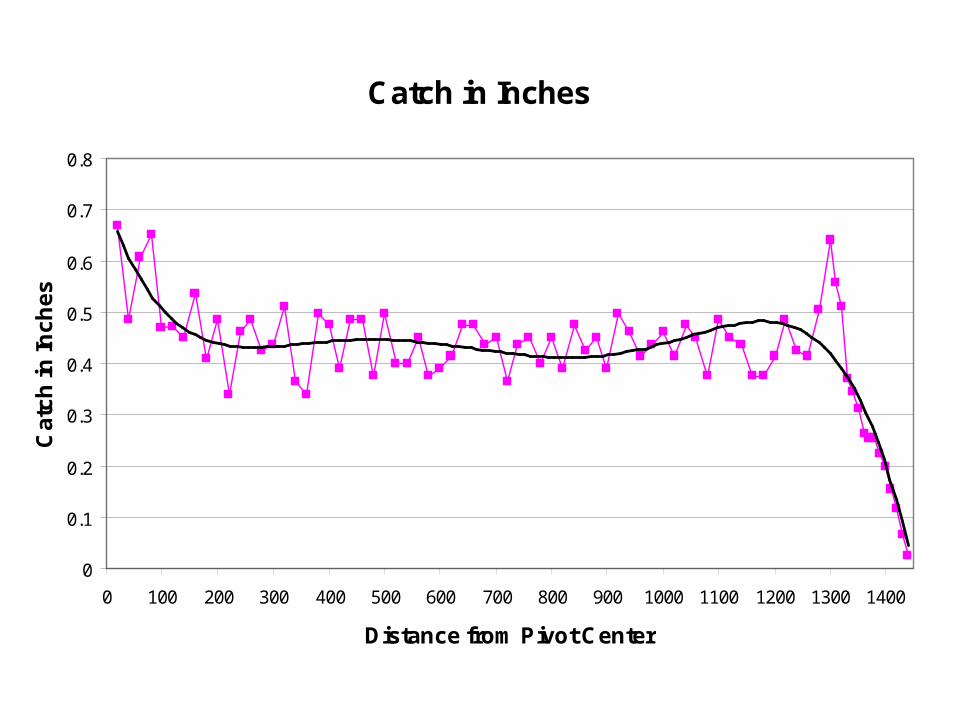
Catch in Inches
0
0.1
0.2
0.3
0.4
0.5
0.6
0.7
0.8
0 100 200 300 400 500 600 700 800 900 1000 1100 1200 1300 1400
Distance from Pivot Center
Ca
tch
in In
ch
es
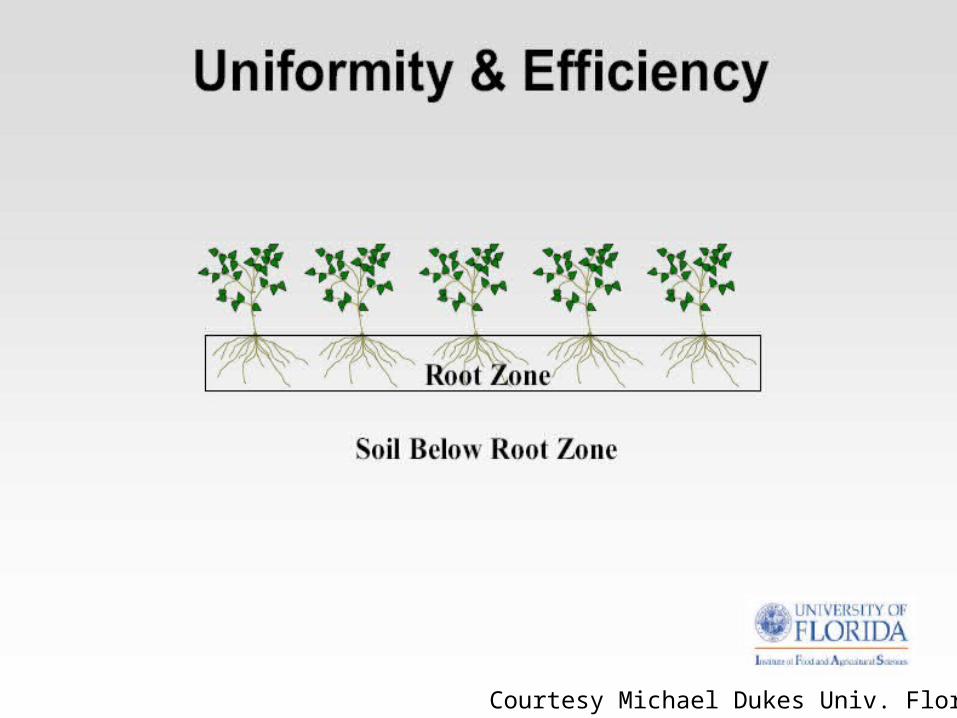
Uniformity
• Better yields
• Improved crop quality (more uniform)
• Less water used = $$ savings
• Less lost fertilizers
• Less mess
• Better for the environment
• Chemigate or fertigate with confidence
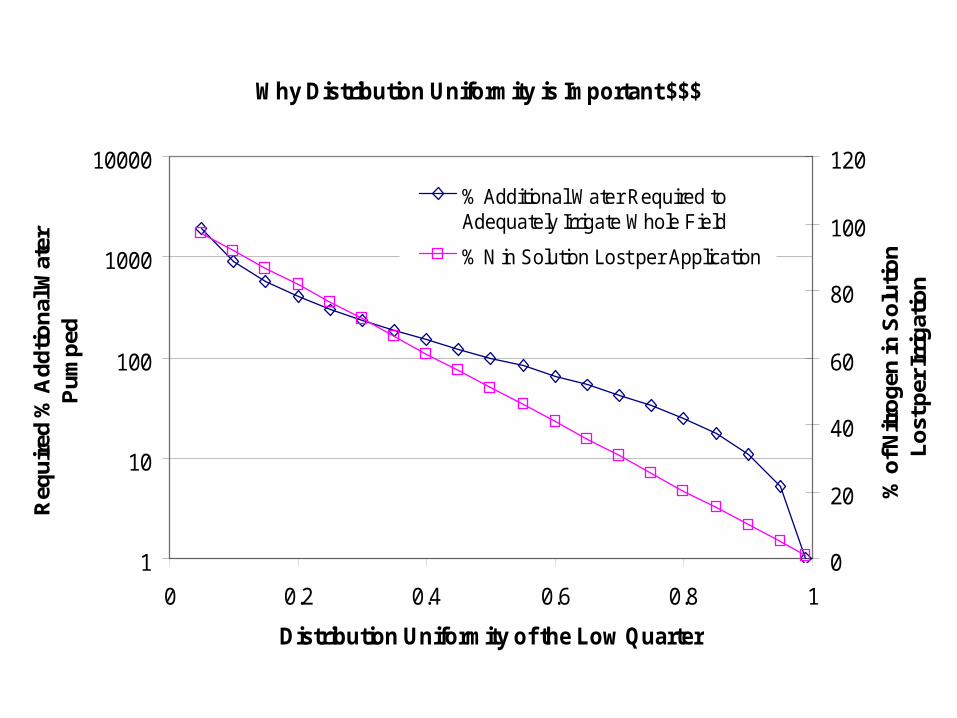
Why Distribution Uniformity is Important $$$
1
10
100
1000
10000
0 0.2 0.4 0.6 0.8 1
Distribution Uniformity of the Low Quarter
Req
uir
ed %
Ad
dtio
nal
Wat
er
Pu
mp
ed
0
20
40
60
80
100
120
% o
f Nitr
og
en in
So
lutio
n
Lo
st p
er Ir
rig
atio
n
% Additional Water Required toAdequately Irrigate Whole Field
% N in Solution Lost per Application
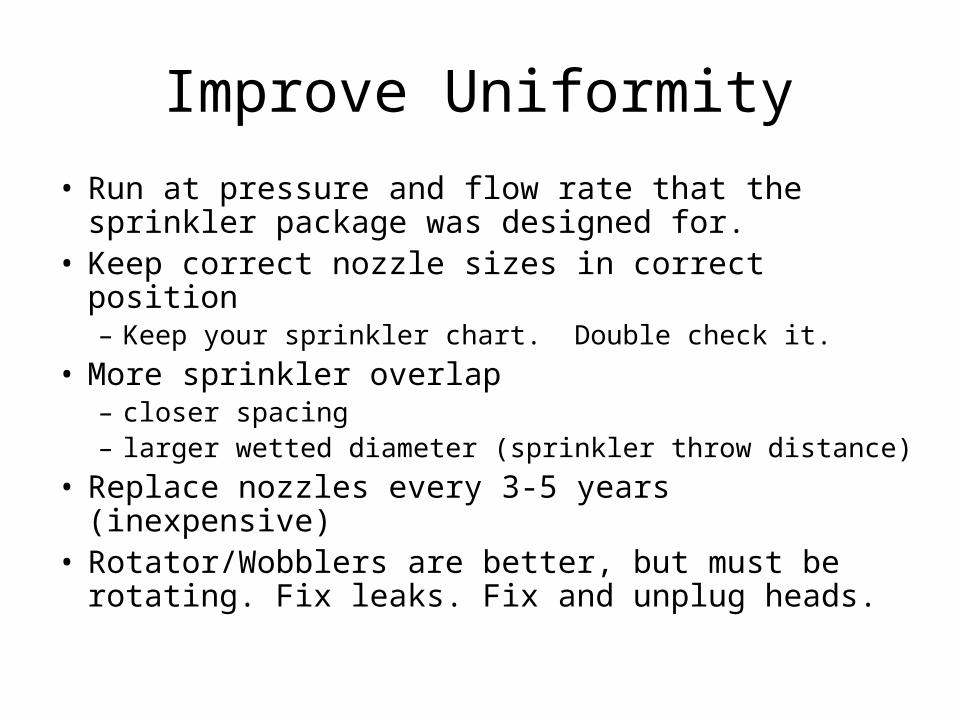
Improve Uniformity
• Run at pressure and flow rate that the sprinkler package was designed for.
• Keep correct nozzle sizes in correct position– Keep your sprinkler chart. Double check it.
• More sprinkler overlap– closer spacing – larger wetted diameter (sprinkler throw distance)
• Replace nozzles every 3-5 years (inexpensive)• Rotator/Wobblers are better, but must be rotating.
Fix leaks. Fix and unplug heads.
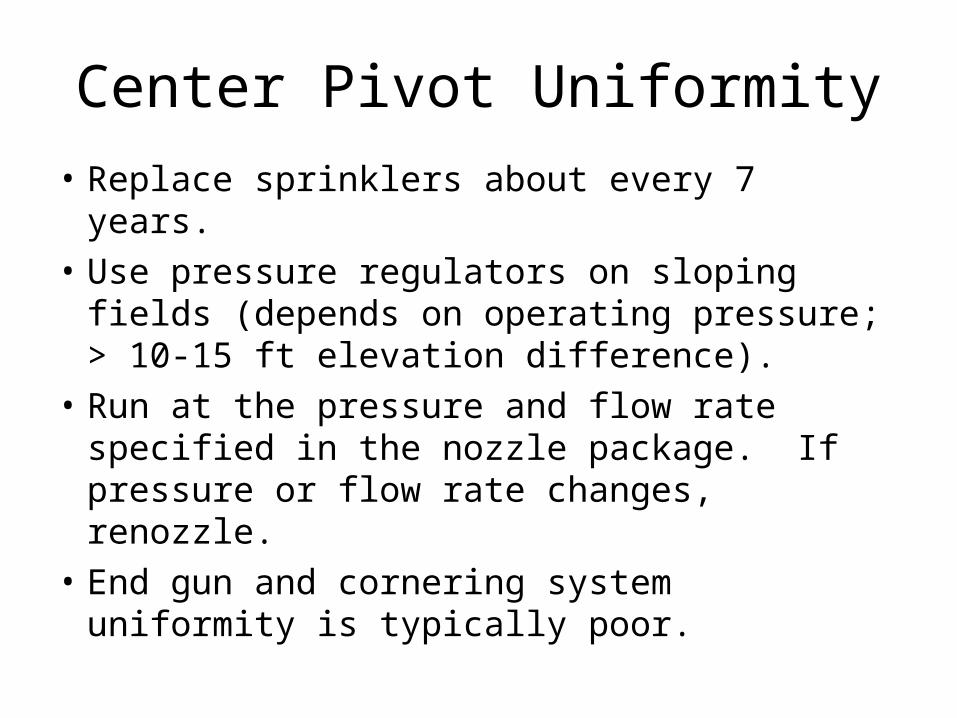
Center Pivot Uniformity
• Replace sprinklers about every 7 years.
• Use pressure regulators on sloping fields (depends on operating pressure; > 10-15 ft elevation difference).
• Run at the pressure and flow rate specified in the nozzle package. If pressure or flow rate changes, renozzle.
• End gun and cornering system uniformity is typically poor.
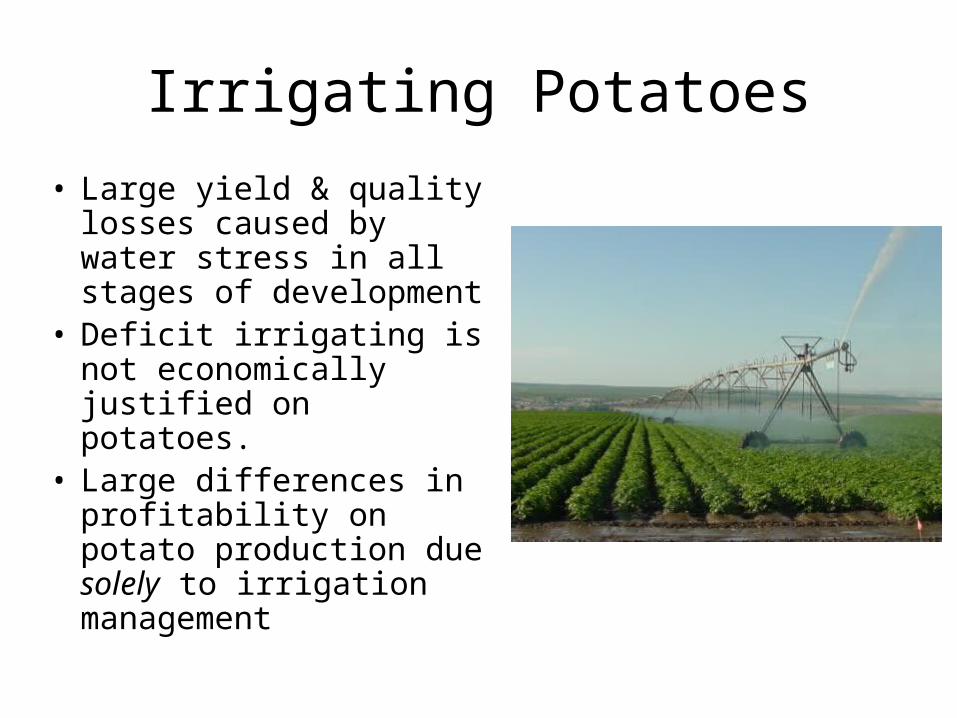
Irrigating Potatoes
• Large yield & quality losses caused by water stress in all stages of development
• Deficit irrigating is not economically justified on potatoes.
• Large differences in profitability on potato production due solely to irrigation management
Irrigation Efficiency
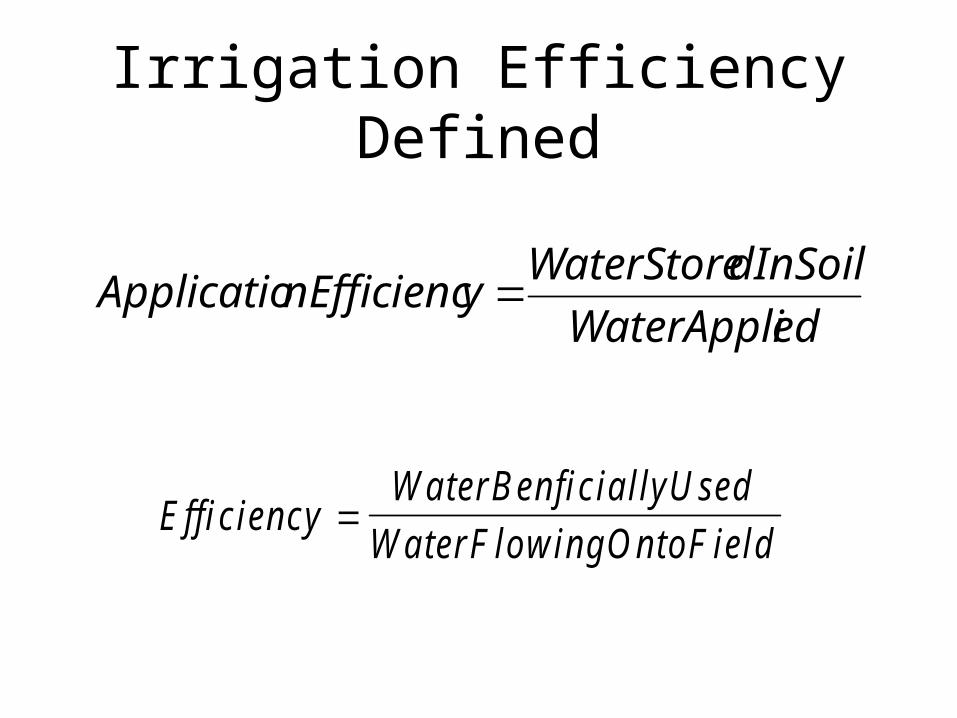
Irrigation Efficiency Defined
E ffic iencyW aterBen fic ia llyU sed
W aterF low ingO ntoF ield
edWaterAppli
dInSoilWaterStoreynEfficiencApplicatio
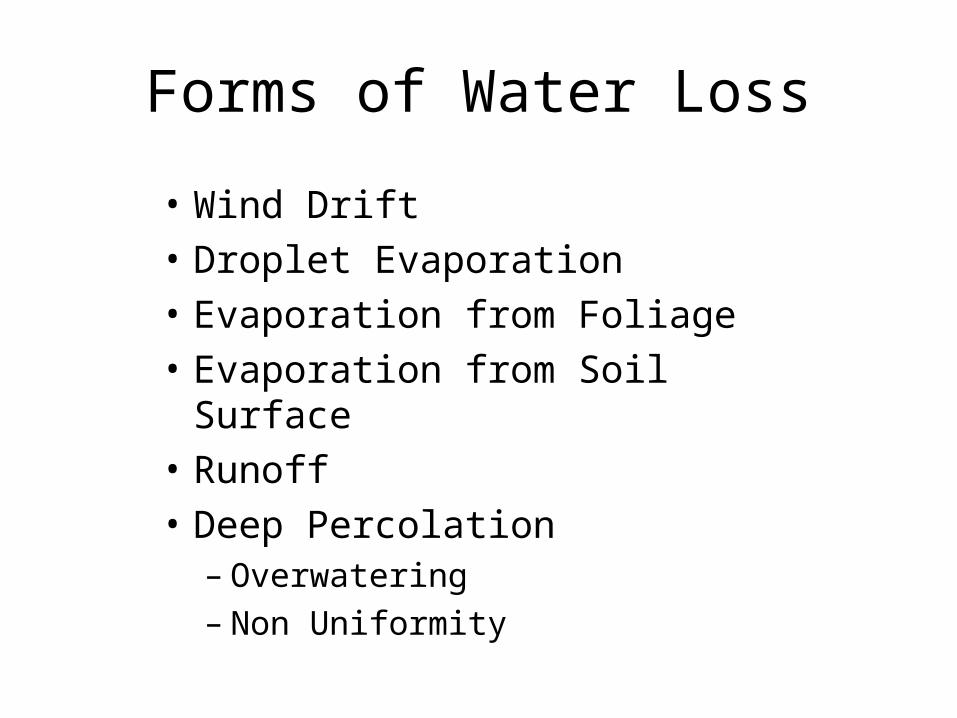
Forms of Water Loss
• Wind Drift
• Droplet Evaporation
• Evaporation from Foliage
• Evaporation from Soil Surface
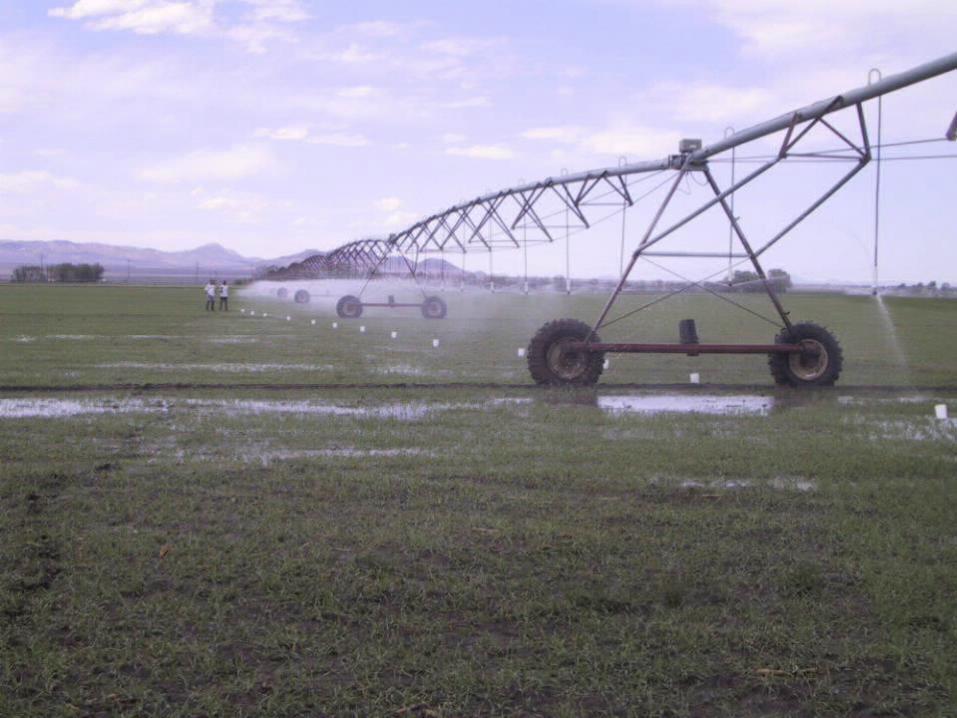
• Runoff
• Deep Percolation– Overwatering– Non Uniformity
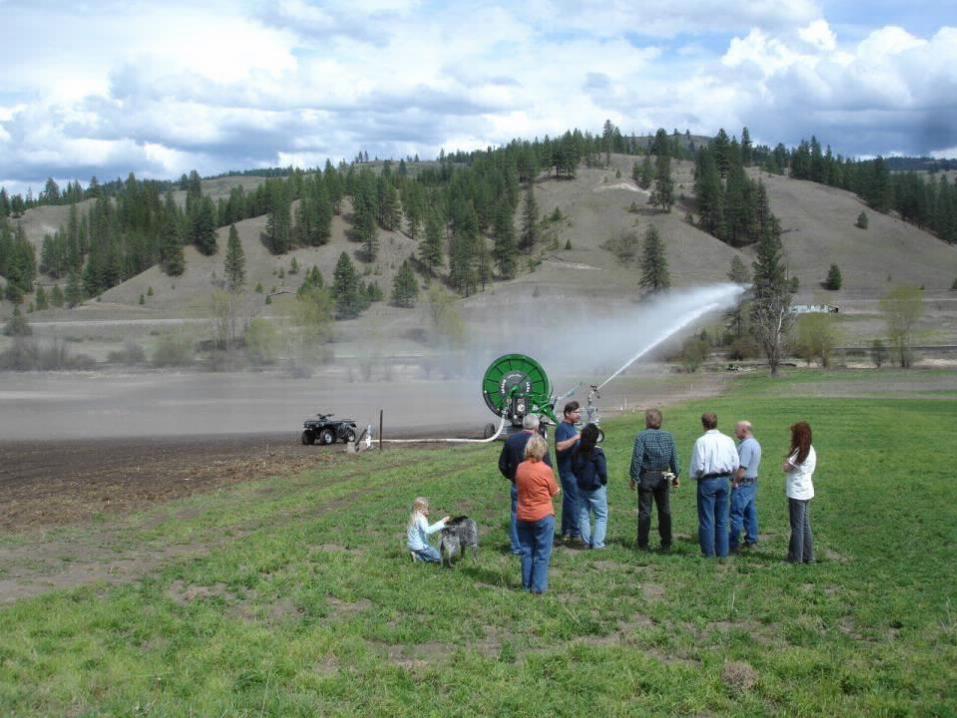
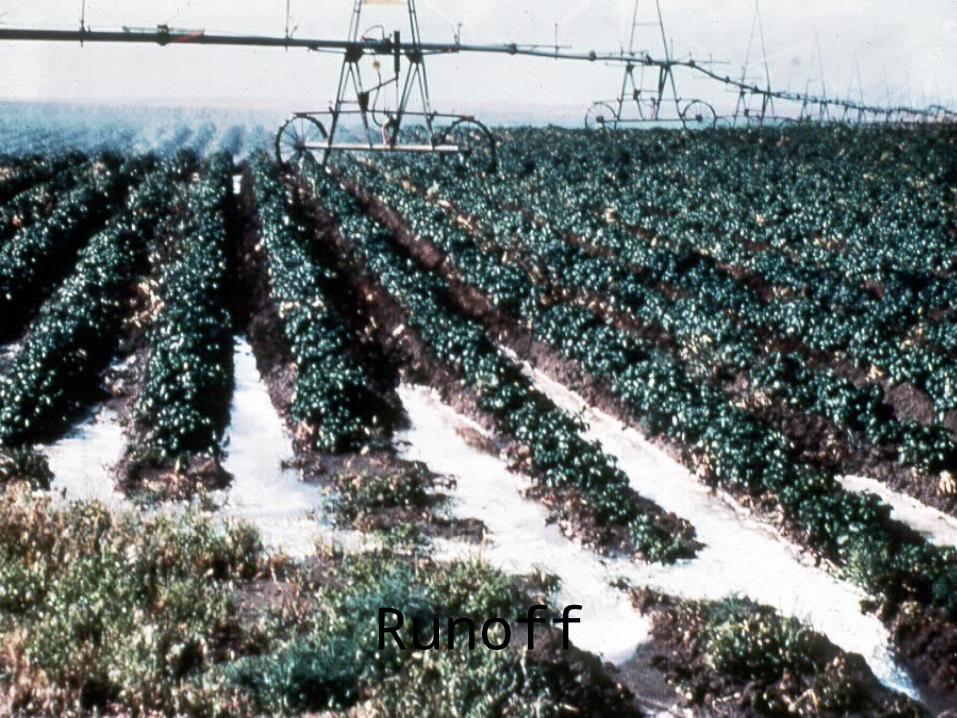
Runoff
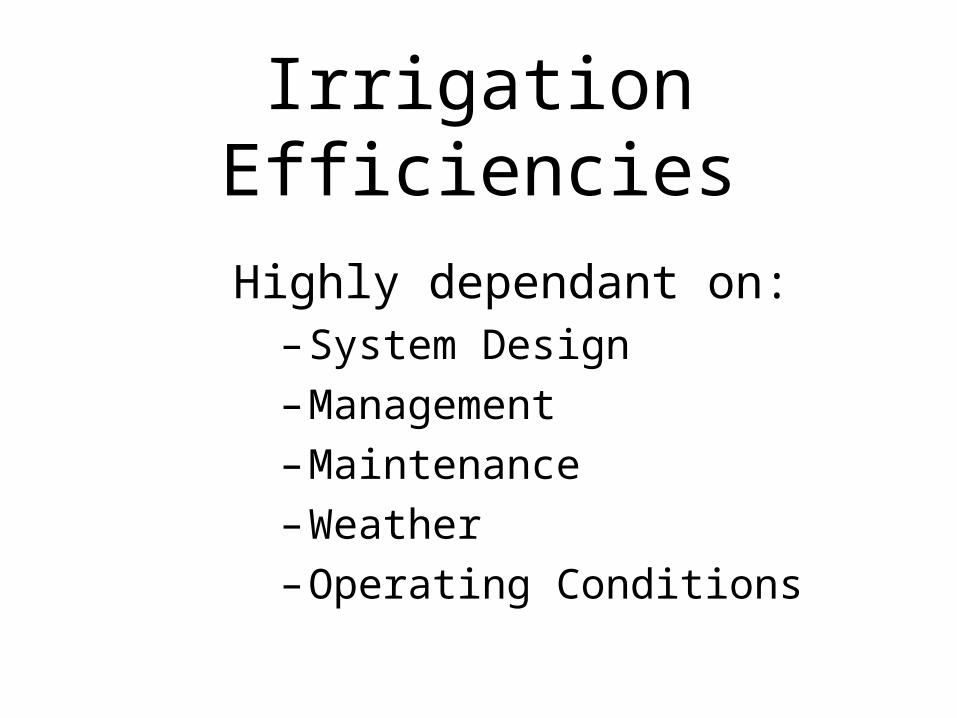
Irrigation Efficiencies
Highly dependant on:– System Design
– Management
– Maintenance
– Weather
– Operating Conditions
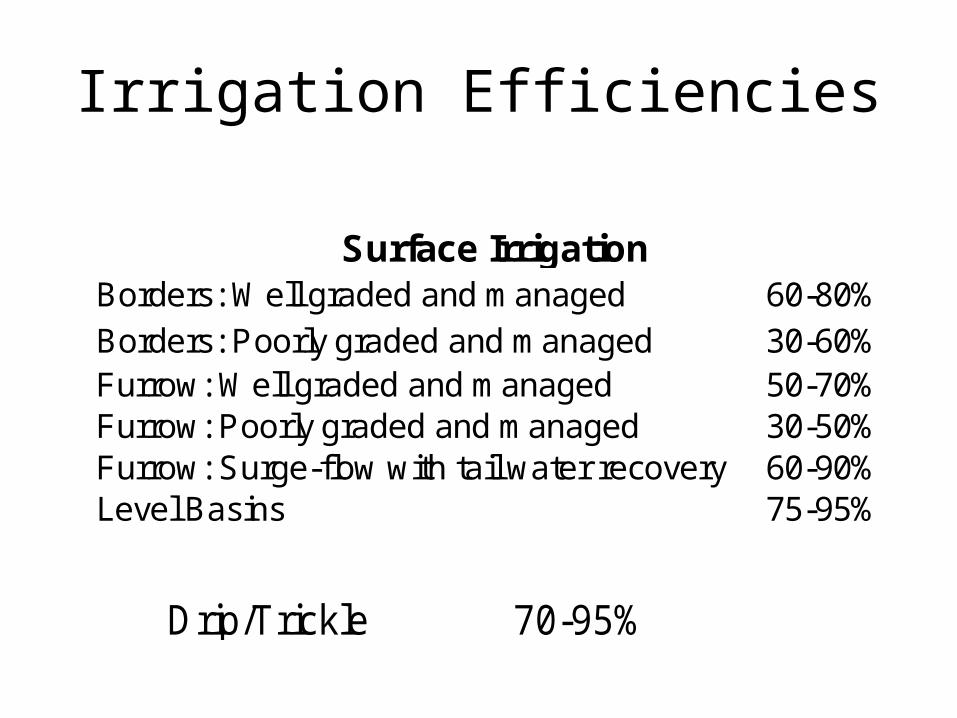
Irrigation Efficiencies
Borders: Well graded and managed 60-80%Borders: Poorly graded and managed 30-60%Furrow: Well graded and managed 50-70%Furrow: Poorly graded and managed 30-50%Furrow: Surge-flow with tail water recovery 60-90%Level Basins 75-95%
Surface Irrigation
Drip/Trickle 70-95%
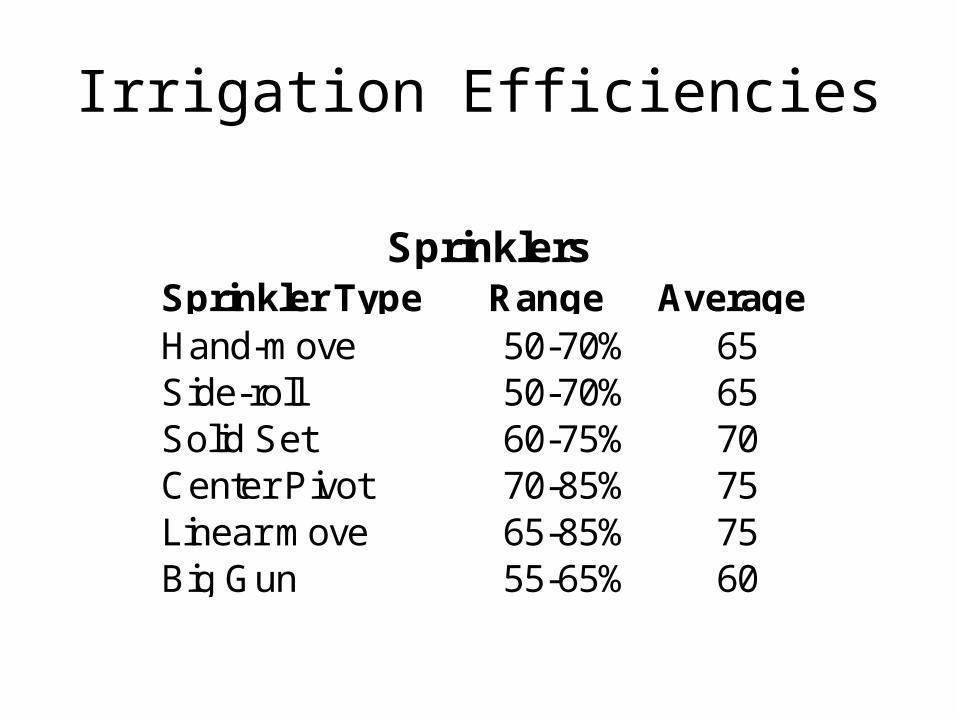
Irrigation Efficiencies
Sprinkler Type Range AverageHand-move 50-70% 65Side-roll 50-70% 65Solid Set 60-75% 70Center Pivot 70-85% 75Linear move 65-85% 75Big Gun 55-65% 60
Sprinklers
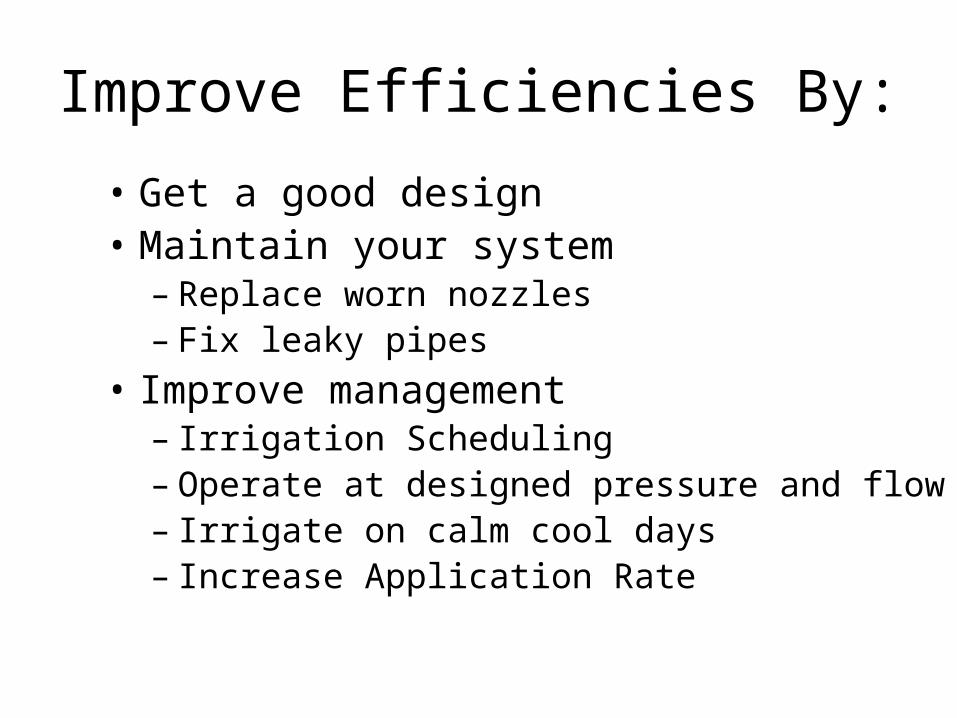
Improve Efficiencies By:
• Get a good design• Maintain your system
– Replace worn nozzles– Fix leaky pipes
• Improve management– Irrigation Scheduling– Operate at designed pressure and flow– Irrigate on calm cool days– Increase Application Rate
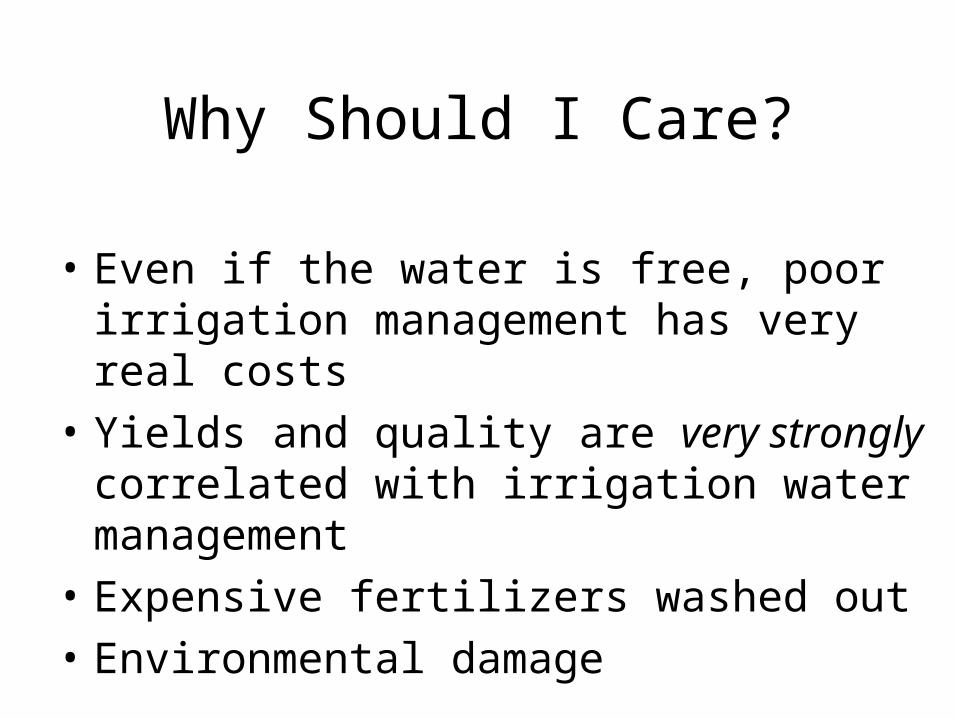
Why Should I Care?
• Even if the water is free, poor irrigation management has very real costs
• Yields and quality are very strongly correlated with irrigation water management
• Expensive fertilizers washed out
• Environmental damage
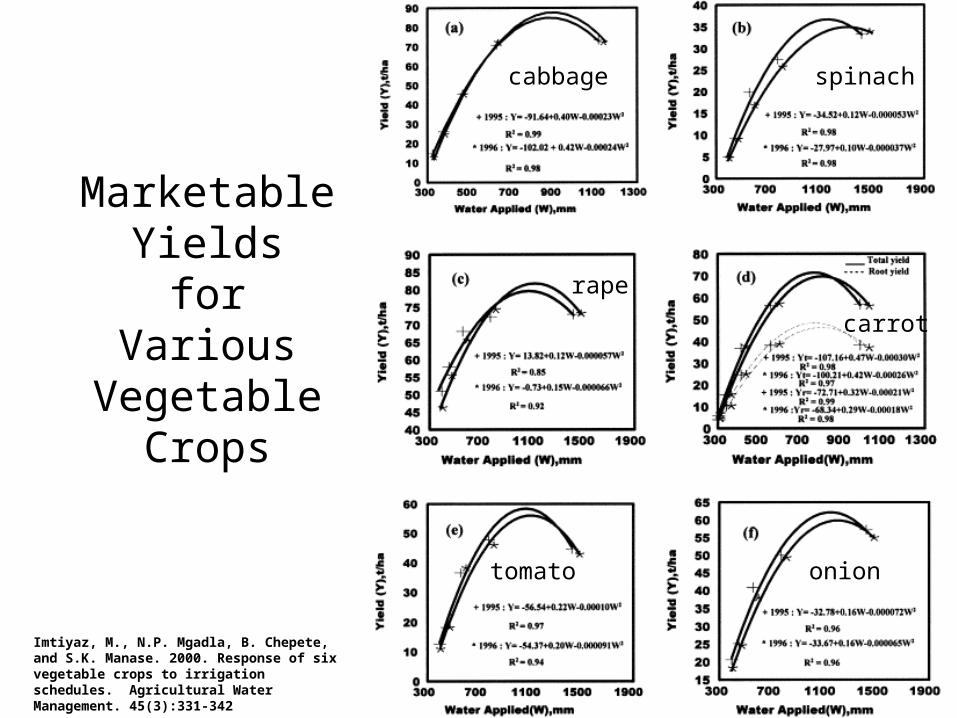
Marketable Yields
forVarious
VegetableCrops
Imtiyaz, M., N.P. Mgadla, B. Chepete, and S.K. Manase. 2000. Response of six vegetable crops to irrigation schedules. Agricultural Water Management. 45(3):331-342
cabbage spinach
rape
carrot
tomato onion
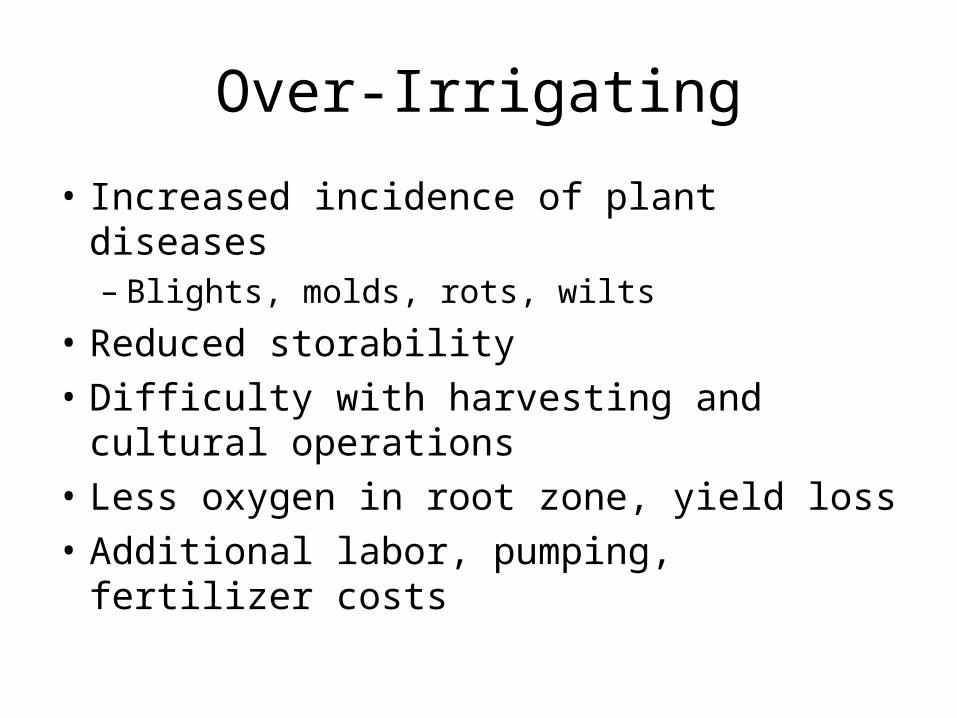
Over-Irrigating
• Increased incidence of plant diseases– Blights, molds, rots, wilts
• Reduced storability
• Difficulty with harvesting and cultural operations
• Less oxygen in root zone, yield loss
• Additional labor, pumping, fertilizer costs
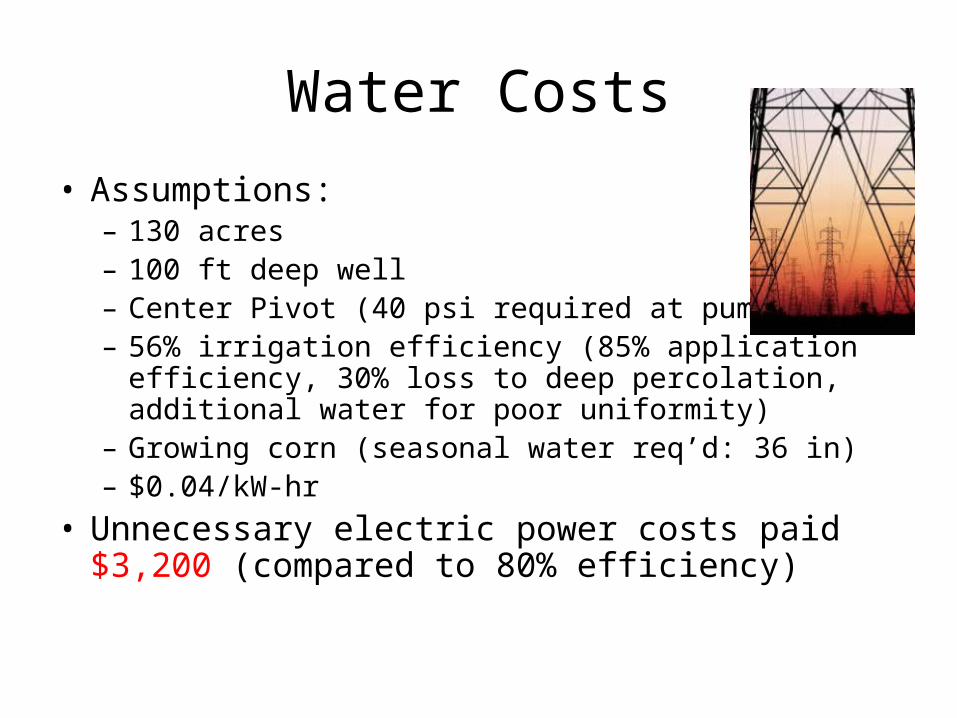
Water Costs
• Assumptions: – 130 acres– 100 ft deep well– Center Pivot (40 psi required at pump)– 56% irrigation efficiency (85% application efficiency,
30% loss to deep percolation, additional water for poor uniformity)
– Growing corn (seasonal water req’d: 36 in)– $0.04/kW-hr
• Unnecessary electric power costs paid $3,200 (compared to 80% efficiency)
Pumping Costs
• $1.29/acre-in pumping costs• At 80% irrigation efficiency and 85% uniformity
$1.90/acre-in of plant water requirements• About $250 to apply 1 inch to a ¼ mile pivot.
Fertilizer Losses
• Assume:– silt loam soil (2 in/ft), – growing potatoes, 1.5 ft root zone– at field capacity– even concentration of fertilizer throughout profile and
leached water
• Over-irrigating 1 inch = about 14% of soluble fertilizers percolated out of the root zone.
• Results in lost $, lower yield and potato quality
Benefits
• Most things that decrease your irrigation costs also benefit the environment– More flow for fish, less dirty water returning
to rivers– Less consumption of energy– Less fertilizer, pesticides in streams and
groundwater
– More carbon sequestration (takes CO2 out of the air)
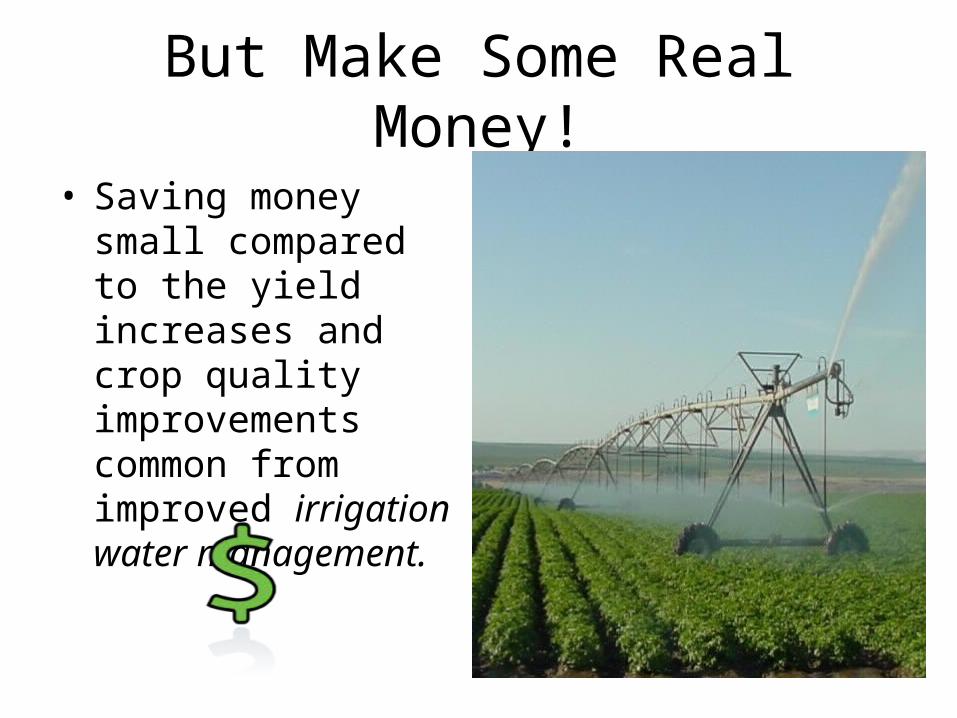
But Make Some Real Money!
• Saving money small compared to the yield increases and crop quality improvements common from improved irrigation water management.
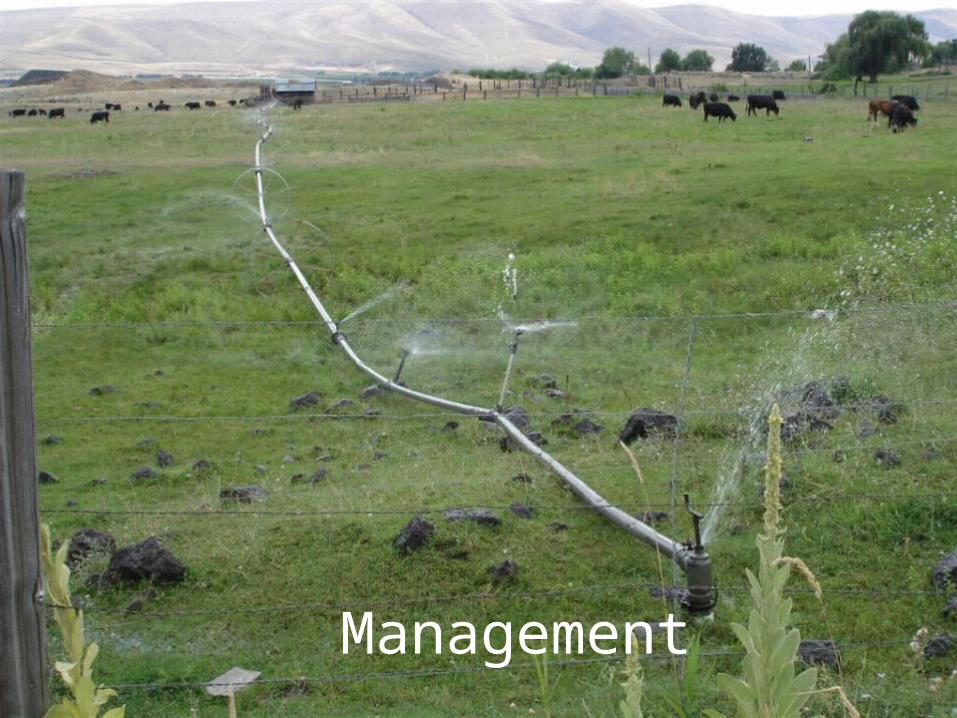
Management
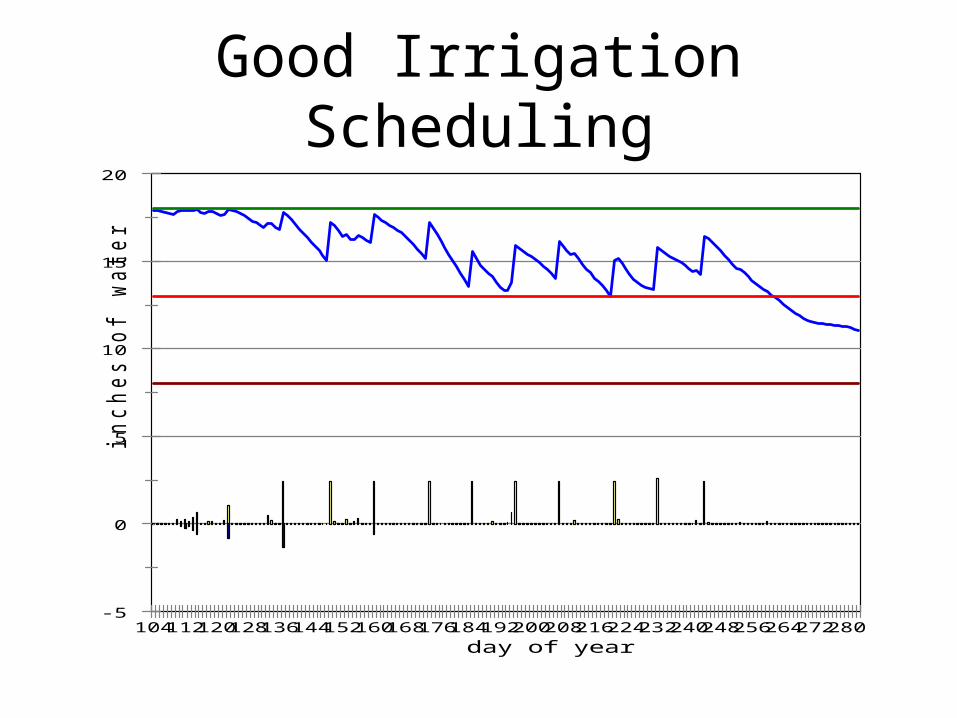
Good Irrigation Scheduling
-5
0
5
10
15
20
inches o
f w
ate
r
104112120128136144152160168176184192200208216224232240248256264272280
day of year
Neutron Probe Reading
Irrigation + Rain
Deep Percolation
Field Capacity
Wilting Point
MAD
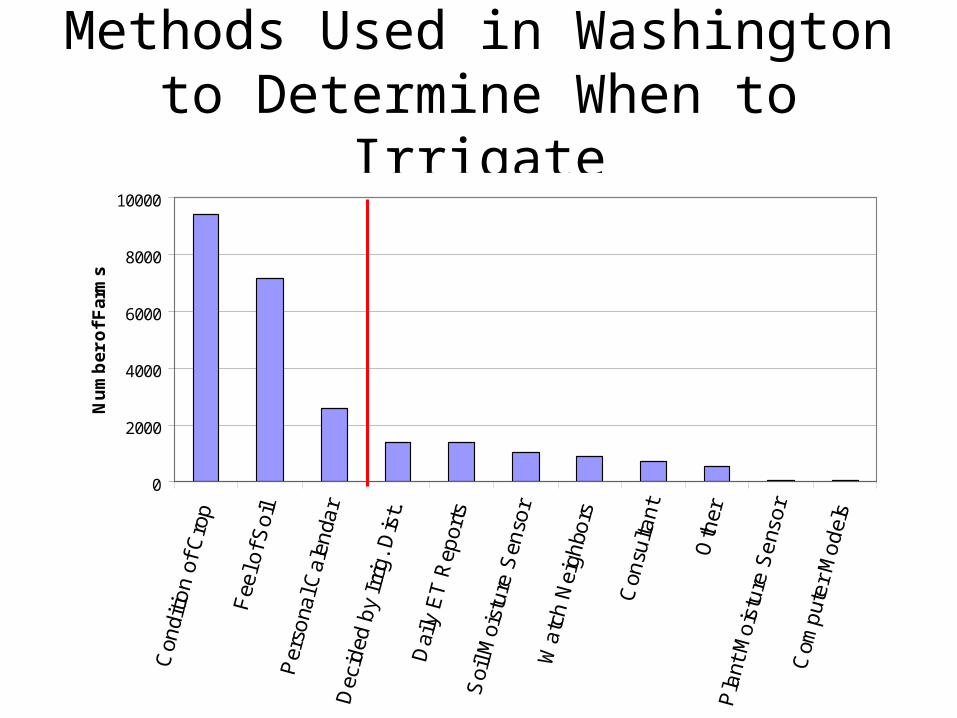
Methods Used in Washington to Determine When to Irrigate
0
2000
4000
6000
8000
10000
Nu
mb
er
of
Fa
rms
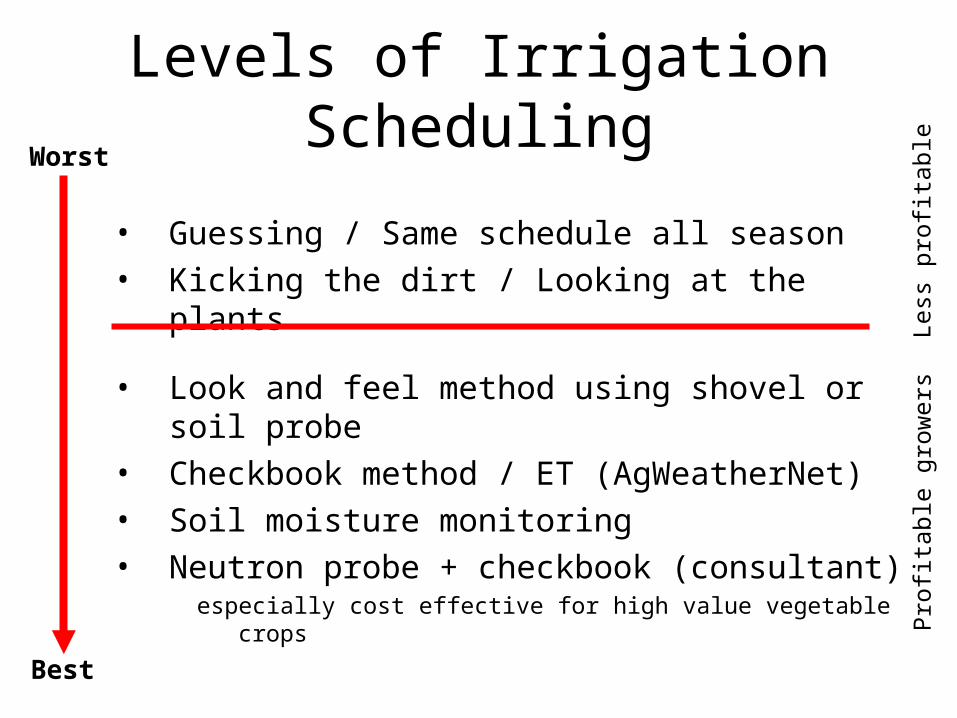
Levels of Irrigation Scheduling
• Guessing / Same schedule all season• Kicking the dirt / Looking at the plants
• Look and feel method using shovel or soil probe
• Checkbook method / ET (AgWeatherNet)• Soil moisture monitoring• Neutron probe + checkbook (consultant)
especially cost effective for high value vegetable crops
Best
Worst
Pro
fitab
le g
row
ers
Less
pro
fitab
le
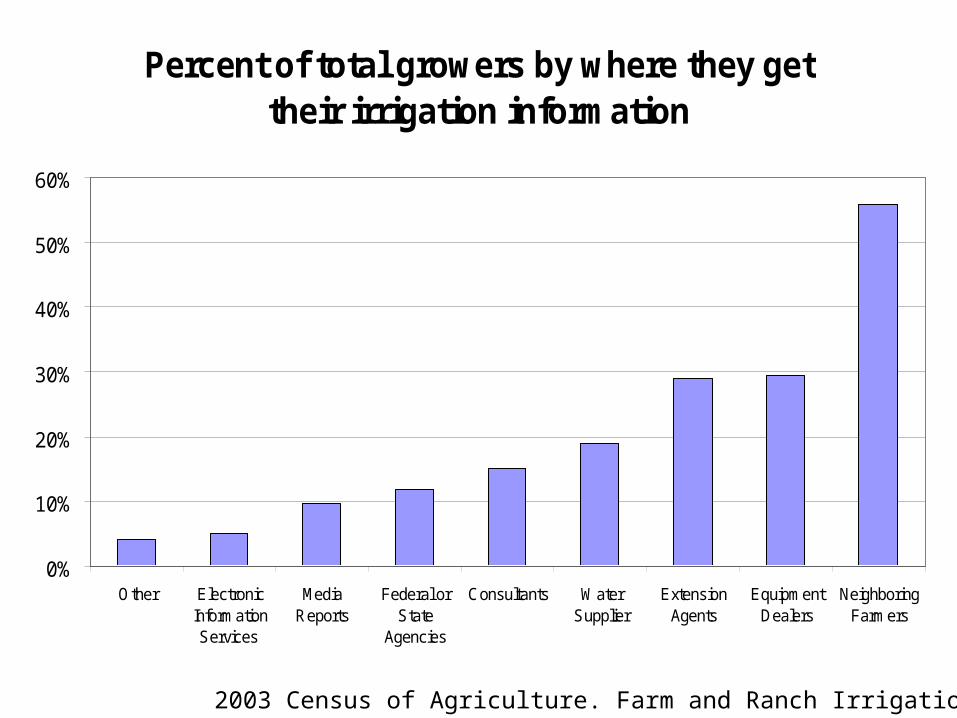
Percent of total growers by where they get their irrigation information
0%
10%
20%
30%
40%
50%
60%
Other ElectronicInformationServices
MediaReports
Federal orState
Agencies
Consultants WaterSupplier
ExtensionAgents
EquipmentDealers
NeighboringFarmers
2003 Census of Agriculture. Farm and Ranch Irrigation Survey
Questions?
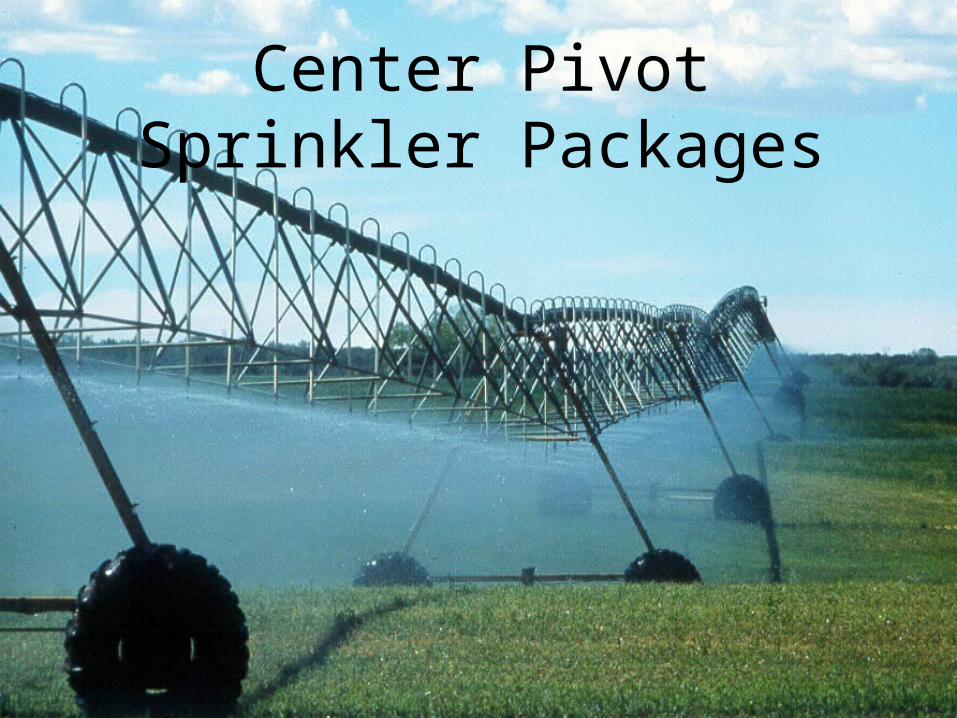
Center PivotSprinkler Packages
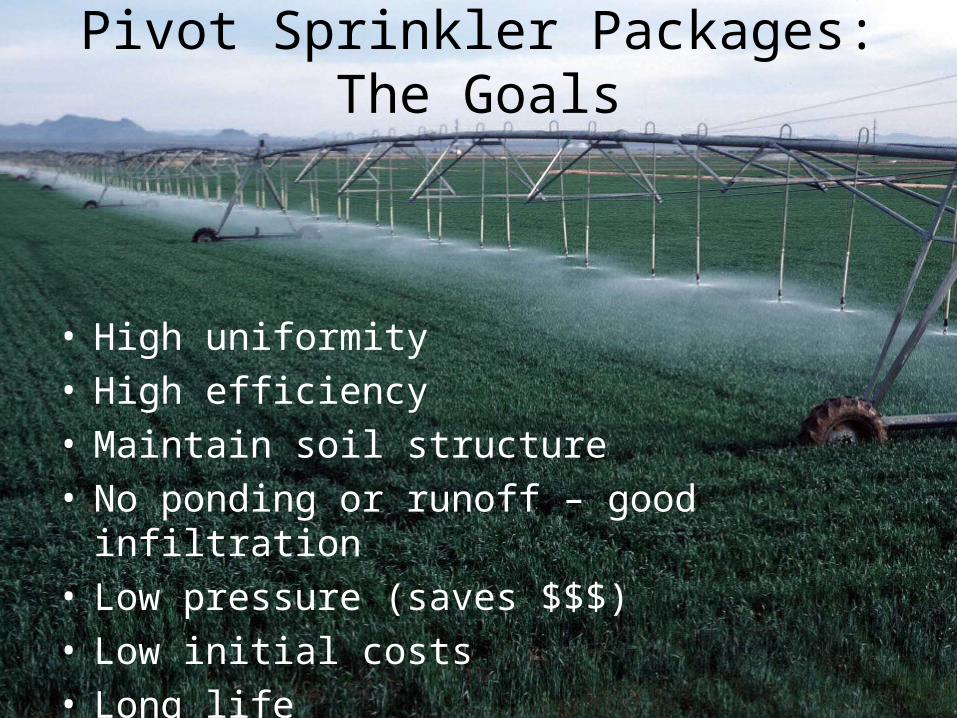
Pivot Sprinkler Packages:The Goals
• High uniformity• High efficiency• Maintain soil structure• No ponding or runoff – good infiltration• Low pressure (saves $$$)• Low initial costs• Long life
Sprinkler PackagesDroplet Size Distribution
• Large drops compared to small:– Higher efficiency – less surface area– Less wind distortion
• Large drops break up soil surface structure (“don’t treat soil like dirt”)– Especially in heavier textured soils (silts and
clays)
• Small droplets better for bare soil• Large droplets better after full cover, hay• Higher pressure = smaller droplet size
What sprinkler package should I specify? (gpm/acre)
Simple Unit Conversion
1 in/day = 18.86 gpm/acre(use 19 to get close)
• Multiply maximum water use requirement in inches per day by 18.86 gpm/acre.
• Divide gpm/acre by 18.86 to get in/day.
Examples:0.2 in/day = 3.8 gpm/acre7.5 gpm/acre = 0.4 in/day
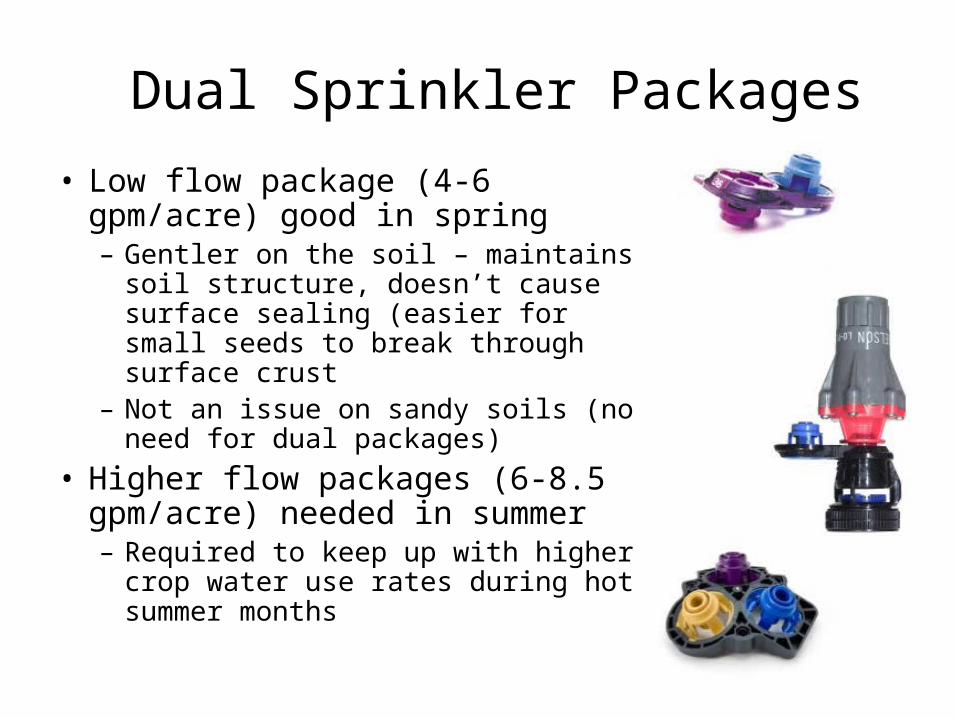
• Low flow package (4-6 gpm/acre) good in spring– Gentler on the soil – maintains soil
structure, doesn’t cause surface sealing (easier for small seeds to break through surface crust
– Not an issue on sandy soils (no need for dual packages)
• Higher flow packages (6-8.5 gpm/acre) needed in summer– Required to keep up with higher crop
water use rates during hot summer months
Dual Sprinkler Packages
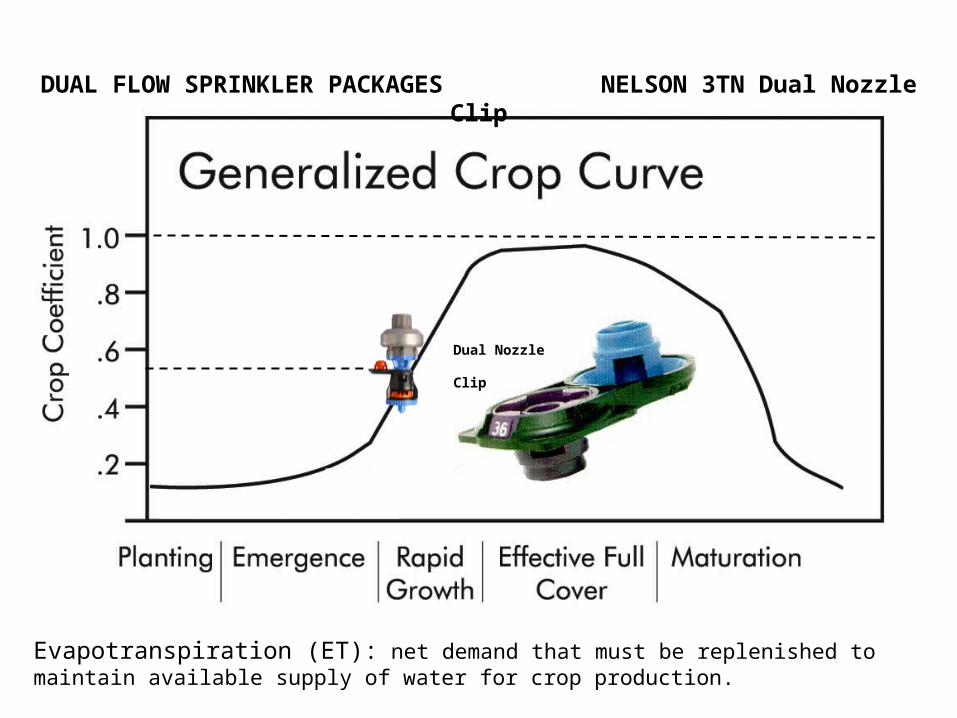
Evapotranspiration (ET): net demand that must be replenished to maintain available supply of water for crop production.
Dual Nozzle
Clip
DUAL FLOW SPRINKLER PACKAGES NELSON 3TN Dual Nozzle Clip
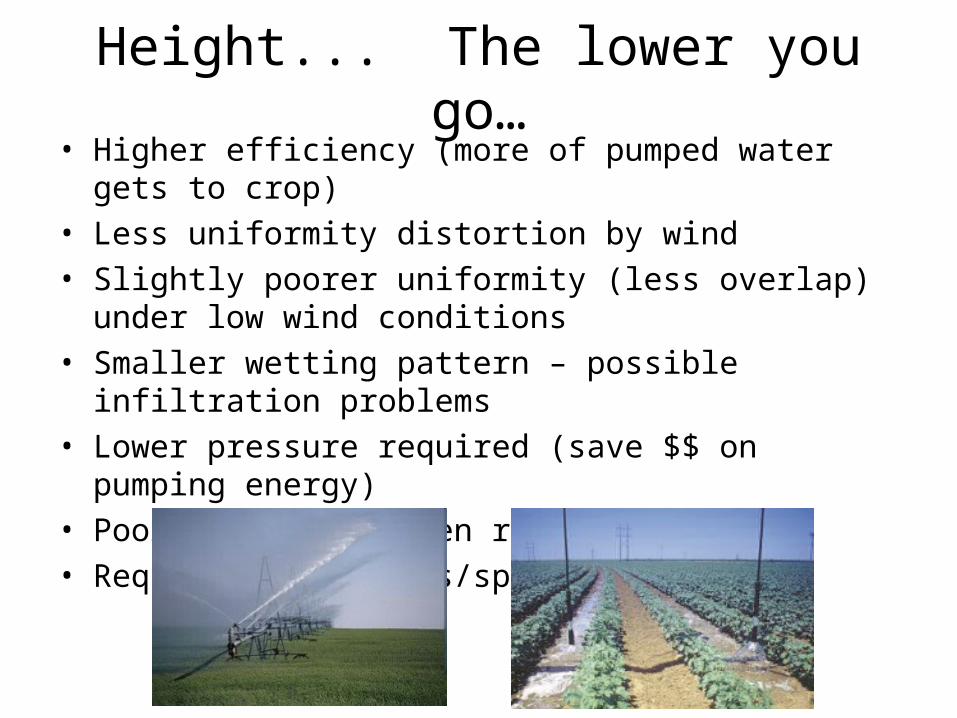
Height... The lower you go…• Higher efficiency (more of pumped water gets to crop)• Less uniformity distortion by wind• Slightly poorer uniformity (less overlap) under low wind
conditions• Smaller wetting pattern – possible infiltration problems• Lower pressure required (save $$ on pumping energy)• Poor uniformity when rotated into corn• Requires more drops/span
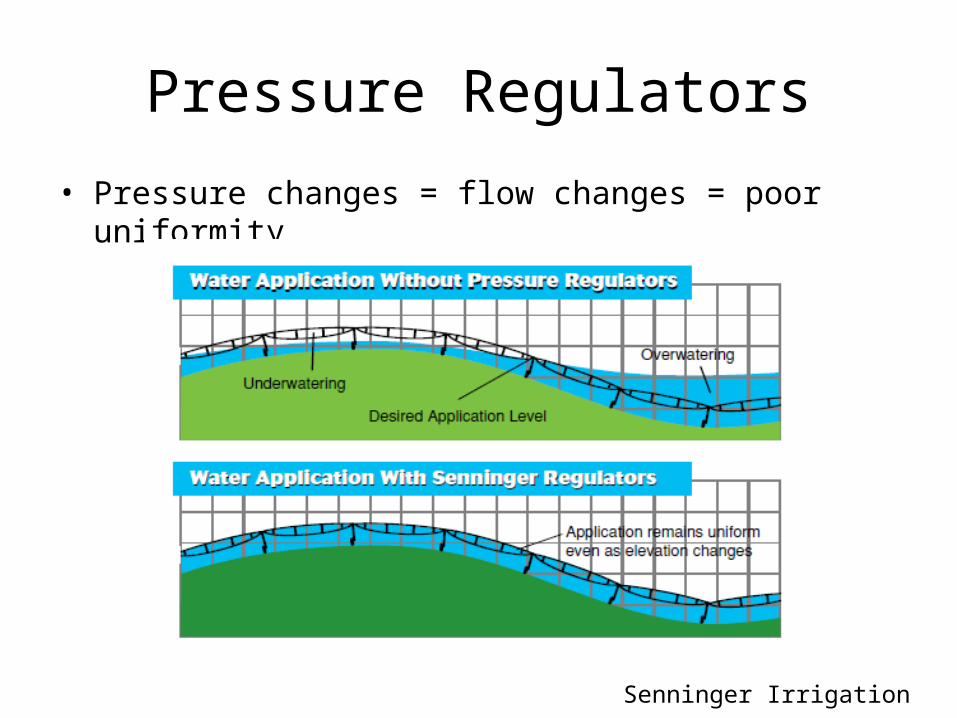
Pressure Regulators
• Pressure changes = flow changes = poor uniformity
Senninger Irrigation
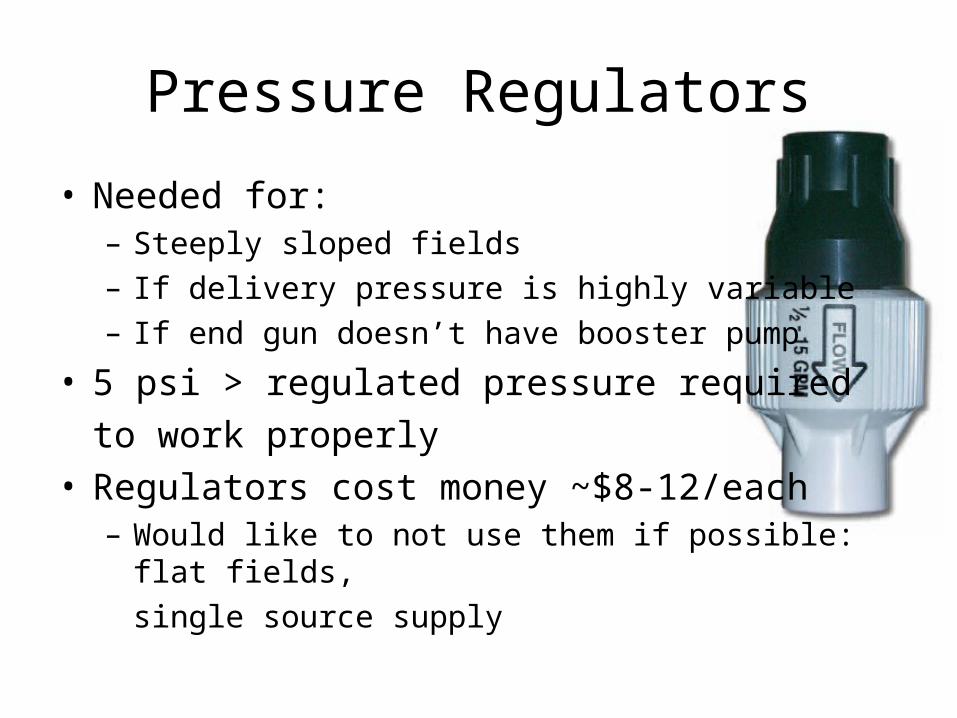
Pressure Regulators
• Needed for:– Steeply sloped fields – If delivery pressure is highly variable– If end gun doesn’t have booster pump
• 5 psi > regulated pressure required
to work properly • Regulators cost money ~$8-12/each
– Would like to not use them if possible: flat fields,
single source supply
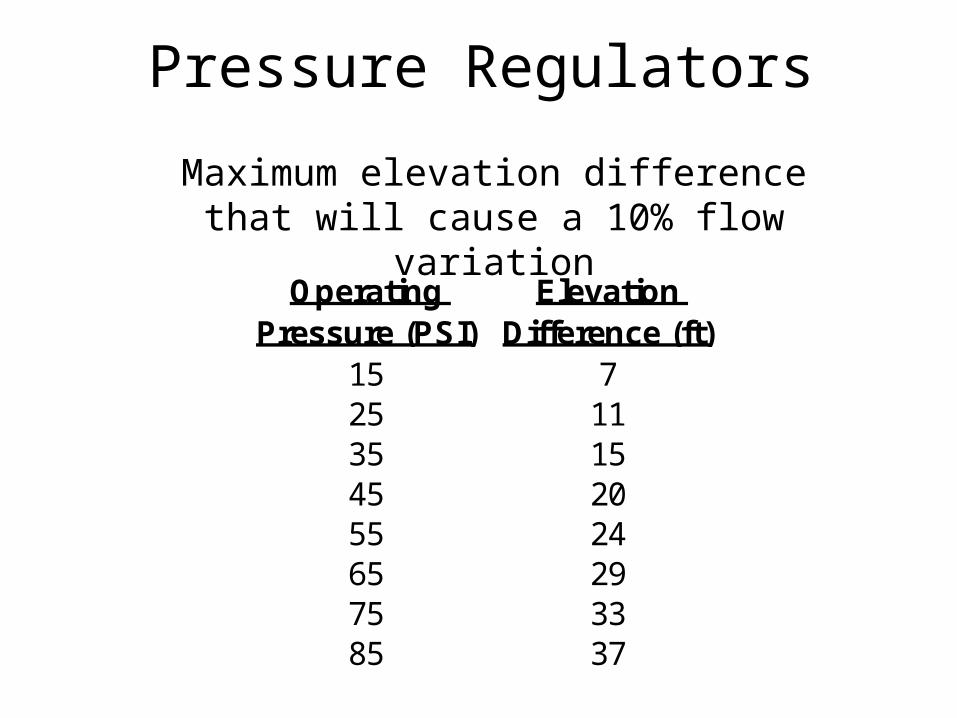
Pressure Regulators
Operating Pressure (PSI)
Elevation Difference (ft)
15 725 1135 1545 2055 2465 2975 3385 37
Maximum elevation difference that will cause a 10% flow variation
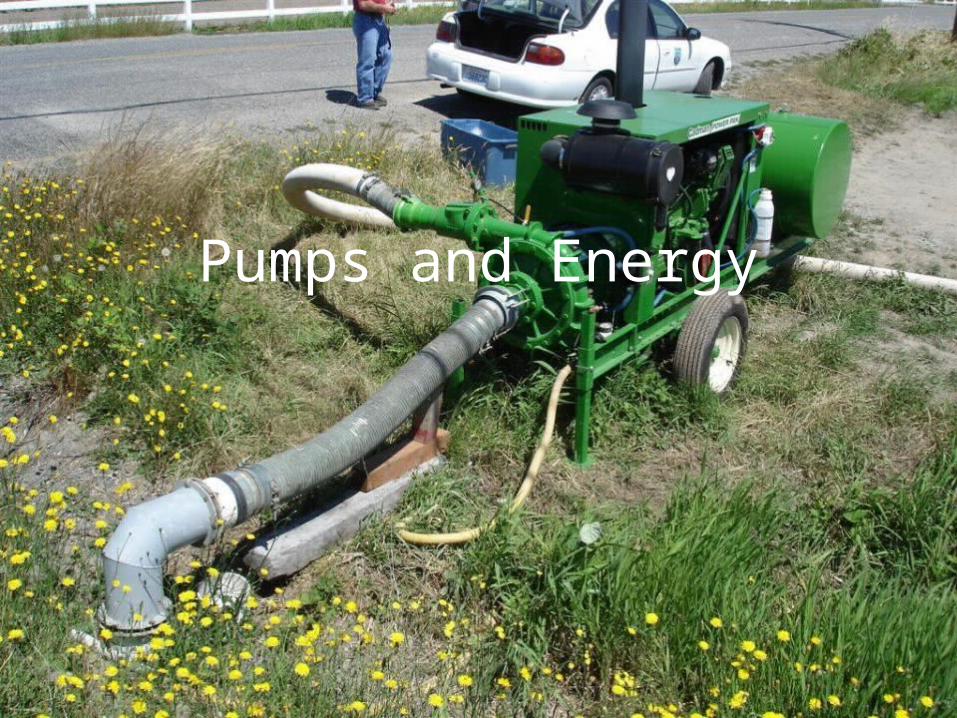
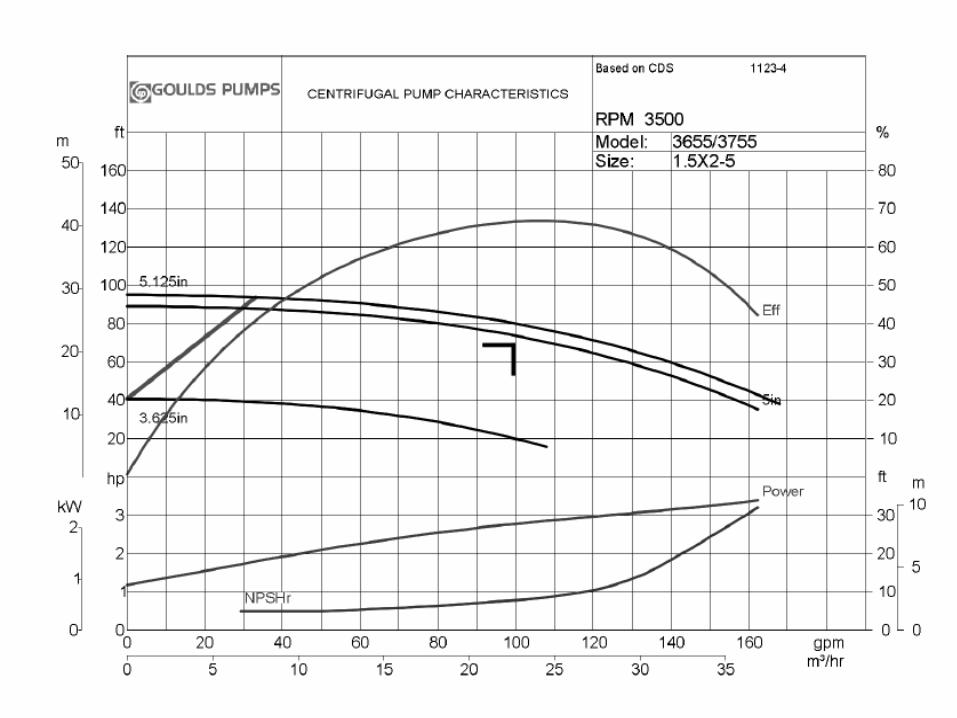
Pumps and Energy
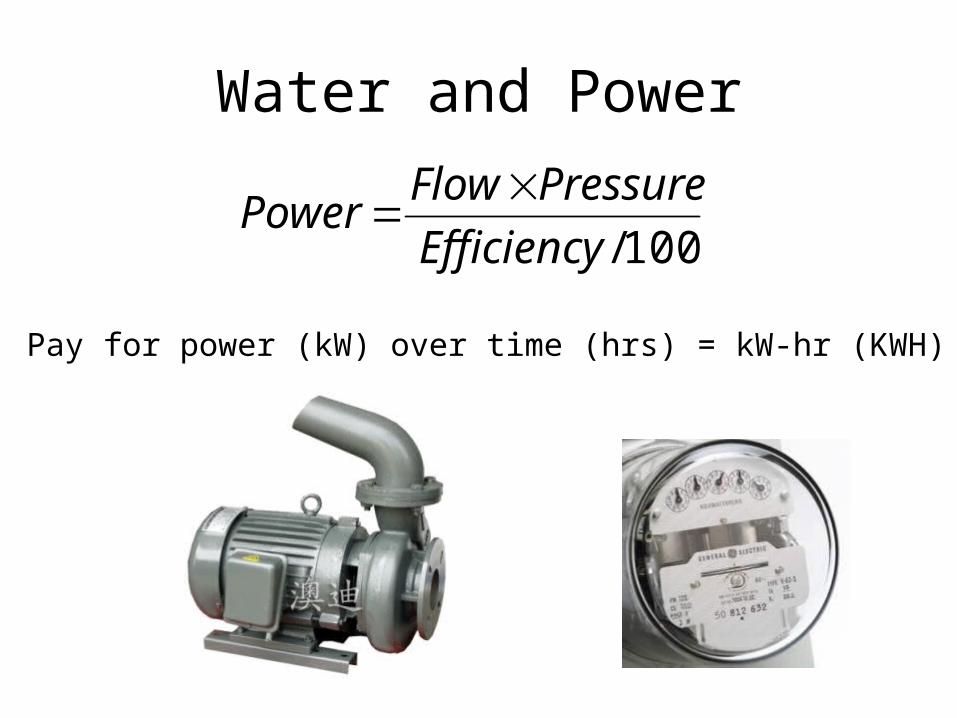
Water and Power
100/Efficiency
PressureFlowPower
Pay for power (kW) over time (hrs) = kW-hr (KWH)
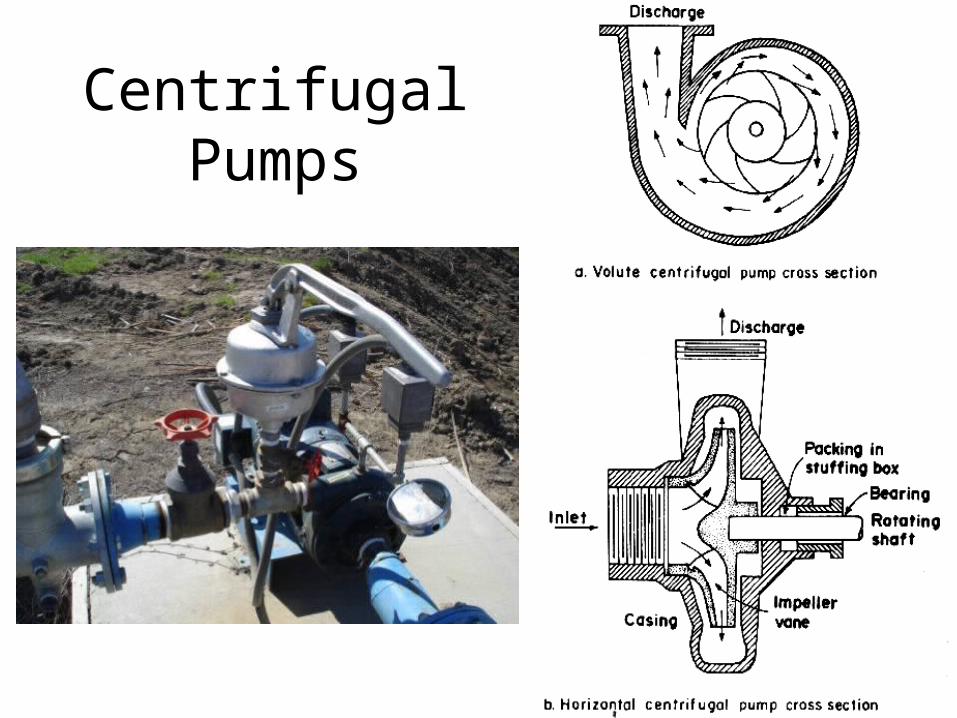
Centrifugal Pumps
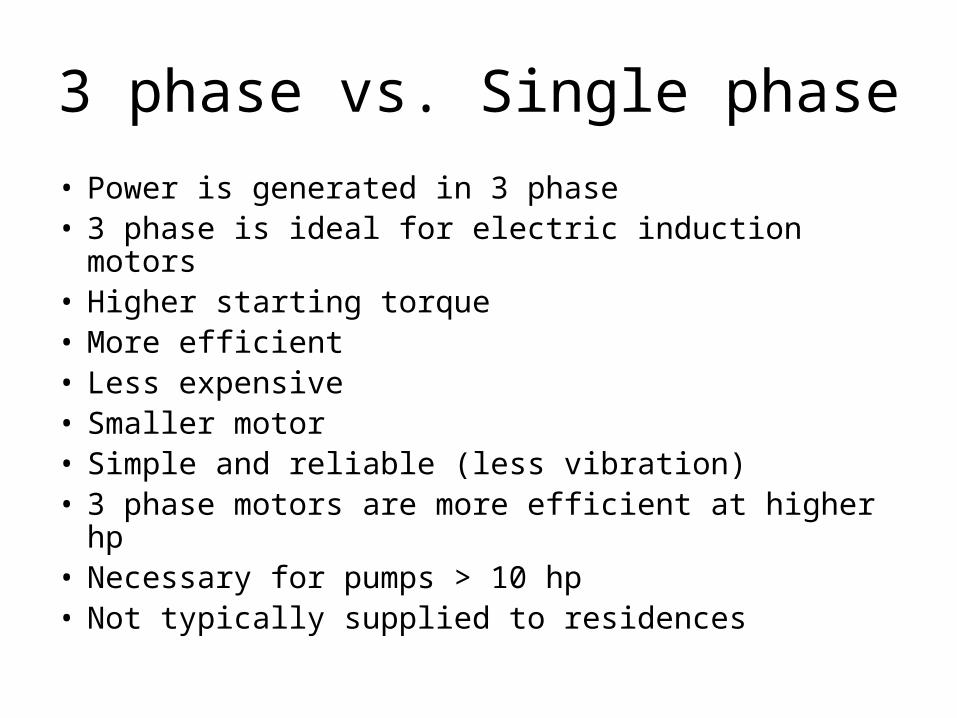
3 phase vs. Single phase
• Power is generated in 3 phase• 3 phase is ideal for electric induction motors• Higher starting torque• More efficient• Less expensive• Smaller motor• Simple and reliable (less vibration)• 3 phase motors are more efficient at higher hp• Necessary for pumps > 10 hp• Not typically supplied to residences
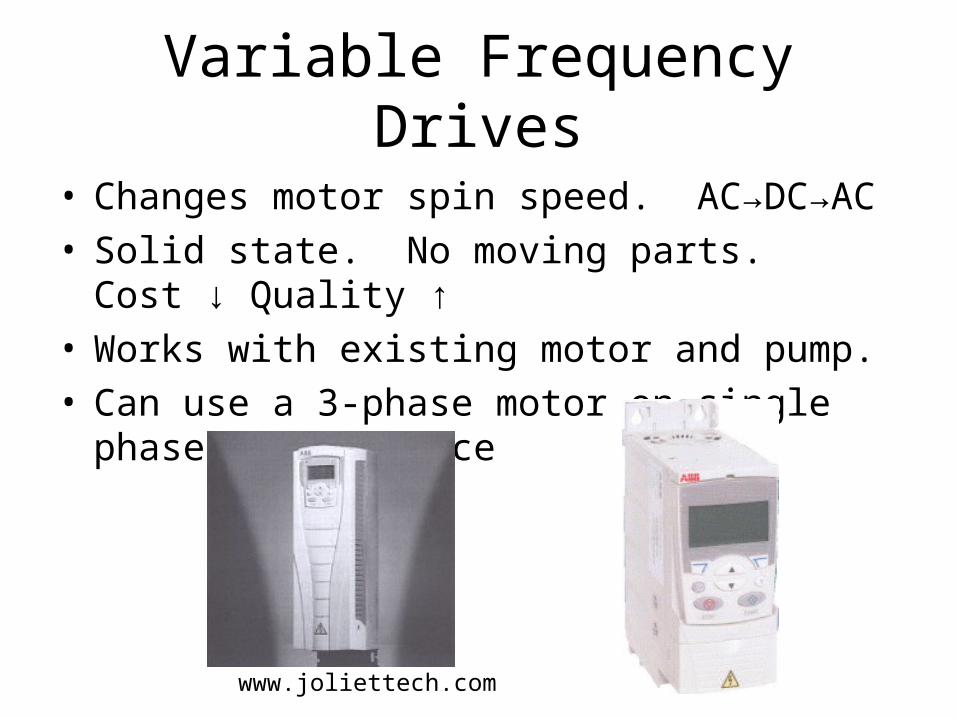
Variable Frequency Drives
• Changes motor spin speed. AC→DC→AC• Solid state. No moving parts. Cost ↓ Quality ↑• Works with existing motor and pump.• Can use a 3-phase motor on single phase
power source
www.joliettech.com
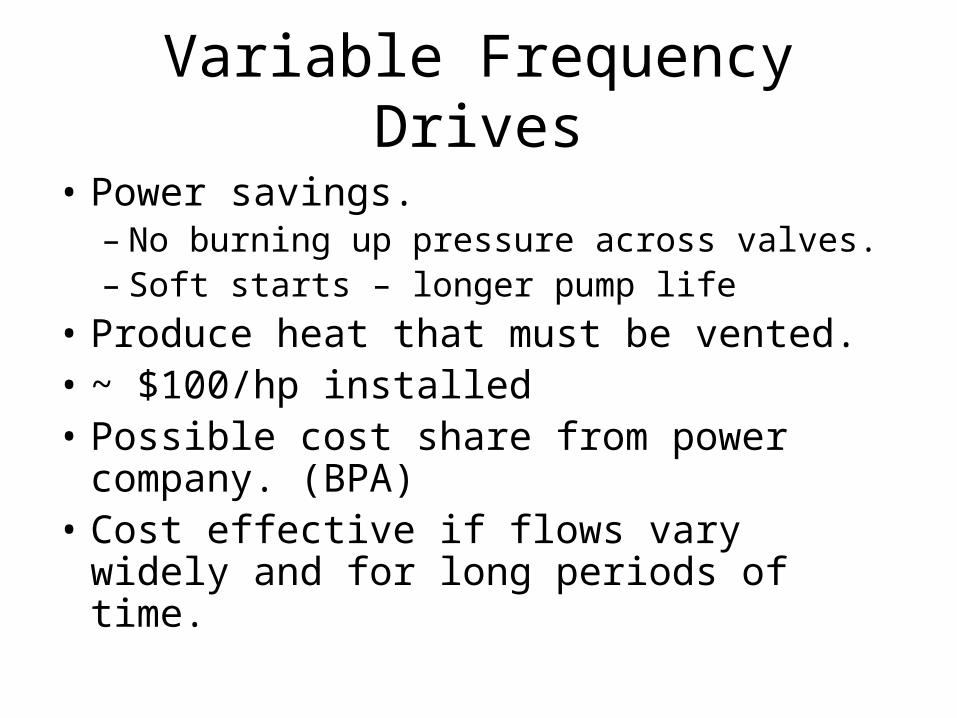
Variable Frequency Drives
• Power savings.– No burning up pressure across valves.– Soft starts – longer pump life
• Produce heat that must be vented. • ~ $100/hp installed• Possible cost share from power company.
(BPA)• Cost effective if flows vary widely and for
long periods of time.
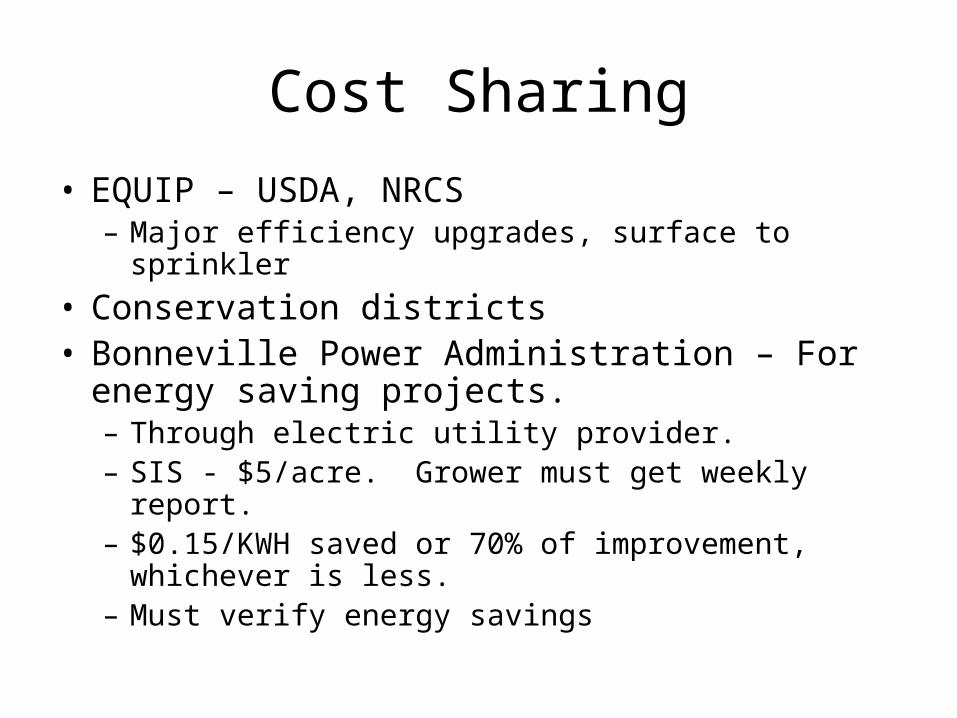
Cost Sharing
• EQUIP – USDA, NRCS– Major efficiency upgrades, surface to sprinkler
• Conservation districts• Bonneville Power Administration – For energy
saving projects. – Through electric utility provider. – SIS - $5/acre. Grower must get weekly report.– $0.15/KWH saved or 70% of improvement, whichever
is less.– Must verify energy savings
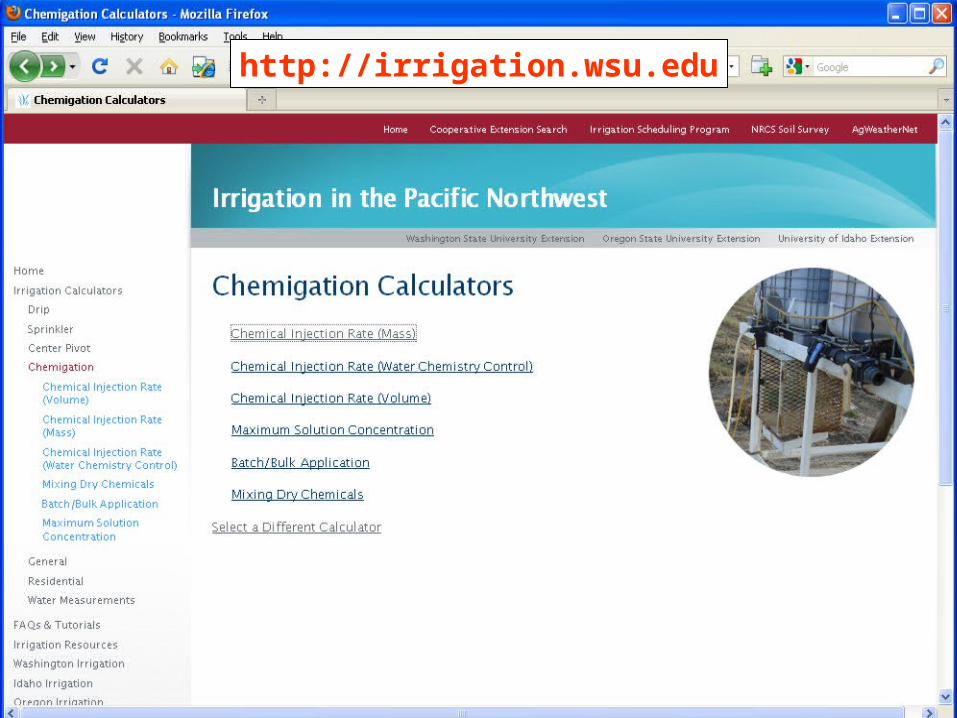
http://irrigation.wsu.edu
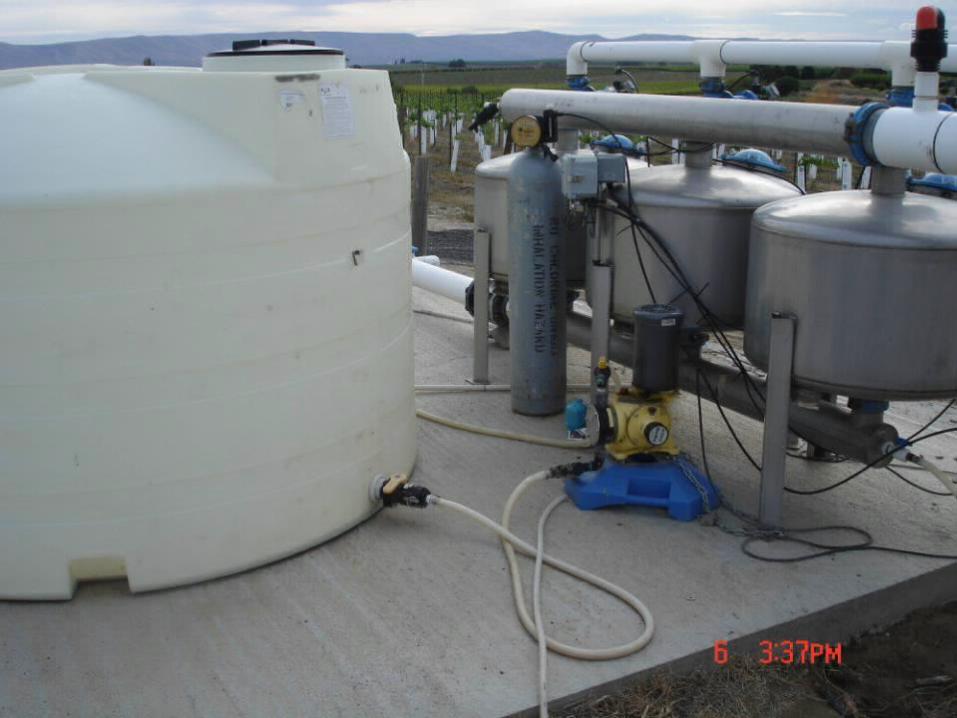
Chemigation
Chemigation
General term that includes:
• Fertigation
• Herbigation
• Insectigation
• Fungigation
• Nematigation
Advantages of Chemigation• Economics
• Timeliness
• Reduced soil compaction and crop damage
• Operator safety
Disadvantages• High management (need to know algebra)
• Additional equipment required
Calculating Injection Rates
1. Batch/Bulk Applications– Drip, Hand-line, Wheel-lines, Solid set
2. Continuous Move Injections– Center pivots, Linear Moves, Travelers,
Booms
3. Controlling water chemistry– Drip (algae/bacteria growth control, root
intrusion)
Batch/Bulk Applications
Timing is Key
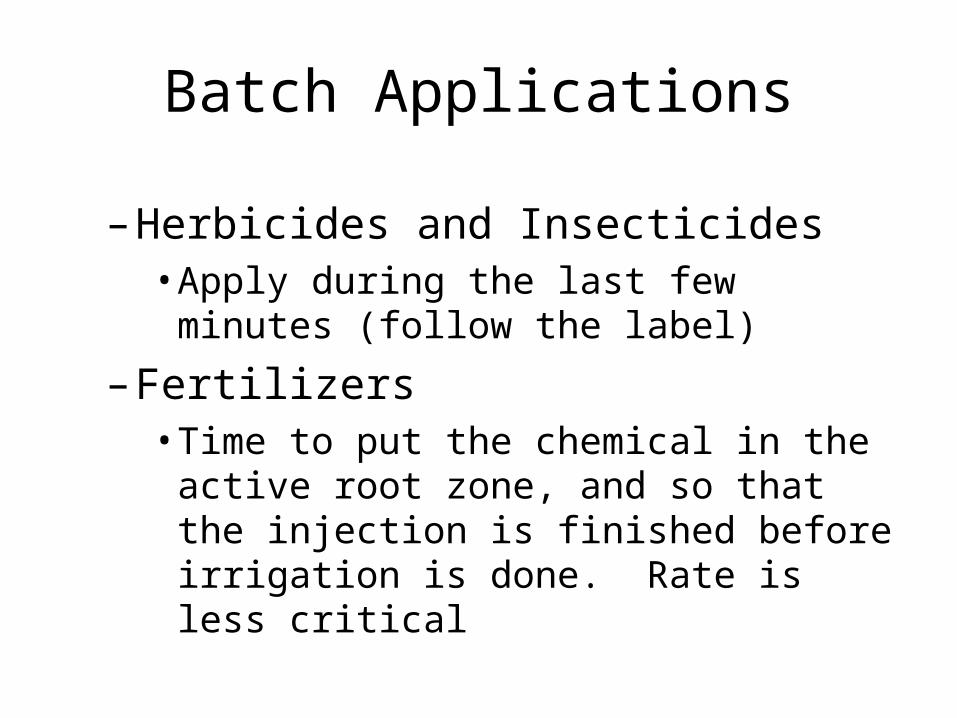
Batch Applications
– Herbicides and Insecticides• Apply during the last few minutes (follow
the label)
– Fertilizers• Time to put the chemical in the active root
zone, and so that the injection is finished before irrigation is done. Rate is less critical
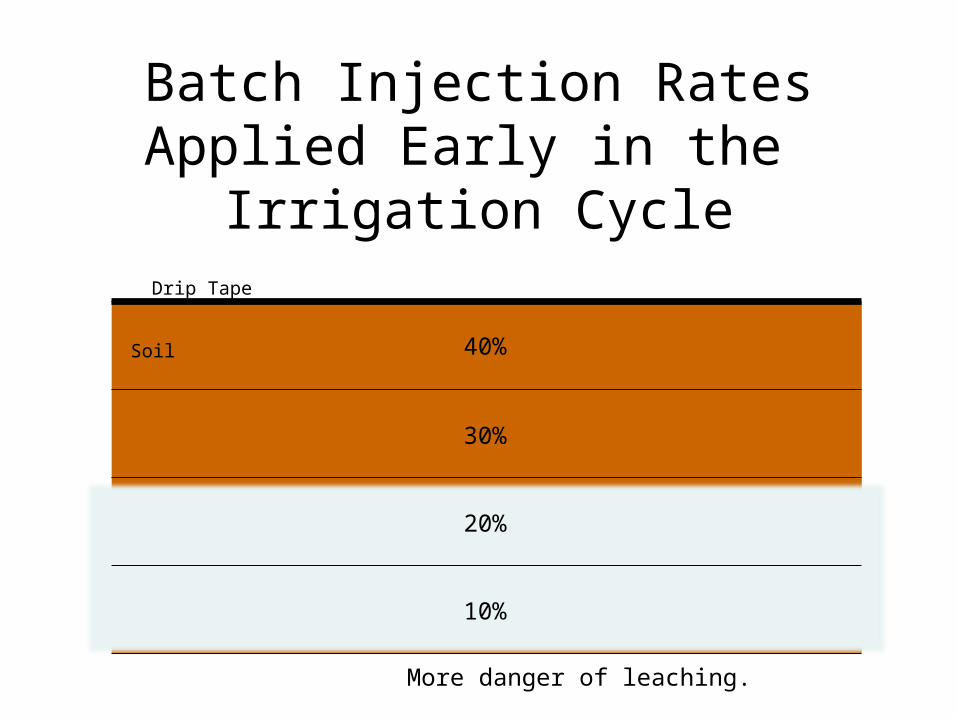
40%
30%
20%
10%
Batch Injection RatesApplied Early in the
Irrigation CycleDrip Tape
Soil
More danger of leaching.
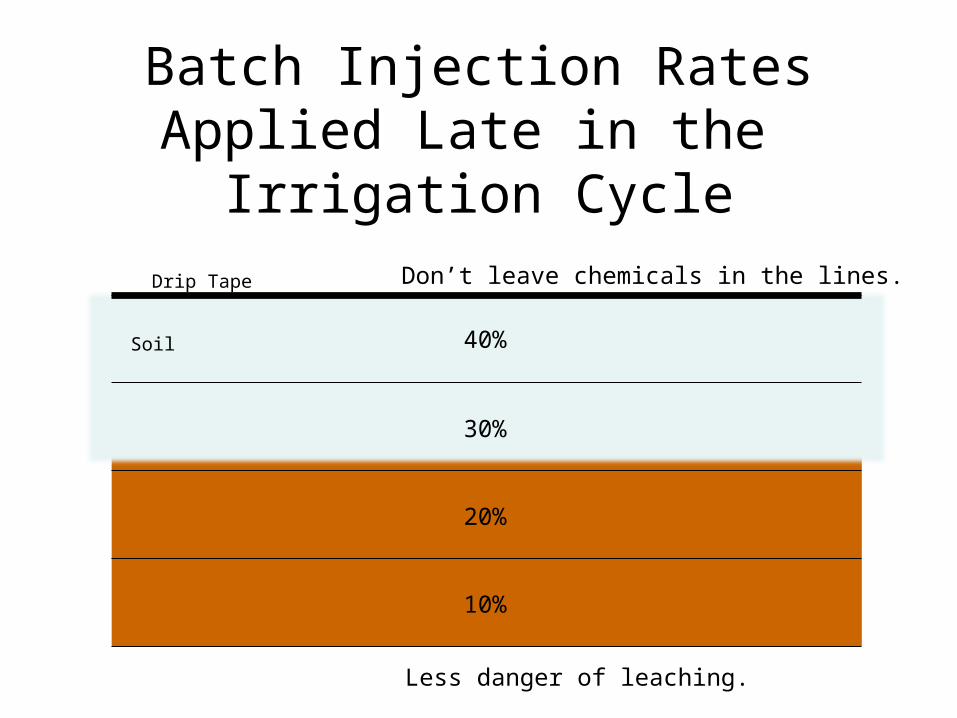
40%
30%
20%
10%
Batch Injection RatesApplied Late in the
Irrigation Cycle
Drip Tape
Soil
Don’t leave chemicals in the lines.
Less danger of leaching.
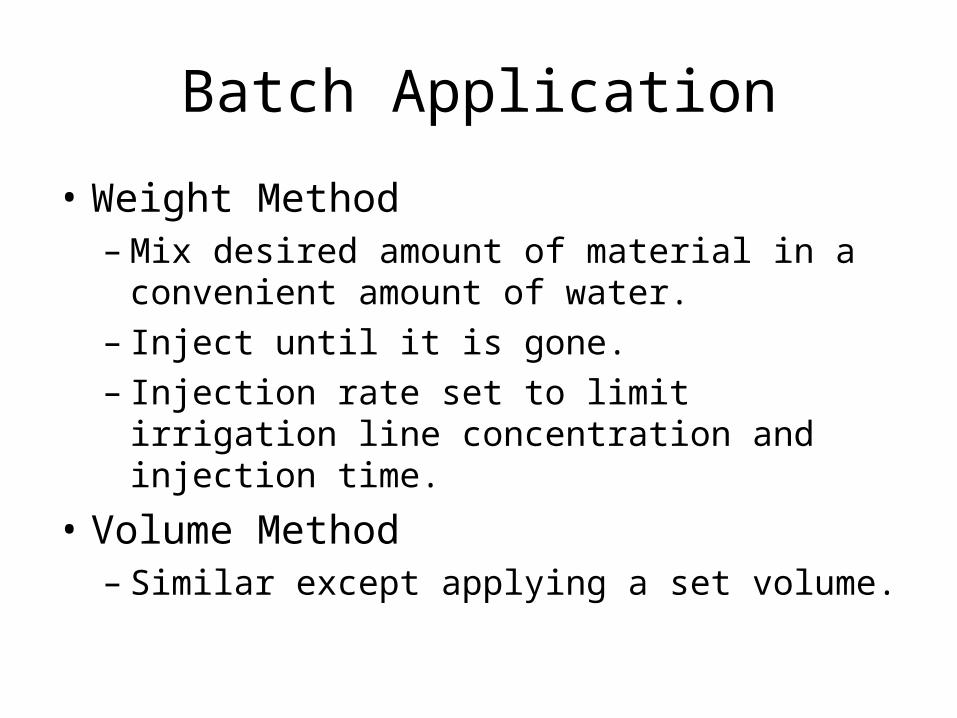
Batch Application
• Weight Method– Mix desired amount of material in a
convenient amount of water.– Inject until it is gone.– Injection rate set to limit irrigation line
concentration and injection time.
• Volume Method– Similar except applying a set volume.
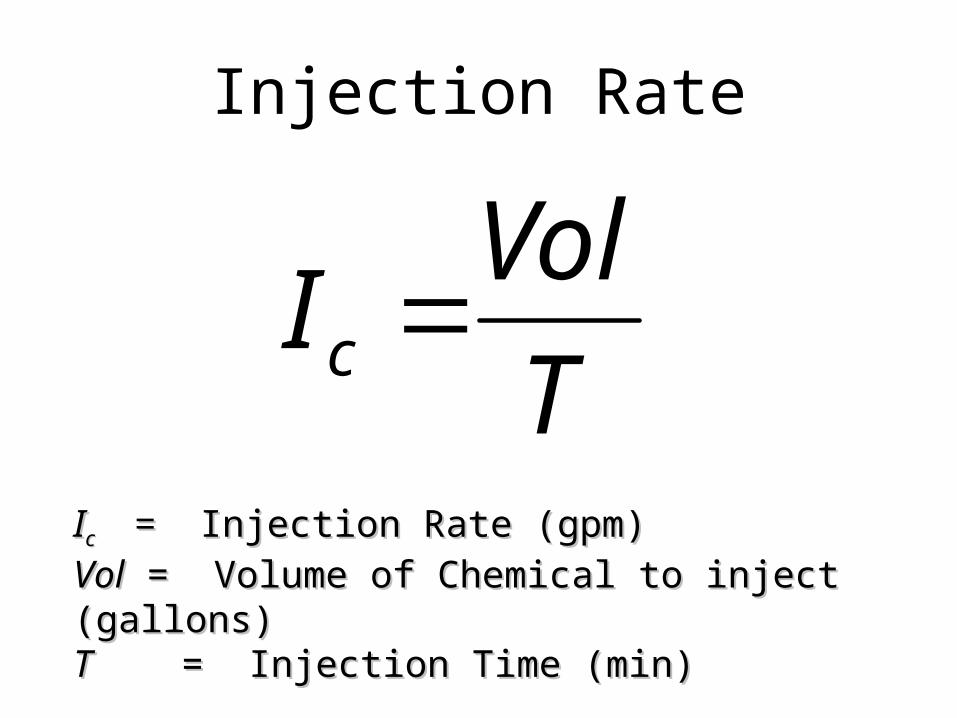
Injection Rate
T
VolIc
IIcc = = Injection Rate (gpm) Injection Rate (gpm)
VolVol = Volume of Chemical to inject (gallons) = Volume of Chemical to inject (gallons)TT = Injection Time (min) = Injection Time (min)
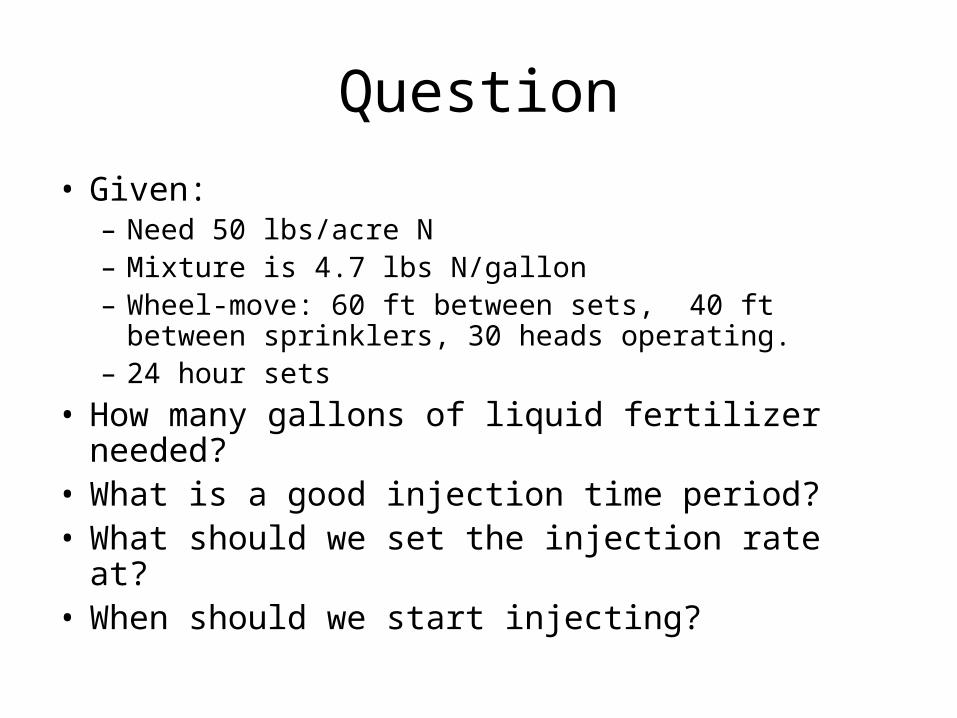
Question
• Given:– Need 50 lbs/acre N– Mixture is 4.7 lbs N/gallon– Wheel-move: 60 ft between sets, 40 ft between
sprinklers, 30 heads operating.– 24 hour sets
• How many gallons of liquid fertilizer needed?• What is a good injection time period?• What should we set the injection rate at?• When should we start injecting?
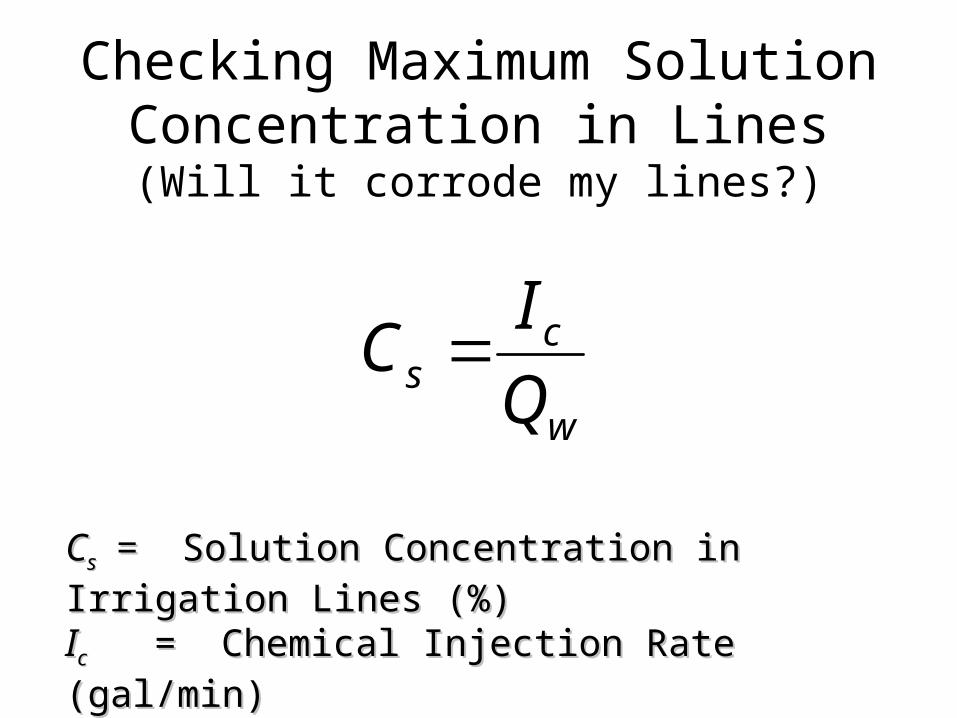
Checking Maximum Solution Concentration in Lines
(Will it corrode my lines?)
w
cs Q
IC
CCss = = Solution Concentration in Irrigation Lines (%) Solution Concentration in Irrigation Lines (%)
IIcc = Chemical Injection Rate (gal/min) = Chemical Injection Rate (gal/min)
QQww = Water Flow Rate (gal/min) = Water Flow Rate (gal/min)
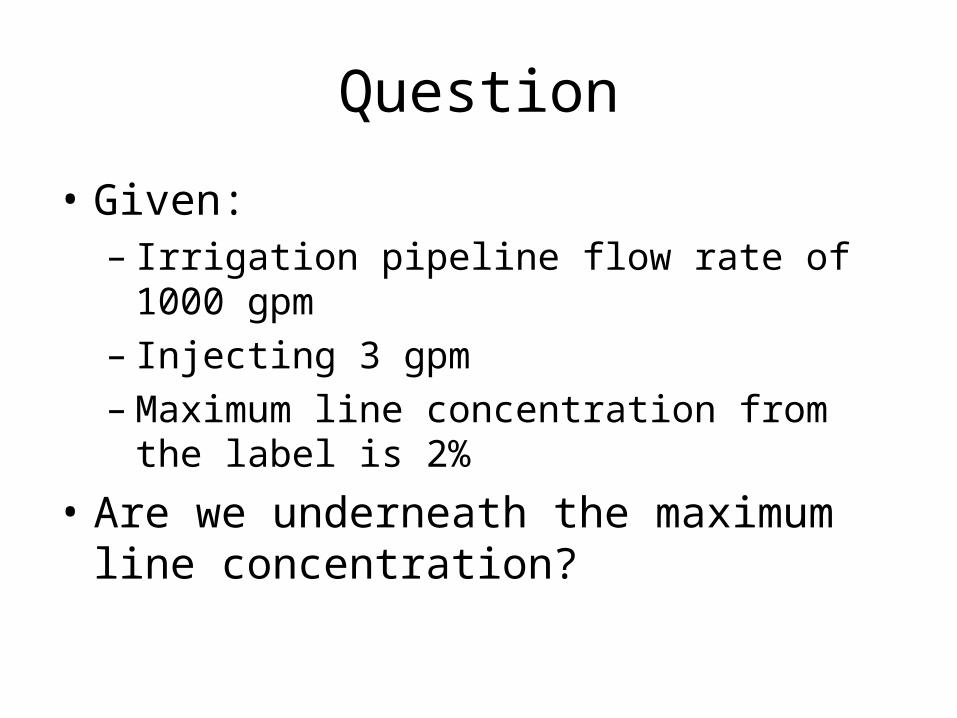
Question
• Given:– Irrigation pipeline flow rate of 1000 gpm– Injecting 3 gpm– Maximum line concentration from the label is
2%
• Are we underneath the maximum line concentration?
Continuous Move
Injection Rate is Critical
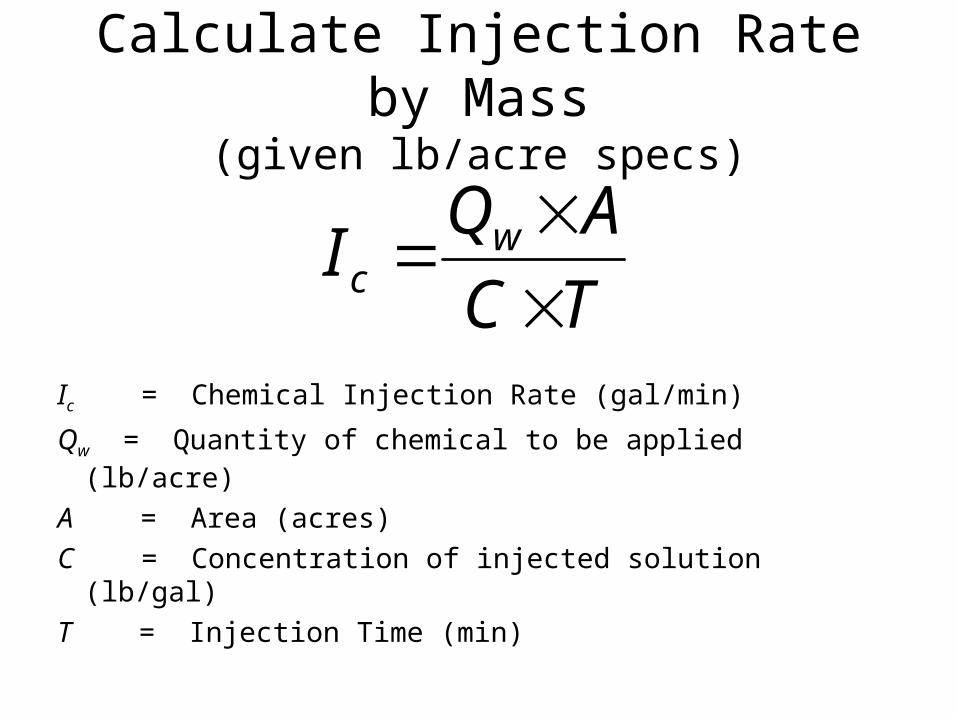
Calculate Injection Rate by Mass(given lb/acre specs)
Ic = Chemical Injection Rate (gal/min)
Qw = Quantity of chemical to be applied (lb/acre)
A = Area (acres)
C = Concentration of injected solution (lb/gal)
T = Injection Time (min)
TC
AQI w
c
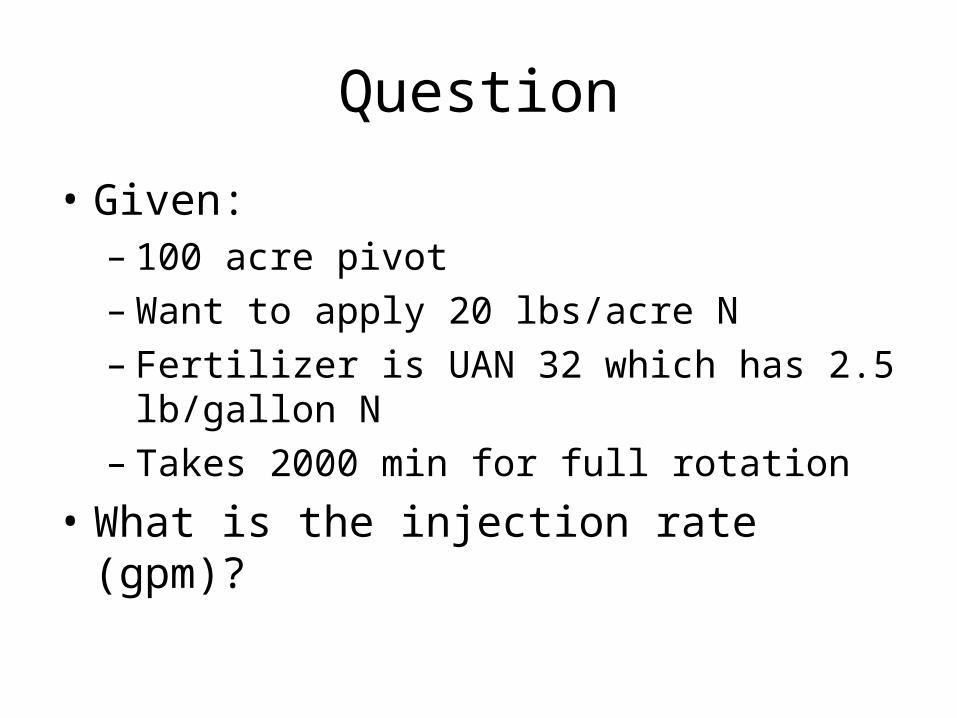
Question
• Given:– 100 acre pivot– Want to apply 20 lbs/acre N– Fertilizer is UAN 32 which has 2.5 lb/gallon N– Takes 2000 min for full rotation
• What is the injection rate (gpm)?
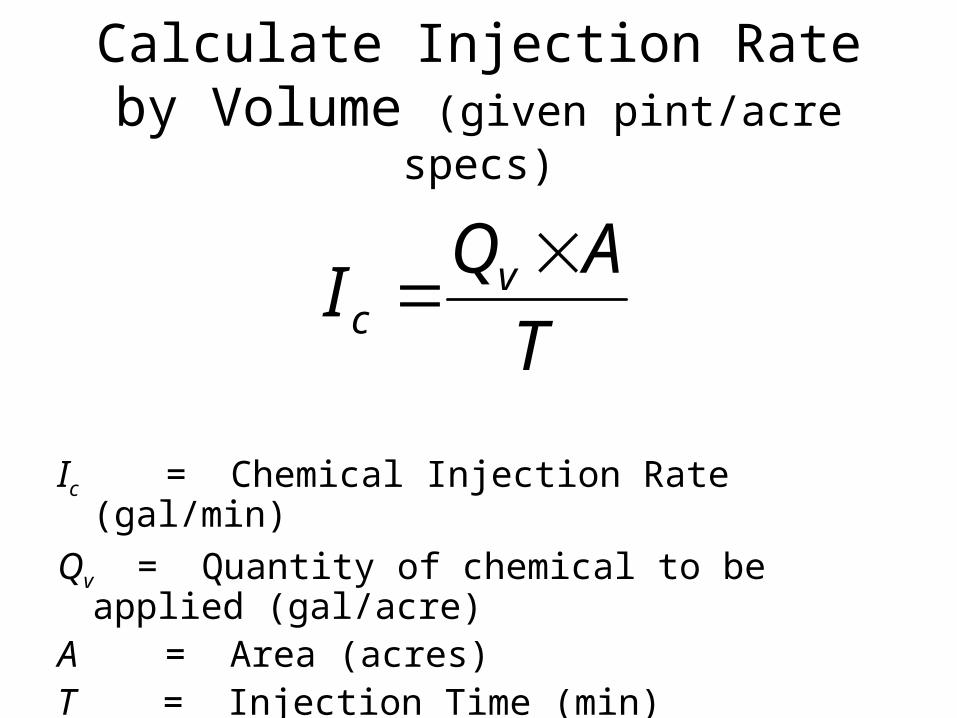
Calculate Injection Rate by Volume (given pint/acre specs)
Ic = Chemical Injection Rate (gal/min)
Qv = Quantity of chemical to be applied (gal/acre)A = Area (acres)T = Injection Time (min)
T
AQI v
c
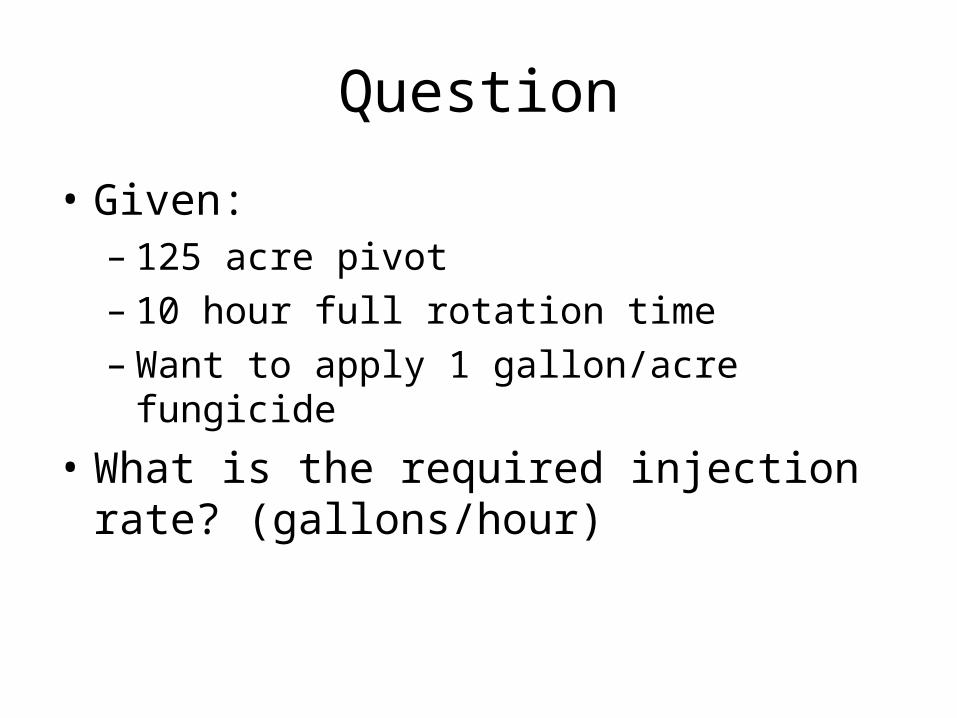
Question
• Given:– 125 acre pivot– 10 hour full rotation time– Want to apply 1 gallon/acre fungicide
• What is the required injection rate? (gallons/hour)
Water Chemistry Control
Goal is ppm water concentration
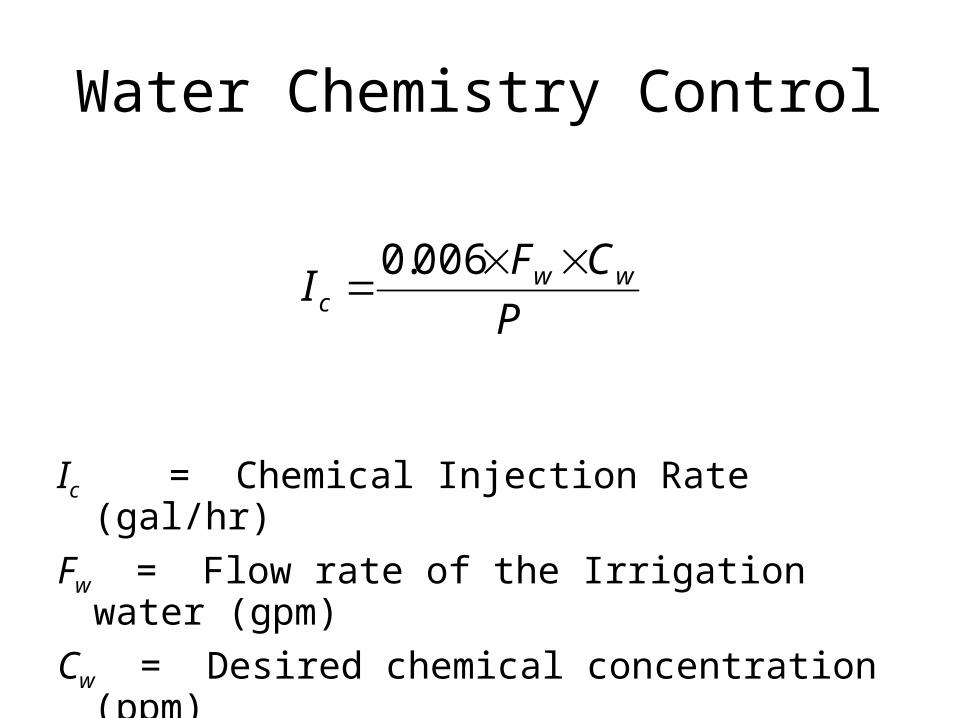
Water Chemistry Control
P
CFI ww
c
006.0
Ic = Chemical Injection Rate (gal/hr)
Fw = Flow rate of the Irrigation water (gpm)
Cw = Desired chemical concentration (ppm)P = Percentage of chemical in solution (%)
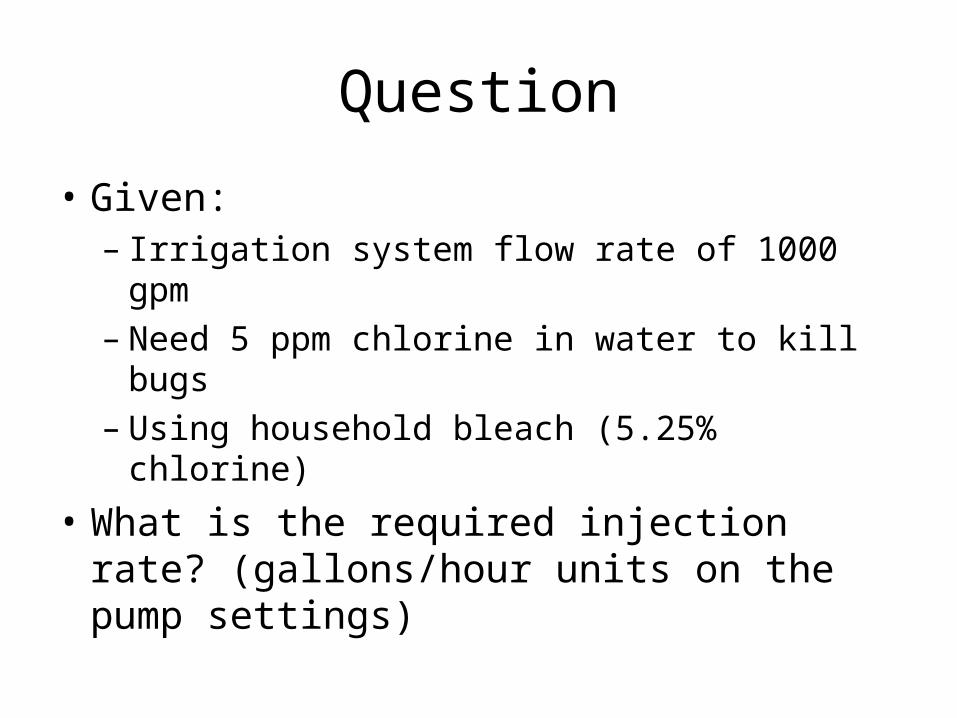
Question
• Given:– Irrigation system flow rate of 1000 gpm– Need 5 ppm chlorine in water to kill bugs– Using household bleach (5.25% chlorine)
• What is the required injection rate? (gallons/hour units on the pump settings)
Venturi Valves and other proportional rate injectors
Tank mixture concentration is key
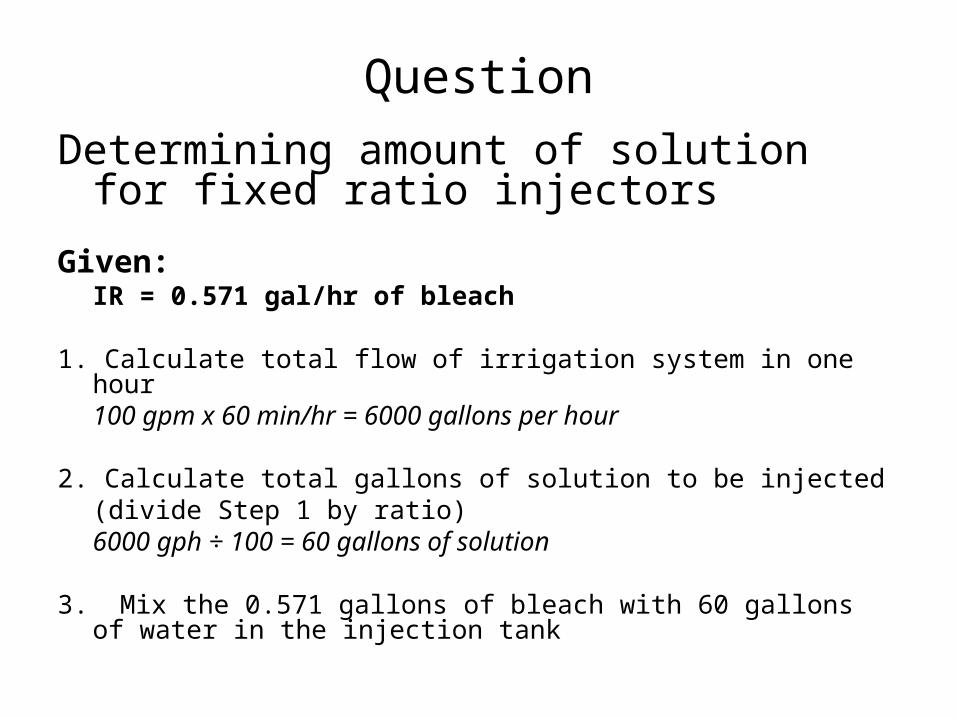
Question
Determining amount of solution for fixed ratio injectors
Given:IR = 0.571 gal/hr of bleach
1. Calculate total flow of irrigation system in one hour100 gpm x 60 min/hr = 6000 gallons per hour
2. Calculate total gallons of solution to be injected (divide Step 1 by ratio)
6000 gph ÷ 100 = 60 gallons of solution
3. Mix the 0.571 gallons of bleach with 60 gallons of water in the injection tank
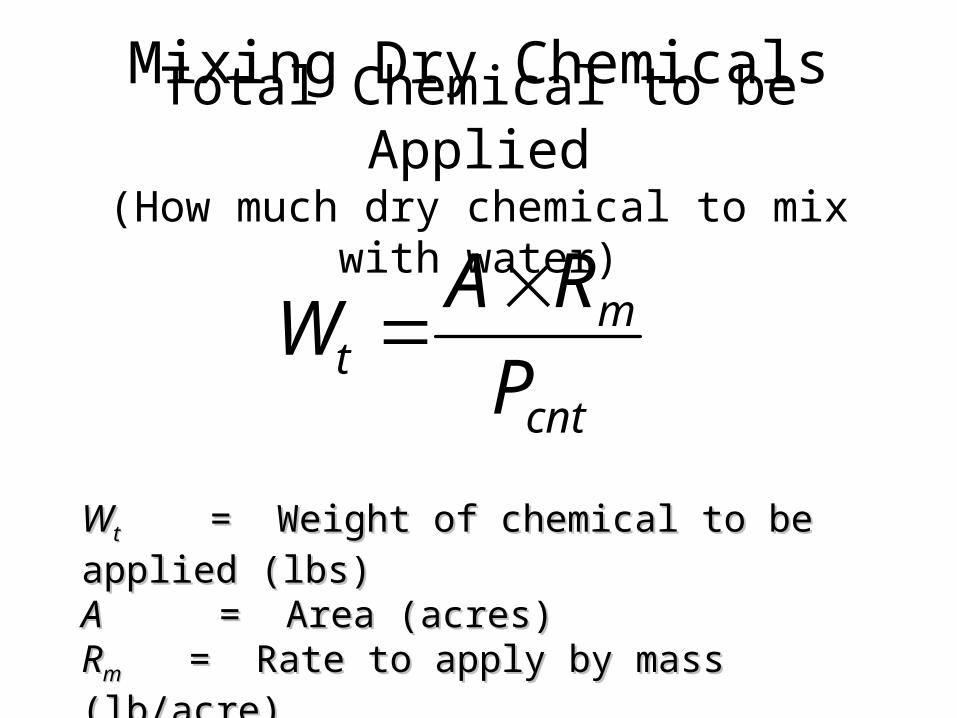
Total Chemical to be Applied(How much dry chemical to mix with water)
cnt
mt P
RAW
WWtt = Weight of chemical to be applied (lbs) = Weight of chemical to be applied (lbs)
AA = Area (acres)= Area (acres)RRmm = Rate to apply by mass (lb/acre) = Rate to apply by mass (lb/acre)
PPcntcnt = Percent concentration in mix (%) = Percent concentration in mix (%)
Mixing Dry Chemicals
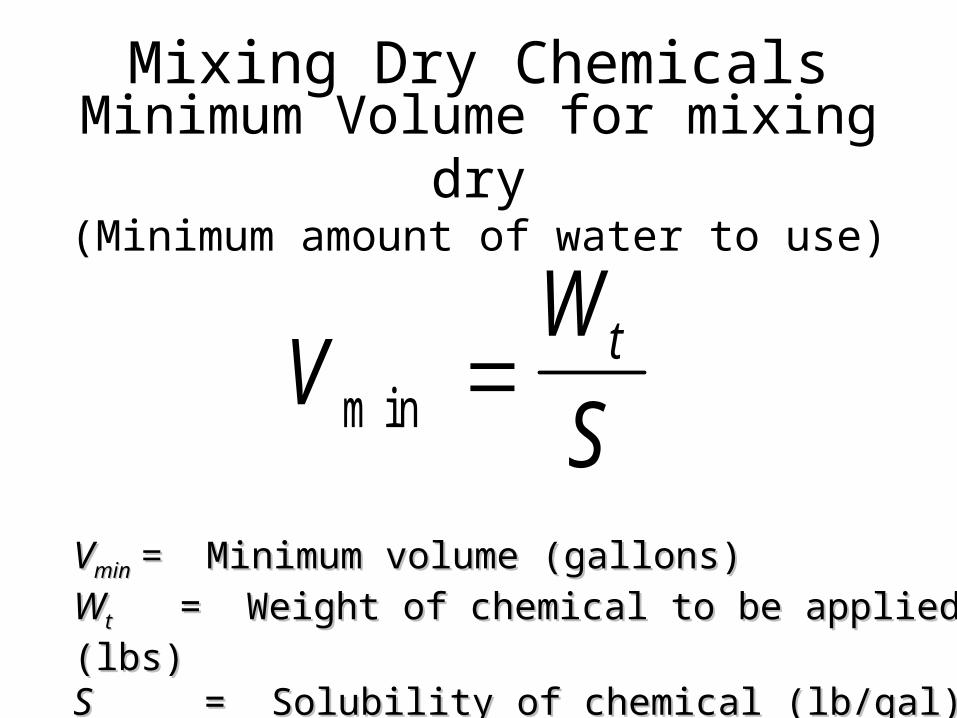
Minimum Volume for mixing dry(Minimum amount of water to use)
VW
St
m in
VVminmin = = Minimum volume (gallons) Minimum volume (gallons)
WWtt = Weight of chemical to be applied (lbs) = Weight of chemical to be applied (lbs)
SS = Solubility of chemical (lb/gal) = Solubility of chemical (lb/gal)
Mixing Dry Chemicals
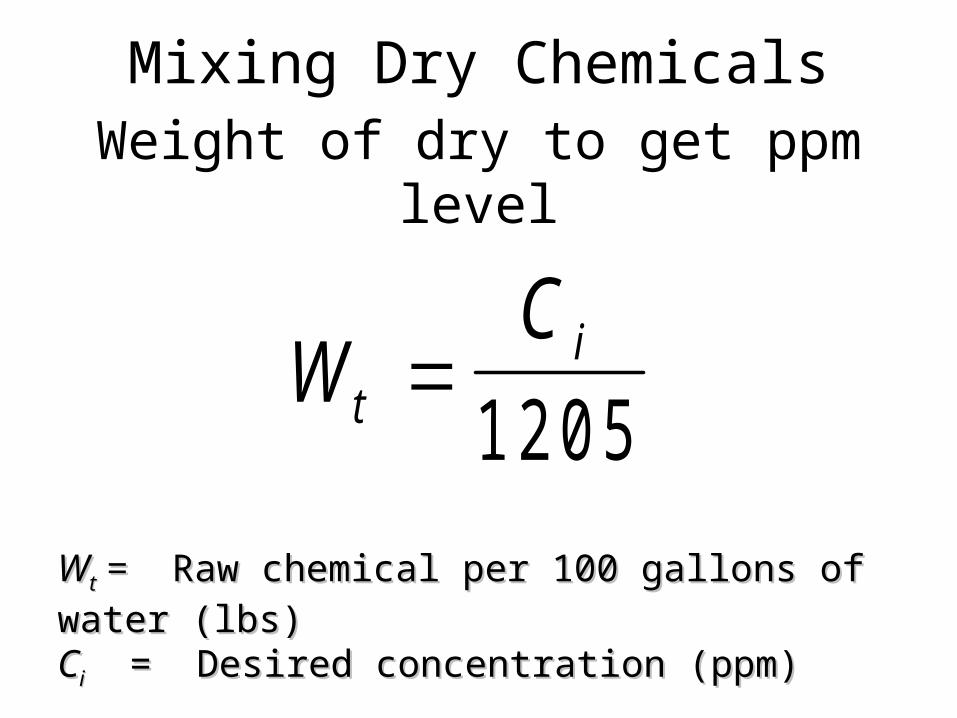
Weight of dry to get ppm level
WC
ti
1 2 0 5
WWtt = = Raw chemical per 100 gallons of water (lbs) Raw chemical per 100 gallons of water (lbs)
CCii = Desired concentration (ppm) = Desired concentration (ppm)
Mixing Dry Chemicals
Calibration of Equipment
• Small differences in injection rates make large differences in total amount of chemical applied
- Insufficient or excessive ($$) application
• Calibration involves injecting water and checking the actual volume of water injected
• Set/check injector rate by injecting water for 1 minute