Embed Size (px)
Citation preview
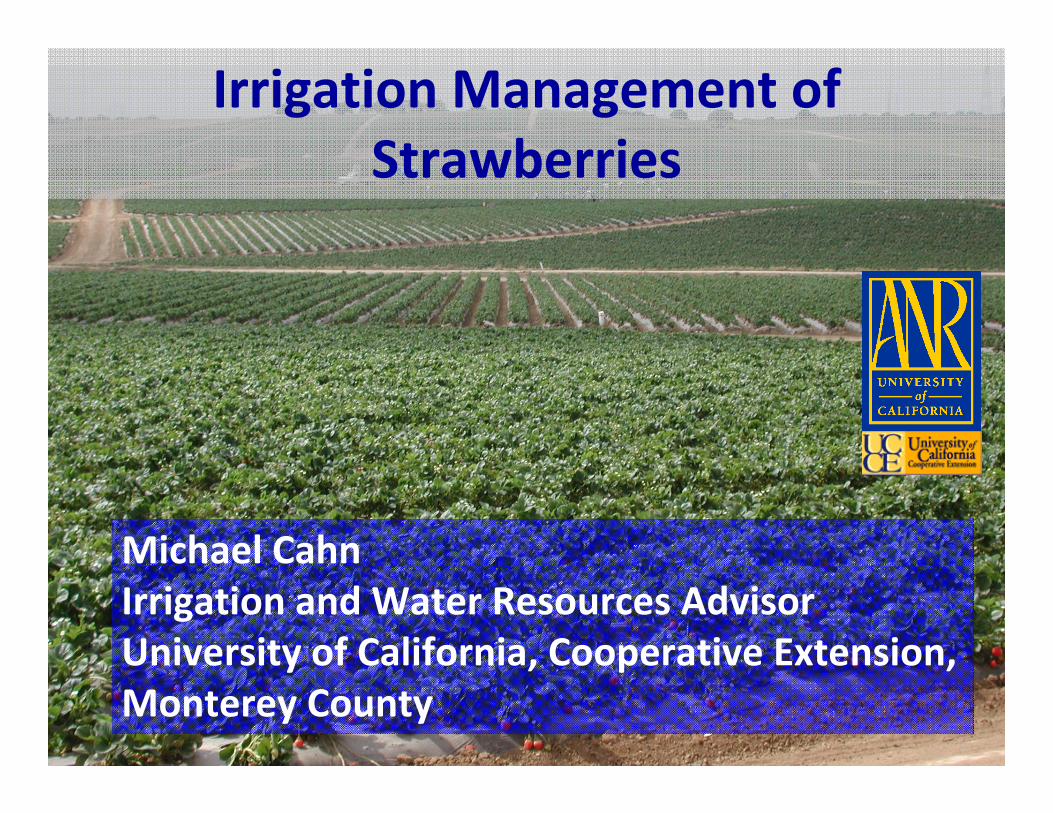
Irrigation Management of Strawberries
Michael CahnIrrigation and Water Resources AdvisorUniversity of California, Cooperative Extension, Monterey County
Acknowledgements
UC: Tim Hartz, Tom Bottoms, Barry Farrara, Mark Bolda
Monterey County RCD: Paul Robins, Michael Johnson
Strawberry Industry and Cooperating Growers
Specific questions about Strawberry Irrigation
How much water is applied during the production season?How much do water requirements of strawberry vary among locations, varieties, and soils?Are there opportunities to conserve water or improve production with better management?
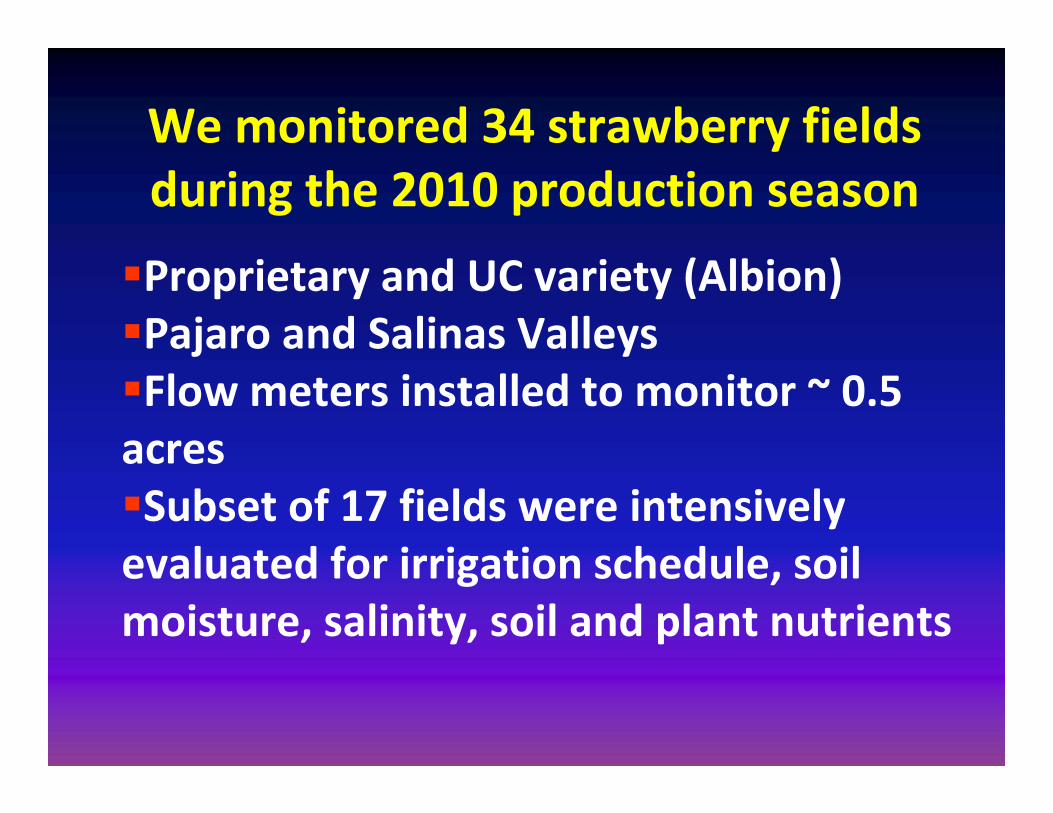
We monitored 34 strawberry fields during the 2010 production season
Proprietary and UC variety (Albion)Pajaro and Salinas ValleysFlow meters installed to monitor ~ 0.5 acresSubset of 17 fields were intensively evaluated for irrigation schedule, soil moisture, salinity, soil and plant nutrients
Field Number
0 5 10 15 20 25 30
Appl
ied
Wat
er (i
nche
s)
0
10
20
30
40
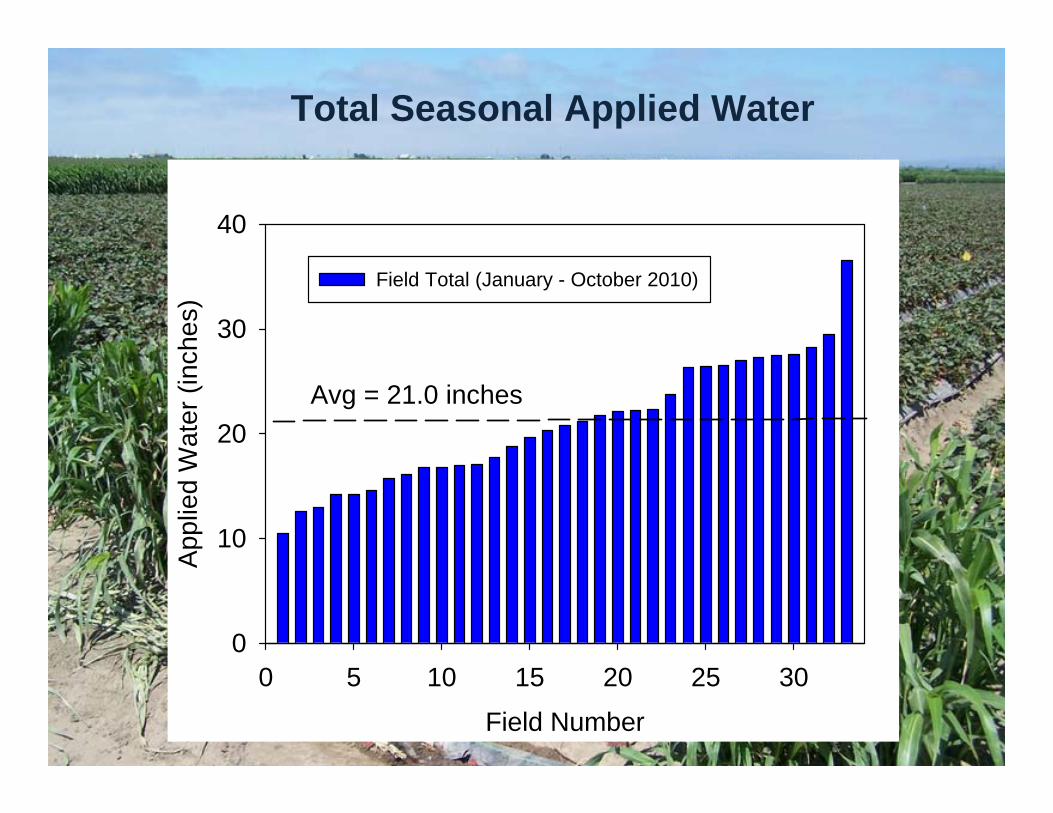
Field Total (January - October 2010)
Avg = 21.0 inches
Total Seasonal Applied Water
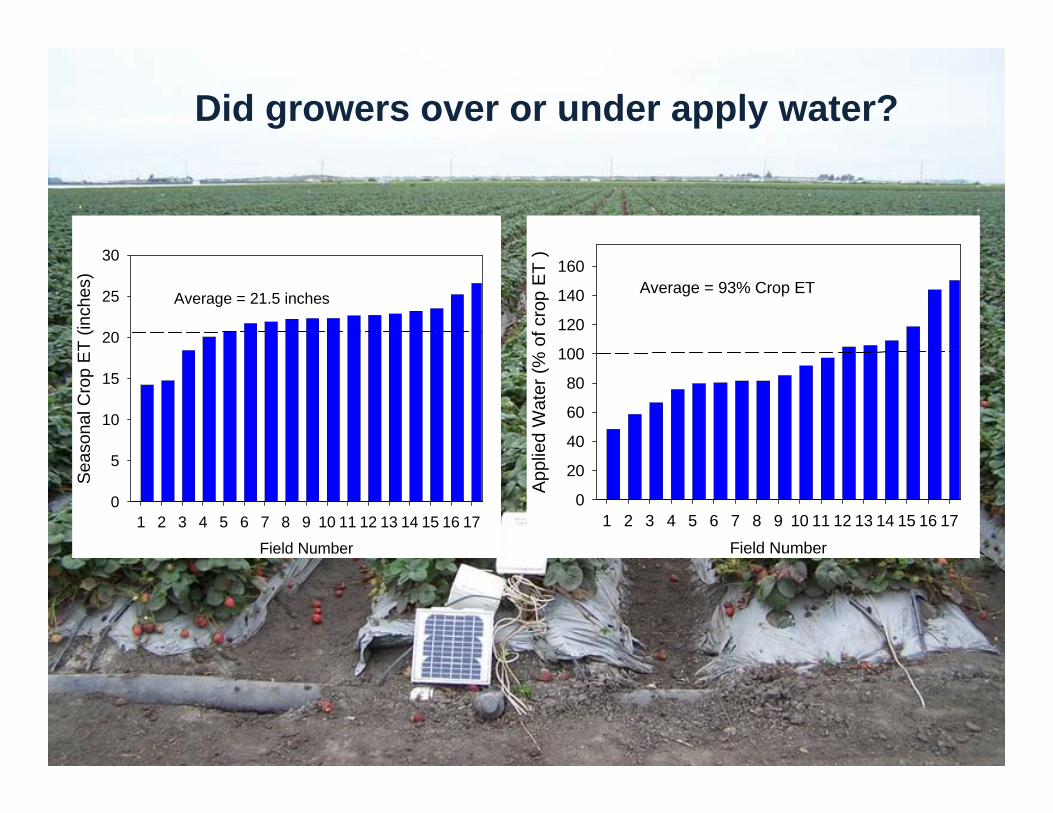
Did growers over or under apply water?
Field Number
1 2 3 4 5 6 7 8 9 10 11 12 13 14 15 16 17
Seas
onal
Cro
p E
T (in
ches
)
0
5
10
15
20
25
30
Average = 21.5 inches
Field Number
1 2 3 4 5 6 7 8 9 10 11 12 13 14 15 16 17Ap
plie
d W
ater
(% o
f cro
p E
T )
0
20
40
60
80
100
120
140
160Average = 93% Crop ET
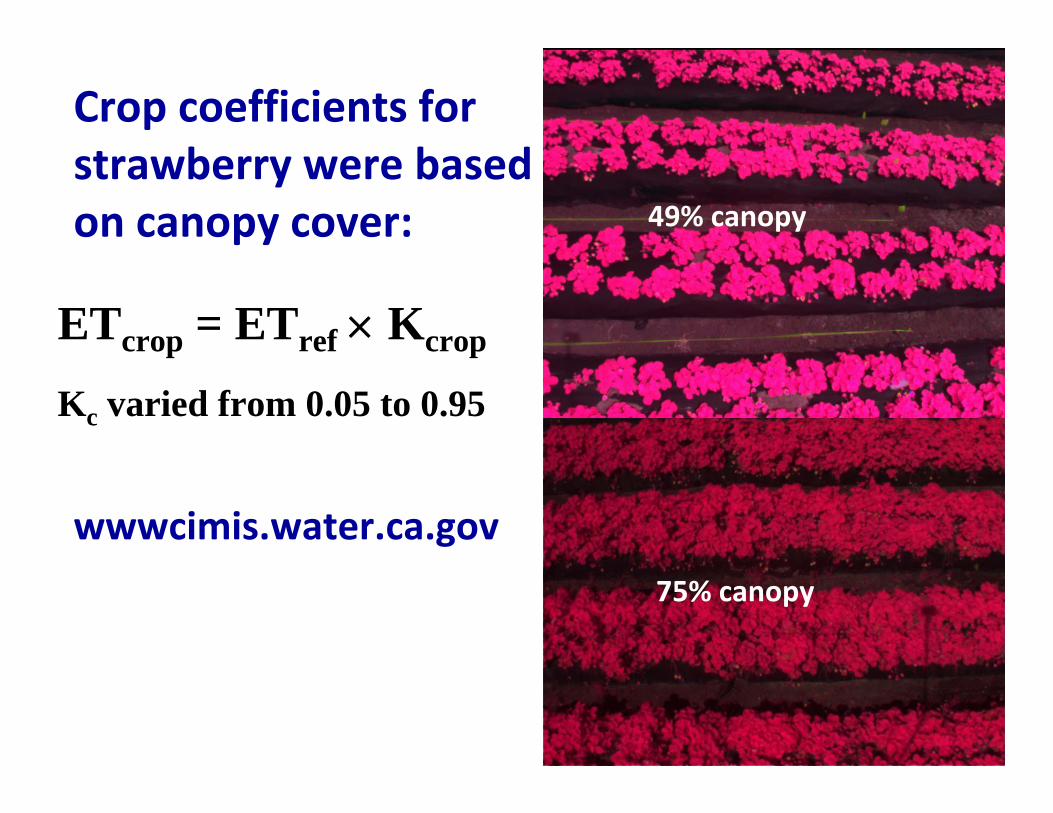
ETcrop = ETref × Kcrop
Kc varied from 0.05 to 0.95
Crop coefficients for strawberry were based on canopy cover:
wwwcimis.water.ca.gov
49% canopy
75% canopy
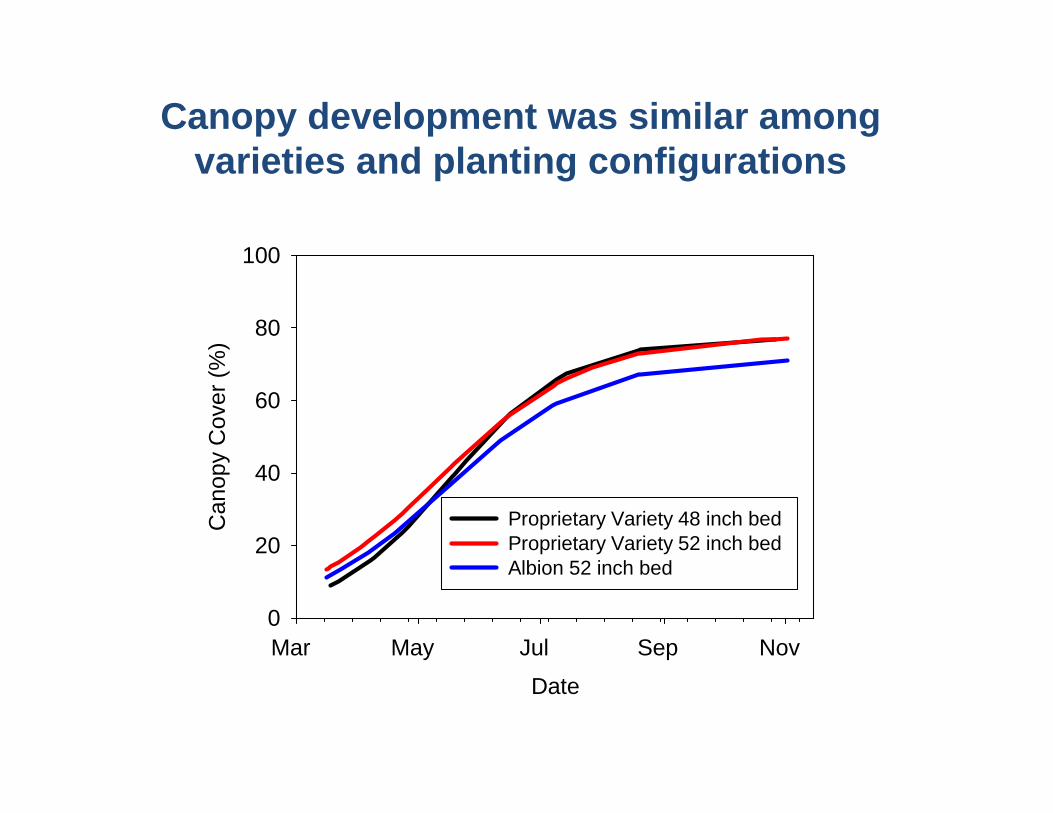
Canopy development was similar among varieties and planting configurations
Date
Mar May Jul Sep Nov
Can
opy
Cov
er (%
)
0
20
40
60
80
100
Proprietary Variety 48 inch bed Proprietary Variety 52 inch bed Albion 52 inch bed
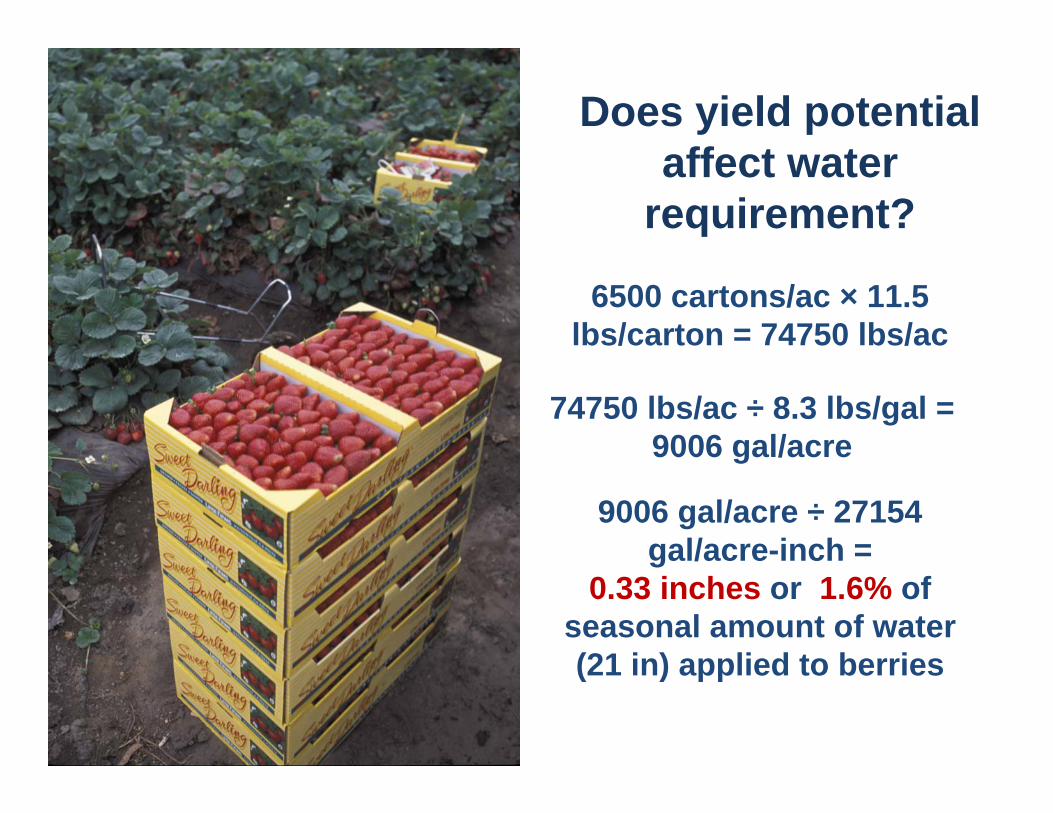
Does yield potential affect water
requirement?
6500 cartons/ac × 11.5 lbs/carton = 74750 lbs/ac
74750 lbs/ac ÷ 8.3 lbs/gal =9006 gal/acre
9006 gal/acre ÷ 27154 gal/acre-inch =
0.33 inches or 1.6% of seasonal amount of water (21 in) applied to berries
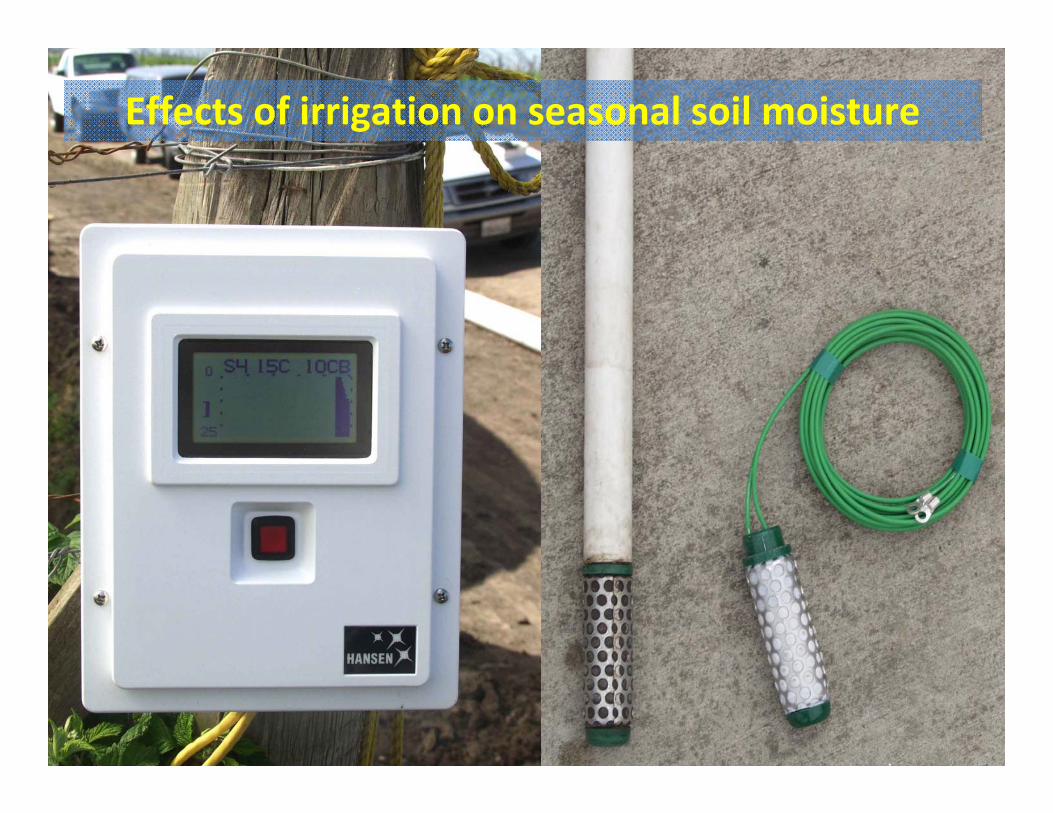
Effects of irrigation on seasonal soil moisture
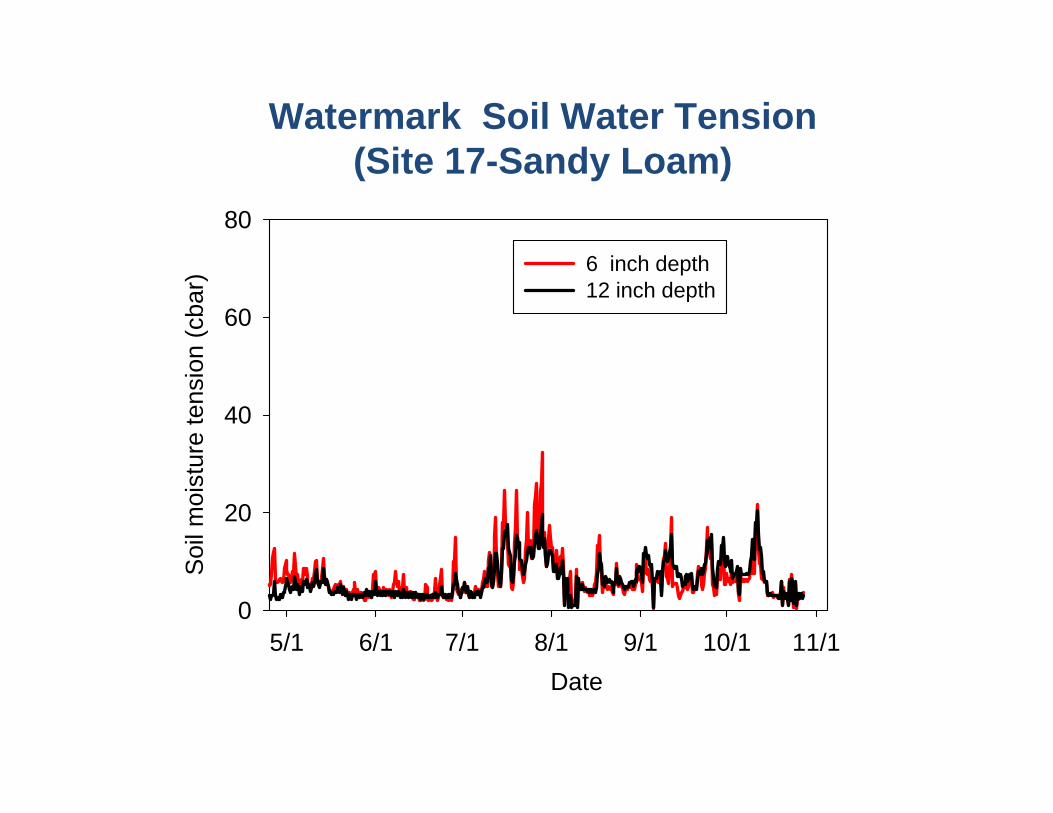
Date5/1 6/1 7/1 8/1 9/1 10/1 11/1
Soi
l moi
stur
e te
nsio
n (c
bar)
0
20
40
60
80
6 inch depth12 inch depth
Watermark Soil Water Tension(Site 17-Sandy Loam)
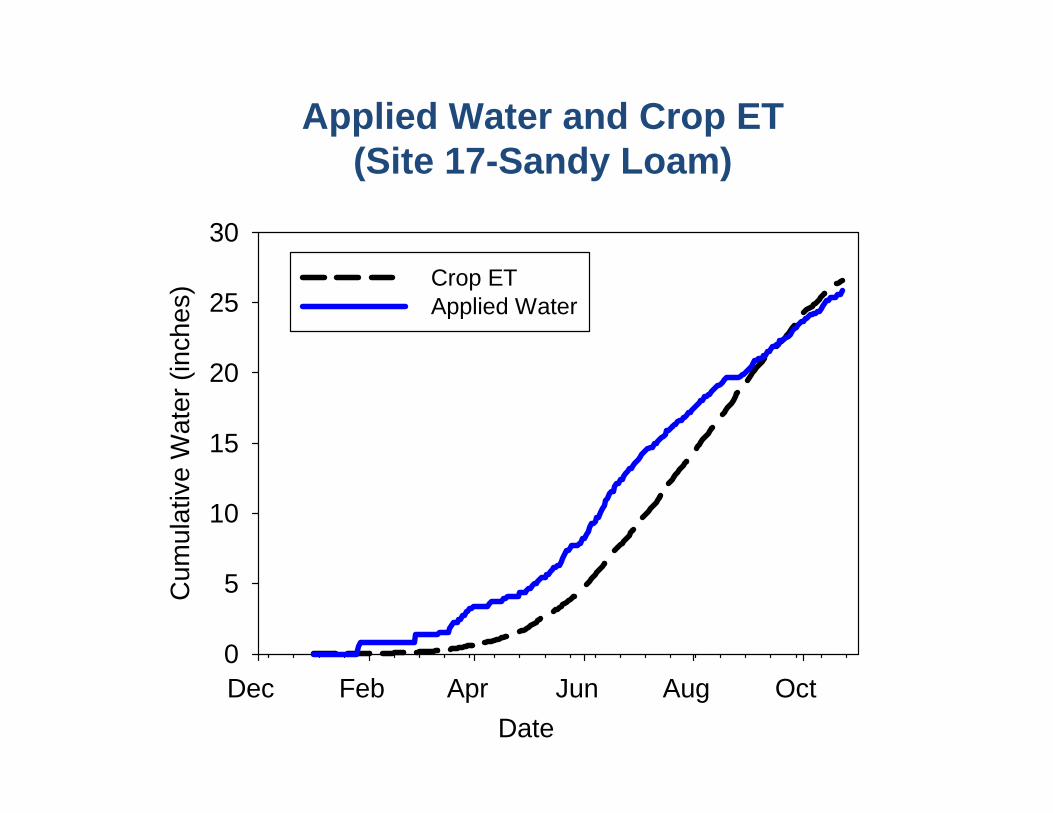
DateDec Feb Apr Jun Aug Oct
Cum
ulat
ive
Wat
er (i
nche
s)
0
5
10
15
20
25
30Crop ETApplied Water
Applied Water and Crop ET(Site 17-Sandy Loam)
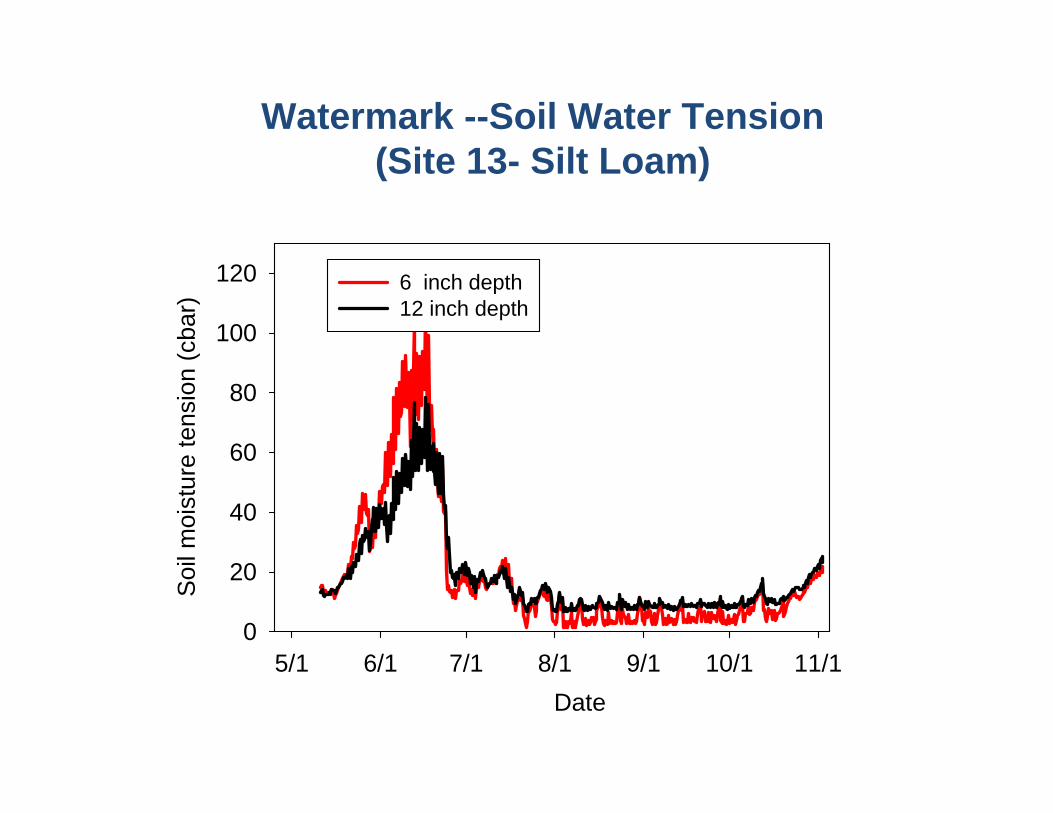
Watermark --Soil Water Tension(Site 13- Silt Loam)
Date5/1 6/1 7/1 8/1 9/1 10/1 11/1
Soil
moi
stur
e te
nsio
n (c
bar)
0
20
40
60
80
100
120 6 inch depth12 inch depth
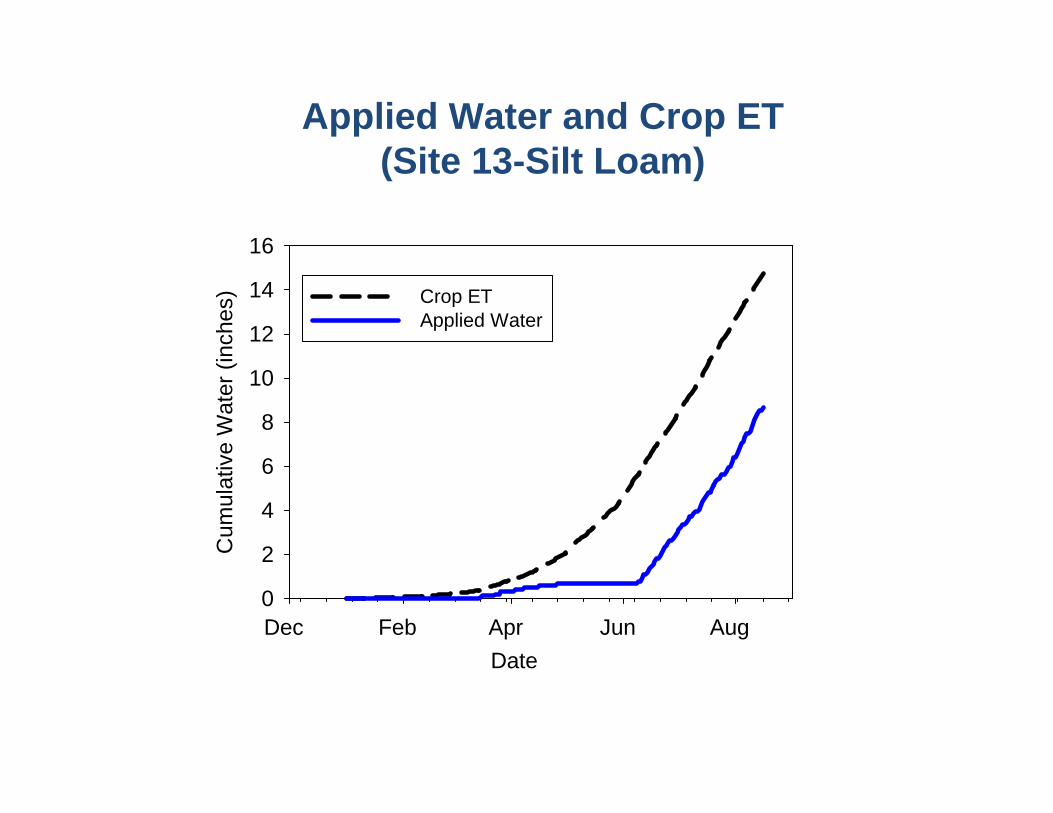
Applied Water and Crop ET(Site 13-Silt Loam)
DateDec Feb Apr Jun Aug
Cum
ulat
ive
Wat
er (i
nche
s)
0
2
4
6
8
10
12
14
16
Crop ETApplied Water
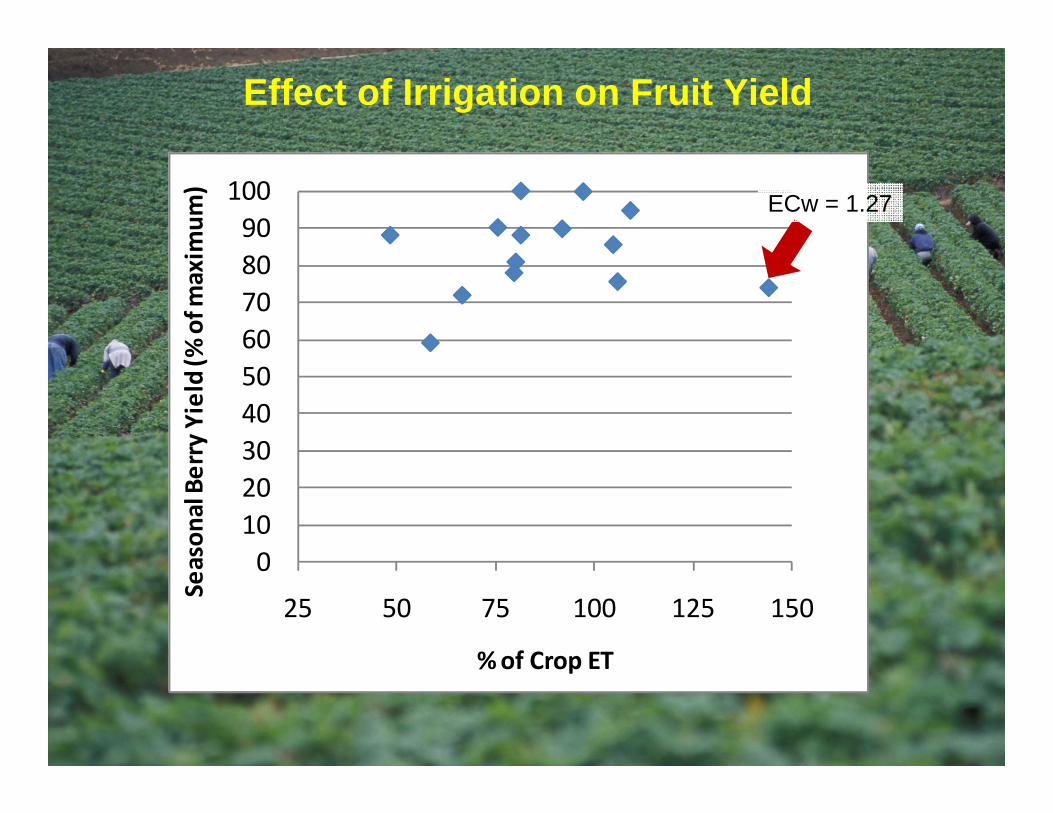
0102030405060708090100
25 50 75 100 125 150
Season
al Berry Yield (%
of m
axim
um)
% of Crop ET
Effect of Irrigation on Fruit Yield
ECw = 1.27
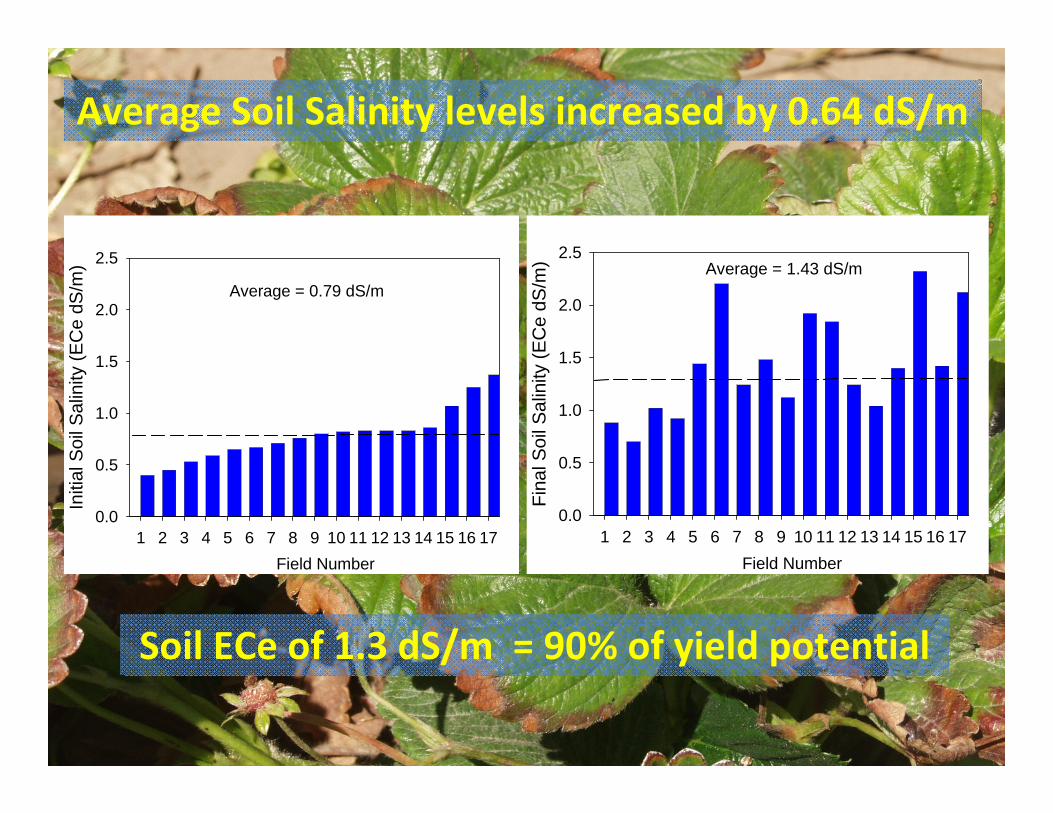
Average Soil Salinity levels increased by 0.64 dS/m
Field Number1 2 3 4 5 6 7 8 9 10 11 12 13 14 15 16 17
Fina
l Soi
l Sal
inity
(EC
e dS
/m)
0.0
0.5
1.0
1.5
2.0
2.5Average = 1.43 dS/m
Field Number1 2 3 4 5 6 7 8 9 10 11 12 13 14 15 16 17
Initi
al S
oil S
alin
ity (E
Ce
dS/m
)
0.0
0.5
1.0
1.5
2.0
2.5
Average = 0.79 dS/m
Soil ECe of 1.3 dS/m = 90% of yield potential
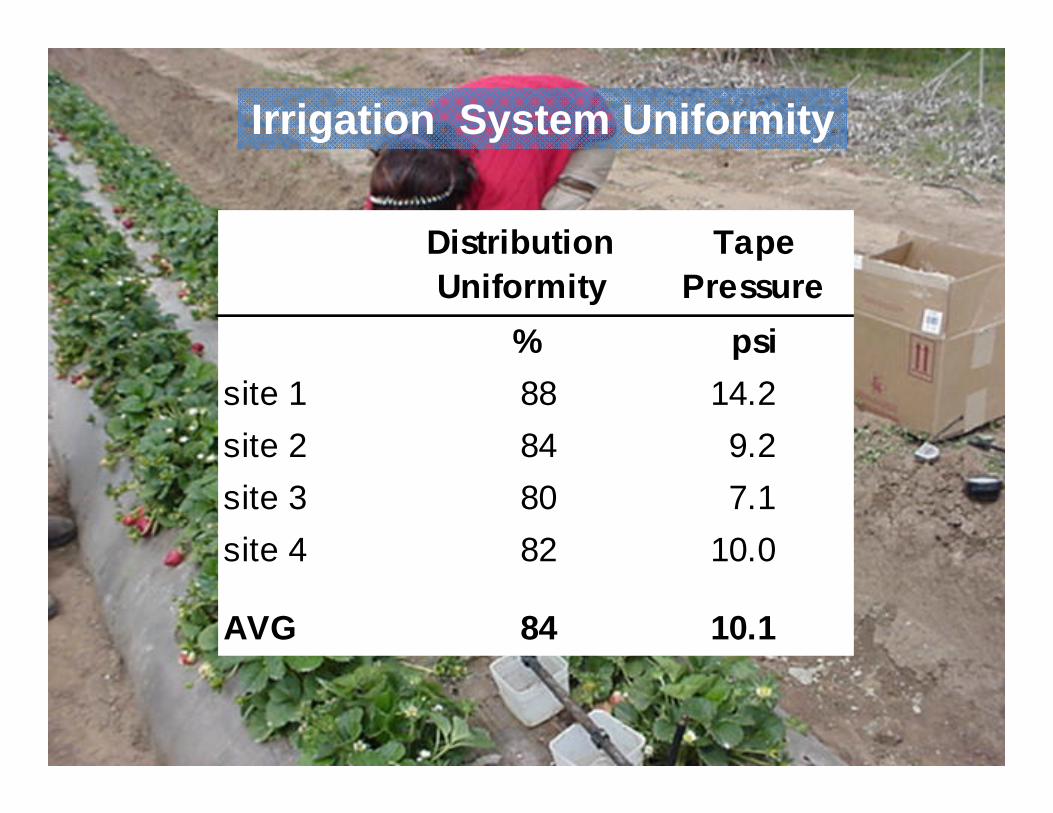
Distribution Uniformity
Tape Pressure
% psisite 1 88 14.2site 2 84 9.2site 3 80 7.1site 4 82 10.0
AVG 84 10.1
Irrigation System Uniformity
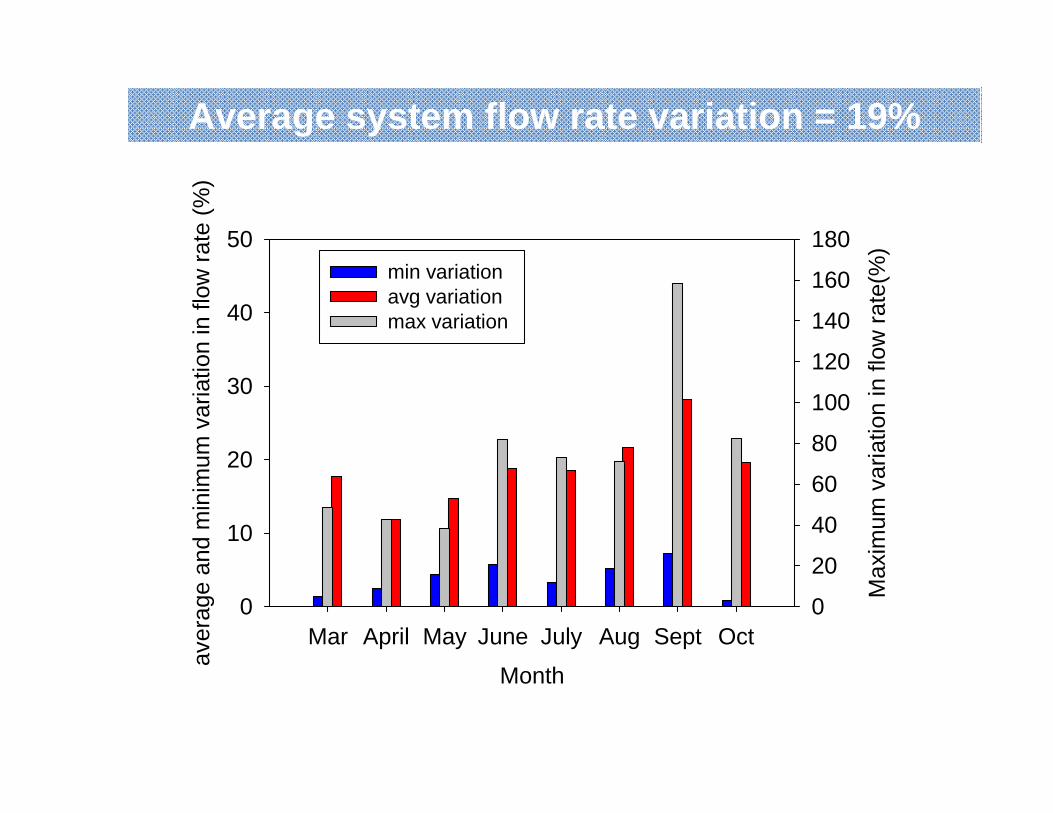
Month
Mar April May June July Aug Sept Oct
aver
age
and
min
imum
var
iatio
n in
flow
rate
(%)
0
10
20
30
40
50
Max
imum
var
iatio
n in
flow
rate
(%)
0
20
40
60
80
100
120
140
160
180min variation avg variation max variation
Average system flow rate variation = 19%
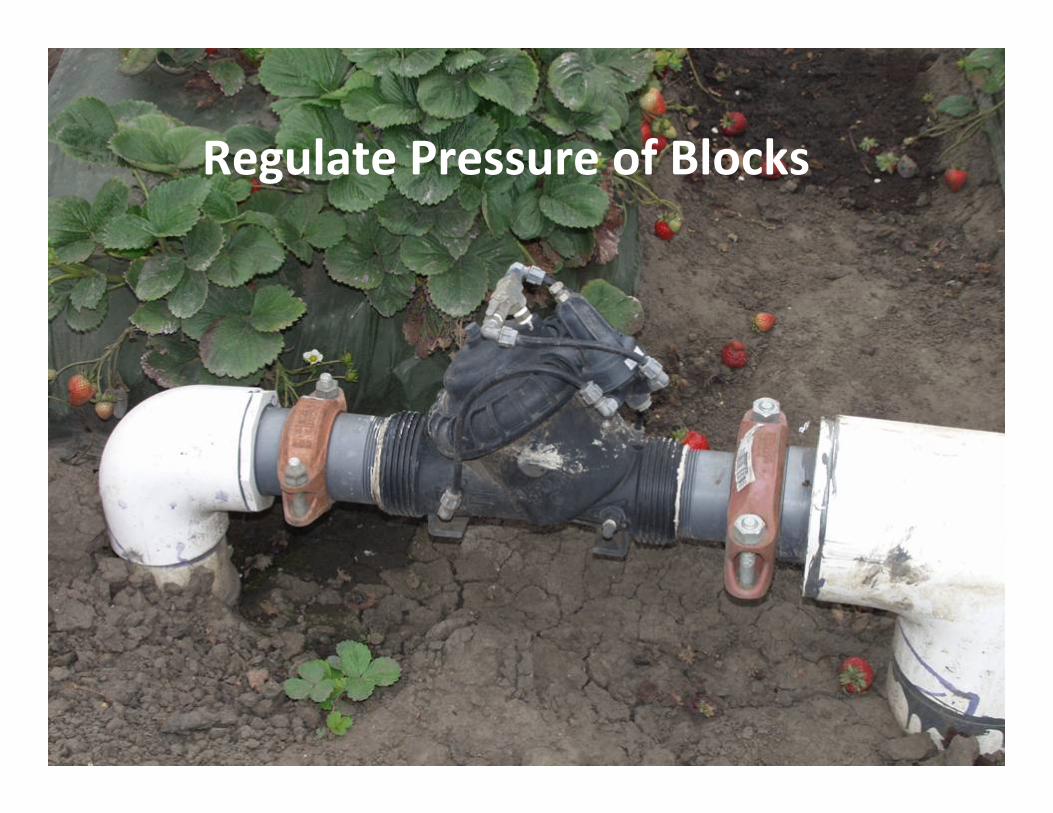
Regulate Pressure of Blocks
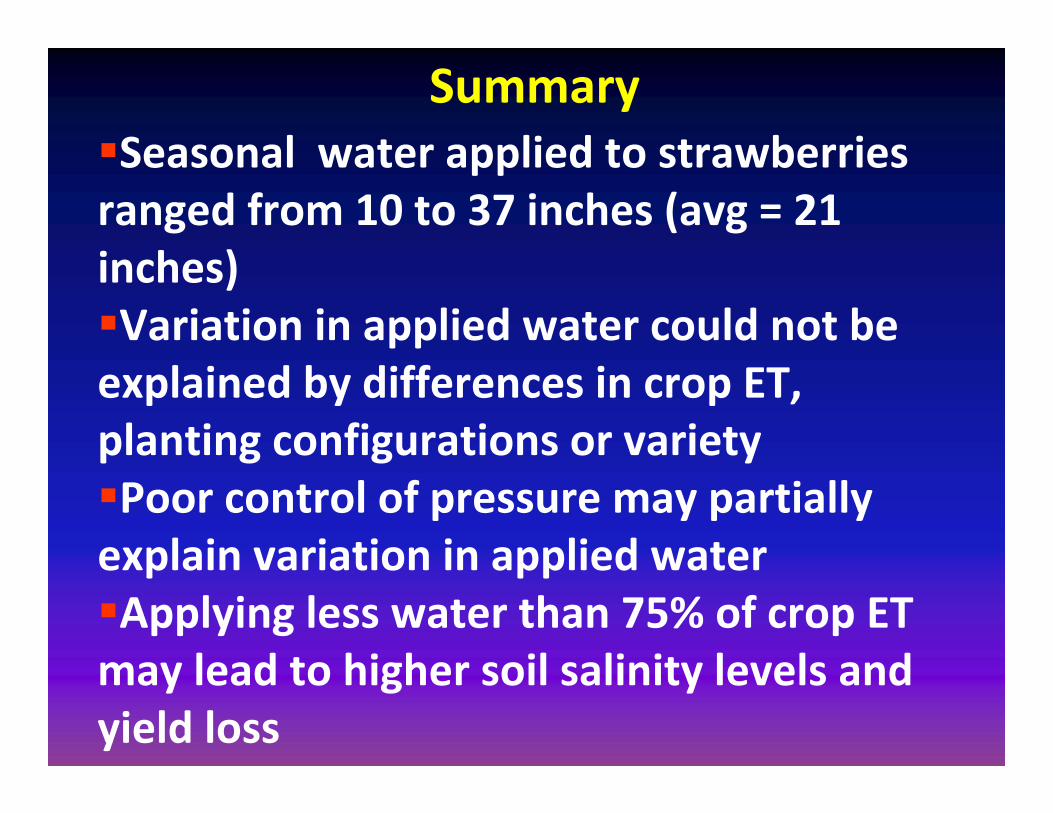
SummarySeasonal water applied to strawberries ranged from 10 to 37 inches (avg = 21 inches)Variation in applied water could not be explained by differences in crop ET, planting configurations or varietyPoor control of pressure may partially explain variation in applied waterApplying less water than 75% of crop ET may lead to higher soil salinity levels and yield loss