Embed Size (px)
Citation preview
Irwin/McGraw-Hill © Andrew F. Siegel, 1997 and 2000
2-1
l Chapter 2 lStatistical Concepts and Language
2.1 The Difference Between the Population and a Sample
2.2 The Difference Between the Parameter and a Statistics
2.3 Measurement Levels
2.4 Sampling Methods
Irwin/McGraw-Hill © Andrew F. Siegel, 1997 and 2000
2-2
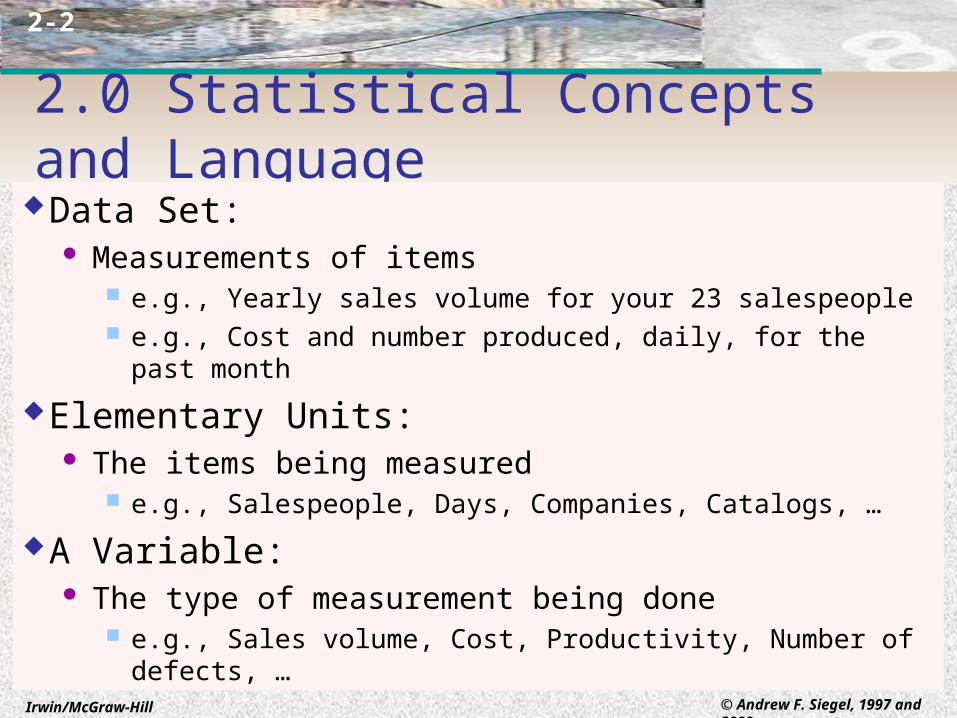
2.0 Statistical Concepts and LanguageData Set:
Measurements of items e.g., Yearly sales volume for your 23 salespeople e.g., Cost and number produced, daily, for the past month
Elementary Units: The items being measured
e.g., Salespeople, Days, Companies, Catalogs, …
A Variable: The type of measurement being done
e.g., Sales volume, Cost, Productivity, Number of defects, …
Irwin/McGraw-Hill © Andrew F. Siegel, 1997 and 2000
2-3
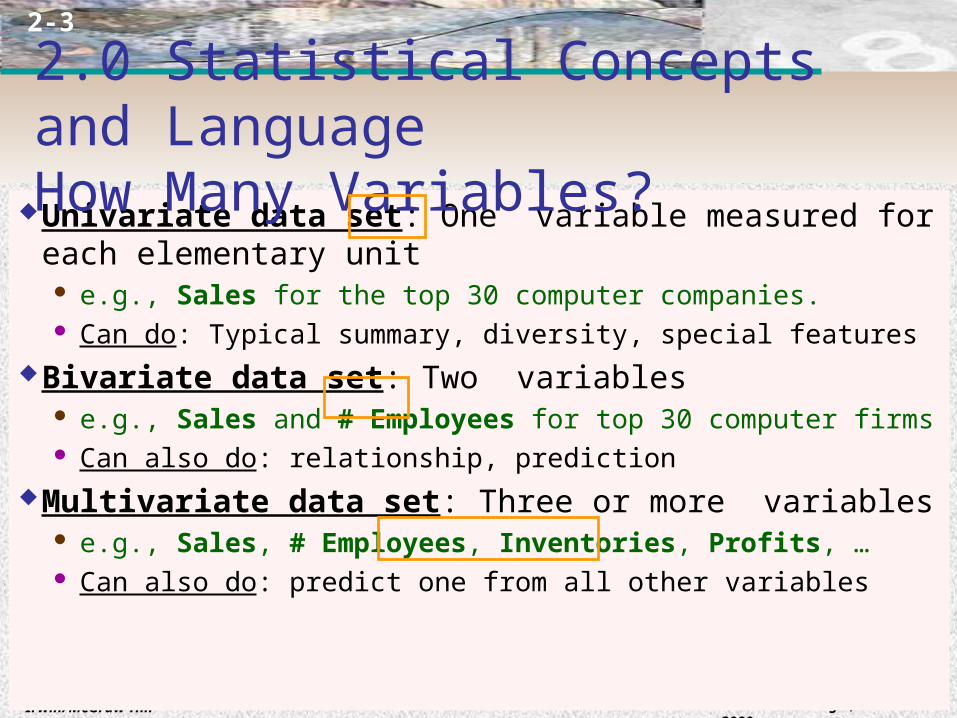
Univariate data set: One variable measured for each elementary unit e.g., Sales for the top 30 computer companies. Can do: Typical summary, diversity, special features
Bivariate data set: Two variables e.g., Sales and # Employees for top 30 computer firms Can also do: relationship, prediction
Multivariate data set: Three or more variables e.g., Sales, # Employees, Inventories, Profits, … Can also do: predict one from all other variables
2.0 Statistical Concepts and LanguageHow Many Variables?
Irwin/McGraw-Hill © Andrew F. Siegel, 1997 and 2000
2-4
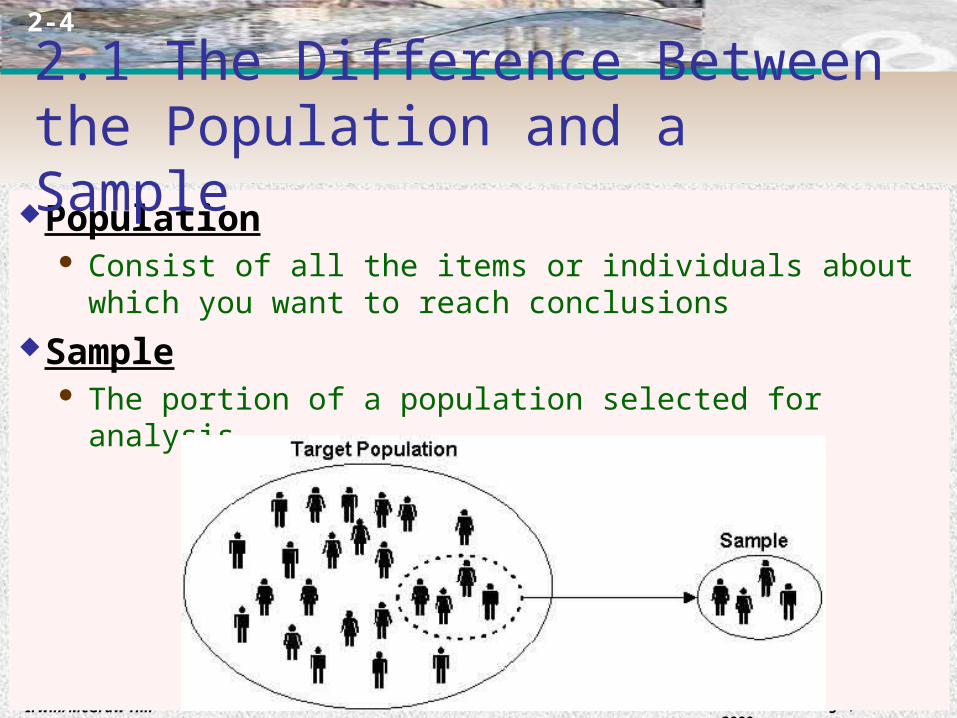
Population Consist of all the items or individuals about which you want to reach
conclusionsSample
The portion of a population selected for analysis
2.1 The Difference Between the Population and a Sample
Irwin/McGraw-Hill © Andrew F. Siegel, 1997 and 2000
2-5
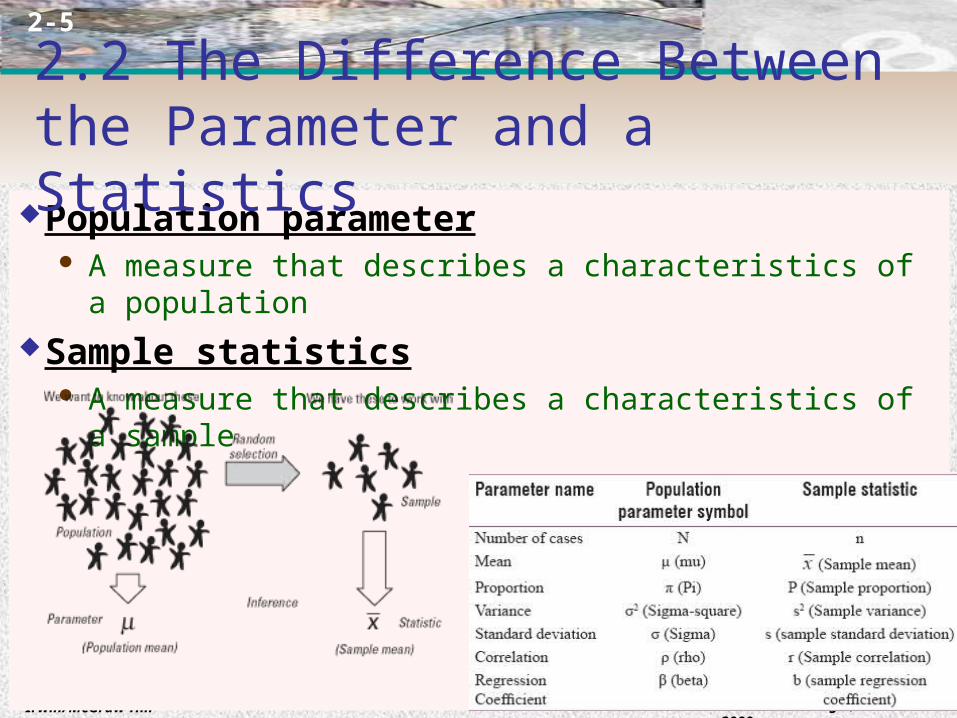
Population parameter A measure that describes a characteristics of a population
Sample statistics A measure that describes a characteristics of a sample
2.2 The Difference Between the Parameter and a Statistics
Irwin/McGraw-Hill © Andrew F. Siegel, 1997 and 2000
2-6
2.3 Measurement LevelsQualitative Variable: Categories
Nominal Variable: categories without meaningful ordering e.g., State, Type of business, Field of study Can count
Ordinal Variable: Categories with meaningful ordering e.g., The ranking of favorite sports, the order of people's
place in a line, the order of runners finishing a race Can rank, count
Irwin/McGraw-Hill © Andrew F. Siegel, 1997 and 2000
2-7
2.3 Measurement LevelsQuantitative Variable: Interval and Ratio
Interval Variable: like ordinal except we can say the intervals between each value are equally split e.g., temperature Can add, rank, count, without true zero
Ratio Variable: interval data with a natural zero point e.g., Time and weight
Can add, rank, count, with true zero
Irwin/McGraw-Hill © Andrew F. Siegel, 1997 and 2000
2-8
2.4 Sampling MethodsType of Sampling Method
Probability Sampling Simple Random Sampling Stratified Sampling Cluster Sampling Systematic Sampling
Nonprobability Sampling Convenience Sampling

Irwin/McGraw-Hill © Andrew F. Siegel, 1997 and 2000
2-9
2.4 Sampling MethodsProbability Sampling
Simple Random Sampling every item from a frame has the same chance of selection as
every other item.
Irwin/McGraw-Hill © Andrew F. Siegel, 1997 and 2000
2-10
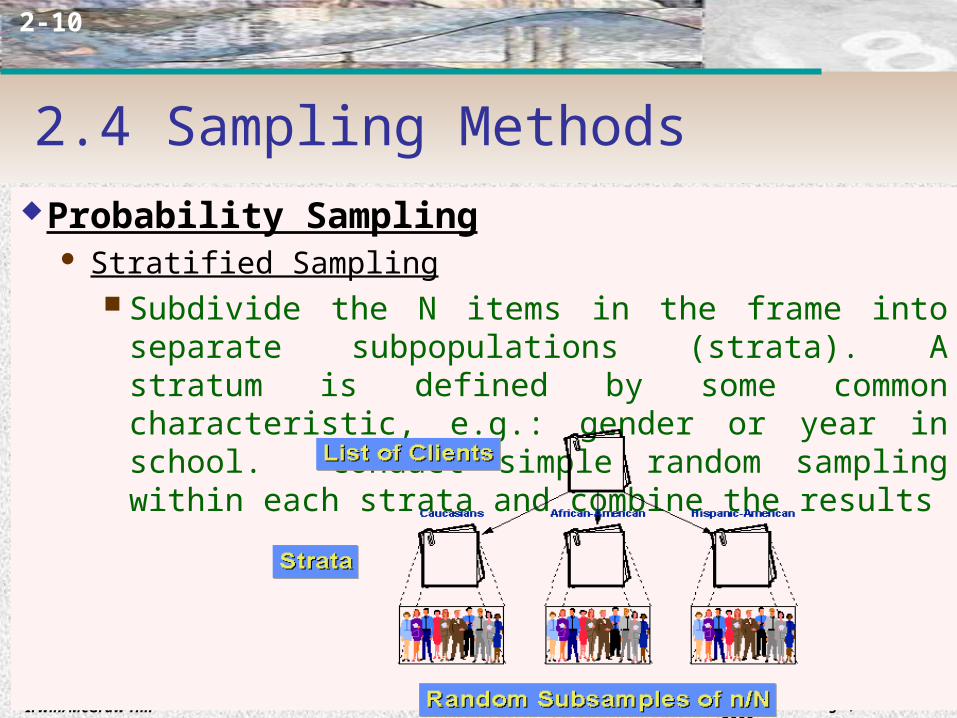
2.4 Sampling MethodsProbability Sampling
Stratified Sampling Subdivide the N items in the frame into separate
subpopulations (strata). A stratum is defined by some common characteristic, e.g.: gender or year in school. Conduct simple random sampling within each strata and combine the results
Irwin/McGraw-Hill © Andrew F. Siegel, 1997 and 2000
2-11
2.4 Sampling MethodsProbability Sampling
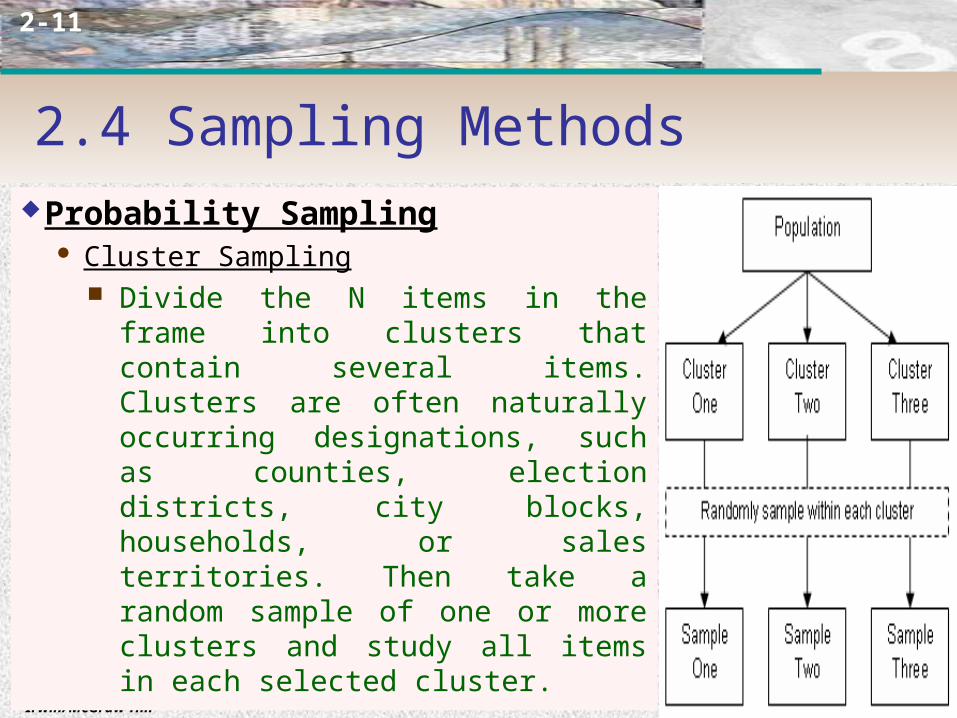
Cluster Sampling Divide the N items in the frame into
clusters that contain several items. Clusters are often naturally occurring designations, such as counties, election districts, city blocks, households, or sales territories. Then take a random sample of one or more clusters and study all items in each selected cluster.
Irwin/McGraw-Hill © Andrew F. Siegel, 1997 and 2000
2-12
2.4 Sampling MethodsProbability Sampling
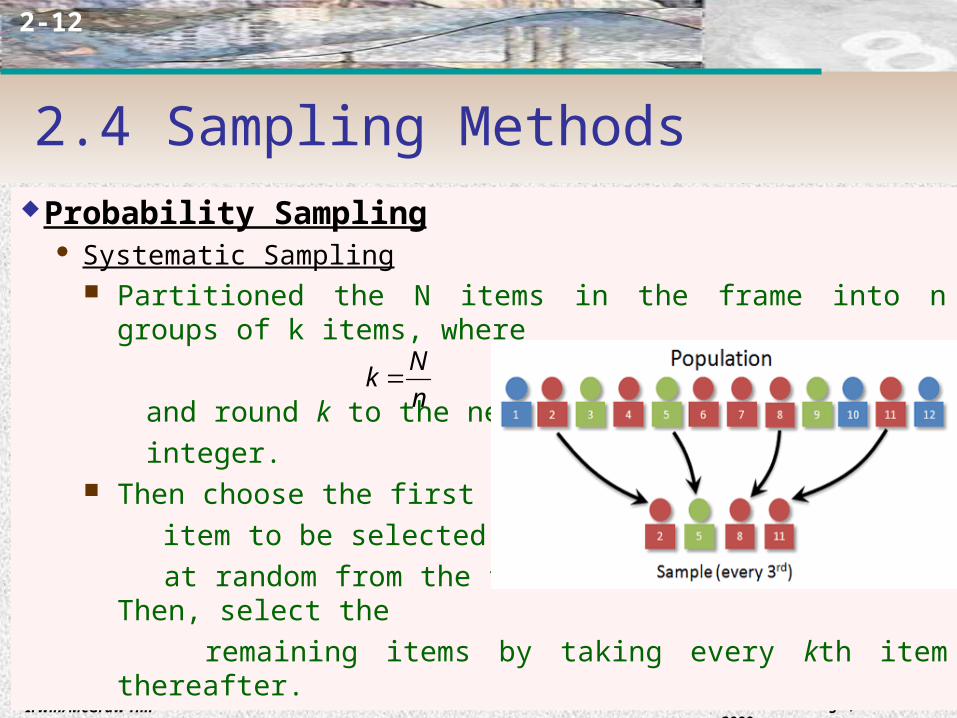
Systematic Sampling Partitioned the N items in the frame into n groups of k items,
where
and round k to the nearest
integer. Then choose the first
item to be selected
at random from the first k items in the frame. Then, select the
remaining items by taking every kth item thereafter.
Nk
n
Irwin/McGraw-Hill © Andrew F. Siegel, 1997 and 2000
2-13
2.4 Sampling MethodsNonprobability Sampling
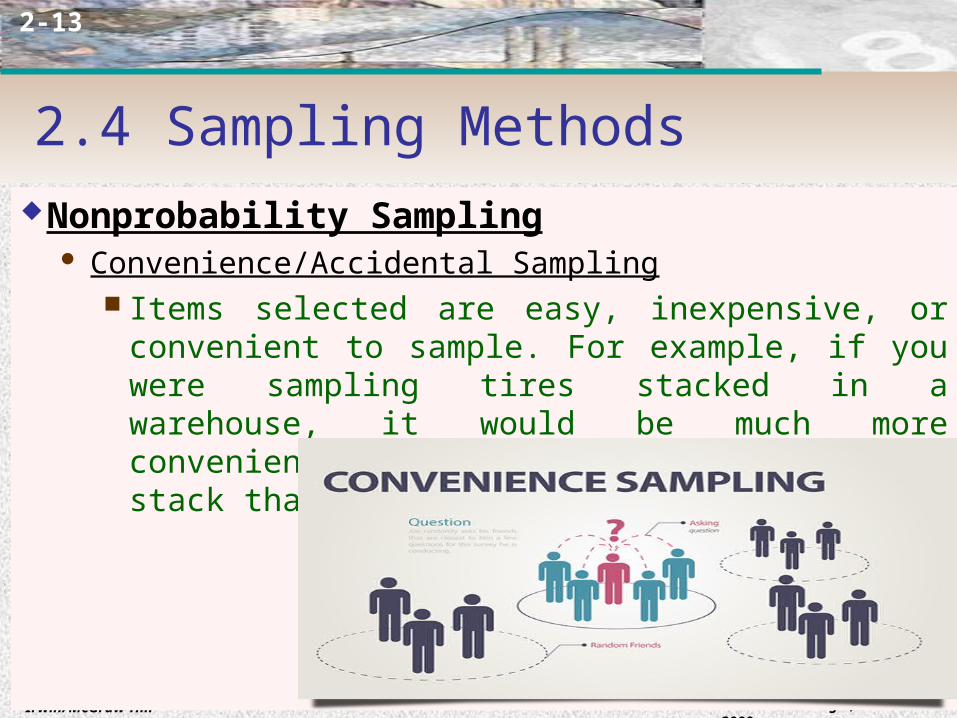
Convenience/Accidental Sampling Items selected are easy, inexpensive, or convenient to sample.
For example, if you were sampling tires stacked in a warehouse, it would be much more convenient to sample tires at the top of a stack than tires at the bottom of a stack.


![[Thor a. Hansen, Irwin L. Slesnick] Adventures in (BookFi.org)](https://img.pdfslide.net/doc/110x75/55cf92d0550346f57b99c681/thor-a-hansen-irwin-l-slesnick-adventures-in-bookfiorg.jpg)