Embed Size (px)
Citation preview
Is Advertising for Losers? An Empirical Study from a Value Creation–Value Capturing Perspective
Koen Tackx, Sandra Rothenberger and
Paul Verdin
Does advertising lead to higher profits? This question has occupied both academic researchers and company executives for many decades. Arguments have gone in both directions, and evidence is mixed at best. Re-examining the
question from a value creation and value capturing perspective as introduced in the strategic management and marketing literature, this article attempts to re-
interpret and reconcile the different views and empirically validate the resulting hypotheses. Using a database of the top 500 brands of established companies during the period 2008–2012, we find that advertising spending has no
significant impact on profitability, in contrast with brand value and innovation (the latter also positively affects brand value creation). In addition, advertising
spending actually weakens the positive effect of innovation on profitability. These findings provide support for the view that advertising in and of itself does not improve profitability. Rather, its effect is positive only when it acts to support
customer value creation, based on brand value and/or innovation activities.
Keywords: advertising effectiveness, brand value, effectiveness of research and development, innovation, profitability drivers, value creation, value capturing
CEB Working Paper N° 15/034
August 2015
Université Libre de Bruxelles - Solvay Brussels School of Economics and Management
Centre Emile Bernheim
ULB CP114/03 50, avenue F.D. Roosevelt 1050 Brussels BELGIUM
e-mail: [email protected] Tel.: +32 (0)2/650.48.64 Fax: +32 (0)2/650.41.88
1
Is Advertising for Losers?
An Empirical Study from a Value Creation–Value Capturing Perspective
Koen Tackx
Solvay Brussels School of Economics and Management
Vlerick Business School
Sandra Rothenberger
Solvay Brussels School of Economics and Management
Paul Verdin
Solvay Brussels School of Economics and Management
Mossavar-Rahmani Center for Business and Government, Harvard Kennedy School
Keywords: advertising effectiveness, brand value, effectiveness of research and
development, innovation, profitability drivers, value creation, value capturing
Abstract
Does advertising lead to higher profits? This question has occupied both academic
researchers and company executives for many decades. Arguments have gone in both
directions, and evidence is mixed at best. Re-examining the question from a value creation
and value capturing perspective as introduced in the strategic management and marketing
literature, this article attempts to re-interpret and reconcile the different views and
empirically validate the resulting hypotheses. Using a database of the top 500 brands of
established companies during the period 2008–2012, we find that advertising spending has
no significant impact on profitability, in contrast with brand value and innovation (the latter
also positively affects brand value creation). In addition, advertising spending actually
weakens the positive effect of innovation on profitability. These findings provide support for
the view that advertising in and of itself does not improve profitability. Rather, its effect is
positive only when it acts to support customer value creation, based on brand value and/or
innovation activities.
2
Introduction
Is advertising increasing or decreasing company profits? For decades, marketers and finance
people in both academia and the corporate world have asked this question (e.g., Rust et al.,
2004). However, marketing directors are still faced with the popular conundrum that though
roughly half of their marketing budget might be wasted, they do not know which half.
Rarely have alternative views on the relationship between key economic and business
variables been so divergent, with respect to both theory and empirical results. More than 50
years ago, the Journal of Marketing published an article titled “What about the Relationship
among Sales, Advertising, and Earnings?” (Twedt and Knitter, 1964); yet, so far, a
universal, crystal clear, and undisputed answer has not been achieved.
Over the years, the discussion on the effectiveness of advertising has become polarized, and
two opposite views labeled “advertising as market power” and “advertising as information”
(Mitra and Lynch, 1995) have emerged. The former view considers the main beneficiary of
advertising the company spending the money, whereas the latter treats the customer seeing
the advertisement as the main beneficiary. Prior research has focused on developing just
one point of view, rather than building bridges between the two (e.g., Erickson and
Jacobson, 1992; Bahadir et al., 2009; Taylor, 2013). To close this gap, in this article we
discuss this issue from a different angle.
We refer to the strategic management domain to shed new light on the discussion by (re-
)introducing the concepts of value creation (for the customer) and value capturing (for the
shareholder). Building on industrial organization theory, we develop and test a model that
analyzes the influences of advertising, brand value, and innovation on profitability. The
advantage of this angle is that the different beneficiaries of the traditional views are reunited
into one model.
The structure of this article is as follows: we begin with a literature review to develop our
hypotheses and then describe the model to be tested empirically. Next, we present the
detailed composition of the data and the results of the empirical research. Finally, we discuss
the implications for theory and practice, the research limitations, and avenues for further
research.
3
Literature review and hypothesis development
Background
Stemming from industrial organization theory, two major “schools” of thought on advertising
expenditures emerged in the second half of the twentieth century. First, the “power school”
treats advertising as a tool to increase market power (Comanor and Wilson, 1967).
According to this school, advertising expenditure decreases price elasticity, induces
customer loyalty, and allows charging a premium price. As a result, larger brands can raise
an efficient barrier to entry for new competitors (Carlton and Perloff, 1990).
If this notion is valid, just the mere size of a company and its total advertising expenditure
benefit from economies of scale because of fixed costs, access to more effective media, and
the impact of repetition. Marshall (1919, p. 199) described the third point as follows: “The
chief influence of such advertisement is exerted, not through the reason, but through the
blind force of habit: people in general are, for good and for evil, inclined to prefer that which
is familiar to that which is not.” Thus, it is no surprise that followers of this school observe
several benefits, including increased sales and market share (Bahadir et al., 2009),
increased profits (Eng and Keh, 2007) and increased market value (Erickson and Jacobson,
1992). The benefits of advertising also go beyond the boundaries of the firm in that
“advertising can also act as a signal of financial well-being or competitive viability of the
firm” (Joshi and Hanssens, 2010, p. 22) and, as such, can increase the salience among
investors (Srinivasan and Hanssens, 2009).
The second major school, called the “information school” (Nelson, 1974), refers to the
benefits that advertising can generate for consumers. Advertising informs consumers about
(new) products and services, and as such, demand is expanded and competition stimulated
(Ali Shah and Akbar, 2008). Because advertising information also contains pricing data,
customers become more price sensitive and prices are lowered. Part of the advertising
industry (e.g., Deloitte, 2013), as well as some academic literature (e.g., Taylor 2013),
embraces this school of thought.
In the past decade, an alternative school of thought has emerged, which we call value
creation and capture, or VC2 (Hawawini et al., 2004). This view derives less from the
advertising domain and more from the strategic management and marketing fields.
4
According to this view, to create long-term shareholder value the primary focus of a
company is on developing a compelling and valuable offer, or the so-called value
proposition. Here, it is up to customers to decide whether the proposed offer creates value
for them. Following this approach, companies develop differentiated product and service
offerings through innovation and publicize these offerings to the market through, in some
cases, specific advertising, highlighting the value of these offerings to customers. In this
framework, research and development (R&D) is deemed the cornerstone of value creation
because its outcome is superior products and distribution processes (Mizik and Jacobson,
2003), despite uncertainty and risks (O’Brien et al., 2013).
For offerings that are not compelling enough, companies can increase advertising spending
to “compensate” for the lack of attractiveness (Larreche, 2008). Conversely, companies
whose products or services are convincing enough, can decrease their advertising
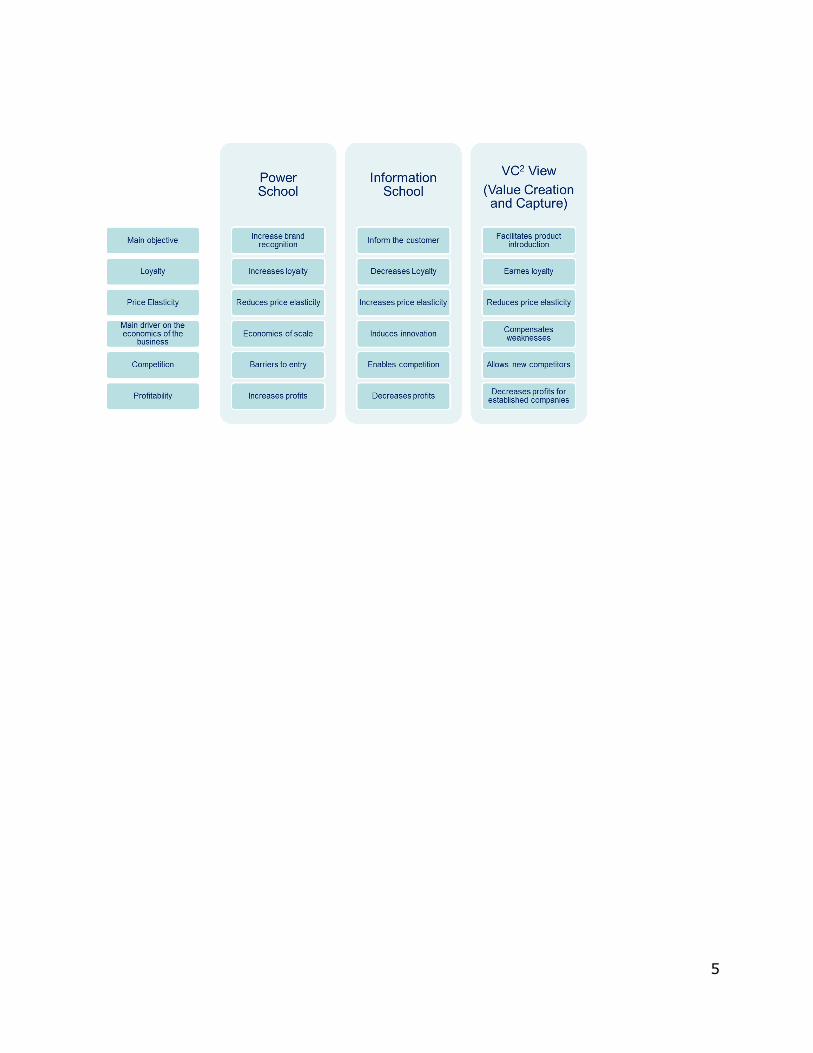
expenditure and create superior value for shareholders. Table 1 summarizes the different
views of the impact of advertising according to the different schools.
Table 1 Summarized view of the impact of advertising on corporate performance
5
6
Advertising
The traditional (power school) logic driving advertising is as follows: a company takes an
action (advertising) that has an impact on the customer (change in perception of needs
and/or expectation), such that he or she takes an action (purchase) that modifies the firm’s
position in the market (e.g., increased market share; Chauduri, 2002), thus affecting its
financial metrics (e.g., profit; Sriram and Kalwani, 2007) and, in turn, eventually influencing
the value of the firm (Rust et al., 2004) and reducing its systemic risk (McAlister et al.,
2007). Attempts to quantify and measure this process, however, have confronted the major
challenge of a large amount of intangible factors (Mittal, 1999) that influence the overall
customer perception. At the end of the process, it is up to customers to judge the usefulness
of the communication (Mittal, 1994).
Advertising can play a key role in VC2. The information aspect as described previously
informs customers about new or changed offerings1 or reminds them of existing ones. Only
if customers appreciate the value of this offering, however, will the brand value of the
company increase. By contrast, advertising as such should not make a difference for
products or services known to the public. In this case, the main role of advertising is to
capture value by establishing a barrier to enter the market for competitors (Sutton, 1991) or
by compensating for weaknesses in the product or service offering (Larreche, 2008).
If we take the different observations into account, four financial consequences of advertising
can arise. First is a direct negative impact on profits, which is the most straightforward—
because advertising is a cost, profits will decline. The second is a direct positive impact on
sales due to the information aspect. This effect has been subject to extensive research with
different results (see Erickson and Jacobson, 1992, for an overview). In developed markets,
an important goal of advertising is to move market share between existing players. As such,
advertising can reach rather homogeneous levels within an industry (Mauri and Michaels,
1998). This type of advertising should not create value over the long run because this kind
of “shouting out loud” can be imitated by competition. Third is an indirect negative impact
on profit due to the compensation effect, as companies that invest more in advertising might
“compensate” for shortcomings in their offering. Fourth is an indirect positive effect on the
1 When referring to the offering, we do not limit this to the physical characteristics of the product or service, but
also include the way it is brought to customers, such as through packaging, distribution, pricing, experience, and servicing. This necessity was also observed by researchers in the advertising domain; for example, Büschken (2007) found that the quality and size of the sales channels also influenced advertising efficiency.

7
value of the company due to the branding aspect. With regard to the third and fourth points,
we hypothesize that the third will outweigh the fourth point because brand advertising
without a good enough underlying value offering is not sustainable. Taking these points
together, we posit the following:
Hypothesis 1: Advertising spending has a negative impact on firm profitability.
Advertising expenditure is considered a discretionary flow of costs. Thus, in the next section
we focus on its possible impact on the stock of value that resides in the brand value.
Brand value
Brand value (or equity) is the term used to measure financial value of the brands companies
possess (Kirk et al., 2013); it can be one of the most valuable intangible assets of a
company (Keller and Lehmann, 2006). Indeed, brand equity is an indicator of the customer
value that the firm has created over time and therefore does not need to depend on a short-
term indicator or measure but rather is the result of long-term efforts (“stock” or “strategic
resource” concept instead of “flow” or “current expense”). Brand value reflects the additional
value (i.e., discounted cash flow) that accrues to a firm because of the brand name that
does not accrue to a similar non-branded product (Keller and Lehmann, 2006). A large
number of different methodologies can measure brand value, some of which focus on “the
effects of brand equity on the demand and supply functions, in order to determine the
influence of the brand in the decision making process” (Salinas and Ambler, 2009, p. 46).
Such a methodology largely corresponds to our customer-oriented view on brand value, and
we refer to this methodology in the empirical part of this research.
According to prior studies, a strong brand drives much of the benefits that were historically
attributed to advertising by the power school: ability to charge a price premium (Bick,
2009), lower price elasticity (Keller and Lehmann, 2006), a way to attract new customers
(Bick, 2009), lower sensitivity to competitors’ prices (Keller and Lehman, 2006), and higher
barriers to entry (Eng and Keh, 2007). Taking these positive elements into account, it is no
surprise that brand value has a positive impact on profitability (Eng and Keh, 2007).
Following that logic, we posit the following:

8
Hypothesis 2: Brand value has a positive impact on firm profitability.
Table 2
The supposed impacts on profitability according to the different schools
To compare our view with the more traditional views, we highlight the supposed effects of
advertising and branding on profitability in Table 2. The power school follows the logic of
advertising’s capability of increasing brand value and, thus, customer loyalty, both of which
are expected to drive profitability. According to the information school, advertising
stimulates competition and thus decreases profits. This school is not very explicit on the
effects of branding; rather, it conceptualizes branding’s main function as protecting
innovation (Taylor, 2013). Finally, the VC2 contends that strong advertising for established
companies2 is a sign of compensating weaknesses in offerings, thus decreasing profits.
Conversely, it maintains that brand value is the way to induce customers to appreciate
offerings. That is, strong brand value leads to higher profitability.
2 A clear distinction should be made between established and new companies/products/markets because the
information effect of advertising is more relevant for the latter.
9
Innovation
While the role of advertising is still under discussion in the literature (e.g., Taylor 2013),
there is consensus that innovation (often measured by spending on R&D) is an important
driver for value creation (e.g., Mizik and Jacobson, 2003; Larreche, 2008) and thus can lead
to several benefits, including higher sales, higher market share, higher sales growth,
increasing profitability, and market value (Rubera and Kirca, 2012). Because the effect of
R&D can last over time (Ribera and Circa, 2012) and competitors are eager to copy
successful innovations, capturing the value of innovations becomes a key priority for
competitors (Mizik and Jacobson, 2003). Regarding the impact on profitability, we therefore
posit the following:
Hypothesis 3: Innovation has a positive impact on firm profitability.
To create the value of innovations, customers need to be informed and convinced of the
benefits. Firms can leveraged this value either by brand strength (e.g., Apple does not need
to invest in advertising to obtain substantial media coverage for a new product launch) or by
advertising. Communication of the benefits of product innovations enhances their value, and
this effect is stronger for pioneering innovations than for product improvements (Srinivasan
et al., 2009). The interaction between product innovations and communications creates the
ability to increase prices (Cassiman and Vanormelingen, 2013).
It is crucial for innovation approaches to be “optimally configured to both generate and
appropriate value” (Fang et al., 2011, p. 598). This notion is in line with recent analysis
demonstrating that it is not sufficient to create unique assets to capture additional profits as
competition might trigger price wars (Costa et al., 2013). We argue that a stronger brand
value can protect innovation efforts (as measured by R&D expenses) from competitive
attacks. Thus, we propose the following:
Hypothesis 4: Brand value amplifies the positive effect of innovation on firm profitability.
Hypothesis 5: Advertising spending weakens the positive effect of innovation on firm
profitability.
10
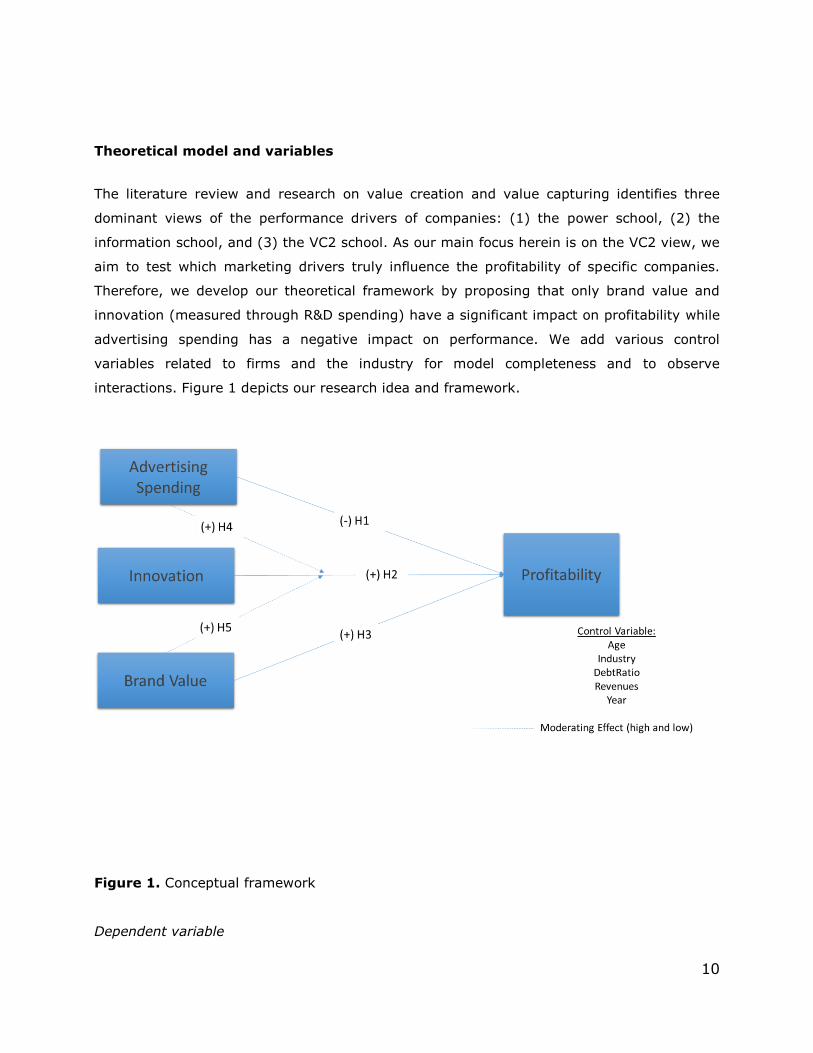
Theoretical model and variables
The literature review and research on value creation and value capturing identifies three
dominant views of the performance drivers of companies: (1) the power school, (2) the
information school, and (3) the VC2 school. As our main focus herein is on the VC2 view, we
aim to test which marketing drivers truly influence the profitability of specific companies.
Therefore, we develop our theoretical framework by proposing that only brand value and
innovation (measured through R&D spending) have a significant impact on profitability while
advertising spending has a negative impact on performance. We add various control
variables related to firms and the industry for model completeness and to observe
interactions. Figure 1 depicts our research idea and framework.
Figure 1. Conceptual framework
Dependent variable
11
The dependent variable is firm profitability in a given year and is primarily measured by net
profit divided by total assets. This measure is an appropriate proxy to determine how much
an investment (in assets) generates, and as such, it is viewed as a measure of how much
value is captured for the shareholder. Although (early) literature on advertising effectiveness
has focused on market share and sales rather than profit, it is increasingly clear that
financial measures related to shareholder return are necessary to examine (Lehmann,
2004). We also consider total shareholder return, but this might be ambiguous because it is
logical that the market only rewards investments in R&D and advertising if these generate
profits (Erickson and Jacobson, 1992). Following the VC2 view, we focus on how much value
is captured from the shareholder; thus, we use the metric of net profit/assets. Doing so has
the disadvantage that we cannot correct for the direct effects of R&D and advertising on
profit because of uncertainty about how much tax benefits these costs generate. Although
we observed effects of advertising on earnings in the first year (Kim and McAlister, 2011),
we assess different time-lag sensitivities to control for the direct effect of R&D and
advertising.
Independent variables
The three independent variables we analyze are advertising expenditures, R&D expenses,
and brand value. For advertising and R&D, we use the expenditures that were reported in
firms’ financial statements in a given year. Brand value reflects the discounted excess value
a brand generates for the company (Doyle, 2008), and we use the values as calculated by
Brandfinance (2014). Brandfinance uses a royalty relief methodology as described by ISO
10668. Such a methodology has several advantages, including taking into account industry-
specific valuations, and is accepted by fiscal authorities (Salinas and Ambler, 2009). The
brand value obtained through this methodology comes from the “brand strength index”, a
royalty rate of the revenues attributed to the brand. Underlying the brand strength index are
30 attributes that represent different stakeholders (e.g., customers, staff, financial, and
external).
Control variables and moderators
12
To increase the relevance of our model and to accommodate the possible interactions, we
include five variables:
Industry variables: We observed important differences between industries in terms of
advertising and R&D spending (e.g., Mauri and Michaels, 1998). Industry effects
accommodate the differences between business-to-business and business-to-consumer,
technology and non-technology (Homburg et al., 2010), and product and service industries
(Bick, 2009). As there are clear overlaps between these categorizations, we include only a
single industry variable to encompass the distinction.
Debt level: Companies with a higher debt level likely have stronger desires to control
expenses, as such debt levels might hamper spending in both R&D and advertising (Erickson
and Jacobson, 1992) and the success of diversification is lower for firms with higher debt
levels (O’Brien et al., 2013). However, companies can obtain tax benefits from deducting
debt as well, so we do not put forth an expectation here.
Age: Older firms may rely more on their reputation, while younger firms likely need to invest
more in advertising to make their products known to the market (Bahadir et al., 2009). In
addition, the effectiveness of product innovations is greater for younger firms (Cassiman and
Vanormelingen, 2013).
Size: Economies of scale can decrease the unit cost of advertising (Levitt, 1983; ) and
perceived globalness can increase the brand value (Steenkamp et al., 2003), and thus we
introduce revenues as a variable to measure firm size.
Year: Because the general economic climate as well as firm expenditures might affect
consumers’ confidence in brands, we include the years 2010, 2011, and 2012 as a variable.
At the time of analysis, these were the most recent data available. Adding less recent years
has an impact on the availability of the firm data.
Data
We describe the hypotheses tested as well the impact of the control variables in the
following formula:

13
Pit= b*ait + b1*(ADV)it + b2*(I)it +b3*(BV)it + b4*(ADV*I)it + b5*(BV*I)it + [b6*(IND)it +
b7*(D)it + b8*(A)it + b9*(Y)it + b10*(S)it] + e
where “P” is profitability, “a” is intercept, “b” are the regression coefficients, “ADV” is
advertising, “BV” is brand value, “I” is innovation (measured by R&D spending), “IND” is the
industry effect, “D” is the debt level, “A” is age, “Y” is the year effect, “Size” is firm size
(measured by revenues), and “e” is the error term. For all the variables, “i” is the company
and “t” the period from which we obtained the data.
To test the hypotheses, we built a database that collects financial, advertising, and brand
data. To do so, we started with the 500 largest brands in the world by using brand value as
calculated by Brandfinance (2014). We focused on brands that were among these largest
brands in 2012 and/or 2008, as our focus was on established companies rather than start-
ups, whose advertising effect we deemed as fundamentally different. We added available
brand values for companies owning multiple large brands. For financial data, we referred to
the Thomson Reuters database, which collects data of companies that publish their financial
results. As such, we excluded private companies from the data set. Industries in which most
of the companies managed a portfolio of unrelated brands, such as tobacco and packaged
foods, were not included. We also excluded banks, mainly because their key financial
metrics are different but also because of their size, as including them would skew the
averages on these metrics. If reported currency was other than US dollars, we translated
figures into US dollars by means of Thomson Reuters EIKON using the fiscal year end date
exchange rate. An important filter was that we only included companies that reported both
R&D and advertising expenditure. In the end, we considered 51 companies from eight
different industries for which we observed each individual year from 2010 to 20123. In 2012,
these companies owned US$4.448 billion in assets and made US$210 billion in profits. Their
brand value as estimated in 2012 was US$732 billion.
We divided brand value by revenues to correct for size but also because it seemed the most
logical from a value creation perspective; that is, how much value do customers attribute
(brand value) in terms of money spent (revenues). We use a one-year time lag between the
brand value and the financial data. The logic behind this approach is that the value created
3 We omitted the “crisis” years 2008 and 2009 because the market situation led to extraodinary measures at some
of the companies.
14
at the beginning of the year is compared with the value captured throughout the year. The
net profit, divided by total assets, provides an appropriate representation of potential
shareholder return.
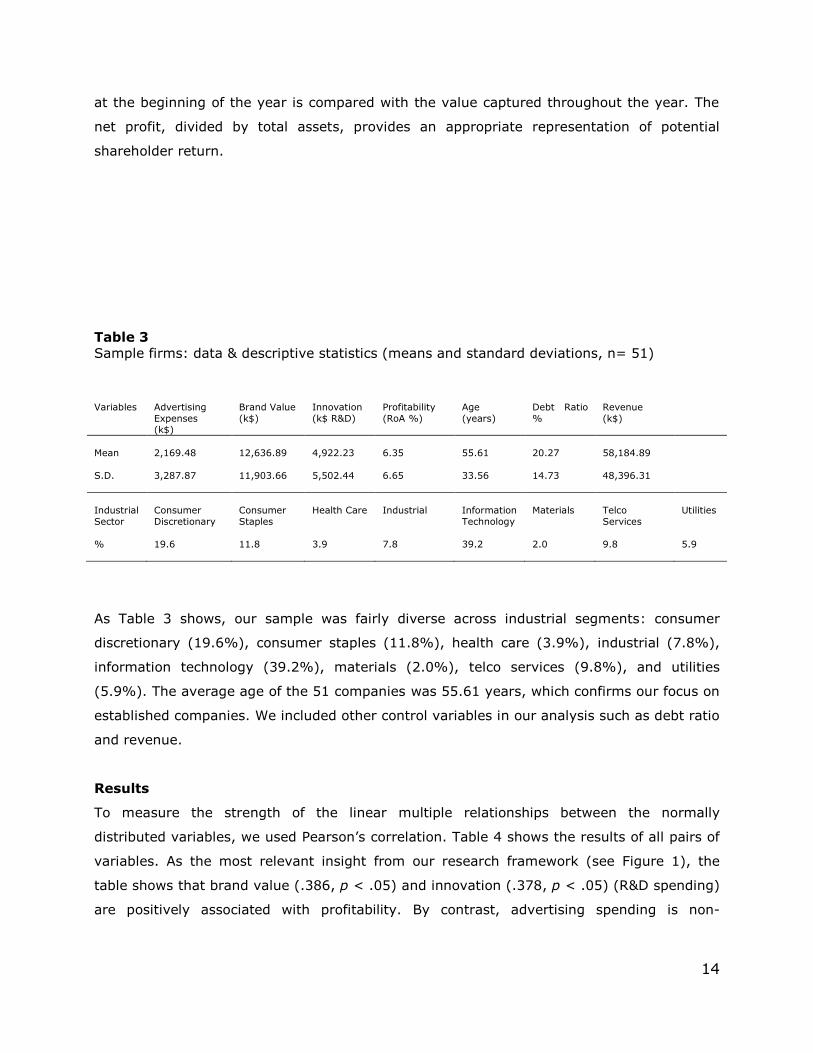
Table 3
Sample firms: data & descriptive statistics (means and standard deviations, n= 51)
Variables Advertising
Expenses (k$)
Brand Value
(k$)
Innovation
(k$ R&D)
Profitability
(RoA %)
Age
(years)
Debt Ratio
%
Revenue
(k$)
Mean 2,169.48 12,636.89 4,922.23 6.35 55.61 20.27 58,184.89
S.D. 3,287.87 11,903.66 5,502.44 6.65 33.56 14.73 48,396.31
Industrial
Sector
Consumer
Discretionary
Consumer
Staples
Health Care Industrial Information
Technology
Materials Telco
Services
Utilities
% 19.6 11.8 3.9 7.8 39.2 2.0 9.8 5.9
As Table 3 shows, our sample was fairly diverse across industrial segments: consumer
discretionary (19.6%), consumer staples (11.8%), health care (3.9%), industrial (7.8%),
information technology (39.2%), materials (2.0%), telco services (9.8%), and utilities
(5.9%). The average age of the 51 companies was 55.61 years, which confirms our focus on
established companies. We included other control variables in our analysis such as debt ratio
and revenue.
Results
To measure the strength of the linear multiple relationships between the normally
distributed variables, we used Pearson’s correlation. Table 4 shows the results of all pairs of
variables. As the most relevant insight from our research framework (see Figure 1), the
table shows that brand value (.386, p < .05) and innovation (.378, p < .05) (R&D spending)
are positively associated with profitability. By contrast, advertising spending is non-

15
significantly associated with profitability (.056). The year control variable is associated with
neither the dependent nor the independent variables, indicating that the chosen years
(2010–2012) do not matter for analysis purposes. The rest of the control variables (age,
debt ratio, and revenues) show negative associations with the independent and dependent
variables; only the industry effect indicated a positive association.
16
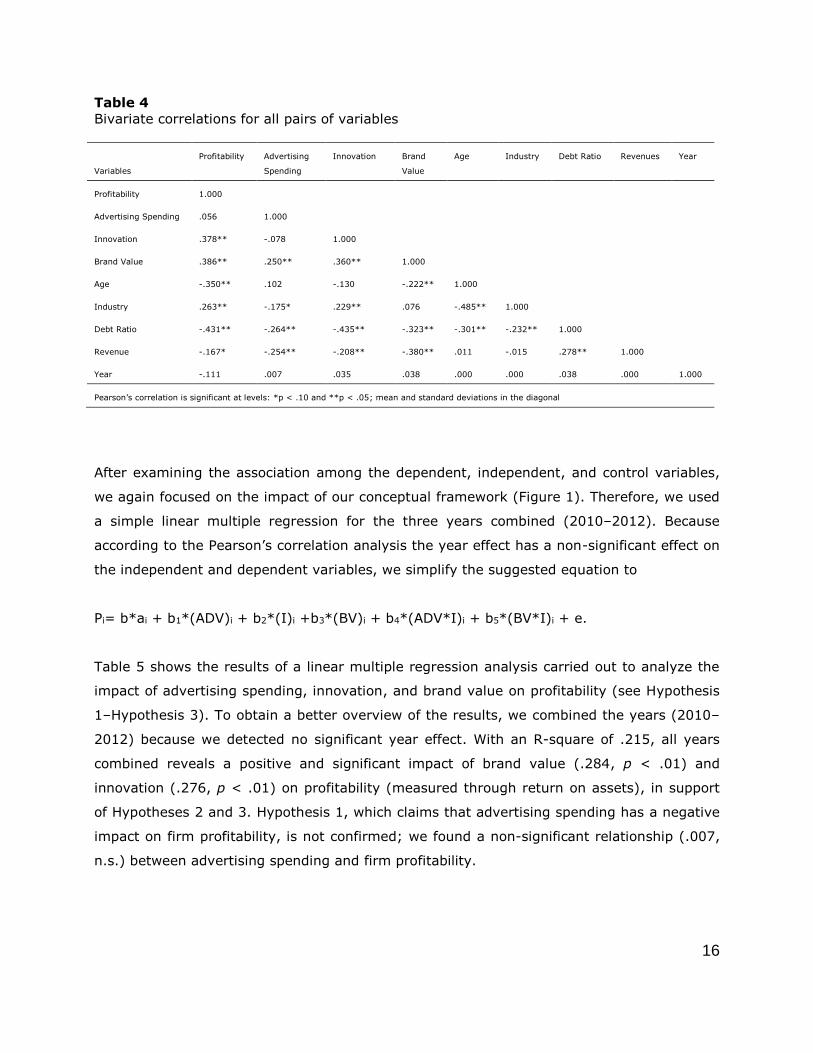
Table 4
Bivariate correlations for all pairs of variables
Variables
Profitability Advertising
Spending
Innovation Brand
Value
Age Industry Debt Ratio Revenues Year
Profitability 1.000
Advertising Spending .056 1.000
Innovation .378** -.078 1.000
Brand Value .386** .250** .360** 1.000
Age -.350** .102 -.130 -.222** 1.000
Industry .263** -.175* .229** .076 -.485** 1.000
Debt Ratio -.431** -.264** -.435** -.323** -.301** -.232** 1.000
Revenue -.167* -.254** -.208** -.380** .011 -.015 .278** 1.000
Year -.111 .007 .035 .038 .000 .000 .038 .000 1.000
Pearson’s correlation is significant at levels: *p < .10 and **p < .05; mean and standard deviations in the diagonal
After examining the association among the dependent, independent, and control variables,
we again focused on the impact of our conceptual framework (Figure 1). Therefore, we used
a simple linear multiple regression for the three years combined (2010–2012). Because
according to the Pearson’s correlation analysis the year effect has a non-significant effect on
the independent and dependent variables, we simplify the suggested equation to
Pi= b*ai + b1*(ADV)i + b2*(I)i +b3*(BV)i + b4*(ADV*I)i + b5*(BV*I)i + e.
Table 5 shows the results of a linear multiple regression analysis carried out to analyze the
impact of advertising spending, innovation, and brand value on profitability (see Hypothesis
1–Hypothesis 3). To obtain a better overview of the results, we combined the years (2010–
2012) because we detected no significant year effect. With an R-square of .215, all years
combined reveals a positive and significant impact of brand value (.284, p < .01) and
innovation (.276, p < .01) on profitability (measured through return on assets), in support
of Hypotheses 2 and 3. Hypothesis 1, which claims that advertising spending has a negative
impact on firm profitability, is not confirmed; we found a non-significant relationship (.007,
n.s.) between advertising spending and firm profitability.

17
To better understand the moderation effect of high and low advertising spending and high
and low brand value on the impact of innovation (R&D spending) on profitability, we
conducted a multi-group analysis with structural equation modeling using AMOS 22. Overall,
the goodness-of-fit indices suggest that the proposed model achieved a good fit to the
observed data. Table 6 shows the results of a moderating effects, indicating support for
Hypothesis 4 that the positive effect of innovation on profitability is amplified by high (.418,
p < .01) and low (.256, p < .01) brand value. Regarding Hypothesis 5, we conclude that the
positive effect of innovation on profitability is weakened by advertising spending: high
advertising spending effect has no significant impact on the relationship between innovation
and profitability (.246, n.s.); however, low advertising spending reveals a significant impact
(.415, p < .01).
Table 5
Linear multiple regression for advertising spending, innovation, and brand value on return
on assets
Years combined
R² .215
Loading SE Beta T P Hypothesis
(Constant) 2.245 .825 2.720 .007
Advertising spending .004 .045 .007 .091 .927 H1
Innovation .187 .054 .276 3.489 .001 H2
Brand Value .073 .021 .284 3.483 .001 H3
Dependent variable: Return on Assets
Table 6
Moderating effect of advertising spending and brand value on the effect of innovation on
profitability
Innovation → Profitability
Estimate SE Beta C.R. P R² Hypothesis
High Advertising spending .242 .162 .246 1.493 .135 .061 H5 √
Low Advertising spending .259 .053 .415 4.923 *** .172 H5 √
High Brand Value .208 .063 .418 3.298 *** .175 H4 √
Low Brand Value .197 .075 .256 2.642 *** .065 H4 √
*** < .01; ** < .05; * < .1; ns= non-signifiant

18
Limitations and avenues for further research
This article has several limitations that might lead to further research. First, the hypotheses
are only valid for established brands and products. For new products or brands, the
information school approach would likely lead to a stronger effect, as long as the value offer
was compelling enough. To test Hypothesis 1, we also assumed that all brands spend on
advertising an amount above the “minimal” threshold to communicate their offering. In
addition, an important nuance that we did not take into account was the quality of
advertising. Spending levels are an element that can be relatively easily to imitate. The
creative impact might be the real differentiator in terms of competitive advantage (Ericson
and Jacobson, 1992). Most studies investigating the impact of advertising through financial
measures implicitly assume that in the long run, all creations reach the same level of
effectiveness. The same reasoning applies to R&D spending; using R&D expenses as a
metric might not be flawless, but it at least demonstrates the firm’s interest and
commitment in innovation.
Second, we considered only mono-brand companies; however, prior research indicates that
“a larger brand portfolio positively impacts on advertising efficiency” (Büschken, 2007, p.
68). Third, we only included “paid” advertising and, as such, do not included “earned” media
such as press or social media, though these also might affect the firm’s results (Stephen and
Galak, 2012). A similar shortcoming is that online advertising might be relatively cheaper
than offline advertising and companies that switch earlier to online might benefit from this
(temporary) price advantage.
Fourth, as mentioned previously, we used expenditures as a measure of advertising and
R&D. However, these are “input” measures, and thus they omit the execution aspect.
McAlister et al. (2007) suggest using disaggregated measures to overcome this issue. Using
survey methodology to ask people to assess the efficiency and effectiveness of advertising
could be a solution, but this has the disadvantage of being less objective than the input
figures we used.
Conclusions and implications for management
A debate that has remained unresolved for decades—namely, whether advertising is good or
bad for profitability—seems to miss an important angle, as this debate centers mainly on
19
traditional industrial organization arguments. In parallel with this debate, we believe that
arguments in practice on the “right” level of advertising that companies should use may be
ill-framed or even missing the point. More recent views of the critical role of value creation
show an alternative path to generating and explaining profitability. That is, it is the
sustained creation of customer value, achieved through innovation and brand value creation,
that delivers (long-term) profitability.
In a similar vein, our empirical results suggest that advertising will only help in the process
insofar as it supports genuine and sustained value creation; if not, advertising will have little
effect or even a negative effect, because it risks wasting scarce resources that could have
been better spent on the creation of customer value. Advertising seems useful to
communicate information about the value proposition of (new) products and services, but
for established markets, its potential to increase profitability seems limited. In summary, our
research confirms that advertising as such does not create value but rather can facilitate
value capturing, if and only if underlying customer value is also created.

20
References
Ali Shah, S. Z., Akbar, S. 2008. Value relevance of advertising expenditure: a review of the
literature. International Journal of Management Reviews 10 (4), 301-325.
Bahadir, S. C., Bharadwaj, S., Parzen, M. 2009. A meta-analysis of the determinants of
organic sales growth. International Journal of Research in Marketing 26 (4), 263-275.
Bick, G. N. 2009. Increasing shareholder value through building customer and brand
equity. Journal of Marketing Management 25 (1-2), 117-141.
Brandfinance, 2014. Global 500 2014: The world’s most valuable brands.
Büschken, J. 2007. Determinants of brand advertising efficiency: evidence from the German
car market. Journal of Advertising 36 (3), 51-73.
Carlton, D. W., & Perloff, J. M. 1990. Modern industrial organization. Scott, Foresman/Little,
Brown Higher Education.
Cassiman, B., Vanormelingen, S. 2013. Profiting from innovation: firm level evidence on
markups. FEB Research Report MSI_1311.
Chaudhuri, A. 2002. How brand reputation affects the advertising-brand equity link. Journal
of Advertising Research 42 (3), 33-43.
Comanor, W. S., & Wilson, T. A. 1972. Advertising market structure and performance.
Journal of Reprints Antitrust Law & Economics., 4, 25.
Costa, L. A., Cool, K., & Dierickx, I. 2013. The competitive implications of the deployment of
unique resources. Strategic Management Journal, 34(4), 445-463.
Deloitte 2013. Advertising Pay: How Advertising Fuels the UK Economy. London: the
advertising association.
Doyle, P. 2009. Value-based marketing: Marketing strategies for corporate growth and
shareholder value. John Wiley & Sons.
21
Eng, L. L., Keh, H. T. 2007. The effects of advertising and brand value on future operating
and market performance. Journal of Advertising 36 (4), 91-100.
Fang, E., Palmatier, R. W., & Grewal, R. 2011. Effects of customer and innovation asset
configuration strategies on firm performance. Journal of Marketing Research, 48 (3), 587-
602.
Hawawini, G., Subramanian, V., Verdin, P. (2004). Creating and capturing value: the
strategic drivers of performance. Working paper, INSEAD & Solvay Business School,
Belgium.
Homburg, C., Klarmann, M., Schmitt, J. 2010. Brand awareness in business markets: when
is it related to firm performance? International Journal of Research in Marketing 27 (3), 201-
212.
Joshi, A., Hanssens, D. M. 2010. The direct and indirect effects of advertising spending on
firm value. Journal of Marketing 74 (1), 20-33.
Keller, K. L., & Lehmann, D. R. 2006. Brands and branding: Research findings and future
priorities. Marketing Science, 25 (6), 740-759.
Kim, M., McAlister, L. M. 2011. Stock market reaction to unexpected growth in marketing
expenditure: negative for sales force, contingent on spending level for advertising. Journal of
Marketing 75 (4), 68-85.
Kirk, C. P., Ray, I., & Wilson, B. 2013. The impact of brand value on firm valuation: The
moderating influence of firm type. Journal of Brand Management, 20(6), 488-500.
Larreche, J. C. 2008. Momentum strategy for efficient growth: when the sumo meets the
surfer. International Commerce Review 8 (1), 22-34.
Lehmann, D. R. 2004. Metrics for making marketing matter. Journal of Marketing, 68 (4),
73-75.
Levitt, T. 1983. The globalization of markets. Harvard Busineverdss Review, May-June, 92–
102.
22
Marshall, A. 1919. Industry and Trade: A Study of Industrial Technique and Business
Organization. Macmillan, London, United Kingdom.
Mauri, A. J., & Michaels, M. P. 1998. Firm and industry effects within strategic management:
An empirical examination. Strategic Management Journal, 19(3), 211-219.
McAlister, L., Srinivasan, R., Kim, M. 2007. Advertising, research and development, and
systematic risk of the firm. Journal of Marketing 71 (1), 35-48.
Mittal, B. 1994. Public assessment of TV advertising: Faint praise and harsh
criticism. Journal of advertising research.
Mittal, B. 1999. The advertising of services meeting the challenge of intangibility. Journal of
Service Research, 2 (1), 98-116.
Mitra, A., & Lynch Jr, J. G. 1995. Toward a reconciliation of market power and information
theories of advertising effects on price elasticity. Journal of Consumer Research, 644-659.
Mizik, N., & Jacobson, R. 2003. Trading off between value creation and value appropriation:
The financial implications of shifts in strategic emphasis. Journal of Marketing, 67(1), 63-76.
Mizik, N., & Jacobson, R. 2008. The financial value impact of perceptual brand
attributes. Journal of Marketing Research, 45( 1), 15-32.
Nelson, P. 1974. Advertising as information. The journal of political economy, 729-754.
O'Brien, J. P., David, P., Yoshikawa, T., Delios, A. 2013. How capital structure influences
diversification performance: a transaction cost perspective. Strategic Management Journal
35 (7), 1013–1031
Rubera, G., & Kirca, A. H. 2012. Firm innovativeness and its performance outcomes: A
meta-analytic review and theoretical integration. Journal of Marketing, 76 (3), 130-147.
Rust, R. T., Ambler, T., Carpenter, G. S., Kumar, V., & Srivastava, R. K. (2004). Measuring
marketing productivity: Current knowledge and future directions. Journal of marketing, 68
(4), 76-89.
23
Salinas, G., & Ambler, T. (2009). A taxonomy of brand valuation practice: Methodologies
and purposes. Journal of Brand Management, 17(1), 39-61.
Srinivasan, S., Hanssens, D. M. 2009. Marketing and firm value: metrics, methods, findings,
and future directions. Journal of Marketing Research 46 (3), 293-312.
Srinivasan, S., Pauwels, K., Silva-Risso, J., Hanssens, D. M. 2009. Product innovations,
advertising, and stock returns. Journal of Marketing 73 (1), 24-43.
Sriram, S., Kalwani, M. U. 2007. Optimal advertising and promotion budgets in dynamic
markets with brand equity as a mediating variable. Management Science 53 (1), 46-60.
Steenkamp, J. B. E., Batra, R., & Alden, D. L. 2003. How perceived brand globalness creates
brand value. Journal of International Business Studies, 34 (1), 53-65.
Stephen, A. T., & Galak, J. 2012. The effects of traditional and social earned media on sales:
A study of a microlending marketplace. Journal of Marketing Research, 49 (5), 624-639.
Sutton, J. 1991. Sunk Costs and Market Structure, MIT Press, Cambridge, MA.
Taylor, C. R. 2013. On the economic effects of advertising-evidence that advertising=
information. International Journal of Advertising 32 (3), 339-342.
Twedt, D. W., Knitter, H. R. 1964. What about the relationships among sales, advertising,
and earnings? Journal of Marketing 28 (4), 68-69.