Embed Size (px)
Citation preview
Is an Epic Pluvial Masking the Water Insecurity of the Greater New York City Region? 1
2
Neil Pederson1*, Andrew R. Bell1 Edward R. Cook1, Upmanu Lall2, Naresh Devineni3, Richard 3
Seager4, Keith Eggleston5 and Kevin J. Vranes6 4
5
1 Tree Ring Laboratory of Lamont-Doherty Earth Observatory of Columbia University, 6
Palisades, NY 10964; 2 Department of Earth and Environmental Engineering, Columbia Water 7
Center, Columbia University, New York, NY 10027; 3 Columbia Water Center 8
The Earth Institute, Columbia University, New York, NY 10027; 4 Lamont-Doherty Earth 9
Observatory of Columbia University, Palisades, NY 10964; 5 Northeast Regional Climate Center 10
Ithaca, NY 14853; 6 Boulder, CO 80309. 11
12
13
14
*Corresponding author: Neil Pederson, Tree Ring Laboratory of Lamont-Doherty Earth 15
Observatory and Columbia University, P.O. Box 1000, 61 Rt 9W, Palisades, NY 10964, 16
[email protected], Phone: 845-365-8392. 17
18
2
ABSTRACT: 18
Six water emergencies have occurred since 1981 for the New York City region (NYC) despite: 19
1) its perhumid climate, 2) substantial conservation of water since 1979 and 3) meteorological 20
data showing little severe or extreme drought since 1970. We reconstruct 472 years of moisture 21
availability for the NYC watershed to place these emergencies in long-term hydroclimatic 22
context. Using nested reconstruction techniques, 32 tree-ring chronologies comprised of 12 23
species account for up to 66.2% of the average May-August Palmer Drought Severity Index. 24
Verification statistics indicate good statistical skill from 1531-2003. The use of multiple tree 25
species, including rarely-used species that can sometimes occur on mesic sites like Liriodendron 26
tulipifera, Betula lenta and Carya spp., seems to aid reconstruction skill. Importantly, the 27
reconstruction captures pluvial events in the instrumental record nearly as well as drought events 28
and is significantly correlated to precipitation over much of the northeastern US. While the mid-29
1960s drought is a severe drought in the context of the new reconstruction, the region 30
experienced repeated droughts of similar intensity, but greater duration during the 16th and 17th 31
centuries. The full record reveals a trend towards more pluvial conditions since ca 1800 that is 32
accentuated by an unprecedented, 43-year pluvial event that continues through 2011. In the 33
context of the current pluvial, decreasing water usage, but increasing extra-urban pressures, it 34
appears that the water supply system for the greater NYC region could be severely stressed if the 35
current water boom shifts towards hydroclimatic regimes like the 16th and 17th centuries. 36
37
38
3
1. Introduction 38
Despite a perhumid climate, a lack of extreme drought (Figure 1; Supplemental Figure 39
S1), increased precipitation since the 1960s (Horton et al., 2011; Seager et al. 2012) and 40
significant reduction in water consumption (from a peak of 787 liters per person per day in 1988 41
to 477 in 2009), the New York City (NYC) metropolitan region has suffered a series of water 42
warnings and emergencies (1980-82, 1985, 1989, 1991, 1995, and 2002) in the last three decades 43
(NYC Dept. of Env. Protection 2011). This resource stress under favorable conditions highlights 44
the challenge of maintaining reliable water supply to an urban metropolis of more than 8 million 45
people. The population of the five boroughs of NYC is expected to swell to more than 9 million 46
by 2030 (NYC Dept. of City Planning 2006), suggesting that without concomitant increases in 47
water supply, such emergency states may become a more frequent occurrence. Recent 48
scholarship has pointed to an upward trend in precipitation and a downward trend in consecutive 49
dry days in meteorological records of the Northeast US since the region’s last extreme drought in 50
1962-1966 (e.g., Burns et al. 2007; Spierre and Wake 2010). However, it would be risky to infer 51
that NYC’s future water supply is secure on the basis of this poorly understood trend. A longer, 52
regional context, and understanding of the potential forcing factors driving this trend, is 53
necessary to fully consider the water security of NYC and its surrounding region. 54
A recent analysis of precipitation variability across NYC’s Catskill Mountains water 55
supply region was performed by Seager et al. (2012). A survey of 23 meteorological stations 56
covering the Catskill Mountains and the lower Hudson Valley, immediately north of NYC, 57
indicates 1) that the 1960s drought is the most significant in the century long instrumental record, 58
and 2) that there has been a detectable increase in precipitation throughout the region since the 59
early 1970s. This increase, when averaged across the region, resembles a step-change increase in 60
4
precipitation, a shift also seen in an analysis focused solely on NYC (Horton et al., 2011). 61
Neither the 1960s drought nor the recent pluvial seem forced by sea surface temperatures 62
variations or related to radiatively-driven climate change (Seager et al. 2012). Instead the 1960s 63
drought coincided with an extreme negative phase of the North Atlantic Oscillation (NAO) 64
(Namias 1966; Horton et al. 2009; Seager et al. 2012) while the shift to wetter conditions in the 65
1970s was also associated with a shift to a more positive phase of the NAO (Seager et al. 2012). 66
However, no apparent links between Catskills precipitation and the NAO were found at shorter 67
timescales. Seager et al. (2012) concluded that the main driver of precipitation variability in the 68
region over the last 110 years was therefore probably internal atmospheric variability. This 69
conclusion needs to be evaluated in the context of much longer records to aid in identifying the 70
frequency and severity of droughts and pluvial events as well as trends of regional hydroclimate 71
and to better understand the mechanisms of climate variability in the region. 72
Tree-ring analysis is used here to expand our long-term knowledge of drought variation 73
in the NYC watershed and surrounding region. Beginning with the classic demonstration by 74
Stockton and Jacoby (1976) that water resource management plans were based on insufficient 75
records of climate variability, tree-ring based reconstructions of hydroclimate have recently 76
assisted in understanding long-term climate patterns and trends for water resource management 77
and their influence on society (e.g., Cook and Jacoby 1977; 1983; Stahle et al. 1988; Woodhouse 78
and Lukas 2006; Buckley et al. 2010; Gou et al. 2010; Woodhouse et al. 2010; Büntgen et al. 79
2011; Maxwell et al. 2011; Meko and Woodhouse 2011; Pederson et al., 2012). A study of water 80
shortages and drought from 1900-2002 in Rockland County, NY, just north of NYC, found a 81
significant disagreement between water supply and usage in recent decades (Lyon et al. 2005). 82
When Lyon et al. (2005) explored longer, regional drought history using the North American 83
5
Drought Atlas (NADA) (Cook and Krusic 2004; Cook et al. 1999; 2008), they concluded that the 84
recent drought was within the range of natural variability and there were eight others comparable 85
to the 1960’s drought. A new reconstruction in the Delaware River basin indicates the 1960’s 86
drought to be the most severe over the last ca 260 years (Devineni et al. accepted with revision, 87
Journal of Climate). However, the most recent reconstruction of drought variability specifically 88
for the Hudson Valley, NY (Cook and Jacoby 1977) = was completed during the beginning of 89
the recent wetting trend (Figure 1; Figure S1). An update lengthening the record of drought 90
history for the Hudson Valley and NYC watershed is necessary to better place the recent unusual 91
pluvial conditions in a long-term context. 92
Here we use nested reconstruction techniques on a network with increased chronology 93
and species replication to lengthen the original NYC watershed drought record by 240 years. 94
The new reconstruction is used to place the recent increase in pluvial conditions in context. 95
Analysis of instrumental records indicates a significant shift in rainfall since 2003 (Figure 1; 96
Figure S1). We demonstrate that the recent wetting trend and pluvial, i.e., multiple years marked 97
by unusual rainfall and moist conditions, is an anomaly in NYC’s ca 500-year climate history. 98
Placing the current pluvial in a broad context, along with the severe unexplained 1960s drought 99
that preceded it, it is evident that the region will need to be adaptive and flexible to adequately 100
ensure a reliable water supply to the 9.1 million residents of NYC’s future. 101
102
2. Methods 103
a. Development of the tree ring network 104
The network of 33 tree-ring records used here is derived from a dendroecological study 105
from 1999-2004 (Pederson 2005; no. of chronologies = 23) and in-house chronologies 106
6
(Supplementary Material, Table S1; no. Of chronologies = 10); the seven in-house chronologies 107
are available from the International Tree-Ring Databank (ITRDB, 108
http://www.ncdc.noaa.gov/paleo/treering.html). Chronologies within or adjacent to the Hudson 109
Valley were selected for a potential relationship to growing season Palmer Drought Severity 110
Index (PDSI) and at least 160 years in length were retained as potential climate predictors; 111
segment length has a median of 163 years and ranges from 105-252 years (Supplementary 112
Material, Table S1). Overall, the current tree-ring network in the NYC watershed, composed of 113
33 chronologies and contains three chronologies dating back to 1453 (Table S1, Figure S2), is 114
denser in time and space than all prior reconstructions. 115
Perhaps the most significant advance of the new network is its species composition. Here we 116
take advantage of the biodiversity of in forests in New York State’s Hudson Valley to increase 117
spatial and species replication. Recent work suggests that increased species replication could 118
improve climatic reconstructions (García-Suárez et al. 2009; Cook and Pederson 2011), a 119
hypothesis that has found support in a reconstruction of Potomac River flow using nine tree 120
species from the diverse forests of the Appalachian Mountains (Maxwell et al. 2011). Twelve 121
species are used here, including what we believe are four species not previously used for drought 122
reconstruction (Betula lenta, Carya glabra, Quercus rubra, and Quercus velutina), and two 123
species only recently used for drought reconstruction (Carya ovata and Liriodendron tulipifera) 124
(Supplementary Material, Table S1). We will use the term ‘novel’ when discussing these species 125
not traditionally used in dendroclimatic research. The regional forest is so species rich that there 126
are three species present at 1453 CE in the new network. 127
Standard tree-ring methods were used in the processing and crossdating of all new 128
samples (Fritts 1976; Cook and Kariukstis 1990). The program ARSTAN was used to 129
7
standardized all raw ring-width series (Cook et al. 2011) with the goal to retain as much long-130
term variation in ring widths as possible from trees living in close-canopy forests, where tree-to-131
tree competition can obscure the potential climate signal (Cook and Peters 1981; Pederson et al. 132
2004). We applied the ‘Friedman Super Smoother’ to reduce the influence of changes in tree 133
competition on annual radial increment (Friedman 1984; Buckley et al. 2010). Occasionally, the 134
Friedman Super Smoother curve trends in opposition to raw ring-width trends at the end of a 135
time-series, resulting in ring index inflation or deflation. Series with these end-fitting issues were 136
detrended using a two-thirds cubic smoothing spline (Cook and Peters 1981). Prior to detrending, 137
series were transformed using the adaptive power transformation and stabilized using the ‘rbar’ 138
weighted stabilization method, where three or more trees are present for nearly all of the 139
chronology length. A combination of the rbar weighted and one-third spline methodology was 140
applied to records with greater replication at the beginning of the chronology (Cook and Peters 141
1997). A robust biweight mean function was used to calculate series index values (Cook 1985). 142
Chronology quality was interpreted using expressed population signal (EPS) (Wigley et 143
al. 1984). Median network EPS is 0.950 and ranges from 0.860 to 0.981. To maximize usable 144
chronology length, the cutoff for each record was the first year in which EPS was ≥0.85. The 145
median year of earliest usable chronology within the network is 1780, with a range from 1515-146
1852 (Supplemental Material, Table S1). Only ARSTAN chronologies were used as potential 147
climate predictors. Autoregressive modeling reduces much of the stochastic or endogenous 148
disturbances reflected in the tree rings of surviving trees such that the ARSTAN chronology is 149
useful for the examination of long-term climate variability (Cook 1985). All tree-ring collections 150
showed considerable instances of abrupt changes in ring width that are indicative of changes in 151
tree-to-tree competition. 152
8
153
b. Reconstruction of Hydroclimate 154
The target dataset for reconstruction was the instrumental PDSI for NOAA’s New York 155
State’s Climate Division 5 (from the National Climate Data Center’s Climate Data Online portal 156
http://www7.ncdc.noaa.gov/CDO/cdo), which represents the Hudson Valley. Average May-157
August PDSI within the Hudson Valley division was reconstructed based upon the common 158
response of the tree-ring network. Ring index of the current year (t) and prior year (t+1) was 159
used for each chronology because current-year ring widths are often comprised of energy gained 160
during the prior year (Trumbore et al. 2002; Kagawa et al. 2006). Considering this physiological 161
lag, 66 candidate predictors entered the regression matrix (33 current-year predictors and 33 162
lagged predictors). Predictor selection was based upon a one-tailed correlation (because of the 163
requirement of a positive relation between ring widths and PDSI) at p = 0.05. The Spruce Glen 164
Tsuga canadensis record did not pass the selection criteria so that 32 of the 33 original 165
chronologies were used as predictors. The final set of predictors was reduced to orthogonal 166
principle components (PCs) using principle component analysis (PCA). Following these criteria, 167
64 predictors (current and prior year ring index as a predictor) were retained for reconstruction. 168
The resulting time series from PCA entered into the regression against the instrumental PDSI 169
data. 170
Because the common usable chronology length of the current network is 1852-1982, a 171
nesting procedure was used to extend the length of the drought reconstruction (Meko 1997; Cook 172
et al. 2003). Through this procedure, shorter chronologies are dropped as potential predictors 173
through an iterative process and new reconstruction nests are created beyond the common period. 174
Twenty ‘backwards nests’ were created for our drought reconstruction. Similarly, ‘forward nests’ 175
9
were created for the time between 1981 and 2004 by dropping chronologies collected after 1981 176
but before more recent collections; 2004 is the last year of collections by this lab in the Hudson 177
Valley. A total of six forward nests were created using chronologies from the 1982-2004 period. 178
The reduction of error (RE) and coefficient of efficiency (CE) statistics were used to verify 179
model skill of all backward and forward reconstruction nests. Positive RE and CE values indicate 180
predictive skill (Fritts 1976; Wigley et al. 1984; Cook et al. 1994). 181
The reconstruction here was built upon the 1895-1981 period, which is the common period 182
between all chronologies and the instrumental data. Investigation into the stability of all 183
reconstruction nests was conducted through two split calibration-verification tests. The 184
meteorological data were split into 1/3rd and 2/3rd portions for the first calibration-verification 185
test and then reversed the calibration and verification periods for a second test (Table S2). 186
Additional years of meteorological data gained through forward nesting (because of an increased 187
common period of more recent years between tree-ring records and meteorological data) were 188
used in the development of the reconstruction as well as all calibration-verification tests. Any 189
reconstruction nest that accounted for less than 30% of the annual drought variation from the 190
instrumental record or any test that produced negative RE and CE statistics were considered 191
insufficient for reconstruction and omitted from the final reconstruction. 192
193
c. Assessing Historical Hydroclimate Variability 194
Drought and pluvial events were quantified and ranked following Gray et al.’s (2011) 195
adaptation of Biondi et al. (2002; 2005), except that we focus only on drought and pluvial events 196
of three or more consecutive years to examine extended events. We calculated the duration or 197
length, the magnitude (sum of the departure values from the median) and intensity (sum of the 198
10
departure values from the median divided by the duration) of each run. Each drought and pluvial 199
event is ranked, where the larger the departure from the median or the greater the intensity of the 200
event, the lower the event is initially ranked. The magnitude and intensity value ranks for each 201
event are then added together. Events with the largest combined score are considered more 202
severe. 203
204
d. Assessing Species Contributions to Hydroclimatic Reconstructions 205
We calculated the relative explained variance of each species to investigate the value of 206
each to the reconstruction following Frank and Esper (2005). Absolute values of beta weights, or 207
the standard regression coefficient that represents predictor loading in principal component 208
regression analysis, were summed for each chronology when the current year’s (t) and previous 209
year’s growth (t+1) passed predictor selection criteria. The summed value for each chronology 210
was divided by the sum of all beta weights and then again by 100. For species with multiple 211
chronologies (eight species), minimum, maximum and average relative variance explained 212
(AREV) was also calculated. Our analysis is intended to further explore the importance of 213
species replication, chronology replication and chronology quality in dendroclimatic research. 214
Investigation of all permutations of 12 species and 32 chronologies is beyond the scope of this 215
paper and is therefore limited to a few ranges of species replication, chronology replication and 216
chronology quality. Chronology quality for this purpose is defined as the annual variance 217
accounted for by each chronology of the instrumental data being reconstructed. Where there are 218
duplicate chronologies for a species, each chronology is ranked by the amount of annually 219
accounted variance with the highest (lowest) amount of variance considered the “best” (“worst”) 220
(See Table 2). 221
11
222
3. Results 223
a. Reconstruction modeling and spatial representation 224
Ring width variation for the common period between all tree-ring records and the 225
instrumental PDSI data (1852-1981) accounted for 66.2% of the annual variation of average 226
May-August PDSI (Figure 2; Supplemental Table S2). Most nests reconstructing hydroclimate 227
before 1852 account for nearly 50% of annual variation in instrumental PDSI (i.e., r2 for the 228
1602-1661 nest = 49.6%). By our criteria, the 1515-1530 nest fails when it accounts for only 229
26.9% of the annual variance in the instrumental record. The first usable nest is the 1531-1556 230
nest, which accounts for 44.1% of the annual average of May-August instrumental PDSI 231
between 1895 and 1981. Going forward past 1981 and up to the 2002 nest, tree rings account for 232
49.3% or more of instrumental PDSI. The 2002 nest, composed of only four chronologies, 233
accounts for 33.8% of annual drought variation while the 2003 nest accounts for 31.5% (Table 234
S2). RE and CE statistics are positive for all nests between 1531 and 2002, although verification 235
RE and CE both drop below 0.100 for the 1999 and 2000 nests indicating a weakening of skill. 236
Meteorological data is added after 2003 so that the final reconstruction of drought in the NYC 237
watershed covers 1531-2011 CE (Figure 3). 238
The use of novel species for drought reconstruction appears to have improved model 239
skill. While more commonly used species like Juniperus viginiana, Quercus alba, Quercus 240
montana and Tsuga canadensis have higher AREV, novel species had among the highest 241
amounts of relative variance explained (Table 1). Liriodendron tulipifera had the second highest 242
AREV (5.31), just behind Tsuga canadensis (5.69). Similarly, Carya glabra performed nearly as 243
well as Juniperus viginiana (AREV = 4.05 vs. 4.39, respectively) and Betula lenta performed 244
12
nearly as well as Quercus stellata (AREV = 3.38 vs. 3.72, respectively). Quercus alba and 245
Quercus montana AREV values are lower than one might expect given their usefulness in 246
previous reconstructions. This is mainly due to the use of a chronology of each species that is 247
relatively weak. For example, four of the five Quercus montana chronology AREV values are 248
>2.9 with a maximum value of 5.29. In comparison, the weakest Quercus montana AREV value 249
is 0.06 (Table 1). A similar situation is seen with Quercus rubra. Three of the four chronologies 250
here have AREV >2.1 while the weakest chronology has an AREV of 1.3. We also investigated 251
the efficacy of these novel species by comparing calibration and verification statistics for the 252
1895-1981 common period between ‘traditional’ and novel species (Table 2). Novel species 253
perform nearly as well on their own when reconstructing average May-Aug instrumental PDSI as 254
the traditional species. 255
Despite the often observed limitations of tree-ring data to effectively capture wet years 256
and pluvial events (Fritts 1976), the tree-ring network here captures wet years and pluvial events 257
within the instrumental record nearly as well as drought events (Figure 2). It should be noted that 258
two of the three pluvial events after 1981 are not captured as well, which could limit the 259
interpretation of reduced pluvial events during the prior four centuries (discussed below). 260
However, the tree ring based reconstruction indicates wet conditions or captures the event pattern 261
for 64.3% of the 14 pluvial events in the instrumental record above the 1895-2011 median ≥2 262
years in duration (1897-1898, 1901-1903, 1916-1917, 1919-1920, 1927-1928, 1937-1938, 1945-263
1948, 1950-1953, 1960-1961, 1967-1969, 1971-1977, 1982-1984, 1989-1990, 1996-1998). Two 264
of the five events where the tree rings underperform (1982-1984 and 1996-1998) are well above 265
the median. The remaining pluvial events are smaller excursions from the median. This 266
underperformance could be the result of reduced replication, the network being dominated by 267
13
denroecological collections, or time-varying standardization. It would seem the most important 268
factor here is the time-varying standardization. First, chronology replication only drops from 32 269
to 28 chronologies by 2000 CE. Next, our results actually indicate that reduced chronology 270
replication is less of a problem if species replication is higher (Table 2). Species replication in 271
the tree-ring network after 1981 is still high. Finally, a new study (Pederson et al., in review at 272
Canadian Journal of Forest Research) supports an earlier postulation that site selection might 273
matter less when sampling for hydroclimatic reconstructions in the eastern US (Cook, 1982). The 274
new study indicates that randomly-selected trees, even those from mesic environments, reflect 275
annual to decadal hydroclimatic variation over the prior two centuries. So, it seems less likely 276
that the use of dendroeclogical collections is the cause of weaker performance during the 1996-277
1999 pluvial event. Given this evidence and the fact that these events were within the last decade 278
of the tree-ring based reconstruction, it seems that time-varying standardization methods might 279
be the primary reason for the underperformance during two of the last three pluvial events. Time-280
varying standardization reduces the amount of medium-frequency variation at the ends of time-281
series (Melvin and Briffa 2008). In our network, there are only a few periods when multiple 282
chronologies line up in a way so that a loss of medium frequency at the end of a time series could 283
be compounded to underestimate hydroclimatic variation. These periods are: 1660-1700, 1740-284
1760, 1795-1810, 1830-1850, and after 1992. We do note that the sign tests for both calibration-285
verification tests were highly significant (26+/4-, z-score: 3.834, p-level = 0.00006 for 1895-286
1924 calibration period; 44+/13-, z-score: 3.974, p-level = 0.00004 for the 1925-1981calibration 287
period) indicating a strong ability of the network to capture wetter and dryer years and events. 288
Most of the wet years and multi-annual pluvial events in the instrumental record are captured by 289
the composite tree-ring record. 290
14
Not only does the new reconstruction of PDSI represent the NYC watershed, it also 291
represents regional-scale precipitation. Between 1901 and 2006 our reconstruction correlates 292
significantly with April to July precipitation across the northeastern US and southern Canada, 293
with average May-July precipitation providing the strongest correlation (Figure S3). The 294
correlation is strongest (r ≥0.50) across the northern mid-Atlantic region. The strong relationship 295
with growing-season precipitation provides independent evidence that the reconstruction 296
presented here represents hydrometeorological conditions over a significant portion of the 297
northeastern US. 298
299
b. Hydroclimate variability over the last five centuries 300
The new reconstruction indicates that the 1960s drought remains the most intense drought 301
experienced by the region over the last 481 years (Figures 3, 4; Table S3); only the 7-year 302
droughts starting in 1630 and 1661 approach the 1960s in overall intensity. However, the new 303
drought record shows that seven drought events exceed the duration of the 6-year, mid-1960’s 304
drought. All but one of these extended droughts occurred prior to the 20th century. The average 305
drought event length for the entire record is 5.2 years, while the average drought event duration 306
for the 20th century is marginally less at 4.8 years. Most importantly, only two drought events of 307
3-years or more in length occurred after 1967 (Figure 4). Over the entire record, the 17th century 308
appears to have been the most prone to frequent, high severity drought (Table S3). Yet, the most 309
striking drought era occurs in the mid-16th century when a 23-year drought beginning in 1555 310
(ranked 6th) occurs only one year after a 5-year drought event (ranked 24th) and a decade after the 311
10th ranked drought that began in 1543 (Figure 4). Only four positive departures from the long-312
term median, representing moister conditions, occur between 1543 and 1577. While 1960s 313
15
drought still stands out as significant in the new 500-year record, the 16th and 17th centuries are 314
dry centuries. 315
What might be most striking about the new reconstruction, however, is the upward trend 316
towards pluvial conditions since the early-19th century (Figures 3, 4; Table S4). Only the 1960’s 317
drought interrupts this multi-centennial trend. The multi-centennial trend is punctuated by a 318
series of intense pluvial events after 1967. Two of the top four highest-ranked pluvial events 319
occur between 1971 and 2009 (Table S4). In fact, seven of the 20 highest-ranked pluvial events 320
have occurred since 1901. The 2006 and 1971 pluvial events represent high and extreme soil 321
moisture conditions (average PDSI = 2.36 and 3.80, respectively). Averaged over the 1968-2011 322
period, PDSI has a value of 0.67 despite including 12 negative years and from 2000-2011 has an 323
average of 1.67 despite including 2 negative years. The top two recent pluvial events are only 324
rivaled by the eight-year pluvial beginning in 1827, the nine-year pluvial beginning in 1672 and 325
the eight-year pluvial beginning in 1578 (Table S4). While the duration of positive soil moisture 326
conditions in the most recent pluvial events has been exceeded historically, the predominantly 327
pluvial PDSI conditions since the beginning of the 21st century are virtually unrivaled in terms of 328
intensity. 329
To demonstrate this more clearly, we first look at the most recent decades of the 330
reconstruction. The 35-year period from the end of the 1960s drought up to the end of the tree-331
ring portion of the reconstruction (2003) stands out as a significantly wet era, with a mean ~2.4 332
standard deviations above that of all other 35-year periods in the reconstruction (Figure 5a). This 333
alone marks the post-drought period as anomalous. However, the years since the end of our 334
reconstruction have been wetter still, standing out as a distinct regime (Figures 1b, S1). We 335
would expect reconstructions from tree-ring chronologies updated to 2011 to exhibit similar 336
16
jumps in ring-width, but we do not yet have data to verify this shift. We can get some sense of 337
how anomalous the period since the end of the 1960s drought is by adding the most recent nine 338
years of instrumental data onto the end of the reconstruction (Figure 5b). This period then stands 339
out at around ~3.8 standard deviations above the average of all other 43 year periods within the 340
reconstruction. To determine if this arbitrary or more ad-hoc analysis might have induced some 341
bias, we conducted a continuous analysis to examine how the post-1960s drought era fits in the 342
probability distribution of the last 500 years. Results support the idea that the current pluvial era 343
is anomalous (Figure S4). As the tree-rings are providing a reflection of most pluvial events in 344
the instrumental record (Figure 2), we can be pretty sure that the last three to four decades in the 345
New York City watershed have been some of the wettest experienced in the last 500 years. 346
347
4. Discussion 348
The new reconstruction of drought for the NYC watershed highlights two important 349
aspects of regional hydroclimatic history. First, while the 1960’s drought is still among the most 350
intense droughts over the last 500 years, it interrupts a multi-centennial trend of increasing 351
moisture availability that has continued through 2011. Second, the new record gives greater 352
insight regarding the spatial extent and severity of the megadroughts during the 1500s and 353
provides greater temporal and spatial insight into droughts during the 1600s. Two other 354
important outcomes of this work are that: 1) an improved depiction of historical droughts and the 355
long-term trend of increasing moisture availability should be useful for understanding the 356
complex climate dynamics in the eastern US and 2) the reconstruction’s strength appears to be 357
partly derived from high tree species replication. We will detail the implications of the regional 358
17
hydroclimatic history, methodological aspects of the tree-ring based NYC watershed 359
reconstruction, and its potential societal impacts in the following sections. 360
361
a. Multi-centennial Trend Towards Pluvial Conditions 362
One of the most prominent trends in the NYC watershed reconstruction is the general 363
trend towards pluvial conditions since ca 1800. The magnitude of drought events after the 1827 364
pluvial is less than in prior centuries and becomes nearly nil after the 1960’s drought (Figure 4a). 365
Perhaps as striking is the trend of reduced drought intensity since the late-18th century (Figure 366
4b). The trend of increasing pluvial conditions is not limited to the NYC watershed region either; 367
instead, it appears to be a local expression of a broader hydroclimatic change across the eastern 368
US (Figure 6). Independent analyses have indicated wetter conditions since the late-19th and 369
early-20th centuries in three separate regions (Stahle et al. 1988; Stahle and Cleaveland 1992, 370
1994; Cook et al. 2010b; McEwan et al. 2011). Here we show that the recent trend of increased 371
wetness in the NYC watershed generally matches five regionally-distinct, tree-ring records of 372
paleodrought drawn from the NADA. Much of the eastern US has been unusually and somewhat 373
persistently wet since the late-1800s. Almost all of these records indicate more pluvial conditions 374
since the late-1950s. The only event that stands out from this large-scale pattern of change is the 375
unusually severe 1960’s drought. Since that event, our reconstruction indicates that this region of 376
the northeastern US has been experiencing the strongest pluvial conditions in the eastern US. 377
The instrumental record further supports our finding that recent pluvial events in the 378
NYC region are at the upper limit of hydroclimatic variability for the last 500 years. Even though 379
the 2006-2009 pluvial is virtually unrivaled, 2011 goes beyond the 2006-2009 event: the 2011 380
May-Aug average PDSI value is 3.72, including a value of 5.64 for August. The August 2011 381
18
PDSI value is the highest instrumental calculation for any month since 1895. Further, the only 382
monthly PDSI values in the instrumental record greater than 5.0 occur after 2003 (n = 4). And, of 383
the 20 highest monthly PDSI instrumental values, only one occurred prior to 1975 (a value of 384
4.48 in October 1955) — 70% of the 20 wettest months occur after 2000. Both paleo and 385
instrumental records point out that the recent decade of pluvial conditions is at the upper end of 386
hydroclimatic variability over the last 100 and 500 years (Figures 1, 5), which likely accounts for 387
the lack of water emergencies since 2002. Taken at face value, all these data suggest the long-388
term trend in pluvial conditions is unusual over the last 500 years. 389
The long trend towards today’s pluvial conditions in the NYC watershed matches 390
patterns in other parts of the Northern Hemisphere. Notably, increasing and sustained trends in 391
precipitation or pluvial conditions are seen in Bavaria (Wilson et al. 2005), northeastern China 392
(Sheppard et al. 2004), northwestern China (Li et al. 2006; Yin et al. 2008; Zhang et al. 2011), 393
southern England (Büntgen and Tegel 2011); western Mongolia (Davi et al. 2009), Pakistan 394
(Treydte et al. 2006); and the central Rocky Mountains (Knight et al. 2010); trends for northern 395
or ‘High’ Asia are summarized and shown to be occurring most strongly in the west, with no 396
such trend in monsoonal Asia (Fang et al. 2010). Interestingly, reconstructions at lower latitudes 397
and in some semi-arid regions are trending towards drought after wetter 20th centuries, including 398
Mexico (Cleaveland et al. 2003), eastern and central Mongolia (Pederson et al. 2001; Davi et al. 399
2006), western Turkey (Akkemik et al. 2005; Touchan et al. 2007; Köse et al. 2011), 400
southeastern U.S. (Pederson et al. 2012), western U.S. (Cook et al. 2004; Woodhouse et al. 2005, 401
2010), and southern Vietnam (Buckley et al. 2010). Abrupt decreases in precipitation are more 402
likely to occur in semi-arid and arid regions (Narisma et al. 2007). So, the opposite trend towards 403
19
pluvial conditions in the perhumid NYC region mirrors patterns seen in more mesic regions of 404
the North Hemisphere. 405
406
b. Severity and Spatial Extent of Historical Megadroughts 407
The hydroclimatic reconstruction for the NYC watershed reveals significant drought 408
events between 1500 and 1700 CE. We now have evidence that the 16th century megadrought 409
(Stahle et al. 2000) extended into the northeastern US (Figs 4, 6). Outside of the Niagara 410
Escarpment records in southern Canada (Buckley et al. 2004), few records are able to convey 411
information regarding the 16th century megadrought for the region. For the northeastern US, the 412
16th century megadrought is unprecedented over the past five centuries (Figure 7). No other 413
century contains a drought 23 years in duration immediately following two intense droughts 414
(Figure 4). While the new record here fills an important space concerning the spatial extent of 415
the 16th century megadrought, it is now apparent that the 16th century megadrought is the most 416
coherent drought episode across the eastern US over the last 500 years (Figure 6). 417
Not to be overlooked, however, are the severe and frequent 17th century droughts. While 418
not having nearly 40 years of sustained drought, the 17th century has six significant droughts 419
after 1632 (Figure 4). Importantly, the new reconstruction indicates the 1633 drought to be of the 420
same magnitude as the 1960s drought (Figure 4a). What is different about the two half-centuries 421
in which these significant droughts occur is that the first half of the 17th century contains a 422
greater proportion of drought than the late-20th century (Figure 7). Further revealing the aridity 423
of the 17th century is the fact that the latter half of the 17th century has a greater density of overall 424
drought likelihood than the first half of the 17th century making the 17th century one of the driest 425
over the last 500 years (Figure 7). Our new record also indicates that the 1661-1667 drought is 426
20
more severe (average PDSI = -2.33) than that currently portrayed in NADA (Figure S4) and an 427
investigation of North American drought to the west of our network (Fye et al. 2003). The 17th 428
century now appears to be a period plagued with frequent and intense droughts. 429
While the 16th century megadrought is well-known in the paleoclimatological record, the 430
mid-17th century drought has been primarily documented in other geologic proxies to the west 431
and northwest of our study region (Bégin and Peyette 1988; Wolin 1996; Lichter 1997; Nielsen 432
1998; Loope and Arbogast 2000; Argyilan et al. 2005; Shuman et al. 2009). Only recently was 433
the severity of drought during the 17th century highlighted in close proximity to our study region 434
(Nichols 2010; Ireland and Booth 2011). The NYC watershed reconstruction fills in a spatial gap 435
of these records and adds greater temporal detail throughout the 17th century. As the 436
dendroclimatological record of drought is pushed further back in time, more precise temporal 437
resolution is revealed for severe droughts like that in the 17th century. 438
The high-resolution revelation of severe and frequent droughts in this region prior to 439
1700 CE is important. Previously, the most serious drought was the 1960s drought (Cook and 440
Jacoby 1977; Lyon et al. 2005; Devineni et al. accepted with revision), a drought that NYC 441
adapted to and survived. However, the great frequency of droughts nearly severe as the 1960s 442
drought during the 17th century and the overwhelming magnitude of the 23-year long 16th 443
century should put political and resource management agencies in the NYC metro region and the 444
greater megalopolis region (Figure S3) on notice: the northeastern US is not a region without 445
severe droughts. In fact, a high-resolution sediment-core record reaching back to ca 500 CE in 446
the lower Hudson Valley indicates that the 16th and 17th century droughts are not the worst that 447
this region could experience (Pederson et al. 2005). 448
449
21
c. Contribution to Climate Dynamics 450
The new information on the spatiotemporal patterns of drought in the northeastern U.S. 451
will inform modeling efforts attempting to understand the drivers of climate dynamics for North 452
America. The trend towards highly unusual conditions in the paleo and instrumental records in 453
the last 40 years might be reflections of abrupt climate change. Significant, positive trends in 454
heavy precipitation, wetness, streamflow and soil moisture have been identified in the eastern US 455
during the 20th century (Kunkel et al. 1999; Easterling et al. 2000; Groisman et al. 2004; 456
Hodgkins and Dudley 2011). The northeastern portion of the US has, in fact, some of the 457
strongest trends in precipitation intensity, frequency and extreme events (Karl and Knight 1998; 458
Karl et al. 2009; Brown et al. 2010; Min et al., 2011). The increase in pluvial conditions and a 459
new regime in the instrumental record since 2003 (Figs 1, 3-6, S1) only continue trends 460
identified in previous studies. 461
The causes of a shift to a wetter climate in the northeast are difficult to discern (e.g., 462
Seager et al. 2012). Precipitation variations in the region have been linked to variability of the 463
storm tracks over North America and the North Atlantic Ocean (Seager et al. 2012) and also to 464
variations in the position and strength of the Atlantic subtropical high (Stahle and Cleaveland 465
1992; Davis et al. 1997; Hardt et al. 2010; Seager et al. 2012), although the mechanisms for 466
variations of the high are unclear. While the NYC watershed drought reconstruction is 467
significantly and positively correlated to January sea surface temperatures from 1948-2011 468
(Supplemental Fig S6), these patterns resemble those forced by the atmospheric flow anomalies 469
and seem to be unlikely to have actually caused the atmospheric flow anomalies that control 470
precipitation variations (Seager et al. 2012). There is an apparent association of our 471
reconstruction with the northern Atlantic Ocean from January through March (Fig S5). However, 472
22
a correlation from 1531-2001 between the NYC warm-season reconstruction and a winter NAO 473
reconstruction (Cook et al. 2002) shows virtually no correlation (r = 0.14). There is also an 474
association with the eastern Pacific Ocean in February that fades by April (Fig S5) and 475
correlation in March that suggests a link to the Gulf Stream; the Gulf Stream association is 476
similar to a finding in Joyce et al. (2009). Regardless, the causes of the recent hydroclimatic 477
variability remain poorly known and are possibly complex and multifaceted. Immediately after 478
the 1960s drought it was observed that the event was likely the result of “multiple and 479
interlocking causes” (Namias 1966, pg. 553). A search for the causes of droughts and pluvials in 480
the NYC region will require careful attention to human-induced climate change, non-linearities 481
or asymmetries in the climate system (Gong et al. 2011), the interaction between multiple, large-482
scale climate systems over the northeastern US (Archambault et al. 2008; Budikova 2008), and 483
the influences of a variety of modes of climate variability including ones that are not forced by 484
the ocean (see Cook et al. 2010a). 485
486
d. Implications for Tree-ring Reconstructions in Humid Regions 487
As expected by inference (García-Suárez et al. 2009; Cook and Pederson 2011) and 488
evidenced in application (Maxwell et al. 2011), increased species replication appears to improve 489
reconstruction models (Table 4). From the exploration of the influence of chronology replication, 490
chronology quality and species replication on tree-ring based reconstructions, it is interesting to 491
note that: 1) a reconstruction composed of only the best and worst chronologies of duplicated 492
species (two chronologies/species for a total of = 16 chronologies) or all species allowing for 493
only the worst two chronologies of duplicated species (n = 20) performed nearly as well as the 494
full network (n = 32); 2) a reconstruction composed of the best chronology from the 10 best 495
23
species outperforms the best 10 overall chronologies; and 3) the best chronology from the eight 496
best species (n=8) performs nearly as well as using all chronologies from traditional 497
dendroclimatological species in the region (n = 16) (Table 1). Results here suggest that species 498
replication is important in reconstructing hydroclimate in humid, closed-canopy environments. 499
With the on-going functional extinction of Tsuga canadensis (Orwig and Foster 1998; 500
Bonneau et al. 1999; Orwig et al. 2008), one of the most important tree species for paleoclimatic 501
research in eastern North America, and the expected increase in the loss of tree species, it is 502
important to identify other species that could replace climatically-sensitive species like Tsuga 503
canadensis for future work. Results here indicate that Liriodendron tulipifera is nearly an ideal 504
replacement for Tsuga canadensis, especially given the recent discovery of it living >500 years 505
(Pederson 2010) (Supplemental Material). Our findings indicate Betula lenta, Carya glabra and 506
Quercus rubra as useful ‘novel’ species for paleohydroclimatic research (Supplemental 507
Material). In fact, comparison of PDSI reconstruction using only ‘Traditional’ versus ‘Novel’ 508
species shows little difference in the performance of the two groupings (Table 2). The 509
differences that do occur in the resulting reconstruction do not seem to consistently favor one 510
grouping of species versus the other (Fig S7). While these ‘novel’ species generally do not live 511
as long as Tsuga canadensis (Eastern OLDLIST, 2011), the nested reconstruction approach 512
makes shorter chronologies useful for paleoclimatic research. Continued exploration of species 513
in the diverse eastern North American forest for maximum ages and climatic sensitivity should 514
help future dendroclimatological research as species are lost, either functionally or permanently. 515
516
e. Implications for NYC Water Supply 517
24
Current supply levels for NYC are anomalous within the context of the last 500 years. 518
NYC currently enjoys a water supply surplus and rotates its water demand among three 519
watershed systems – the Croton, Catskill, and Delaware watersheds – from year to year (NYC 520
DEP 2010). It might appear thus that NYC possesses a surplus of water use rights that might be 521
better allocated to downstream users of the basin in Delaware, New Jersey, and Pennsylvania. 522
However, we argue that a reallocation of NYC’s water rights may well put metropolitan water 523
supply at risk, should the current trend towards strong pluvial conditions come to an end. In fact, 524
forecasts of future precipitation indicate continued wetting during winter, but drying during the 525
summer (Hayhoe et al. 2007). The gains in water conservation and efficiency made by NYC 526
during a time of comparative abundance are admirable (from a per capita consumption peak of 527
788.5 liters per day (LPD) in 1988 to a low in 2009 of 476.2 LPD, a reduction of 40%) (NYC 528
DEP 2010), and may turn out to have been prescient if and when NYC’s ‘water boom’ comes to 529
an end. We suggest the value in framing NYC’s current condition as a ‘water boom’ rather than 530
a ‘water surplus’, and note the insight from natural resource economics that benefits accrued 531
from resource booms are better saved than consumed (because reducing consumption rates is 532
much more painful and difficult than reducing rates of saving) (Collier 2010). To its credit NYC 533
has already done much to avoid a consumption boom in water resources, and we hope that the 534
context provided in this study will demonstrate the importance of ‘saving’ the current abundance 535
of water resources – perhaps through facilitating watershed restoration and improving the 536
provision of ecosystem services by the Delaware and Catskill watersheds, or through short-term 537
leases of NYC’s current surplus with the revenues invested in water infrastructure – while the 538
boom lasts. Ephemeral though it may turn out to be, the capacity for NYC to act as a buffer 539
25
within a collaborative regional network of water supply and demand (and collect revenue in the 540
process) is an opportunity not to be missed. 541
542
5. Summary 543
Here we present a well-replicated reconstruction of hydroclimate for the NYC region 544
from 1531-2011. The new reconstruction reveals an upward trend towards more pluvial 545
conditions since ca 1800 for a significant portion of the northeastern US, a trend that is manifest 546
over much of temperate eastern North America. This trend is currently punctuated by an unusual, 547
43-year pluvial and supports instrumental data indicating that the last two decades are unusual in 548
nature. With greater chronology replication in the 16th and 17th centuries than previous regional 549
reconstructions, the new record reveals a high frequency of droughts during the 16th and 17th 550
centuries that are similar in intensity to the 1960’s drought, the drought of record in the 551
instrumental data. We now have evidence that the well-known 16th century megadrought likely 552
occurred over much of the northeastern US. Here, the 16th century is characterized by an 553
unprecedented 23-year drought that follows in short succession two other significant drought 554
events. Perhaps just as important, the 17th century is characterized by six severe drought events 555
after 1633. In a 500-year context, the 20th century and the sustained and repeated pluvial events 556
over the last 43 years mask the real likelihood for severe and significant drought in the greater 557
NYC region. Water supply systems for millions of people need to be viewed as vulnerable to 558
severe and potentially frequent drought. With this perspective, we suggest that the current 559
conditions within the NYC watershed be seen as a water boom, not surplus. During booms it 560
might be best to focus management on saving the current abundance of water resources. 561
562
26
Acknowledgements 563
This work was partially supported by a fellowship provided to NP by the U.S. Department of 564
Energy Global Change Education Program. Critical feedback by C. Leland, D. Martin and C. 565
Ummenhofer improved earlier versions of this manuscript. This is Lamont-Doherty Earth 566
Observatory Contribution XXXX. 567
568
569
27
Literature Cited 569
Akkemik, U., N. Dağdeviren, and A. Aras, 2005: A preliminary reconstruction (A.D. 1635-2000) 570
of spring precipitation using oak tree rings in the western Black Sea region of Turkey. 571
International Journal of Biometeorology, 49, 297–302. 572
Archambault, H. M., L. F. Bosart, D. Keyser, and A. R. Aiyyer, 2008: Influence of large-scale 573
flow regimes on cool-season precipitation in the Northeastern United States. Monthly 574
Weather Review, 136, 2945-2963. 575
Argyilan, E. P., S. L. Forman, J. W. Johnston, and D. a Wilcox, 2005: Optically stimulated 576
luminescence dating of late Holocene raised strandplain sequences adjacent to Lakes 577
Michigan and Superior, Upper Peninsula, Michigan, USA. Quaternary Research, 63, 122–578
135. 579
Biondi, F., T. J. Kozubowski, and A. K. Panorska, 2002: Stochastic modeling of regime shifts. 580
Climate Research, 23, 23–30. 581
Biondi, F., T. J. Kozubowski, and A. K. Panorska, 2005: A new model for quantifying climate 582
episodes. International Journal of Climatology, 25, 1253–1264. 583
Bonneau, L. R., K. S. Shields, and D. L. Civco, 1999: A technique to identify changes in 584
hemlock forest health over space and time using satellite image data. Biological Invasions, 585
1, 269–279. 586
Brown, P. J., R. S. Bradley, and F. T. Keimig, 2010: Changes in Extreme Climate Indices for the 587
Northeastern United States, 1870–2005. Journal of Climate, 23, 6555–6572. 588
Buckley, B. M., R. J. S. Wilson, P. E. Kelly, D. W. Larson, and E. R. Cook, 2004: Inferred 589
summer precipitation for southern Ontario back to AD 610, as reconstructed from ring 590
widths of Thuja occidentalis. Canadian Journal of Forest Research, 34, 2541–2553. 591
28
Buckley, B. M. and Coauthors, 2010: Climate as a contributing factor in the demise of Angkor, 592
Cambodia. Proceedings of the National Academy of Sciences of the United States of 593
America, 107, 6748–6752. 594
Burns, D., J. Klaus, and M. Mchale, 2007: Recent climate trends and implications for water 595
resources in the Catskill Mountain region, New York, USA. Journal of Hydrology, 336, 596
155–170. 597
Bégin, Y., and S. Peyette, 1988: Dendroecological evidence of lake-level changes during the last 598
three centuries in subarctic Quebec. Quaternary Research, 30, 210–220. 599
Budikova, D., 2008: Effect of the Arctic Oscillation on precipitation in the eastern USA during 600
ENSO winters. Climate Research, 37, 3-16. 601
Büntgen, U., and W. Tegel, 2011: European tree-ring data and the Medieval Climate Anomaly. 602
Medieval Climate Anomaly, Eds. E. Xoplaki, D. Fleitmann, H. Diaz, L. Von Gunten, and T. 603
Kiefer, Vol. 19 of, 14–15, PAGES. 604
Büntgen, U. and Coauthors, 2011: 2500 years of European climate variability and human 605
susceptibility. Science, 331, 578–582. 606
Cleaveland, M. K., D. W. Stahle, M. D. Therrell, J. Villanueva-Diaz, and B. T. Burns, 2003: 607
Tree-ring reconstructed winter precipitation and tropical teleconnections in Durango, 608
mexico. Climatic Change, 59, 369–388. 609
Collier, P., 2010: The Plundered Planet Why We Must--and How We Can--Manage Nature for 610
Global Prosperity. Oxford University Press, New York,. 611
Cook, B. I., E. R. Cook, K. J. Anchukaitis, R. Seager, and R. L. Miller, 2010a: Forced and 612
unforced variability of twentieth century North American droughts and pluvials. Climate 613
Dynamics, 37, 1097–1110. 614
29
Cook, E. R., 1982: Tree-ring data networks: comment. In M. K. Hughes, P. M. Kelly, J. R. 615
Pilcher, and V. C. LaMarche Jr. (Eds.), Climate from Tree Rings (First Ed.). London: 616
Cambridge University Press. pp. 6-7 617
Cook, E. R., 1985: A time series analysis approach to tree ring standardization. The University of 618
Arizona. Dissetation. 619
Cook, E., and G. Jacoby, 1977: Tree-ring-drought relationships in the Hudson Valley, New 620
York. Science, 198, 399–401. 621
Cook, E. R., and K. Peters, 1981: The Smoothing Spline: A New Approach to Standardizing 622
Forest Interior Tree-Ring Width Series for Dendroclimatic Studies. Tree-Ring Bulletin, 41, 623
45–53. 624
Cook, E. R., and G. C. Jacoby, 1983: Potomac River streamflow since 1730 as reconstructed by 625
tree rings. Journal of climate and applied meteorology, 22, 1659–1672. 626
Cook, E. R., and L. A. Kariukstis, 1990: Methods of Dendrochronology: Applications in the 627
Environmental Sciences. Eds. E.R. Cook and L.A. Kariukstis. Kluwer Academic, 628
Dordrecht. 629
Cook, E. R., and K. Peters, 1997: Calculating unbiased tree-ring indices for the study of climatic 630
and environmental change. The Holocene, 7, 361–370. 631
Cook, E. R., and P. J. Krusic, 2004: The North American Drought Atlas. Lamont-Doherty Earth 632
Observatory and the National Science Foundation. 633
http://iridl.ldeo.columbia.edu/SOURCES/.LDEO/.TRL/.NADA2004/.pdsi-atlas.html 634
(Accessed November 8, 2011). 635
30
Cook, E. R., and N. Pederson, 2011: Uncertainty, Emergence, and Statistics in 636
Dendrochronology. Dendroclimatology, Developments in Paleoenvironmental Research, 637
Eds. M.K. Hughes, T.W. Swetnam, and H.F. Diaz, Vol. 11 of, 77–112. 638
Cook, E. R., K. R. Briffa, and P. D. Jones, 1994: Spatial regression methods in 639
dendroclimatology: A review and comparison of two techniques. International Journal of 640
Climatology, 14, 379–402. 641
Cook, E. R., R. D. D’Arrigo, and M. E. Mann, 2002: A Well-Verified, Multiproxy 642
Reconstruction of the Winter North Atlantic Oscillation Index since A.D. 1400. Journal of 643
Climate, 15, 1754–1764. 644
Cook, E. R., P. J. Krusic, and P. D. Jones, 2003: Dendroclimatic signals in long tree-ring 645
chronologies from the Himalayas of Nepal. International Journal of Climatology, 23, 707–646
732. 647
Cook, E. R., D. M. Meko, D. W. Stahle, and M. K. Cleaveland, 1999: Drought reconstructions 648
for the continental United States. Journal of Climate, 12, 1145–1162. 649
Cook, E. R., P. J. Krusic, R. H. Holmes, and K. Peters. 2011. Program ARSTAN Ver.41d 10.5, 650
http://www.ldeo.columbia.edu/tree-ring-laboratory/resources/software (Accessed November 651
29, 2011). 652
Cook, E. R., C. A. Woodhouse, C. M. Eakin, D. M. Meko, and D. W. Stahle, 2004: Long-term 653
aridity changes in the western United States. Science (New York, N.Y.), 306, 1015–1018. 654
Cook, E., R. Seager, R. R. J. Heim, R. S. Vose, C. Herweijer, and C. A. Woodhouse, 2010b: 655
Megadroughts in North America: placing IPCC projections of hydroclimatic change in a 656
long-term palaeoclimate context. Journal of Quaternary Science, 25, 48–61. 657
31
Cook, E. R., and Coauthors, 2008: North American Summer PDSI Reconstructions, Version 2a. 658
IGBP PAGES/World Data Center for Paleoclimatology Data Contribution Series # 2008-659
046. NOAA/NGDC Paleoclimatology Program. http://www.ncdc.noaa.gov/paleo/pdsi.html 660
(Accessed November 11, 2011). 661
Davi, N. K., G. C. Jacoby, A. E. Curtis, and N. Baatarbileg, 2006: Extension of Drought Records 662
for Central Asia Using Tree Rings: West-Central Mongolia. Journal of Climate, 19, 288–663
299. 664
Davi, N. K., G. C. Jacoby, R. D. D’Arrigo, N. Baatarbileg, L. Jinbao, and a E. Curtis, 2009: A 665
tree-ring-based drought index reconstruction for far-western Mongolia: 1565-2004. 666
International Journal of Climatology, 29, 1508–1514. 667
Davis, R. E., B. P. Hayden, D. a Gay, W. L. Phillips, and G. V. Jones, 1997: The North Atlantic 668
Subtropical Anticyclone. Journal of Climate, 10, 728–744. 669
Devineni, N., U. Lall, N. Pederson, and E. R. Cook, Accepted with revision: Delaware River 670
streamflow reconstruction using tree rings: exploration of hierarchical Bayesian regression. 671
Journal of Climate. 672
Easterling, D. R., G. A. Meehl, C. Parmesan, S. A. Changnon, T. R. Karl, and L. O. Mearns, 673
2000: Climate extremes: observations, modeling, and impacts. Science, 289, 2068–2074. 674
Eastern OLDLIST, 2011: Eastern OLDLIST: a database of maximum tree ages for eastern North 675
America. http://www.ldeo.columbia.edu/~adk/oldlisteast/ (Accessed December 1, 2011). 676
Fang, K., X. Gou, F. Chen, F. Zhang, Y. Li, and J. Peng, 2010: Comparisons of drought 677
variability between central High Asia and monsoonal Asia: Inferred from tree rings. 678
Frontiers of Earth Science in China, 4, 277–288. 679
32
Frank, D., and J. Esper, 2005: Characterization and climate response patterns of a high-elevation, 680
multi-species tree-ring network in the European Alps. Dendrochronologia, 22, 107–121. 681
Friedman, J. H., 1984: A variable span smoother. Stanford University. Stanford. 682
Fritts, H. C., 1976: Tree Rings and Climate. Academic Press, New York. 683
Fye, F. K., D. W. Stahle, and E. R. Cook, 2003: Paleoclimatic Analogs to Twentieth-Century 684
Moisture Regimes Across the United States. Bulletin of the American Meteorological 685
Society, 84, 901-909. 686
Gong, G., L. Wang, and U. Lall, 2011: Climatic precursors of autumn streamflow in the 687
northeast United States. International Journal of Climatology, 31, 1773–1784. 688
Gou, X., Y. Deng, F. Chen, M. Yang, K. Fang, L. Gao, T. Yang, and F. Zhang, 2010: Tree ring 689
based streamflow reconstruction for the Upper Yellow River over the past 1234 years. 690
Chinese Science Bulletin, 55, 4179–4186. 691
Gray, S. T., J. J. Lukas, and C. A. Woodhouse, 2011: Millennial-Length Records of Streamflow 692
From Three Major Upper Colorado River Tributaries1. JAWRA Journal of the American 693
Water Resources Association, 47, 702–712. 694
Groisman, P. Y., R. W. Knight, T. R. Karl, D. R. Easterling, B. Sun, and J. H. Lawrimore, 2004: 695
Contemporary changes of the hydrological cycle over the contiguous United States: Trends 696
derived from in situ observations. Journal of Hydrometeorology, 5, 64–85. 697
García-Suárez, A. M., Butler, C. J., and M. G. L. Baillie, 2009: Climate signal in tree-ring 698
chronologies in a temperate climate: A multi-species approach. Dendrochronologia, 27, 699
183-198. 700
33
Hardt, B., H. D. Rowe, G. S. Springer, H. Cheng, and R. L. Edwards, 2010: The seasonality of 701
east central North American precipitation based on three coeval Holocene speleothems from 702
southern West Virginia. Earth and Planetary Science Letters, 295, 342–348. 703
Hayhoe, K. and Coauthors, 2007: Past and future changes in climate and hydrological indicators 704
in the US Northeast. Climate Dynamics, 28, 381–407. 705
Hodgkins, G. A., and R. W. Dudley, 2011: Historical summer base flow and stormflow trends 706
for New England rivers. Water Resources Research, 47, 1–16. 707
Hornbeck, R. and P. Keskin, 2011: The Evolving Impact of the Ogallala Aquifer: Agricultural 708
Adaptation to Groundwater and Climate. Working Paper. National Bureau of Economic 709
Research, Cambridge, MA. 710
Horton, R., C. Rosenzweig, V. Gornitz, D. Bader, and M. O’Grady, 2009: Climate Risk 711
Information. New York City Panel on Climate Change. New York. 712
Horton, R. M., V. Gornitz, D. A. Bader, A. C. Ruane, R. Goldberg, and C. Rosenzweig. 2011: 713
Climate hazard assessment for stakeholder adaptation planning in New York City. Journal 714
of Applied Meteorology and Climatology, 50, 2247-2266. 715
Ireland, A. W., and R. K. Booth, 2011: Hydroclimatic variability drives episodic expansion of a 716
floating peat mat in a North American kettlehole basin. Ecology, 92, 11–18. 717
Joyce, T. M., Y.-O. Kwon, and L. Yu, 2009: On the Relationship between Synoptic Wintertime 718
Atmospheric Variability and Path Shifts in the Gulf Stream and the Kuroshio Extension. 719
Journal of Climate, 22, 3177–3192. 720
Kagawa, A., A. Sugimoto, and T. C. Maximov, 2006: 13CO2 pulse-labelling of photoassimilates 721
reveals carbon allocation within and between tree rings. Plant, Cell and Environment, 29, 722
1571–1584. 723
34
Karl, T. R., and R. W. Knight, 1998: Secular trends of precipitation amount, frequency, and 724
intensity in the United States. Bulletin of the American Meteorological Society, 79, 231–725
241. 726
Karl, T. R., J. M. Melillo, and T. C. Peterson, 2009: Global Climate Changes in the United 727
States. Eds. T.R. Karl, J.M. Melillo, and T.C. Peterson. Cambridge University Press, New 728
York. 729
Knight, T. a, D. M. Meko, and C. H. Baisan, 2010: A bimillennial-length tree-ring reconstruction 730
of precipitation for the Tavaputs Plateau, Northeastern Utah. Quaternary Research, 73, 731
107–117. 732
Kunkel, K. E., K. Andsager, and D. R. Easterling, 1999: Long-term trends in extreme 733
precipitation events over the conterminous United States and Canada. Journal of Climate, 734
12, 2515–2527. 735
Köse, N., Ü. Akkemik, H. N. Dalfes, and M. S. Özeren, 2011: Tree-ring reconstructions of May–736
June precipitation for western Anatolia. Quaternary Research, 75, 438–450. 737
Li, J., X. Gou, E. R. Cook, and F. Chen, 2006: Tree-ring based drought reconstruction for the 738
central Tien Shan area in northwest China. Geophysical Research Letters, 33, 1–5. 739
Lichter, J., 1997: Radiocarbon Dating of Lake Michigan Beach-Ridge and Dune Development. 740
Quaternary Research, 48, 137–140. 741
Loope, W. L., and A. F. Arbogast, 2000: Dominance of an ∼150-Year Cycle of Sand-Supply 742
Change in Late Holocene Dune-Building along the Eastern Shore of Lake Michigan. 743
Quaternary Research, 54, 414–422. 744
35
Lyon, B., N. Christie-Blick, and Y. Gluzberg, 2005: Water shortages, development, and drought 745
in Rockland County, New York. Journal of the American Water Resources Association, 41, 746
1457–1469. 747
Maxwell, R. S., A. E. Hessl, E. R. Cook, and N. Pederson, 2011: A multispecies tree ring 748
reconstruction of Potomac River streamflow (950–2001). Water Resources Research, 47, 1–749
12. 750
McEwan, R. W., J. M. Dyer, and N. Pederson, 2011: Multiple interacting ecosystem drivers: 751
toward an encompassing hypothesis of oak forest dynamics across eastern North America. 752
Ecography, 34, 244–256. 753
Meko, D., 1997: Dendroclimatic Reconstruction with Time Varying Predictor Subsets of Tree 754
Indices. Journal of Climate, 10, 687–696. 755
Meko, D. M., and C. A. Woodhouse, 2011: Application of streamflow reconstruction to water 756
resources management. Dendroclimatology, Developments in Paleoenvironmental 757
Research, Eds. M.K. Hughes, T.W. Swetnam, and H.F. Diaz, Vol. 11, 231–261, Springer 758
Netherlands, Dordrecht. 759
Melvin, T., and K. Briffa, 2008: A “signal-free” approach to dendroclimatic standardisation. 760
Dendrochronologia, 26, 71-86. 761
Min, S.-K., X. Zhang, F. W. Zwiers, and G. C. Hegerl, 2011: Human contribution to more-762
intense precipitation extremes. Nature, 470, 378-81. 763
Namias, J., 1966: Nature and possible causes of the northeastern United States drought during 764
1962–65. Monthly Weather Review, 94, 543–554. 765
Narisma, G. T., J. a Foley, R. Licker, and N. Ramankutty, 2007: Abrupt changes in rainfall 766
during the twentieth century. Geophysical Research Letters, 34, 1–5. 767
36
Nichols, J. E., 2010: Reconstructing Holocene hydroclimate in eastern North America from 768
ombrotrophic peatland sediments. Brown University. Dissertation. 769
Nielsen, E., 1998: Lake Winnipeg coastal submergence over the last three centuries. Journal of 770
Paleolimnology, 19, 335–342. 771
NYC Department of Planning, 2006: New York City Population Projections by Age / Sex & 772
Borough. New York, www.nyc.gov/html/dcp/pdf/census/projections_briefing_booklet.pdf. 773
NYC Department of Environmental Protection, 2010: New York City 2010 Drinking Water 774
Supply and Quality Report. New York, 775
http://www.nyc.gov/html/dep/html/drinking_water/wsstate.shtml. 776
NYC Department of Environmental Protection, 2011: Drought and Water Consumption. 777
http://www.nyc.gov/html/dep/html/drinking_water/droughthist.shtml (Accessed December 778
5, 2011). 779
Orwig, D. A., and D. R. Foster, 1998: Forest response to the introduced hemlock woolly adelgid 780
in southern New England, USA. Journal of the Torrey Botanical Society, 125, 60–73. 781
Orwig, D. a, R. C. Cobb, A. W. D’Amato, M. L. Kizlinski, and D. R. Foster, 2008: Multi-year 782
ecosystem response to hemlock woolly adelgid infestation in southern New England forests. 783
Canadian Journal of Forest Research, 38, 834–843. 784
Pederson, D., D. Peteet, D. Kurdyla, and T. Guilderson, 2005: Medieval Warming, Little Ice 785
Age, and European impact on the environment during the last millennium in the lower 786
Hudson Valley, New York, USA. Quaternary Research, 63, 238–249. 787
Pederson, N., 2005: Climatic Sensitivity and Growth of Southern Temperate Trees in the Eastern 788
US: Implications for the Carbon Cycle. Columbia University. 789
Pederson, N., 2010: External Characteristics of Old Trees in the Eastern Deciduous Forest. 790
Natural Areas Journal, 30, 396–407. 791
37
Pederson, N., E. R. Cook, G. C. Jacoby, D. M. Peteet, and K. L. Griffin, 2004: The influence of 792
winter temperatures on the annual radial growth of six northern range margin tree species. 793
Dendrochronologia, 22, 7–29. 794
Pederson, N., G. C. Jacoby, R. D. D’Arrigo, E. R. Cook, B. M. Buckley, C. Dugarjav, and R. 795
Mijiddorj, 2001: Hydrometeorological Reconstructions for Northeastern Mongolia Derived 796
from Tree Rings: 1651–1995. Journal of Climate, 14, 872–881. 797
Pederson, N. and Coauthors, 2012. Insight into the American Southeast’s drought future from its 798
reconstructed drought past. Environmental Research Letters, 7, 014034. 799
Pederson, N., and Coauthors, In review: Prospects for reconstructing drought using non-‐800
classical tree-‐ring data: drought as an important factor of tree growth. Canadian 801
Journal of Forest Research. 802
Rodionov, S. N., 2004: A sequential algorithm for testing climate regime shifts. Geophysical 803
Research Letters, 31, 2–5. 804
Seager, R., N. Pederson, Y. Kushnir, J. Nakamura, and S. Jurburg, 2012: The 1960s drought and 805
the subsequent shift to a wetter climate in the Catskill Mountains region of the New York 806
City watershed. Journal of Climate, http://dx.doi.org/10.1175/JCLI-D-11-00518.1 807
Sheppard, P. R., P. E. Tarasov, L. J. Graumlich, K.-U. Heussner, M. Wagner, H. Sterle, and L. 808
G. Thompson, 2004: Annual precipitation since 515 BC reconstructed from living and fossil 809
juniper growth of northeastern Qinghai Province, China. Climate Dynamics, 23, 869–881. 810
Shuman, B., A. K. Henderson, C. Plank, I. Stefanova, and S. S. Ziegler, 2009: Woodland-to-811
forest transition during prolonged drought in Minnesota after ca. AD 1300. Ecology, 90, 812
2792–2807. 813
38
Spierre, S. G., and C. Wake, 2010: Trends in Extreme Precipitation Events for the Northeastern 814
United States 1948-2007. Durham. 815
Stahle, D. W., and M. K. Cleaveland, 1992: Reconstruction and analysis of spring rainfall over 816
the southeastern US for the past 1000 years. Bulletin of the American Meteorological 817
Society, 73, 1947–1961. 818
Stahle, D. W., and M. K. Cleaveland, 1994: Tree-ring reconstructed rainfall over the 819
southeastern USA during the Medieval Warm Period and Little Ice Age. Climatic Change, 820
26, 199–212. 821
Stahle, D. W., M. K. Cleaveland, and J. Hehr, 1988: North Carolina climate changes 822
reconstructed from tree rings: AD 372 to 1985. Science, 240, 1517–1519. 823
Stahle, D. W., E. R. Cook, M. K. Cleaveland, M. D. Therrell, D. M. Meko, H. D. Grissino-824
Mayer, E. Watson, and and B. H. Luckman, 2000: Tree-ring data document 16th century 825
megadrought over North America. EOS, 81, 121. 826
Stockton, C., and G. Jacoby, 1976: Long-term surface-water supply and streamflow trends in the 827
Upper Colorado River basin based on tree-ring analyses. Lake Powell Research Project 828
Bulletin, 1–70. 829
Touchan, R., Ü. Akkemik, M. K. Hughes, and N. Erkan, 2007: May–June precipitation 830
reconstruction of southwestern Anatolia, Turkey during the last 900 years from tree rings. 831
Quaternary Research, 68, 196–202. 832
Treydte, K. S., G. H. Schleser, G. Helle, D. C. Frank, M. Winiger, G. H. Haug, and J. Esper, 833
2006: The twentieth century was the wettest period in northern Pakistan over the past 834
millennium. Nature, 440, 1179–1182. 835
39
Trumbore, S., J. Gaudinski, P. Hanson, and J. Southon, 2002: Quantifying ecosystem-836
atmosphere carbon exchange with a 14C label. EOS Transactions, 83, 265, 267–268. 837
Wigley, T., K. Briffa, and P. Jones, 1984: On the average value of correlated time series, with 838
applications in dendroclimatology and hydrometeorology. Journal of Climate and Applied 839
Meteorology, 23, 201–213. 840
Wilson, R. J. S., B. H. Luckman, and J. Esper, 2005: A 500 year dendroclimatic reconstruction 841
of spring-summer precipitation from the lower Bavarian Forest region, Germany. 842
International Journal of Climatology, 25, 611–630. 843
Wolin, J. A., 1996: Late Holocene lake-level and lake development signals in Lower Herring 844
Lake, Michigan. Journal of Paleolimnology, 15, 19–45. 845
Woodhouse, C., and J. Lukas, 2006: Drought, Tree Rings and Water Management in Colorado. 846
Canadian Water Resources, 31, 1–14. 847
Woodhouse, C. A., K. E. Kunkel, D. R. Easterling, and E. R. Cook, 2005: The twentieth-century 848
pluvial in the western United States. Geophysical Research Letters, 32, 11–14. 849
Woodhouse, C. a, D. M. Meko, G. M. MacDonald, D. W. Stahle, and E. R. Cook, 2010: A 850
1,200-year perspective of 21st century drought in southwestern North America. 851
Proceedings of the National Academy of Sciences of the United States of America, 107, 852
21283–21288. 853
Yin, Z.-Y., X. Shao, N. Qin, and E. Liang, 2008: Reconstruction of a 1436-year soil moisture 854
and vegetation water use history based on tree-ring widths from Qilian junipers in 855
northeastern Qaidam Basin, northwestern China. International Journal of Climatology, 28, 856
37–53. 857
40
Zhang, Y., Q. Tian, X. Gou, F. Chen, S. W. Leavitt, and Y. Wang, 2011: Annual precipitation 858
reconstruction since AD 775 based on tree rings from the Qilian Mountains, northwestern 859
China. International Journal of Climatology, 31, 371–381. 860
861
862
863
41
Figure Captions 863
Figure 1 – (a) May to August annual drought area index for the northeast U.S. from 1900-2011 864
(NOAA Northeast Regional Climate Center, Cornell University). ) As determined by the US 865
Drought Monitor (http://droughtmonitor.unl.edu/), black represents moderate and severe drought 866
(PDSI from -2.0 to -3.9) while red represents extreme drought (PDSI < -4.0). (b) Instrumental 867
records of precipitation from 1895-2011 for the northeastern US. The top series (solid, blue line) 868
is the average total annual precipitation while the bottom series (solid, light-blue line with 869
triangles) is average total summer precipitation. Horizontal lines represent average precipitation 870
for the regimes detected using the methods of Rodionov (2004). Data are derived from NOAA’s 871
National Climatic Data center for Climate Services and Monitoring Division 872
(http://www.ncdc.noaa.gov/temp-and-precip/time-series/). 873
874
Figure 2 – Tree Ring reconstruction (dash-dot orange line) versus average May-Aug 875
instrumental PDSI (solid, blue line) over the common period from 1895-2002. Table S2 contains 876
calibration-verification statistics for all nests. Note: the tree-ring do not fully capture five of the 877
14 pluvial events during the instrumental record, most notably during 1982-1984 and 1996-1999 878
. See results for a discussion of this pattern. 879
880
Figure 3 – Drought history of the NYC watershed region from 1531-2011. The orange, 881
smoothed line is a 20-yr spline while the flat, black line represents the long-term median. 882
Instrumental data from 2004-2011 (in blue) is tacked onto the end of the tree-ring based 883
reconstruction (1531-2004). The thick, dot-dash line in the bottom of the figure represents the 884
42
number of chronologies through time. The dashed grey line highlights replication at five 885
chronologies. 886
887
Figure 4 – Temporal distribution of (a) magnitude and (b) intensity of pluvial and drought 888
events 3-years or more in duration. Magnitude portrays the cumulative severity of each event 889
while the intensity indicates the average severity of each event. See text for more details. 890
891
Figure 5 – Probability distributions of (a) 35-year period within the tree-ring based 892
reconstruction from 1531-2003 and (b) 44-year periods within the entire 1531-2011 record. The 893
vertical lines represents 1968-2003 and 1968-2011averages, respectively. 894
895
Figure 6 – Five records of hydroclimate variability across the eastern US. The new NYC 896
drought reconstruction now provides evidence that the 16th century megadrought (Stahle et al. 897
2000) extended up into the northeastern US and that the trend towards more pluvial conditions is 898
present in five independent records across much of the eastern US. Each line is a 20-yr spline of 899
the each annual record. The dashed line is the mean of each record’s mean. 900
901
Figure 7 – Violin plots for 50-yr segments from 1550-1999 and for the 1895-2003 common 902
period of the reconstructed and meteorological data, showing data quartiles and outliers (box-903
and-whisker plots) and probability densities (shaded gray areas). 904
905
906
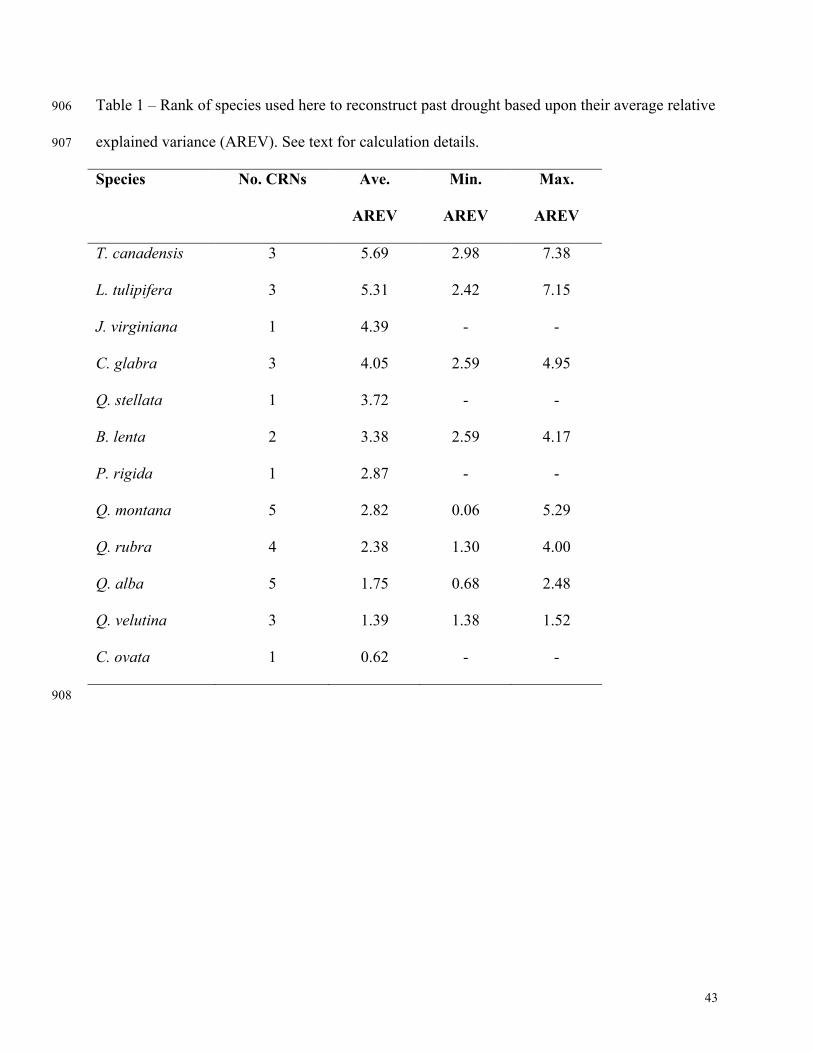
43
Table 1 – Rank of species used here to reconstruct past drought based upon their average relative 906
explained variance (AREV). See text for calculation details. 907
Species No. CRNs Ave.
AREV
Min.
AREV
Max.
AREV
T. canadensis 3 5.69 2.98 7.38
L. tulipifera 3 5.31 2.42 7.15
J. virginiana 1 4.39 - -
C. glabra 3 4.05 2.59 4.95
Q. stellata 1 3.72 - -
B. lenta 2 3.38 2.59 4.17
P. rigida 1 2.87 - -
Q. montana 5 2.82 0.06 5.29
Q. rubra 4 2.38 1.30 4.00
Q. alba 5 1.75 0.68 2.48
Q. velutina 3 1.39 1.38 1.52
C. ovata 1 0.62 - -
908
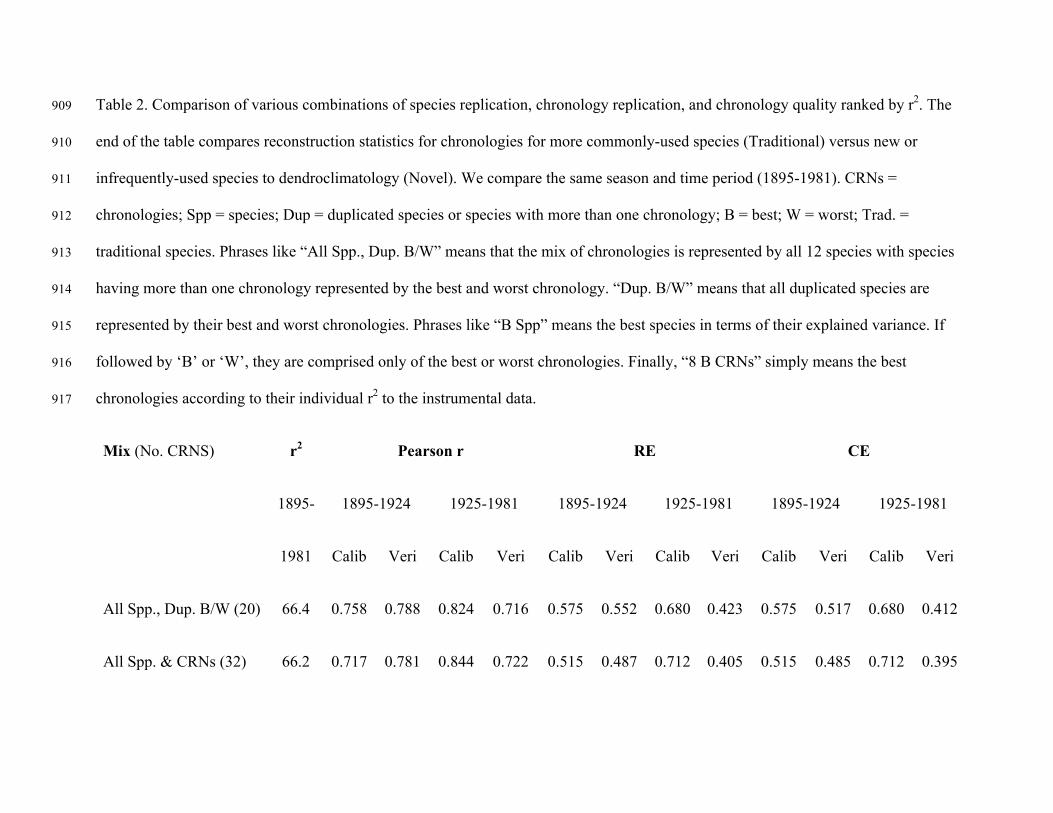
Table 2. Comparison of various combinations of species replication, chronology replication, and chronology quality ranked by r2. The 909
end of the table compares reconstruction statistics for chronologies for more commonly-used species (Traditional) versus new or 910
infrequently-used species to dendroclimatology (Novel). We compare the same season and time period (1895-1981). CRNs = 911
chronologies; Spp = species; Dup = duplicated species or species with more than one chronology; B = best; W = worst; Trad. = 912
traditional species. Phrases like “All Spp., Dup. B/W” means that the mix of chronologies is represented by all 12 species with species 913
having more than one chronology represented by the best and worst chronology. “Dup. B/W” means that all duplicated species are 914
represented by their best and worst chronologies. Phrases like “B Spp” means the best species in terms of their explained variance. If 915
followed by ‘B’ or ‘W’, they are comprised only of the best or worst chronologies. Finally, “8 B CRNs” simply means the best 916
chronologies according to their individual r2 to the instrumental data. 917
Mix (No. CRNS) r2 Pearson r RE CE
1895- 1895-1924 1925-1981 1895-1924 1925-1981 1895-1924 1925-1981
1981 Calib Veri Calib Veri Calib Veri Calib Veri Calib Veri Calib Veri
All Spp., Dup. B/W (20) 66.4 0.758 0.788 0.824 0.716 0.575 0.552 0.680 0.423 0.575 0.517 0.680 0.412
All Spp. & CRNs (32) 66.2 0.717 0.781 0.844 0.722 0.515 0.487 0.712 0.405 0.515 0.485 0.712 0.395
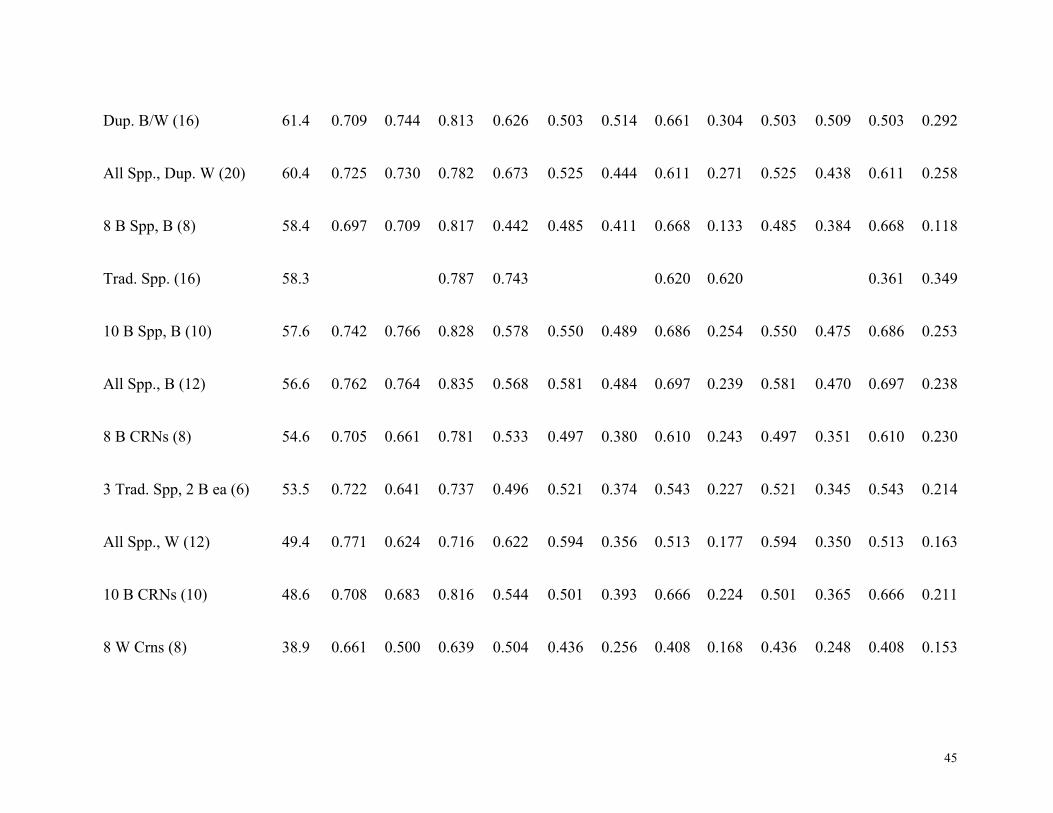
45
Dup. B/W (16) 61.4 0.709 0.744 0.813 0.626 0.503 0.514 0.661 0.304 0.503 0.509 0.503 0.292
All Spp., Dup. W (20) 60.4 0.725 0.730 0.782 0.673 0.525 0.444 0.611 0.271 0.525 0.438 0.611 0.258
8 B Spp, B (8) 58.4 0.697 0.709 0.817 0.442 0.485 0.411 0.668 0.133 0.485 0.384 0.668 0.118
Trad. Spp. (16) 58.3 0.787 0.743 0.620 0.620 0.361 0.349
10 B Spp, B (10) 57.6 0.742 0.766 0.828 0.578 0.550 0.489 0.686 0.254 0.550 0.475 0.686 0.253
All Spp., B (12) 56.6 0.762 0.764 0.835 0.568 0.581 0.484 0.697 0.239 0.581 0.470 0.697 0.238
8 B CRNs (8) 54.6 0.705 0.661 0.781 0.533 0.497 0.380 0.610 0.243 0.497 0.351 0.610 0.230
3 Trad. Spp, 2 B ea (6) 53.5 0.722 0.641 0.737 0.496 0.521 0.374 0.543 0.227 0.521 0.345 0.543 0.214
All Spp., W (12) 49.4 0.771 0.624 0.716 0.622 0.594 0.356 0.513 0.177 0.594 0.350 0.513 0.163
10 B CRNs (10) 48.6 0.708 0.683 0.816 0.544 0.501 0.393 0.666 0.224 0.501 0.365 0.666 0.211
8 W Crns (8) 38.9 0.661 0.500 0.639 0.504 0.436 0.256 0.408 0.168 0.436 0.248 0.408 0.153
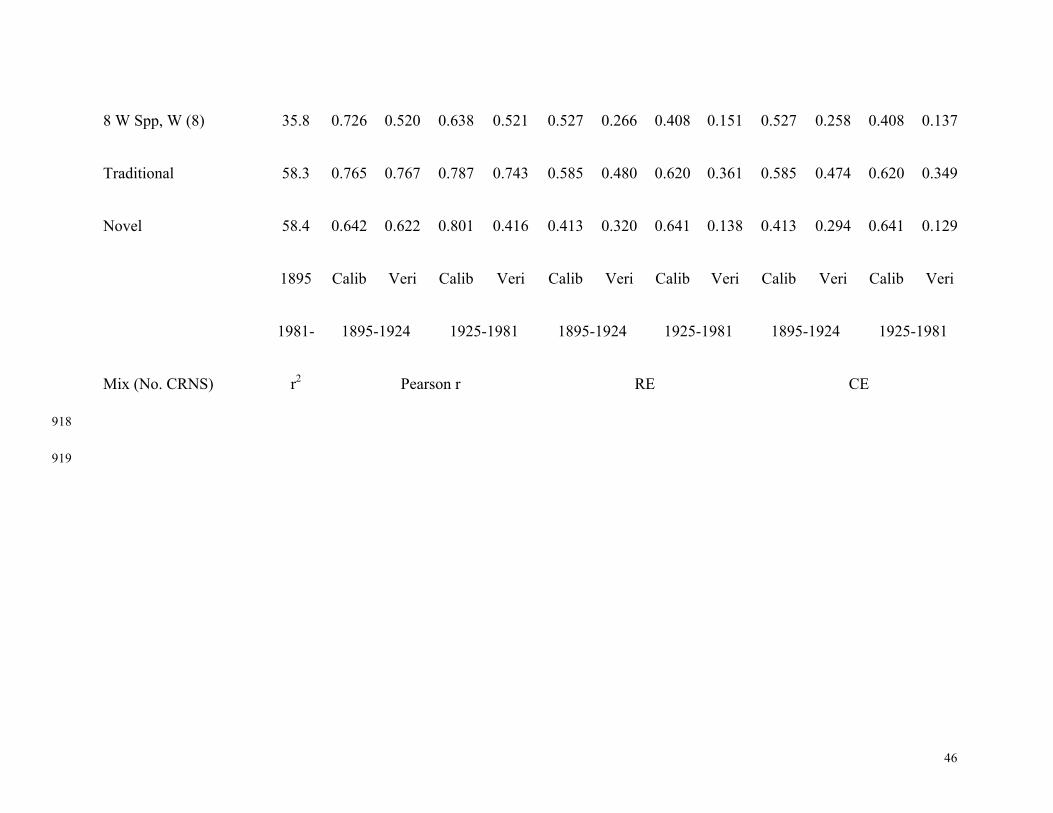
46
8 W Spp, W (8) 35.8 0.726 0.520 0.638 0.521 0.527 0.266 0.408 0.151 0.527 0.258 0.408 0.137
Traditional 58.3 0.765 0.767 0.787 0.743 0.585 0.480 0.620 0.361 0.585 0.474 0.620 0.349
Novel 58.4 0.642 0.622 0.801 0.416 0.413 0.320 0.641 0.138 0.413 0.294 0.641 0.129
1895 Calib Veri Calib Veri Calib Veri Calib Veri Calib Veri Calib Veri
1981- 1895-1924 1925-1981 1895-1924 1925-1981 1895-1924 1925-1981
Mix (No. CRNS) r2 Pearson r RE CE
918
919
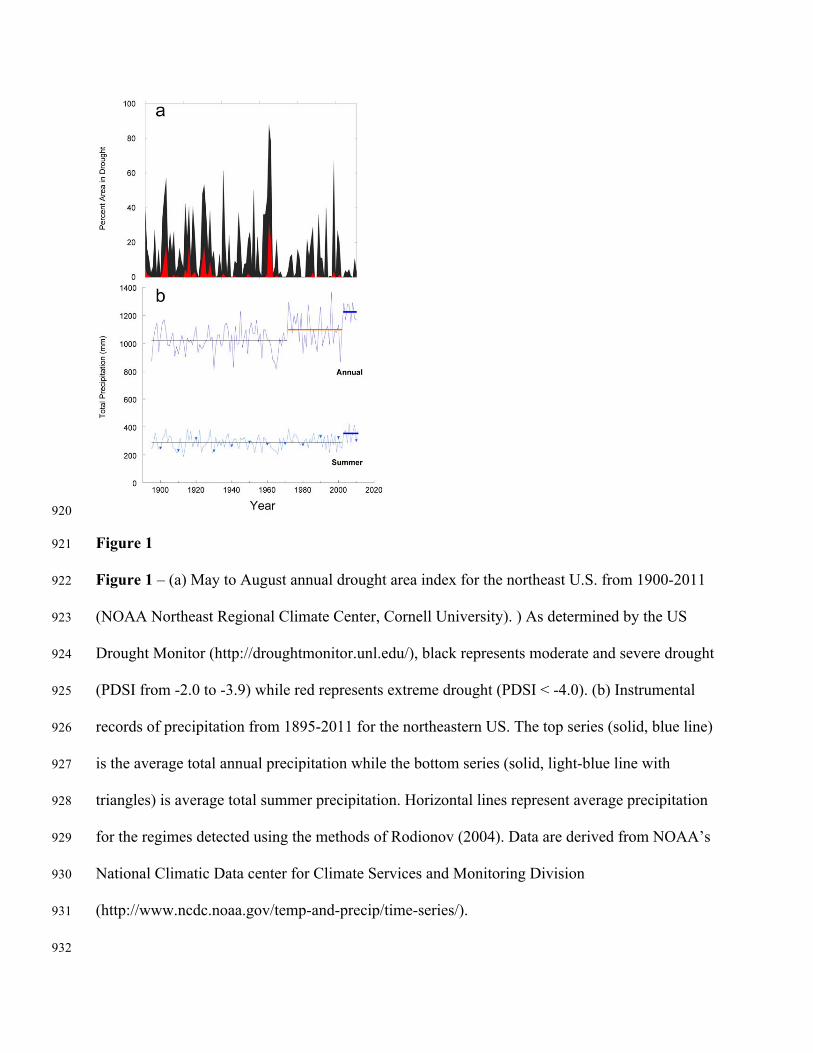
920
Figure 1 921
Figure 1 – (a) May to August annual drought area index for the northeast U.S. from 1900-2011 922
(NOAA Northeast Regional Climate Center, Cornell University). ) As determined by the US 923
Drought Monitor (http://droughtmonitor.unl.edu/), black represents moderate and severe drought 924
(PDSI from -2.0 to -3.9) while red represents extreme drought (PDSI < -4.0). (b) Instrumental 925
records of precipitation from 1895-2011 for the northeastern US. The top series (solid, blue line) 926
is the average total annual precipitation while the bottom series (solid, light-blue line with 927
triangles) is average total summer precipitation. Horizontal lines represent average precipitation 928
for the regimes detected using the methods of Rodionov (2004). Data are derived from NOAA’s 929
National Climatic Data center for Climate Services and Monitoring Division 930
(http://www.ncdc.noaa.gov/temp-and-precip/time-series/). 931
932
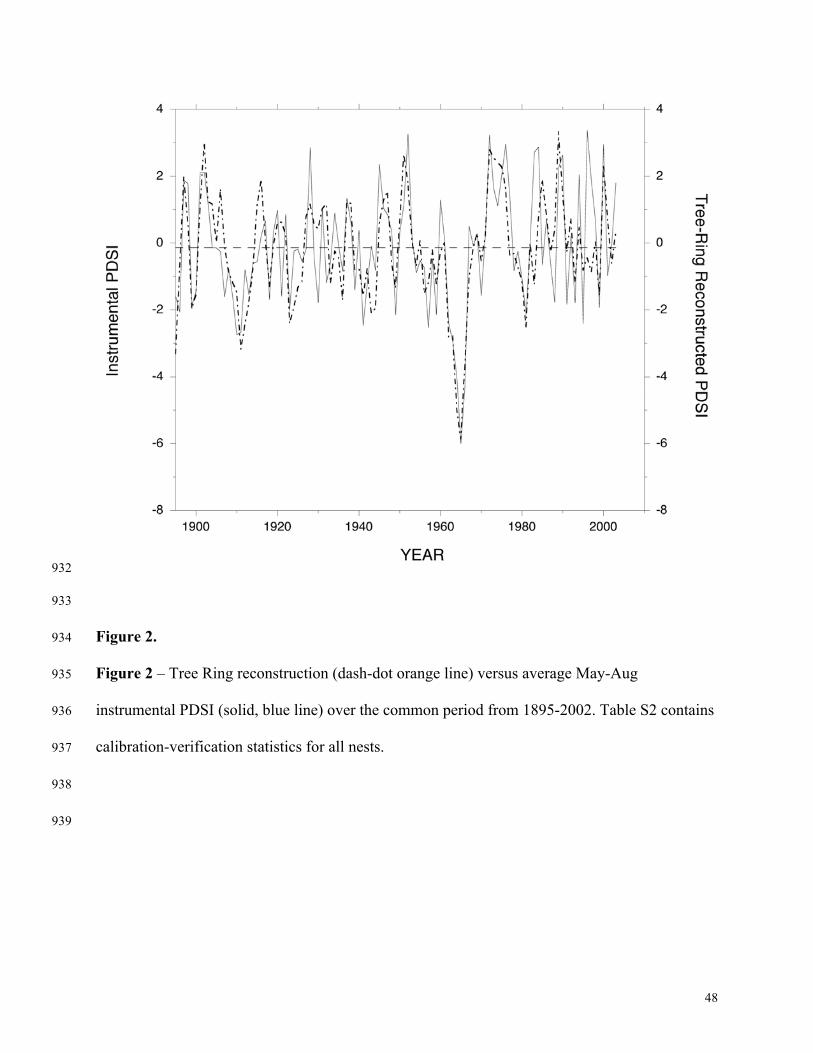
48
932
933
Figure 2. 934
Figure 2 – Tree Ring reconstruction (dash-dot orange line) versus average May-Aug 935
instrumental PDSI (solid, blue line) over the common period from 1895-2002. Table S2 contains 936
calibration-verification statistics for all nests. 937
938
939
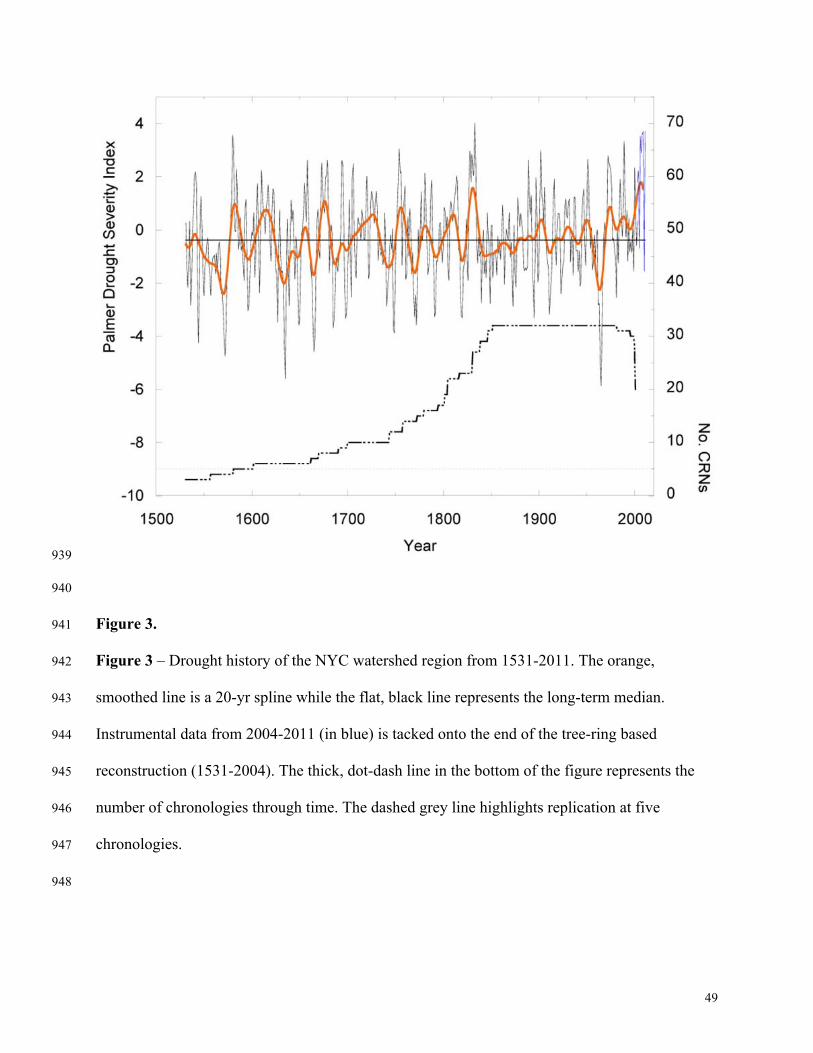
49
939
940
Figure 3. 941
Figure 3 – Drought history of the NYC watershed region from 1531-2011. The orange, 942
smoothed line is a 20-yr spline while the flat, black line represents the long-term median. 943
Instrumental data from 2004-2011 (in blue) is tacked onto the end of the tree-ring based 944
reconstruction (1531-2004). The thick, dot-dash line in the bottom of the figure represents the 945
number of chronologies through time. The dashed grey line highlights replication at five 946
chronologies. 947
948
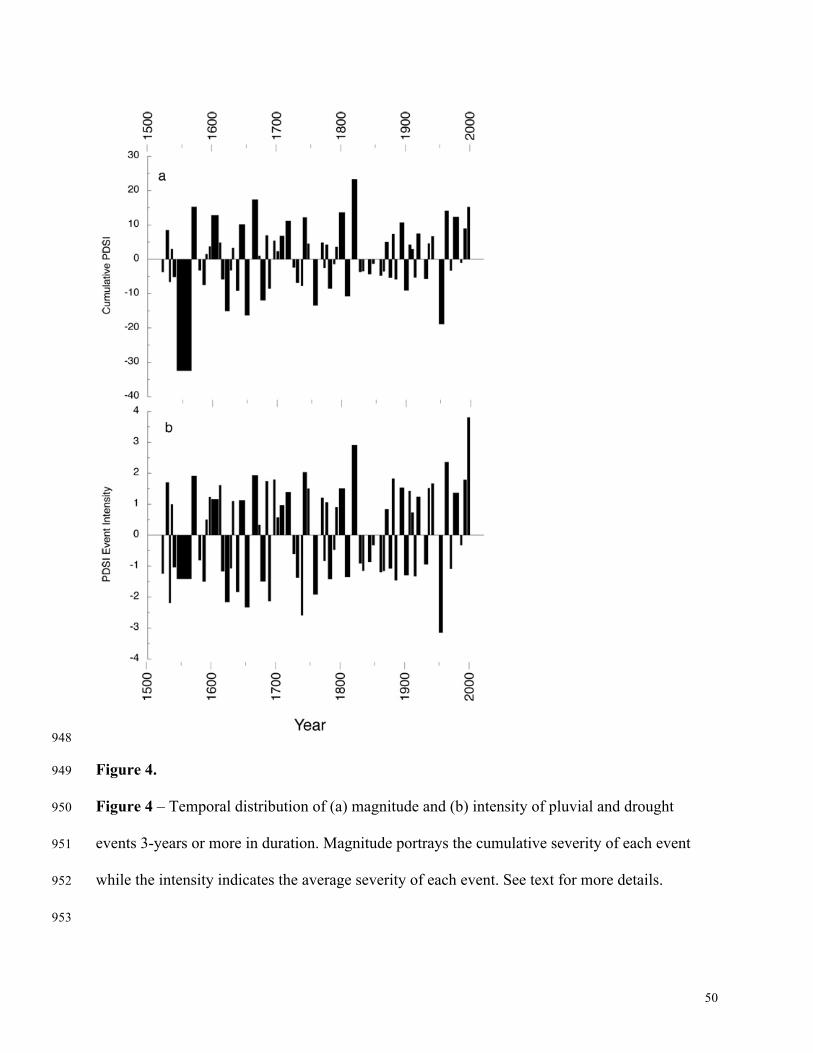
50
948
Figure 4. 949
Figure 4 – Temporal distribution of (a) magnitude and (b) intensity of pluvial and drought 950
events 3-years or more in duration. Magnitude portrays the cumulative severity of each event 951
while the intensity indicates the average severity of each event. See text for more details. 952
953
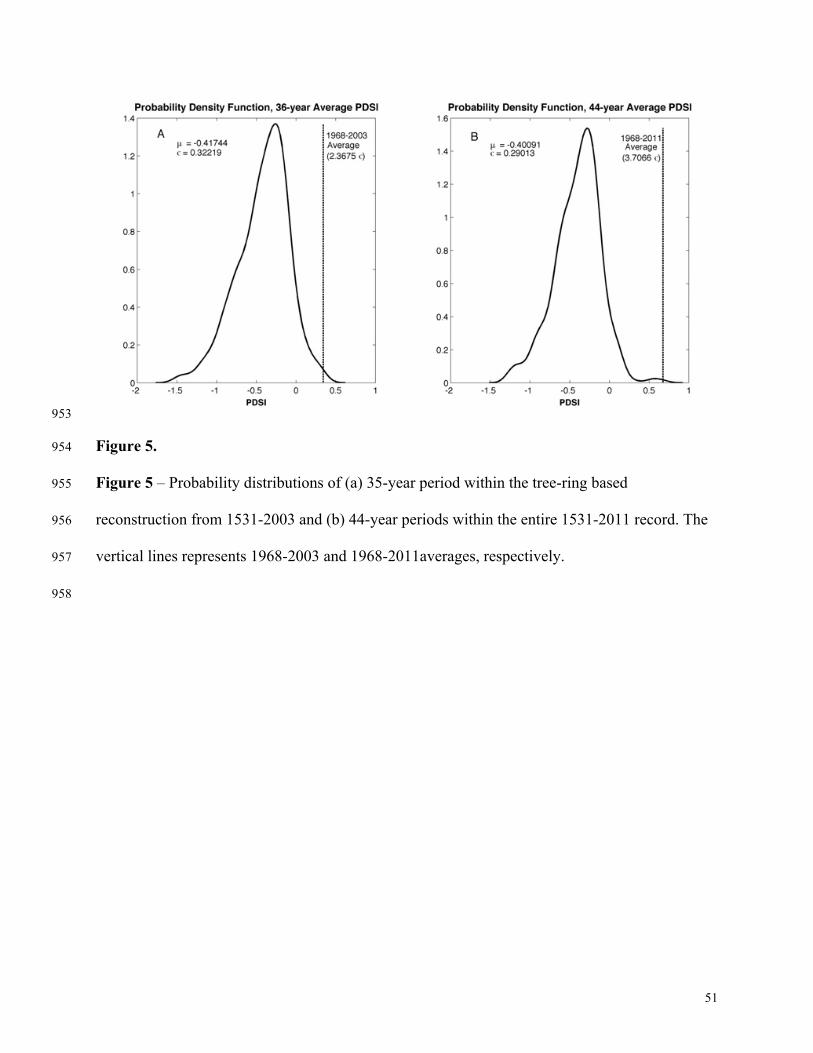
51
953
Figure 5. 954
Figure 5 – Probability distributions of (a) 35-year period within the tree-ring based 955
reconstruction from 1531-2003 and (b) 44-year periods within the entire 1531-2011 record. The 956
vertical lines represents 1968-2003 and 1968-2011averages, respectively. 957
958
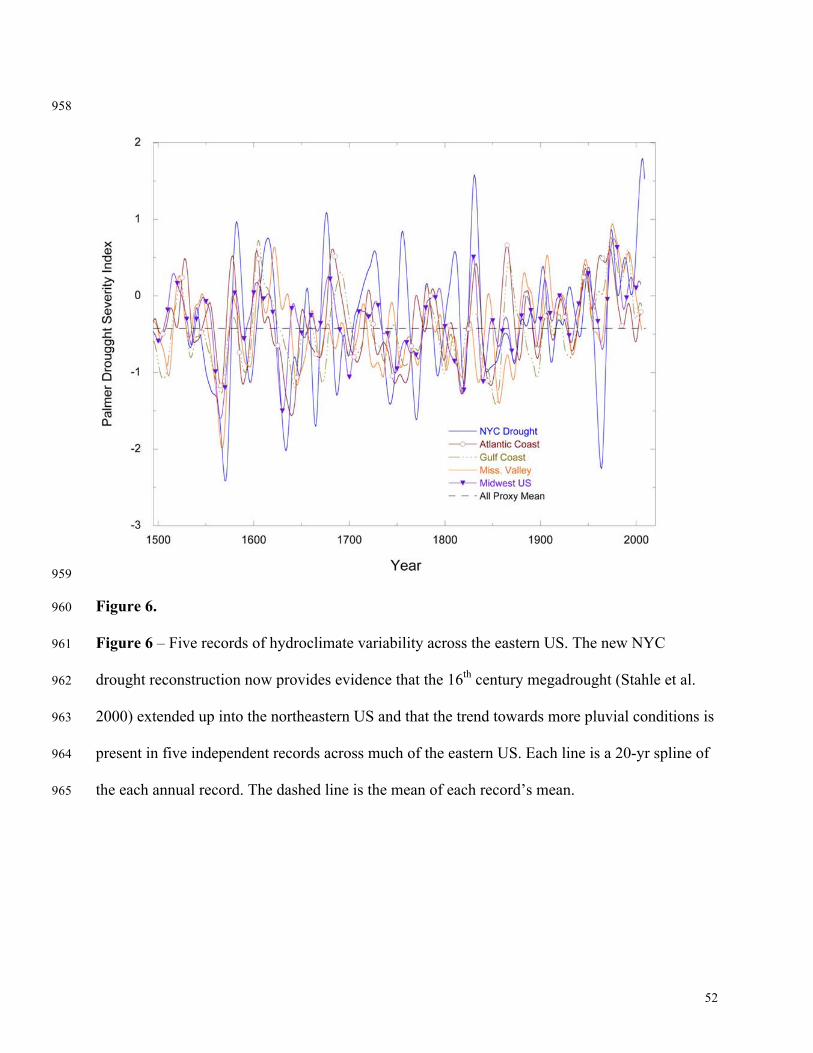
52
958
959
Figure 6. 960
Figure 6 – Five records of hydroclimate variability across the eastern US. The new NYC 961
drought reconstruction now provides evidence that the 16th century megadrought (Stahle et al. 962
2000) extended up into the northeastern US and that the trend towards more pluvial conditions is 963
present in five independent records across much of the eastern US. Each line is a 20-yr spline of 964
the each annual record. The dashed line is the mean of each record’s mean.965
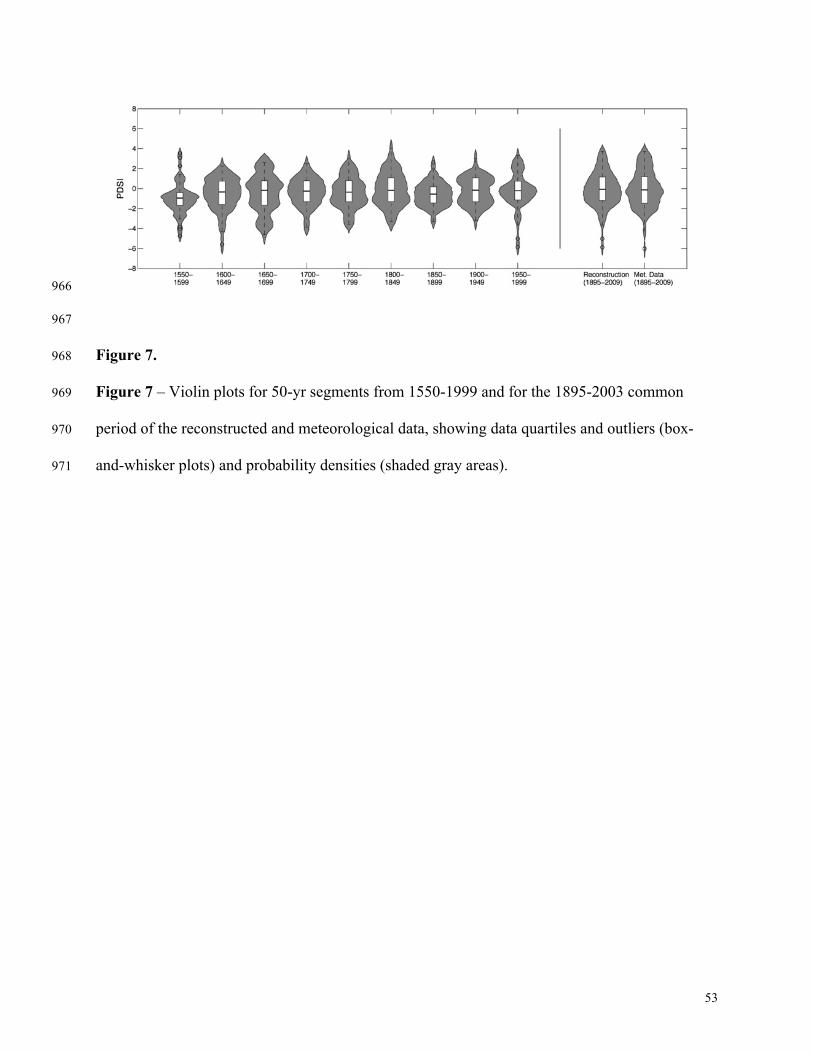
53
966
967
Figure 7. 968
Figure 7 – Violin plots for 50-yr segments from 1550-1999 and for the 1895-2003 common 969
period of the reconstructed and meteorological data, showing data quartiles and outliers (box-970
and-whisker plots) and probability densities (shaded gray areas). 971
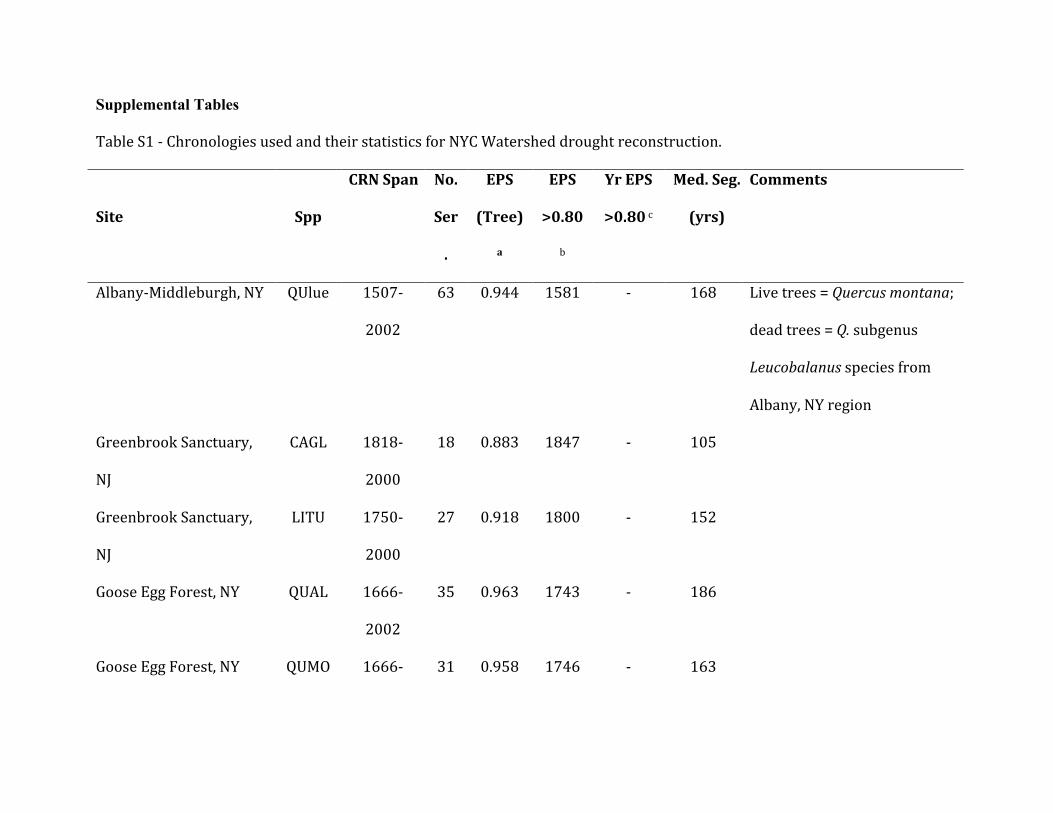
Supplemental Tables Table S1 -‐ Chronologies used and their statistics for NYC Watershed drought reconstruction.
Site
Spp
CRN Span No.
Ser
.
EPS
(Tree)
a
EPS
>0.80
b
Yr EPS
>0.80 c
Med. Seg.
(yrs)
Comments
Albany-‐Middleburgh, NY QUlue 1507-‐
2002
63 0.944 1581 -‐ 168 Live trees = Quercus montana;
dead trees = Q. subgenus
Leucobalanus species from
Albany, NY region
Greenbrook Sanctuary,
NJ
CAGL 1818-‐
2000
18 0.883 1847 -‐ 105
Greenbrook Sanctuary,
NJ
LITU 1750-‐
2000
27 0.918 1800 -‐ 152
Goose Egg Forest, NY QUAL 1666-‐
2002
35 0.963 1743 -‐ 186
Goose Egg Forest, NY QUMO 1666-‐ 31 0.958 1746 -‐ 163
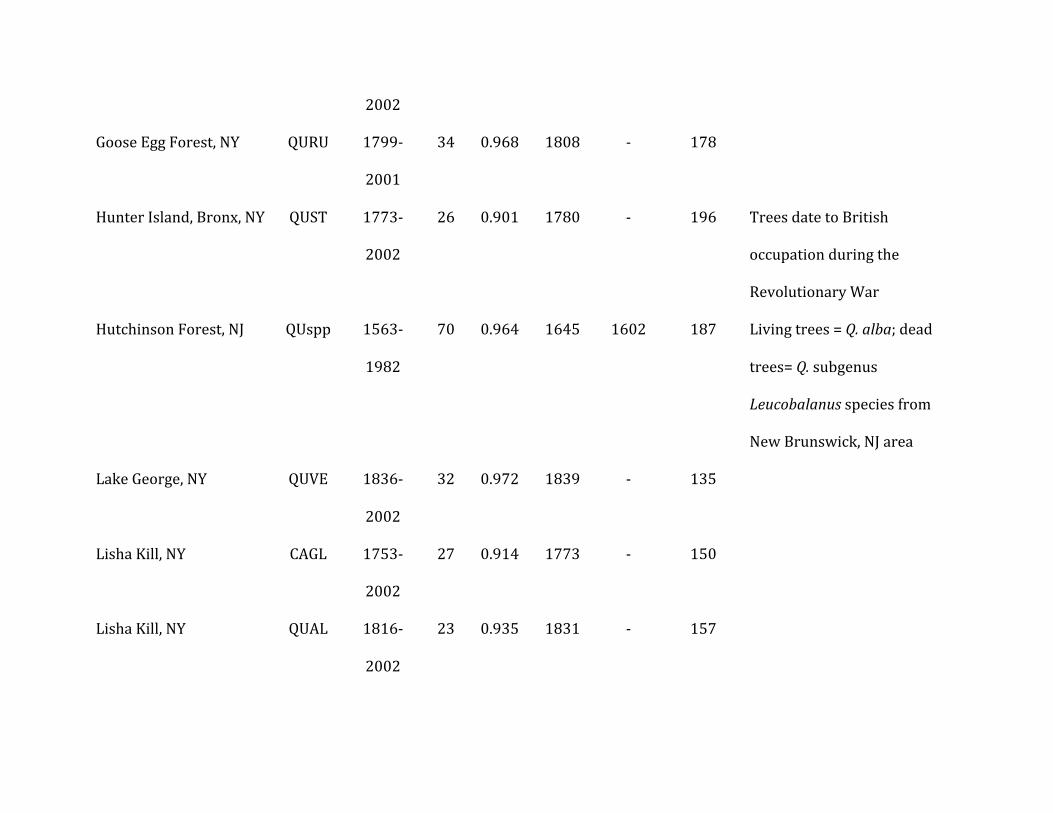
2002
Goose Egg Forest, NY QURU 1799-‐
2001
34 0.968 1808 -‐ 178
Hunter Island, Bronx, NY QUST 1773-‐
2002
26 0.901 1780 -‐ 196 Trees date to British
occupation during the
Revolutionary War
Hutchinson Forest, NJ QUspp 1563-‐
1982
70 0.964 1645
1602 187 Living trees = Q. alba; dead
trees= Q. subgenus
Leucobalanus species from
New Brunswick, NJ area
Lake George, NY QUVE 1836-‐
2002
32 0.972 1839 -‐ 135
Lisha Kill, NY CAGL 1753-‐
2002
27 0.914 1773 -‐ 150
Lisha Kill, NY QUAL 1816-‐
2002
23 0.935 1831 -‐ 157
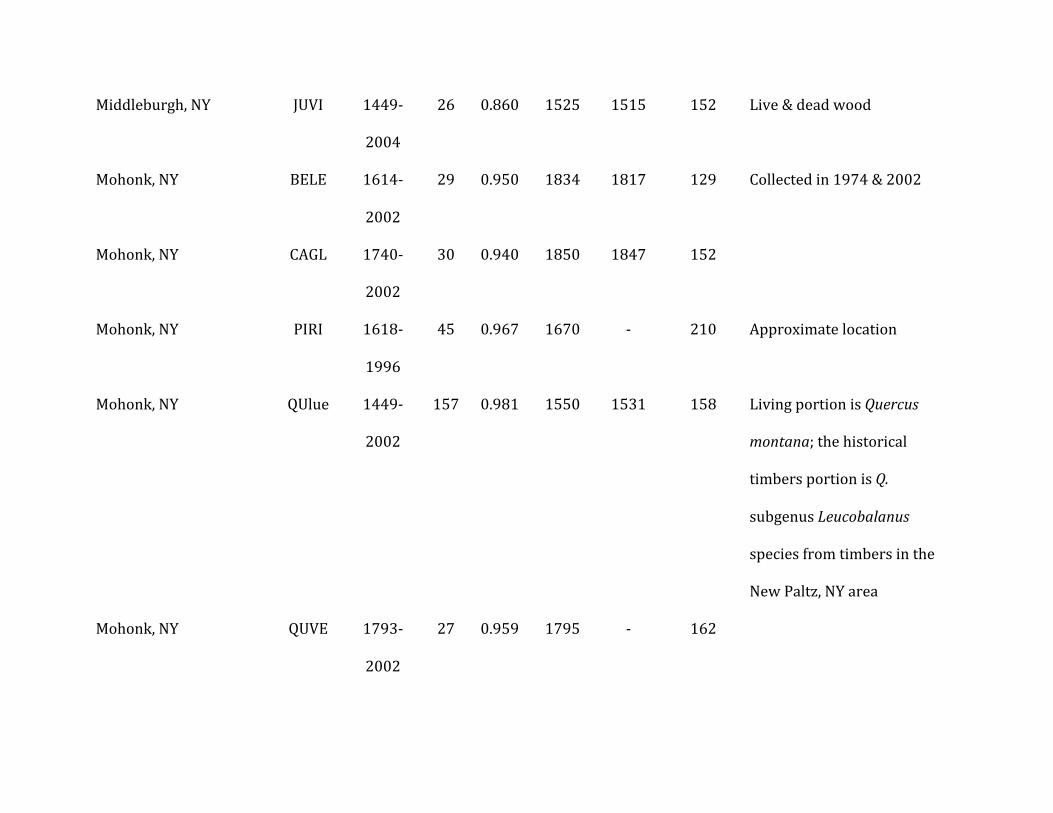
Middleburgh, NY JUVI 1449-‐
2004
26 0.860 1525 1515 152 Live & dead wood
Mohonk, NY BELE 1614-‐
2002
29 0.950 1834 1817 129 Collected in 1974 & 2002
Mohonk, NY CAGL 1740-‐
2002
30 0.940 1850 1847 152
Mohonk, NY PIRI 1618-‐
1996
45 0.967 1670 -‐ 210 Approximate location
Mohonk, NY QUlue 1449-‐
2002
157 0.981 1550
1531 158 Living portion is Quercus
montana; the historical
timbers portion is Q.
subgenus Leucobalanus
species from timbers in the
New Paltz, NY area
Mohonk, NY QUVE 1793-‐
2002
27 0.959 1795 -‐ 162
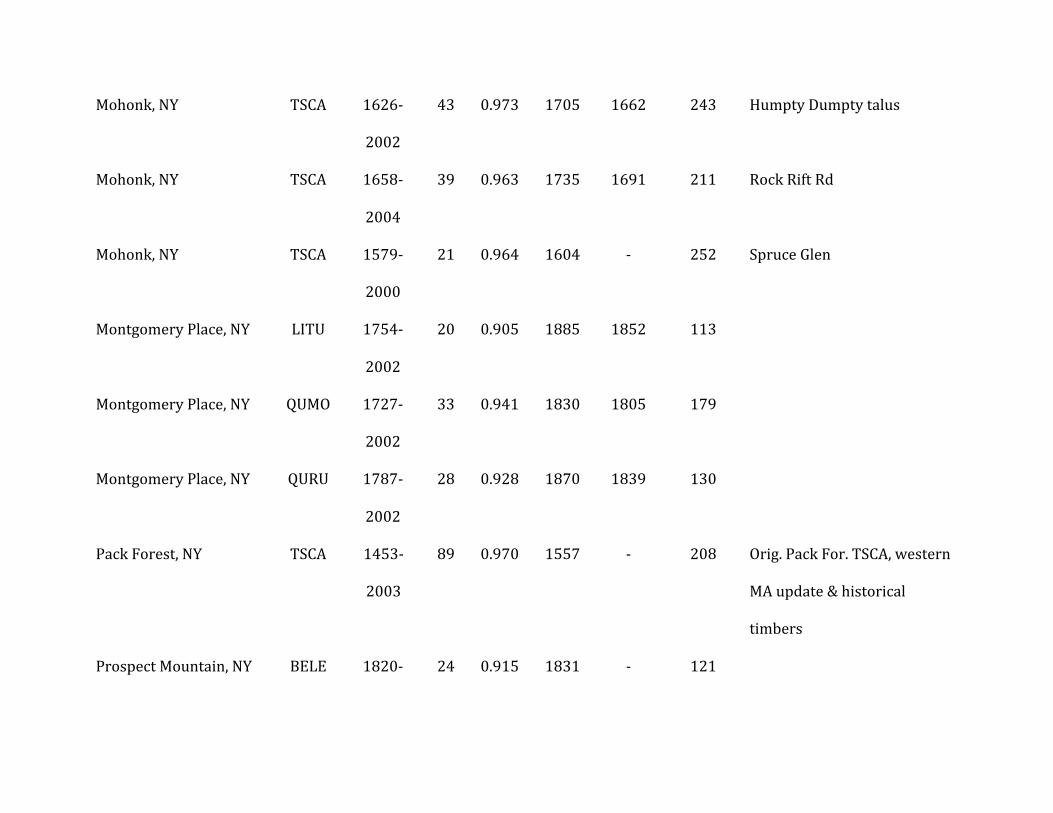
Mohonk, NY TSCA 1626-‐
2002
43 0.973 1705 1662 243 Humpty Dumpty talus
Mohonk, NY TSCA 1658-‐
2004
39 0.963 1735 1691 211 Rock Rift Rd
Mohonk, NY TSCA 1579-‐
2000
21 0.964 1604 -‐ 252 Spruce Glen
Montgomery Place, NY LITU 1754-‐
2002
20 0.905 1885 1852 113
Montgomery Place, NY QUMO 1727-‐
2002
33 0.941 1830 1805 179
Montgomery Place, NY QURU 1787-‐
2002
28 0.928 1870 1839 130
Pack Forest, NY TSCA 1453-‐
2003
89 0.970 1557 -‐ 208 Orig. Pack For. TSCA, western
MA update & historical
timbers
Prospect Mountain, NY BELE 1820-‐ 24 0.915 1831 -‐ 121
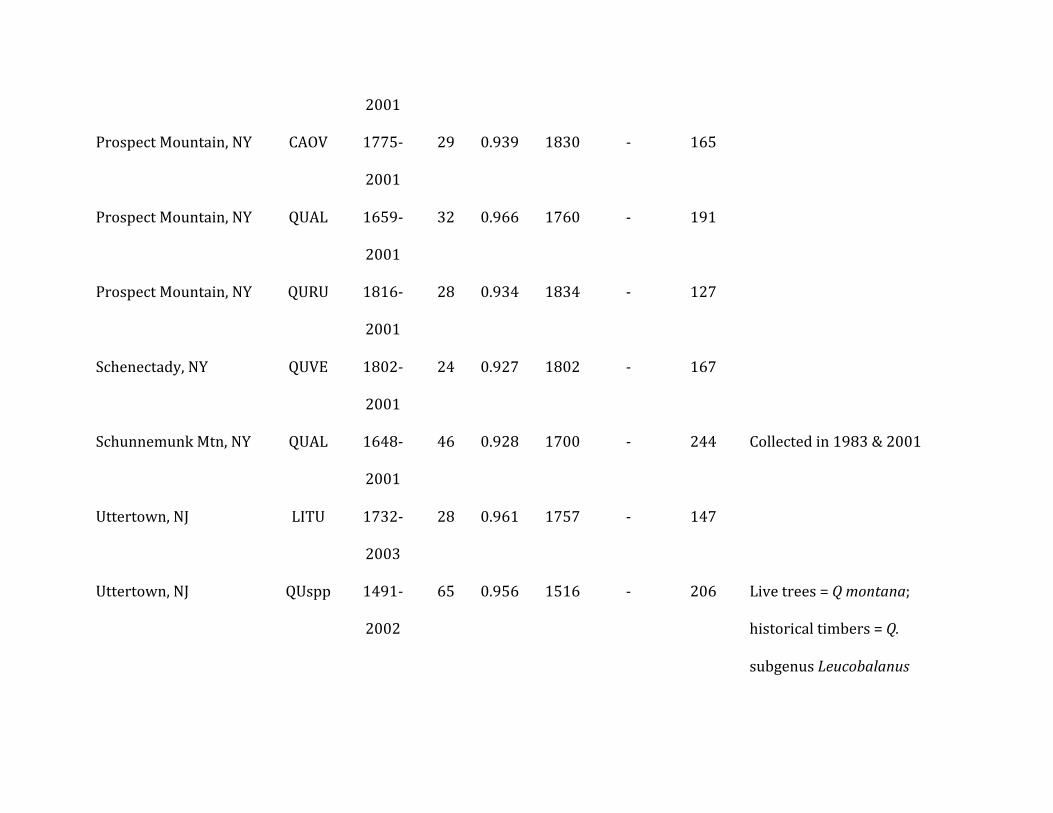
2001
Prospect Mountain, NY CAOV 1775-‐
2001
29 0.939 1830 -‐ 165
Prospect Mountain, NY QUAL 1659-‐
2001
32 0.966 1760 -‐ 191
Prospect Mountain, NY QURU 1816-‐
2001
28 0.934 1834 -‐ 127
Schenectady, NY QUVE 1802-‐
2001
24 0.927 1802 -‐ 167
Schunnemunk Mtn, NY QUAL 1648-‐
2001
46 0.928 1700 -‐ 244 Collected in 1983 & 2001
Uttertown, NJ LITU 1732-‐
2003
28 0.961 1757 -‐ 147
Uttertown, NJ QUspp 1491-‐
2002
65 0.956 1516 -‐ 206 Live trees = Q montana;
historical timbers = Q.
subgenus Leucobalanus
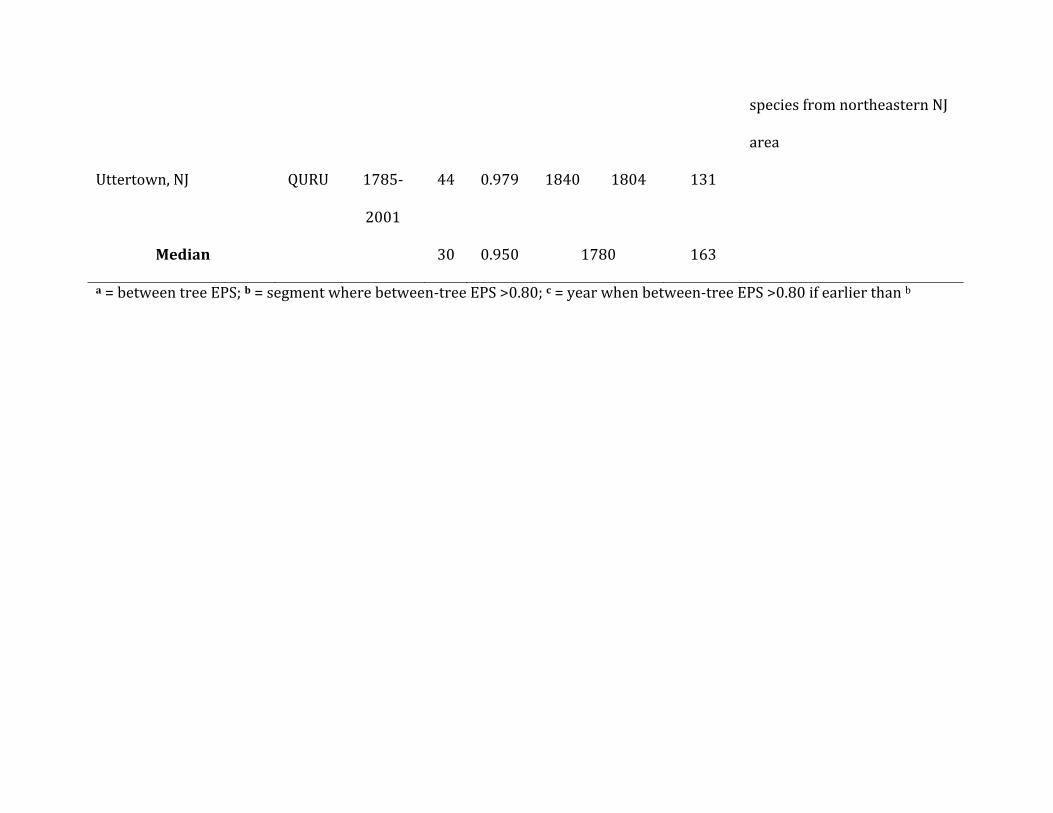
species from northeastern NJ
area
Uttertown, NJ QURU 1785-‐
2001
44 0.979 1840 1804 131
Median 30 0.950 1780 163
a = between tree EPS; b = segment where between-‐tree EPS >0.80; c = year when between-‐tree EPS >0.80 if earlier than b
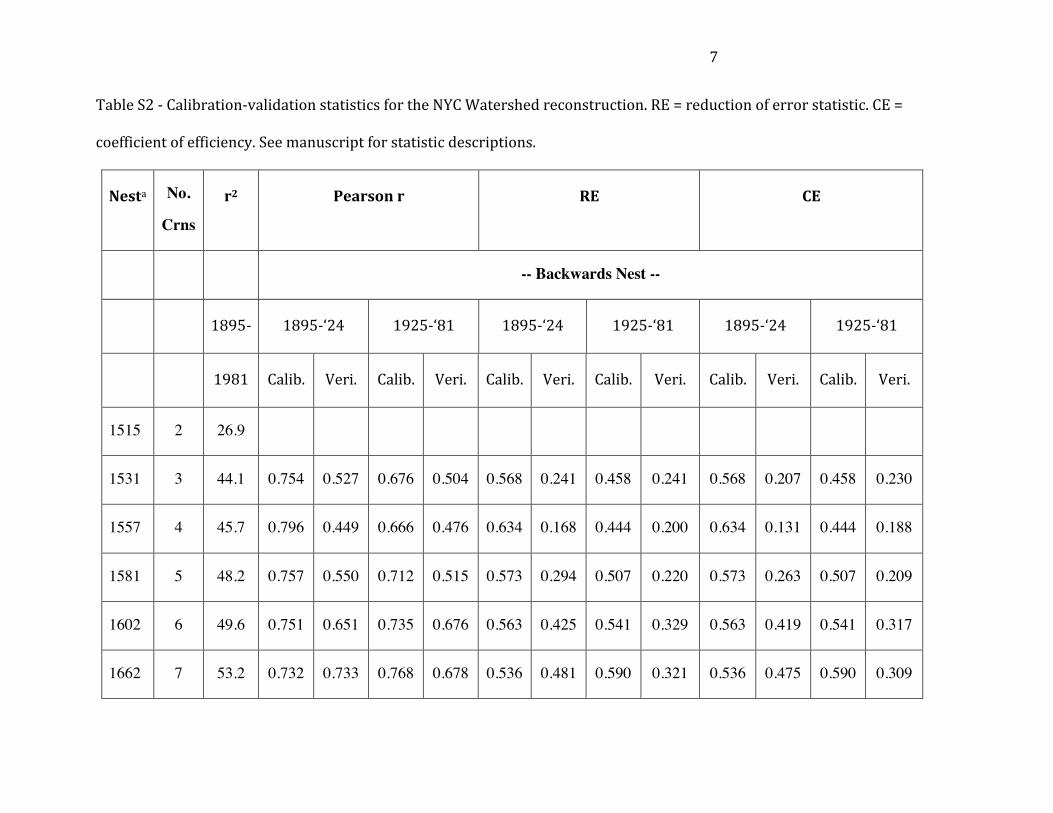
7
Table S2 -‐ Calibration-‐validation statistics for the NYC Watershed reconstruction. RE = reduction of error statistic. CE =
coefficient of efficiency. See manuscript for statistic descriptions.
Nesta No.
Crns
r2 Pearson r RE CE
-- Backwards Nest --
1895-‐ 1895-‐‘24 1925-‐‘81 1895-‐‘24 1925-‐‘81 1895-‐‘24 1925-‐‘81
1981 Calib. Veri. Calib. Veri. Calib. Veri. Calib. Veri. Calib. Veri. Calib. Veri.
1515 2 26.9
1531 3 44.1 0.754 0.527 0.676 0.504 0.568 0.241 0.458 0.241 0.568 0.207 0.458 0.230
1557 4 45.7 0.796 0.449 0.666 0.476 0.634 0.168 0.444 0.200 0.634 0.131 0.444 0.188
1581 5 48.2 0.757 0.550 0.712 0.515 0.573 0.294 0.507 0.220 0.573 0.263 0.507 0.209
1602 6 49.6 0.751 0.651 0.735 0.676 0.563 0.425 0.541 0.329 0.563 0.419 0.541 0.317
1662 7 53.2 0.732 0.733 0.768 0.678 0.536 0.481 0.590 0.321 0.536 0.475 0.590 0.309
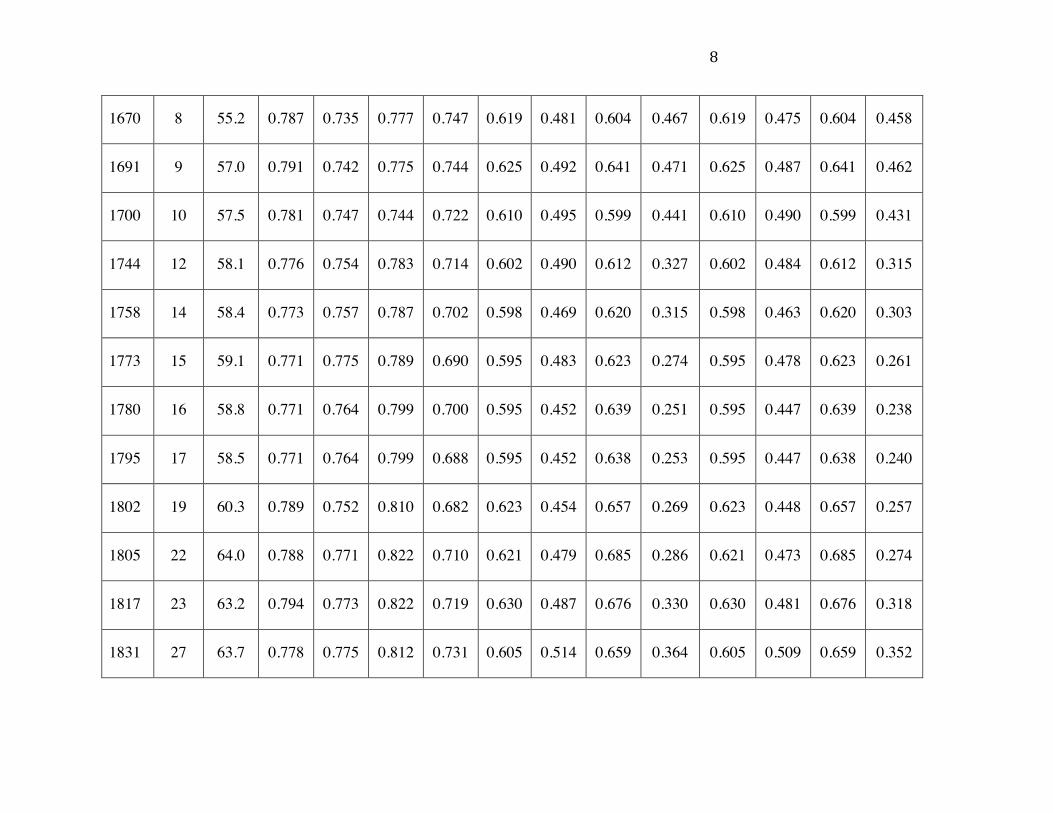
8
1670 8 55.2 0.787 0.735 0.777 0.747 0.619 0.481 0.604 0.467 0.619 0.475 0.604 0.458
1691 9 57.0 0.791 0.742 0.775 0.744 0.625 0.492 0.641 0.471 0.625 0.487 0.641 0.462
1700 10 57.5 0.781 0.747 0.744 0.722 0.610 0.495 0.599 0.441 0.610 0.490 0.599 0.431
1744 12 58.1 0.776 0.754 0.783 0.714 0.602 0.490 0.612 0.327 0.602 0.484 0.612 0.315
1758 14 58.4 0.773 0.757 0.787 0.702 0.598 0.469 0.620 0.315 0.598 0.463 0.620 0.303
1773 15 59.1 0.771 0.775 0.789 0.690 0.595 0.483 0.623 0.274 0.595 0.478 0.623 0.261
1780 16 58.8 0.771 0.764 0.799 0.700 0.595 0.452 0.639 0.251 0.595 0.447 0.639 0.238
1795 17 58.5 0.771 0.764 0.799 0.688 0.595 0.452 0.638 0.253 0.595 0.447 0.638 0.240
1802 19 60.3 0.789 0.752 0.810 0.682 0.623 0.454 0.657 0.269 0.623 0.448 0.657 0.257
1805 22 64.0 0.788 0.771 0.822 0.710 0.621 0.479 0.685 0.286 0.621 0.473 0.685 0.274
1817 23 63.2 0.794 0.773 0.822 0.719 0.630 0.487 0.676 0.330 0.630 0.481 0.676 0.318
1831 27 63.7 0.778 0.775 0.812 0.731 0.605 0.514 0.659 0.364 0.605 0.509 0.659 0.352
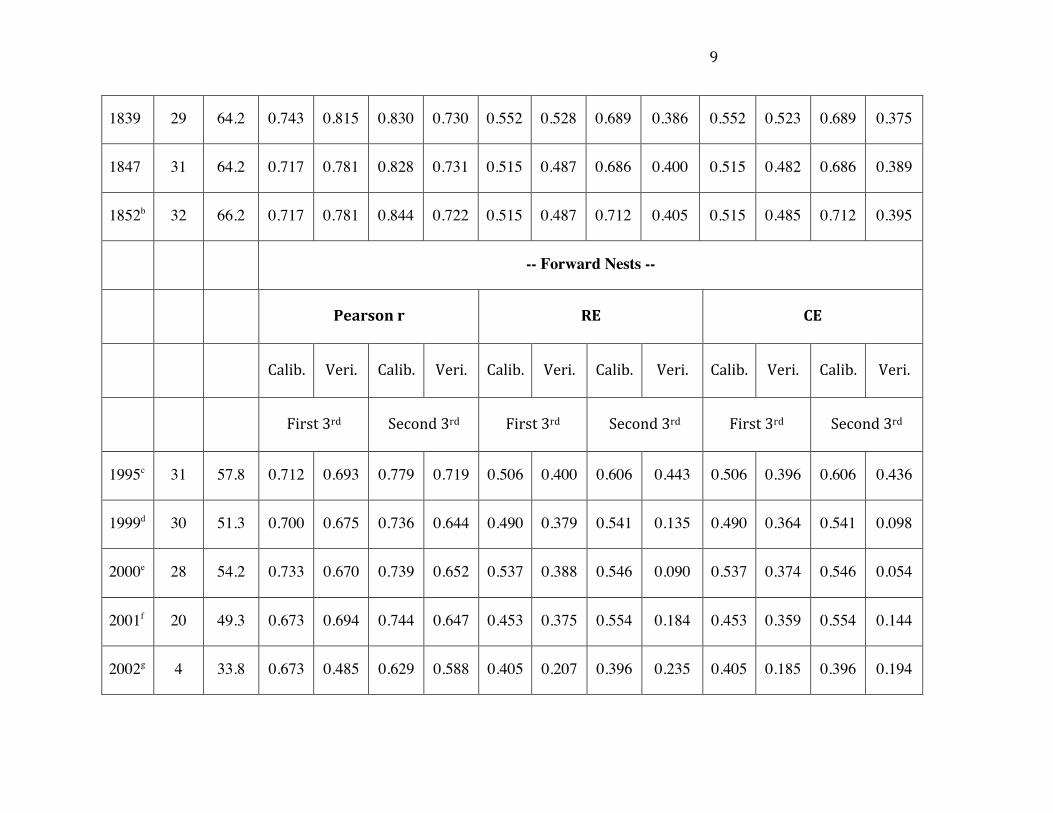
9
1839 29 64.2 0.743 0.815 0.830 0.730 0.552 0.528 0.689 0.386 0.552 0.523 0.689 0.375
1847 31 64.2 0.717 0.781 0.828 0.731 0.515 0.487 0.686 0.400 0.515 0.482 0.686 0.389
1852b 32 66.2 0.717 0.781 0.844 0.722 0.515 0.487 0.712 0.405 0.515 0.485 0.712 0.395
-- Forward Nests --
Pearson r RE CE
Calib. Veri. Calib. Veri. Calib. Veri. Calib. Veri. Calib. Veri. Calib. Veri.
First 3rd Second 3rd First 3rd Second 3rd First 3rd Second 3rd
1995c 31 57.8 0.712 0.693 0.779 0.719 0.506 0.400 0.606 0.443 0.506 0.396 0.606 0.436
1999d 30 51.3 0.700 0.675 0.736 0.644 0.490 0.379 0.541 0.135 0.490 0.364 0.541 0.098
2000e 28 54.2 0.733 0.670 0.739 0.652 0.537 0.388 0.546 0.090 0.537 0.374 0.546 0.054
2001f 20 49.3 0.673 0.694 0.744 0.647 0.453 0.375 0.554 0.184 0.453 0.359 0.554 0.144
2002g 4 33.8 0.673 0.485 0.629 0.588 0.405 0.207 0.396 0.235 0.405 0.185 0.396 0.194
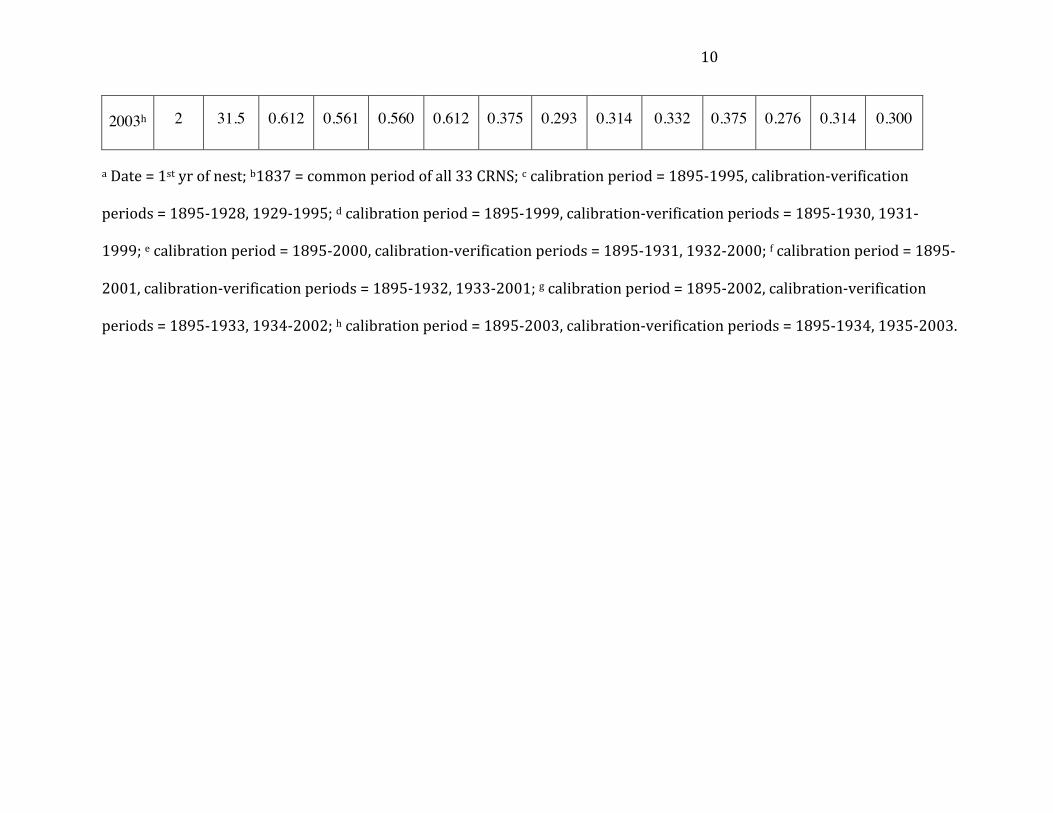
10
2003h 2 31.5 0.612 0.561 0.560 0.612 0.375 0.293 0.314 0.332 0.375 0.276 0.314 0.300
a Date = 1st yr of nest; b1837 = common period of all 33 CRNS; c calibration period = 1895-‐1995, calibration-‐verification
periods = 1895-‐1928, 1929-‐1995; d calibration period = 1895-‐1999, calibration-‐verification periods = 1895-‐1930, 1931-‐
1999; e calibration period = 1895-‐2000, calibration-‐verification periods = 1895-‐1931, 1932-‐2000; f calibration period = 1895-‐
2001, calibration-‐verification periods = 1895-‐1932, 1933-‐2001; g calibration period = 1895-‐2002, calibration-‐verification
periods = 1895-‐1933, 1934-‐2002; h calibration period = 1895-‐2003, calibration-‐verification periods = 1895-‐1934, 1935-‐2003.
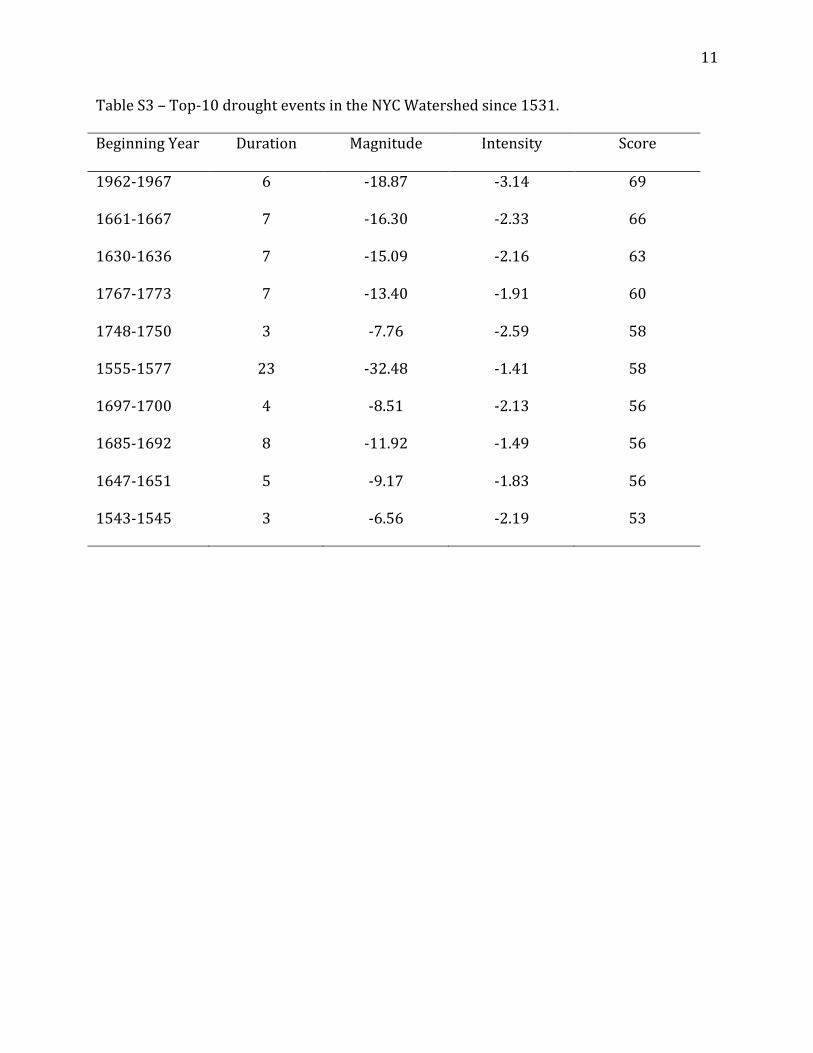
11
Table S3 – Top-‐10 drought events in the NYC Watershed since 1531.
Beginning Year Duration Magnitude Intensity Score
1962-‐1967 6 -‐18.87 -‐3.14 69
1661-‐1667 7 -‐16.30 -‐2.33 66
1630-‐1636 7 -‐15.09 -‐2.16 63
1767-‐1773 7 -‐13.40 -‐1.91 60
1748-‐1750 3 -‐7.76 -‐2.59 58
1555-‐1577 23 -‐32.48 -‐1.41 58
1697-‐1700 4 -‐8.51 -‐2.13 56
1685-‐1692 8 -‐11.92 -‐1.49 56
1647-‐1651 5 -‐9.17 -‐1.83 56
1543-‐1545 3 -‐6.56 -‐2.19 53
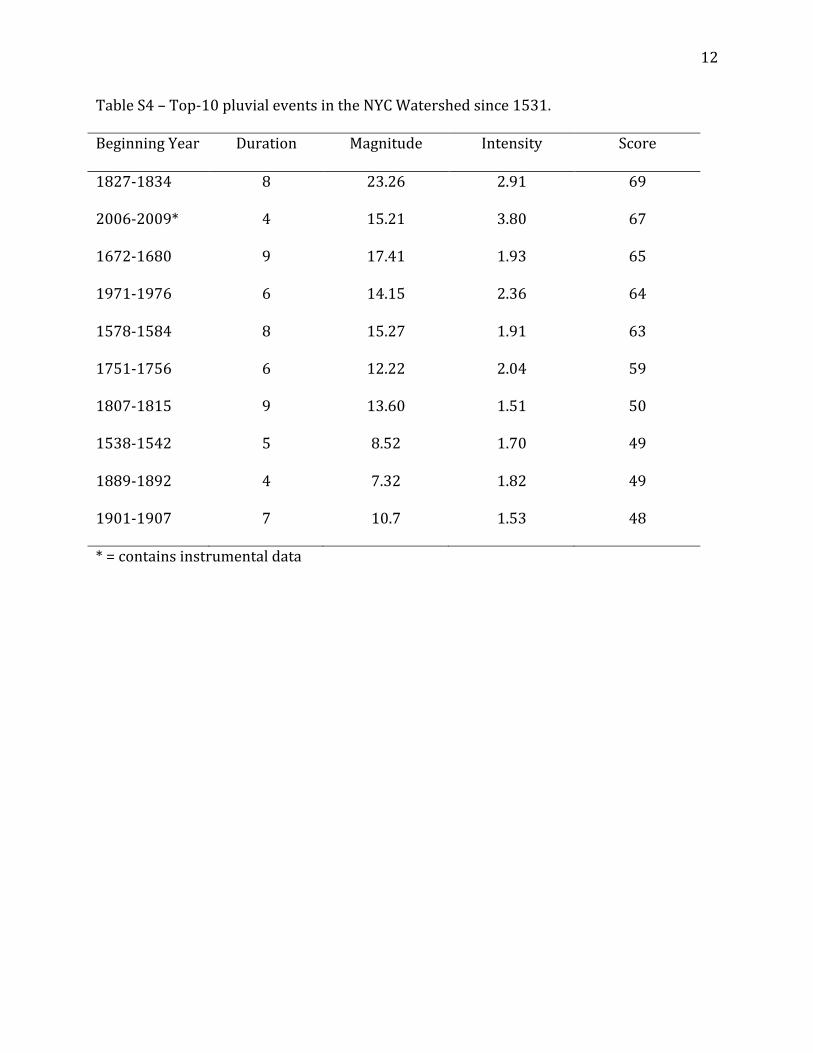
12
Table S4 – Top-‐10 pluvial events in the NYC Watershed since 1531.
Beginning Year Duration Magnitude Intensity Score
1827-‐1834 8 23.26 2.91 69
2006-‐2009* 4 15.21 3.80 67
1672-‐1680 9 17.41 1.93 65
1971-‐1976 6 14.15 2.36 64
1578-‐1584 8 15.27 1.91 63
1751-‐1756 6 12.22 2.04 59
1807-‐1815 9 13.60 1.51 50
1538-‐1542 5 8.52 1.70 49
1889-‐1892 4 7.32 1.82 49
1901-‐1907 7 10.7 1.53 48
* = contains instrumental data
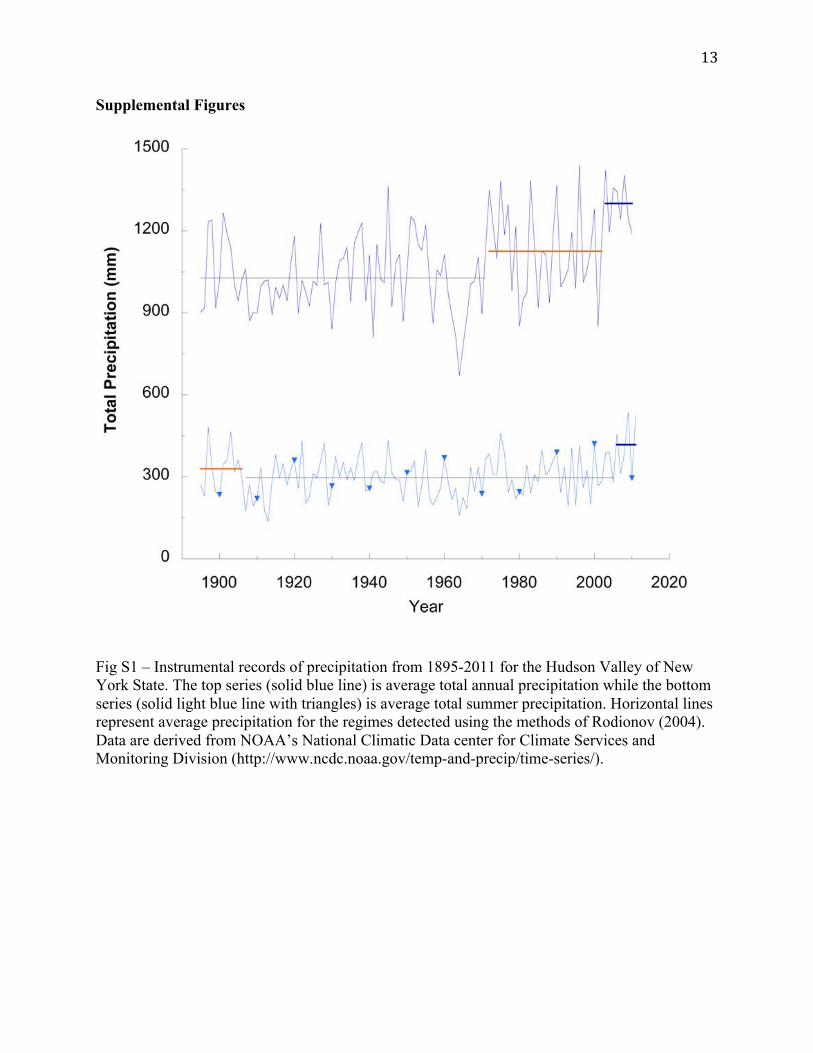
13
Supplemental Figures
Fig S1 – Instrumental records of precipitation from 1895-2011 for the Hudson Valley of New York State. The top series (solid blue line) is average total annual precipitation while the bottom series (solid light blue line with triangles) is average total summer precipitation. Horizontal lines represent average precipitation for the regimes detected using the methods of Rodionov (2004). Data are derived from NOAA’s National Climatic Data center for Climate Services and Monitoring Division (http://www.ncdc.noaa.gov/temp-and-precip/time-series/).
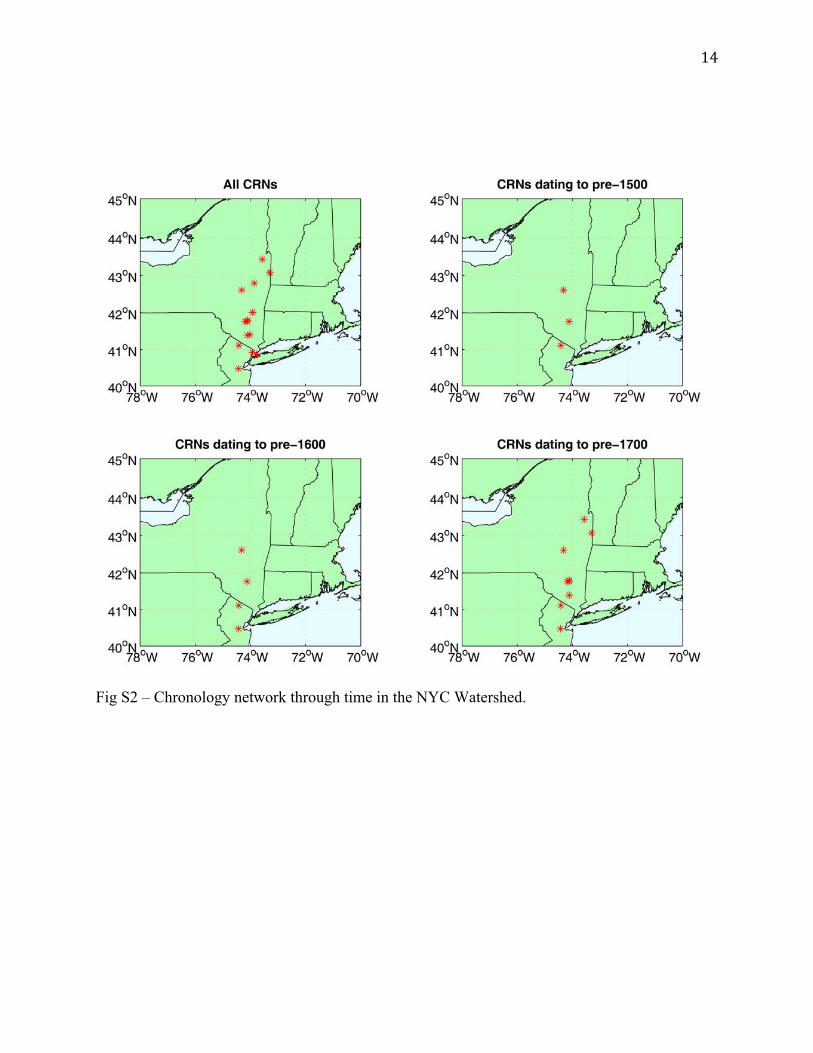
14
Fig S2 – Chronology network through time in the NYC Watershed.
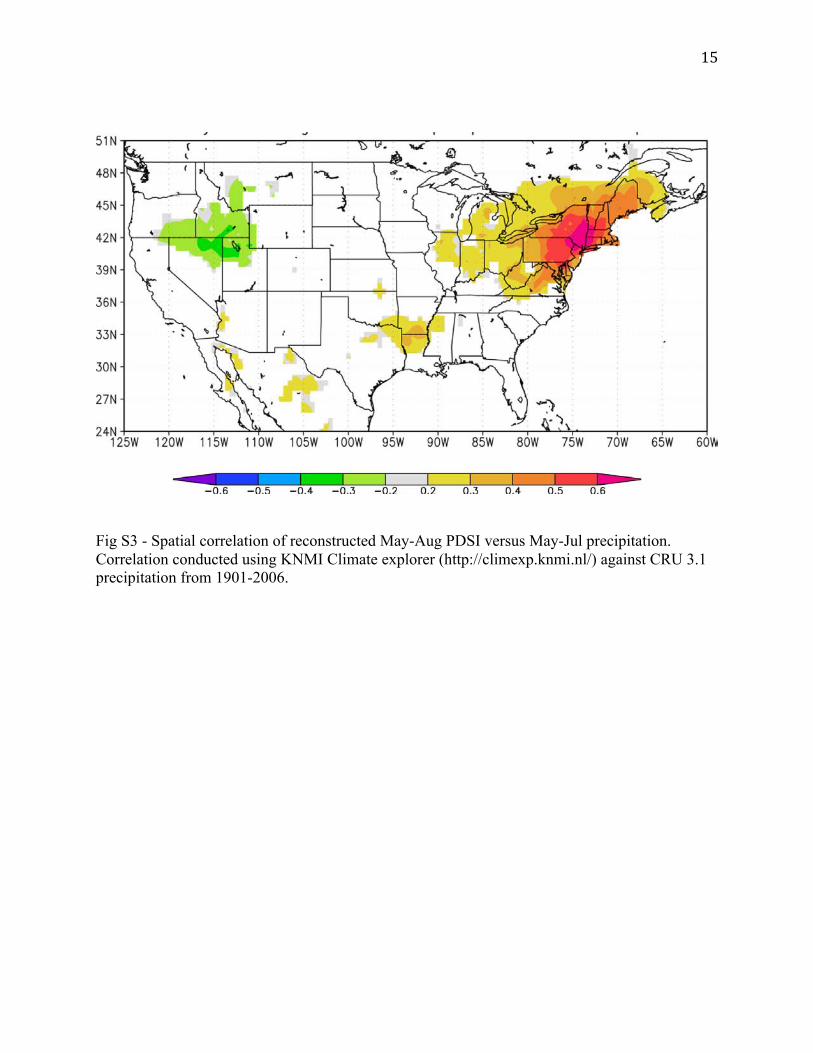
15
Fig S3 - Spatial correlation of reconstructed May-Aug PDSI versus May-Jul precipitation. Correlation conducted using KNMI Climate explorer (http://climexp.knmi.nl/) against CRU 3.1 precipitation from 1901-2006.
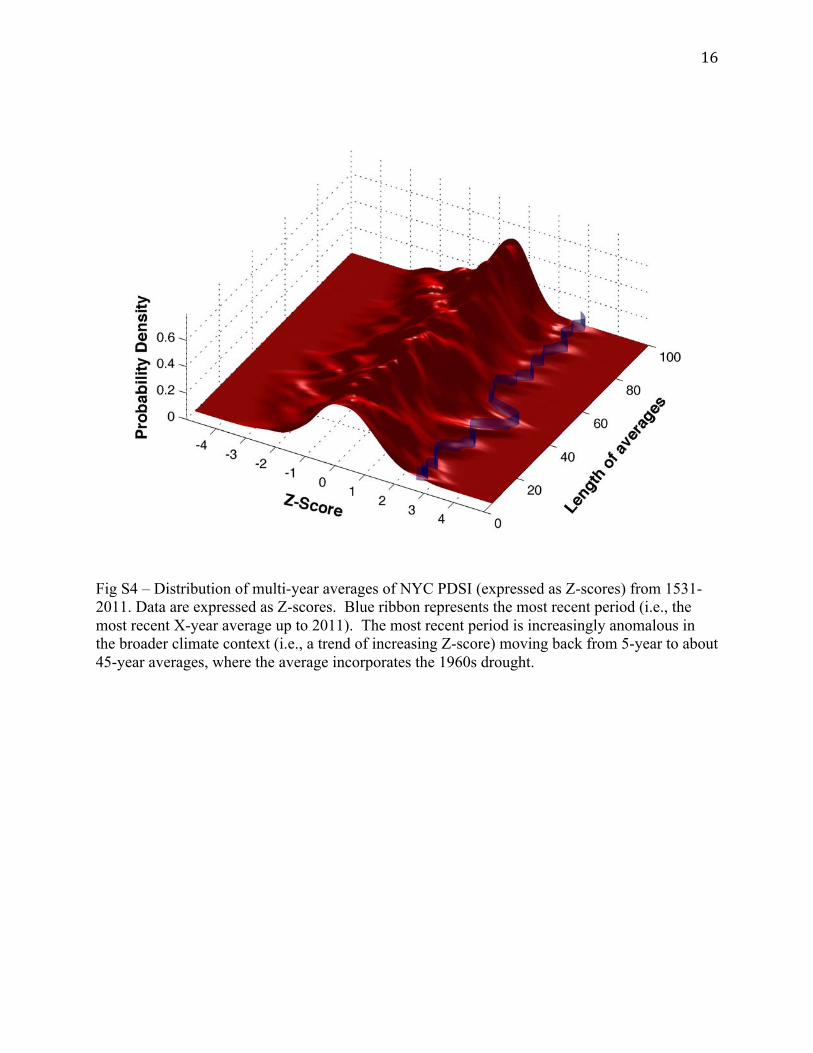
16
Fig S4 – Distribution of multi-year averages of NYC PDSI (expressed as Z-scores) from 1531-2011. Data are expressed as Z-scores. Blue ribbon represents the most recent period (i.e., the most recent X-year average up to 2011). The most recent period is increasingly anomalous in the broader climate context (i.e., a trend of increasing Z-score) moving back from 5-year to about 45-year averages, where the average incorporates the 1960s drought.
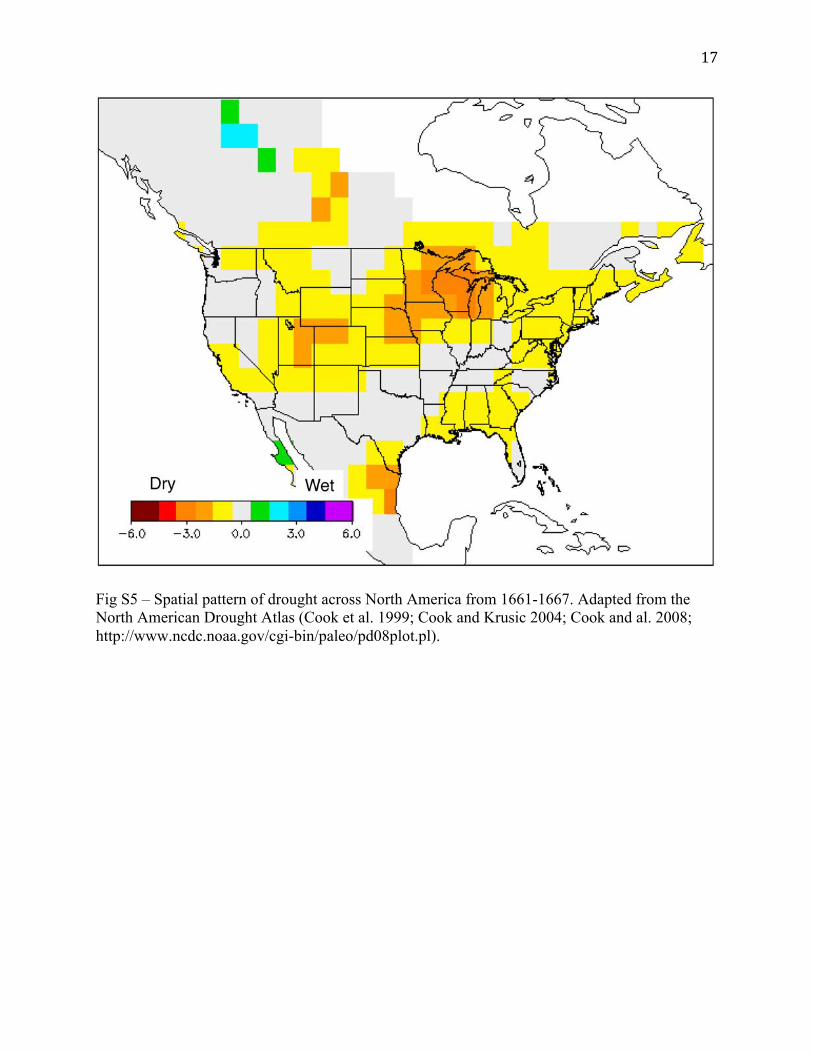
17
Fig S5 – Spatial pattern of drought across North America from 1661-1667. Adapted from the North American Drought Atlas (Cook et al. 1999; Cook and Krusic 2004; Cook and al. 2008; http://www.ncdc.noaa.gov/cgi-bin/paleo/pd08plot.pl).
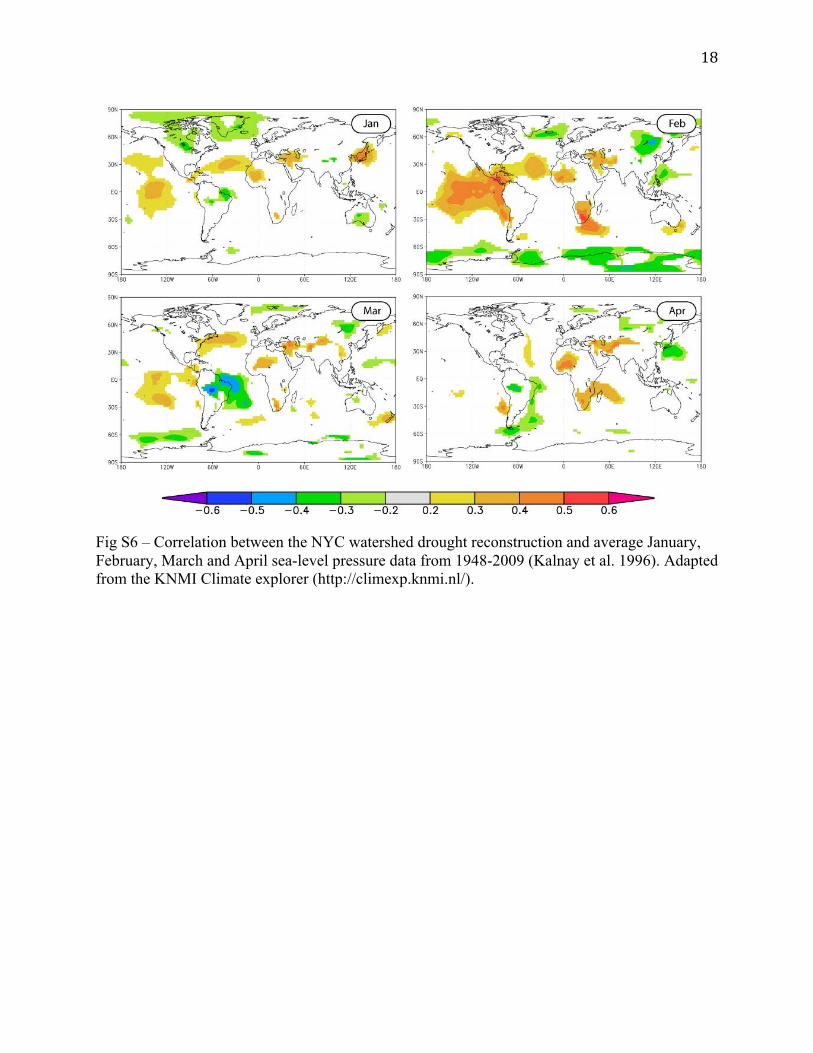
18
Fig S6 – Correlation between the NYC watershed drought reconstruction and average January, February, March and April sea-level pressure data from 1948-2009 (Kalnay et al. 1996). Adapted from the KNMI Climate explorer (http://climexp.knmi.nl/).
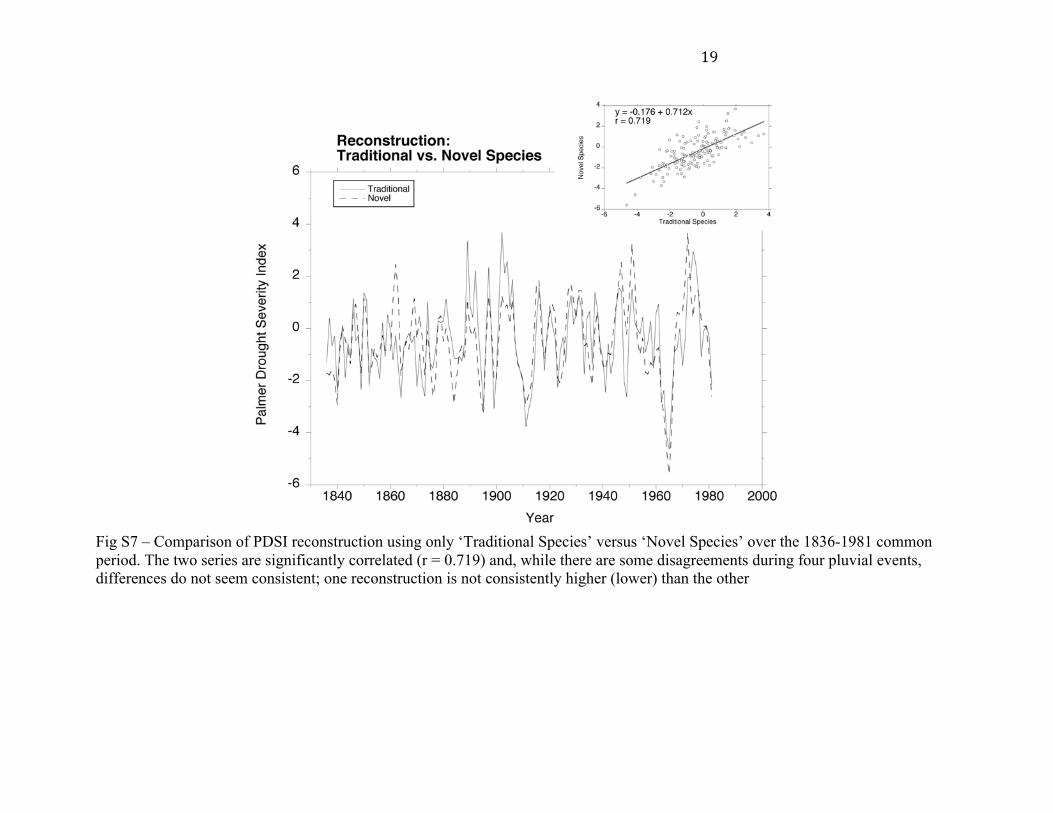
19
Fig S7 – Comparison of PDSI reconstruction using only ‘Traditional Species’ versus ‘Novel Species’ over the 1836-1981 common period. The two series are significantly correlated (r = 0.719) and, while there are some disagreements during four pluvial events, differences do not seem consistent; one reconstruction is not consistently higher (lower) than the other
20
Supplemental Text Implications for Tree-ring Based Reconstructions in Mesic Regions
We found that Liriodendron tulipifera was found to be one of the best species to
reconstruct hydroclimate, a finding similar in the reconstruction of the Potomac River
(Maxwell et al. 2011). Liriodendron tulipifera has two traits that make it nearly an ideal
replacement of Tsuga canadensis. First, its AREV value is nearly equal to Tsuga canadensis
(Table 1). However, the next trait that makes Liriodendron tulipifera an especially
appealing replacement species is that it has recently been documented as often living
longer than 400 years (Eastern OLDLIST 2011). In fact, the new documented maximum age
for Liriodendron tulipifera of 512 years is from a hollow tree where only half of its radius
was recovered (Pederson 2010). It would not be surprising if Liriodendron tulipifera’s
maximum age reaches 600 years, if not 700 years, with future sampling. The only limitation
for this species is that it does not live as far north or in the cold environments like Tsuga
canadensis. Until disease or a pest is found to significantly impact Liriodendron tulipifera,
this species seems like the best replacement for Tsuga canadensis.
Three other species new to dendroclimatic research are recommended as potential
replacements for Tsuga canadensis or, at the very least, useful for dendrohydroclimatic
research: Betula lenta, Carya glabra and Quercus rubra. Each has good AREV values and can
be regularly found more than 200 years in age. It is not too unusual to find Betula lenta and
Carya glabra 250-‐300+ years old (Pederson et al. 2005, Eastern OLDLIST 2011). Continued
exploration of species like Carya glabra will likely reveal greater ages as has been found for
other less-‐well studied species like Betula lenta. While Quercus rubra’s AREV is relatively
low, one chronology has a value = 4.00, which is greater than the median AREV of all
21
chronologies used here (2.59). One limitation is that Quercus rubra rarely reaches more
than 300 years (Orwig et al. 2001, Eastern OLDLIST 2011).
Literature Cited
Cook, E. R., and P. J. Krusic, 2004: The North American Drought Atlas. Lamont-Doherty Earth Observatory and the National Science Foundation,. http://iridl.ldeo.columbia.edu/SOURCES/.LDEO/.TRL/.NADA2004/.pdsi-‐atlas.html (Accessed November 8, 2011).
Cook, E. R., and et al., 2008: North American Summer PDSI Reconstructions, Version 2a. IGBP PAGES/World Data Center for Paleoclimatology Data Contribution Series # 2008-046. NOAA/NGDC Paleoclimatology Program,. http://www.ncdc.noaa.gov/paleo/pdsi.html (Accessed November 11, 2011).
Cook, E. R., D. M. Meko, D. W. Stahle, and M. K. Cleaveland, 1999: Drought reconstructions for the continental United States. Journal of Climate, 12, 1145–1162.
Eastern OLDLIST, Eastern OLDLIST: a database of maximum tree ages for eastern North America. 2011,. http://www.ldeo.columbia.edu/~adk/oldlisteast/ (Accessed December 1, 2011).
Kalnay, E. and Coauthors, 1996: The NCEP/NCAR 40-‐year reanalysis project. Bulletin of the American Meteorological Society, 77, 437–471.
Maxwell, R. S., A. E. Hessl, E. R. Cook, and N. Pederson, 2011: A multispecies tree ring reconstruction of Potomac River streamflow (950–2001). Water Resources Research, 47, 1–12, doi:10.1029/2010WR010019.
Orwig, D. a, C. V. Cogbill, D. R. Foster, and J. F. O’Keefe, 2001: Variations in old-‐growth structure and definitions: forest dynamics on Wachusett Mountain, Massachusetts. Ecological Applications, 11, 437–452.
Pederson, N., 2010: External Characteristics of Old Trees in the Eastern Deciduous Forest. Natural Areas Journal, 30, 396–407.
Pederson, N., A. W. D’Amato, and D. A. Orwig, 2005: Natural History from Dendrochronology: Maximum Ages and Canopy Persistence of Rarely Studied Hardwood Species. Proceedings of the 15th Central Hardwood Forest Conference, Eds. D.S. Buckley and W.K. Clatterbuck, Asheville, U.S. Department of Agriculture Forest Service Southern Research Station, 695–701.

22
Rodionov, S. N., 2004: A sequential algorithm for testing climate regime shifts. Geophysical Research Letters, 31, 2–5.